Glacier Maps of the Sierra Nevada de Mérida, Venezuela
|
|
|
- Logan Casey
- 7 years ago
- Views:
Transcription
1 Glacier Maps of the Sierra Nevada de Mérida, Venezuela Source Description Map 1 Jahn (1925) Map showing glacier cover, glacier names, summit names, and summit elevations in the Sierra Nevada de Mérida in 1910/1911. Map 2 Blumenthal (1923) Simple sketch map of the Sierra Nevada de Mérida intended as a guide for hiking and mountain climbing. Map 3 Gunther (1940, 1941a) Gunther s map of the Sierra Nevada de Mérida is based on Jahn (1925) and Gunther s own observations in 1939 and Map 4 Gunther (1940) Highly-generalized sketch map of the glaciers in the Pico Bolivar Massif, useful as an orientation map for climbers. Map 5 Busk (1964) Simple sketch map of the Sierra Nevada de Mérida intended as a guide for hiking, climbing, and trout fishing. Map 6 Schubert (1972) Detailed glacial-geomorphic and topographic map of the Pico Bolivar Massif (Schubert, 1972, Fig. 1). Map 7 Schubert (1972) Simple sketch map comparing glacier extent in 1910/1911 and 1972 in the Pico Bolivar Massif (Schubert, 1972, Fig. 5). Map 8 Schubert (1992) Map comparing glacier extent in the Sierra Nevada de Mérida in 1910/1911 and 1952 as determined from aerial photographs. Map 9, 10 Schubert (1998) Schubert s 1998 maps are generalizations of his 1992 map based on aerial photographs from Map 11 Mahaney et al. (2000) Generalized sketch map based on the available national park hiking map for the Sierra Nevada de Mérida. Map 12 Mahaney et al. (2009) Annotated 1952 aerial photograph map of the Pico Humboldt/Pico Bonpland Massif. Map 13 Mahaney et al. (2009) Sketch map of the Pico Humboldt foreland. The glacier margin was presumably estimated from the 1952 aerial photographs. Map 14 National Park Map (1:50,000) Map of the Sierra Nevada de Mérida and surrounding area showing hiking trails and generalized topography. Map 15 Topographic Map NC Official topographic map NC Merida (1:250,000, contour interval 40 m) produced in Map 16 Topographic Map HOJA 5941 Official topographic map HOJA 5941 (1:100,000, contour interval 40 m) produced in Map 17 Topographic Map HOJA 6041 Official topographic map HOJA 6041 (1:100,000, contour interval 40 m) produced in mapcompilation Page 1
 Highly-generalized sketch map of the glaciers in the Pico Bolivar Massif, useful as an orientation map for climbers.")
2 Map 1 (Jahn, 1925) Microfilm scan of Jahn s original map depicting glacier cover in the Sierra Nevada de Mérida (Jahn, 1925) in 1910/1911 (scale 1:100,000). This remained effectively the only map showing approximate glacier extents in Venezuela until the mapping efforts by Schubert (1972, 1992, 1998). Alfredo Jahn (1867 to 1940) was a civil engineer, surveyor, botanist, geographer, avid mountaineer, and prolific map maker (for example Lake Valencia, cf. Crist and and Chardon, 1941, their Fig. 2) and recorded the first ascent of Pico Humboldt on 16 January 1911 via the Sievers Glacier. Jahn also conducted some of the first official elevation determinations in the Sierra Nevada de Mérida (e.g. Jahn, 1907) and was responsible for lake level measurements in Lake Valencia between 1905 and 1938 (Crist and Chardon, 1941; Gschwendtner, 1963). Blumenthal (1923, Page 221) considered this map the baptism of the Sierra Nevada de Mérida as it provided, for the first time, the names and elevations of the mountains. It is important to note that the names used for most glaciers and certain lakes in the Sierra Nevada de Mérida are somewhat inconsistent and have changed over time, making it sometimes difficult to compare the work from different authors (cf. Federici and Pappalardo, 2010). mapcompilation Page 2
 and recorded the first ascent of Pico Humboldt on 16 January 1911 via the Sievers Glacier. Jahn also conducted some of the first official elevation determinations in the Sierra Nevada de Mérida (e.")
3 Jahn (1925) mapped the entire Pico Espejo summit and ridge area as covered by the Espejo Glacier that extended westward into the Laguna Espejo valley/cirque to an elevation of about 4,500 m asl (Schubert, 1992). This matches approximately the glacier extent depicted in the Goering painting created between 1864 and 1874 (cf. Schubert, 1984, Fig. 4). Jahn named many of the glaciers in the Sierra Nevada de Mérida in honor of previous explorers (Schubert, 1992). Schubert (1972, 1992, 1998), unfortunately, re-named many of the glaciers in the Sierra Nevada de Mérida using the local geographic names of the valleys they occupied during the Last Glacial Maximum, creating some confusion and inconsistencies in the literature. Schubert (1972) separated what Jahn mapped as the Burgoin Glacier into the West and North Glacier to designate their approximate aspects. The West Glacier faces more-or-less due west and would extend into the Laguna Espejo cirque. The North Glacier faces northwest and would extend into an adjacent cirque and valley. Schubert (1992, 1998) reintroduced the new Espejo Glacier, matching approximately Jahn s Burgoin Glacier and Schubert s own West and North Glacier (Schubert, 1972). mapcompilation Page 3
, unfortunately, re-named many of the glaciers in the Sierra Nevada de Mérida using the local geographic names of the valleys they occupied during the Last Glacial Maximum,")
4 Map 2: Blumenthal (1923) mapcompilation Page 4
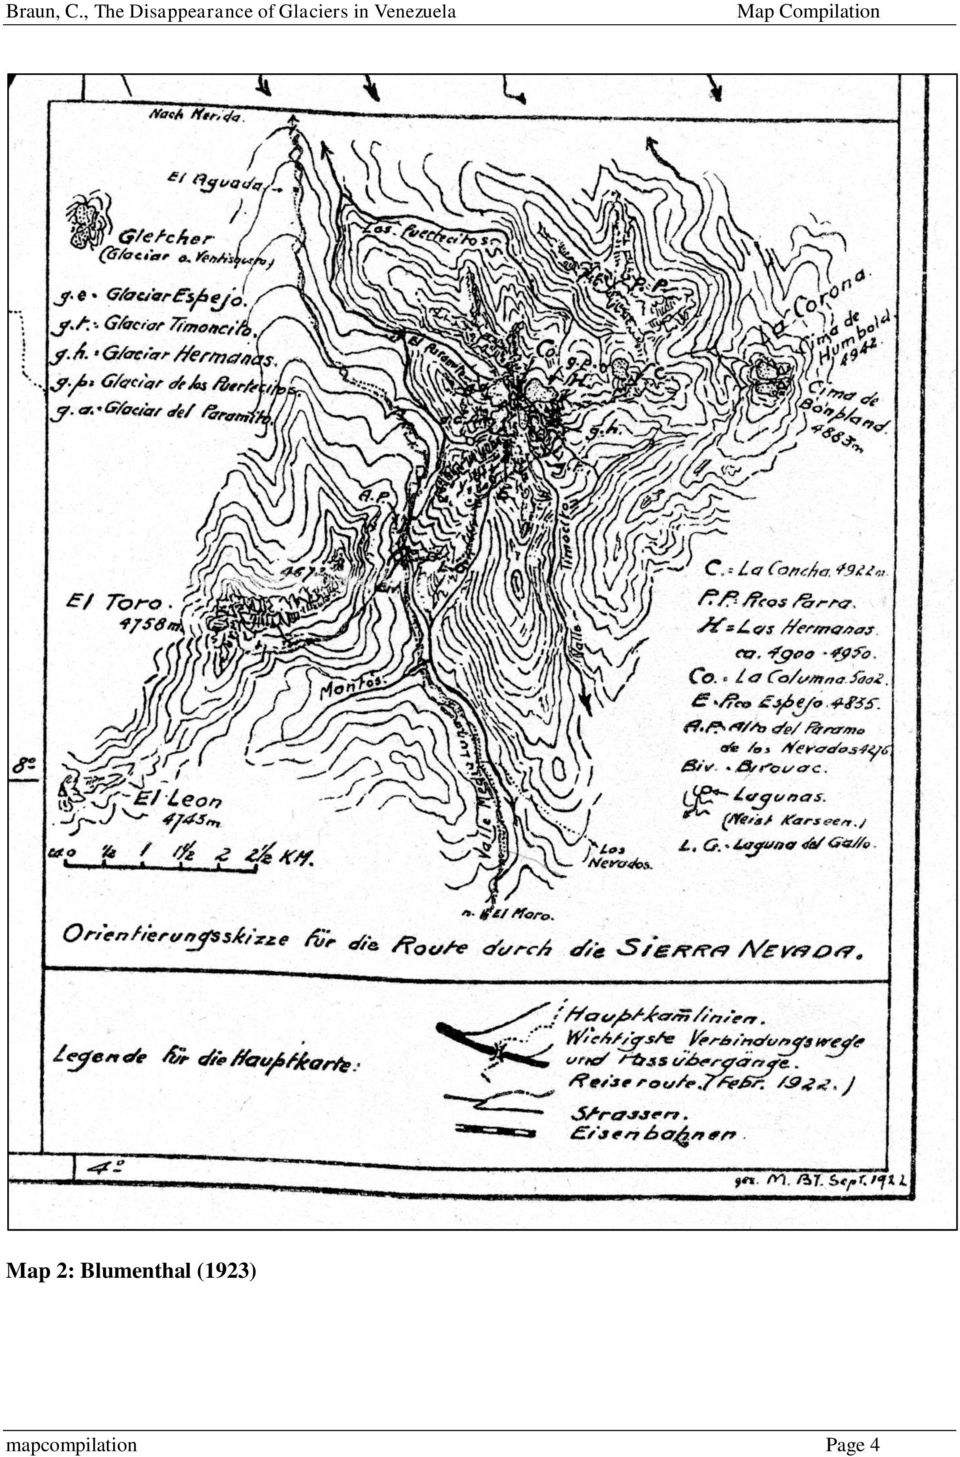
5 Blumenthal (1923) included this simple sketch map of the Sierra Nevada de Mérida based on his travels in The map was clearly not intended to accurately depict the shapes of glacier, but rather to serve as a guide for hiking and climbing. This map was deemed highly inaccurate by Gunther (1940). Blumenthal was engaged in geologic mapping for petroleum exploration and thus presumably a competent cartographer. Some of the perceived inaccuracies may therefore reflect glacier recession between Blumenthal s visit in 1922 and Gunther s expeditions in 1939 and mapcompilation Page 5

6 Map 3 (Gunther, 1940, 1941a) mapcompilation Page 6

7 Gunther s map (Gunther, 1940, 1941a) depicts glacier extent in the Sierra Nevada de Mérida after Jahn (1925) and supplemented by Gunther s own observations and measurements during two climbing expeditions in 1939 and 1940 (Gunther 1940, 1941a, b). Gunther used the same glacier names as Jahn (1925) and it is interesting to compare both maps. Gunther mapped the Espejo Glacier considerably smaller than Jahn as essentially limited to the western side of the Pico Espejo summit ridge area (cf. Map 1) and not extending too far towards Laguna Espejo. This subtle difference is consistent with the well-documented asymmetry in glacier cover and glacier recession in the early part of the 20 th century in the Sierra Nevada de Mérida (cf. Sievers, 1908; Blumenthal, 1923; Schubert, 1992). The map also shows how the names used for certain lakes have changed: Laguna Verde Laguna El Suero Laguna Verde as mapped and described by Jahn (1925), Gunther (1940, 1941a, b), and Hanbury- Tracy (1944) is today called Laguna El Suero. However, the name Laguna Verde may have been quite reasonable at the time when the Laguna Verde Glacier (today: Humboldt Glacier) extended much closer towards the lake and glacial meltwater/sediment inflow may have caused the lake to exhibit a greenish color. Laguna Negra Laguna Verde Laguna Negra as mapped and described by Jahn (1925), Gunther (1940, 1941a, b), and Hanbury- Tracy (1944) is today called Laguna Verde, although the old name Laguna Negra seems more appropriate today as the lake is large, deep, and appears black. The old name Laguna Negra indicates or perhaps even emphasizes that the lake was not greenish in color (in contrast to Laguna Verde upstream). This may suggest that the lobe of the Humboldt Glacier descending towards the lake at the time did not cause sufficient glacial meltwater/sediment input to yield a greenish color. mapcompilation Page 7
 and not extending too far towards Laguna Espejo.")
8 Map 4 (Gunther, 1940) Highly-generalized close-up map of the glaciers located in the Pico Bolivar Massif based on Gunther s observations during a climbing expedition in February 1939 (Gunther, 1940). The sketch map is clearly not intended for glacier area determinations, but is very useful as an orientation map for climbers and hikers. The glacier names correspond to Jahn (1925) and Gunther (1941a). mapcompilation Page 8
 and Gunther (1941a).")
9 Map 5 (Busk, 1964) Busk (1964) prepared this map of the Sierra Nevada de Mérida based on earlier maps by Jahn (1925), Gunther (1940, 1941a), other unpublished maps, personal observations, and conversations with local people. This map was obviously not designed to accurately depict contemporary glacier cover, but rather to serve as an orientation map for hikers, mountain climbers, and trout fishing. Sir Douglas Busk was the British Ambassador to Venezuela in the early 1960s and completed a rare winter weekend ascent of Pico Bolivar with Eric Shipton in 1963 (Band and Peck, 1991). mapcompilation Page 9

 Glacial-geomorphic and topographic map of the Pico Bolivar Massif prepared by")
10 Map 6.1 (Schubert, 1972) Glacial-geomorphic and topographic map of the Pico Bolivar Massif prepared by Schubert (1972, Fig. 1). Map 6.2 is a close-up of the glaciers around Pico Bolivar. mapcompilation Page 10
.")

11 Map 6.2 (Schubert, 1972) Glacial-geomorphic and topographic map of the Pico Bolivar summit and surrounding area prepared by Schubert (1972, Fig. 1). With this map Schubert introduced three new glacier names: West Glacier, North Glacier, and East Glacier. The Espejo Glacier as mapped by Jahn and Gunther obviously did not exist anymore in 1972 when Schubert was mapping around Pico Bolivar. Schubert separated what Jahn and Gunther mapped as the Bourgoin Glacier into the West and North Glacier to designate their approximate orientation. The West Glacier faces westward and would extend into the Laguna Espejo valley/cirque. The North Glacier faces northwest and would extend into the adjacent cirque and valley. The East Glacier was previously mapped as Karsten Glacier by Jahn and Gunther. The name Las Hermanas Glacier used on this map is also confusing. Schubert (1972) used it for the small eastern lobe of the Timoncito Glacier. Jahn, Blumenthal, and Gunther, however, mapped the Hermanas Glacier as a small separate and glacier from the Timoncito Glacier located a few km further to the east (cf. Map 4). However, these new names used by Schubert (1972) were revised again by Schubert (1992, 1998) when he introduced a series of new names for many of the glaciers in the Sierra Nevada de Mérida. mapcompilation Page 11

12 Map 7 (Schubert, 1972, Fig. 5) Schubert s 1972 map compared glacier cover in the Pico Bolivar / Pico La Concha Massifs between 1910 and This map is obviously too generalized for quantitative analysis, but allows useful qualitative comparisons: Pico El Toro was glacier-covered in 1910, but not anymore in This is consistent with other evidence (e.g. Blumenthal, 1923; Schubert, 1992). In 1868 reports indicated an ice thickness of between 8 and 16 m on the flanks of Pico El Toro. By 1890 deglaciation was on the way and rock patches were emerging from below the ice. By 1915 only a small remnant remained and by 1931 Pico El Toro was ice-free (after Schubert, 1992, Page 60). The Garza Glacier on the western side of Pico La Concha apparently still existed in 1972, whereas the Mucuy Glacier on the eastern side had already disappeared. Both glaciers existed in 1952 (Schubert, 1992, 1998). This makes sense in terms of their relative orientation and size. The Garza Glacier was larger than the Mucuy Glacier in 1910/11 (Jahn, 1925, Gunther, 1940, 1941a) and was located on the western side, protected from solar radiation by the diurnal cycle in cloud cover (cf. Flohn, 1968). The Garza Glacier had disappeared by 1991 (Schubert, 1998). The basic configuration of the four glaciers around Pico Bolivar in February 1972 was the same as on Schubert s detailed 1952 aerial photograph map (Schubert, 1992). mapcompilation Page 12
.")
13 Map 8 (Schubert, 1992) Glacier distribution in the Sierra Nevada de Mérida in 1910/1911 (after Jahn, 1925) and in 1952 as mapped by Schubert (1992) from aerial photographs. Glacier-covered area in 1910 was about 10 km 2 and about 2.91 km 2 in 1952 (Schubert, 1992, 1998). The table below lists glacier names and area for individual glaciers (after Schubert, 1992, Table 1). Massif Schubert (1992) Jahn (1925) Area (km 2 ) Pico Bolivar 1) Espejo Glacier Espejo Glacier ) Timoncito Glacier Timoncito/Hermanas Glacier ) El Encierro Glacier Bourgoin Glacier ) El Encierro Glacier Karsten Glacier 0.10 Pico La Concha 1) Ño León Glacier Garza Glacier ) Coromoto Glacier W-Remnant Mucuy Glacier 0.07 Pico Humboldt Pico Bonpland (1, 2) Coromoto Glacier E-Remnant 3) Siniguis Glacier Sievers Glacier 4) Nuestra Señora Glacier Plazuela Glacier Laguna Verde Glacier Codazzi Glacier 2.03 mapcompilation Page 13
 El Encierro Glacier Karsten Glacier 0.10 Pico La Concha 1) Ño León Glacier Garza Glacier 0.10 2) Coromoto Glacier W-Remnant Mucuy Glacier 0.")
14 Note that the summit of Pico Bonpland is marked incorrectly on this map. The actual summit location is about 1.5 km further to the southwest on the ridge extending northwest towards Pico La Concha (i.e. separating Glacier #3 and #4). Unfortunately, Schubert (1992) decided to rename and redefine many of the glaciers in the Sierra Nevada de Mérida from the original names used by Jahn (1925) and Gunther (1940, 1941a). In addition, Schubert s map and associated table contain several errors and inconsistencies. First, Schubert s new Espejo Glacier is not what Jahn and Gunther had mapped as the original Espejo Glacier, but rather what they mapped as the Bourgoin and Espejo Glacier. Second, Glacier #3 was mapped by Jahn and Gunther as the Karsten Glacier, not as the Bourgoin Glacier. Finally, Glacier #4 was mapped in combination with Glacier #3 by Jahn and Gunther as the Karsten Glacier (western and eastern section). Pico Bolivar Massif Schubert (1992) reintroduced the new Espejo Glacier matching approximately what Jahn and Gunther mapped as the Bourgoin and Espejo Glacier and what Schubert (1972) mapped as the West and North Glacier (Schubert, 1972). The original Espejo Glacier covering the Pico Espejo summit and ridge area had disappeared by The remnants of the new Espejo Glacier or old North Glacier are today still visible from downtown Mérida as two small ice/firn patches. Jahn (1925) and Schubert (1972) distinguished between the Timoncito Glacier and its easterly neighbor the Hermanas Glacier, whereas Schubert (1992) combined them. The original Hermanas Glacier (cf. Map 4) as mapped by Jahn, Blumenthal, and Gunther had more-or-less disappeared by 1952 and Schubert (1972) introduced the name Las Hermanas Glacier for what was essentially the smaller eastern lobe of the Timoncito Glacier. Schubert (1992) changed the name of the western section of the Karsten Glacier to El Encierro Glacier in reference to Laguna Del Encierro and associated stream. Schubert (1992) introduced the name El Encierro Glacier for the small glacier east of the (other) El Encierro Glacier. In the past, the El Encierro Glacier was mapped as the Karsten Glacier and consisted of a western section on the north side of Col Bourgoin and a smaller eastern section (mapped but unnamed on the map by Schubert, 1972) below and east of La Columna South Peak towards Pico La Concha. Pico La Concha Massif Schubert (1992) introduced the name Ño León Glacier for what Jahn and Gunther mapped as the Garza Glacier. Schubert (1992) introduced the name Coromoto Glacier W-Remnant for what Jahn and Gunther mapped as the Mucuy Glacier. Pico Humboldt and Pico Bonpland Massif Schubert (1992) introduced the name Siniguis Glacier for what Jahn and Gunther mapped as the Sievers Glacier on the southeastern side of Pico Humboldt (= the route Jahn used for his first ascent of Pico Humboldt on 16 January 1911). Schubert (1992) introduced the name Coromoto Glacier E-Remnant to combine what Jahn mapped separately as the Laguna Verde Glacier and Codazzi Glacier. The name Laguna Verde Glacier makes sense as it extends towards Laguna Verde, which is today called Laguna El Suero. Gunther, on the other hand, did not explicitly label the Laguna Verde Glacier on his map but used the name Humboldt Glacier in his papers for what Jahn mapped as the Laguna Verde Glacier. The Humboldt Glacier today is the remnant of the Laguna Verde Glacier as mapped by Jahn or the Humboldt Glacier as described by Gunther and Hanbury-Tracy. Schubert (1992) introduced the name Nuestra Señora Glacier for the glacier mapped by Jahn and Gunther as Plazuela Glacier on the southwestern side of Pico Bonpland. mapcompilation Page 14

15 Map 9 (Schubert, 1998) Schubert s 1998 map is a reproduction and generalization of his more detailed map from The accompanying table list glacier names, glacier area (in 1952), and glacier appearance in January 1991 for individual glaciers (cf. Map 10). mapcompilation Page 15

16 Map 10 (Schubert, 1998) This map included in Schubert (1998) depicts the distribution of glaciers in the Sierra Nevada de Mérida in 1952 based on aerial photographs. The accompanying table further lists glacier names, glacier area (in 1952), and subjective glacier appearance in January 1991 based on fieldwork and ground photographs. In the case of the Coromoto Glacier East Remnant, Schubert used a Landsat 2 satellite image from 29 January Unfortunately, Schubert changed the glacier numbering system with respect to his 1992 map (Schubert, 1992). In addition, many glacier names have changed over the last 100 years (cf. Map 8) and there are some inconsistencies in the literature regarding the precise spatial meaning of some glacier names. Note that the summit of Pico Bonpland is again marked incorrectly on this map. The actual summit location is about 1.5 km further to the southwest on the ridge extending towards Pico La Concha (i.e. separating Glacier #9 and #10). Glacier Appearance in January 1991 (after Schubert, 1998, Table 1) Glacier Name Appearance in 1991 Espejo Gl. (1) Melted into 2 small firn patches Timoncito Gl. (2) Almost completely disappeared El Encierro Gl. (3) Lost at least 50 percent of its area El Encierro Gl. (4) Retreated Ño León Gl. (5) Completely disappeared Coromoto Gl. West Remnant (6) Completely disappeared Coromoto Gl. East Remnant (7, 8) Retreated Siniguis Gl. (9) Retreated Nuestra Señora Gl. (10) Completely disappeared mapcompilation Page 16
. In addition, many glacier names have changed over the last 100 years (cf.")
17 The two small ice/firn patches remnants of the new Espejo Glacier (Schubert, 1992) or the old North Glacier as mapped by Schubert (1972) are still visible from the cable car line and downtown Mérida, but not from the summit of Pico Espejo. The two El Encierro Glaciers mapped by Schubert (1992, 1998) used to be known as the Karsten Glacier (western and eastern section) as mapped by Jahn and Gunther. The two glaciers in the Pico La Concha Massif existed in 1952 and had both disappeared by Glacier #5 still existed in 1972 (Schubert, 1972). See comments for Map 8 in reference to the glaciers in the Pico Humboldt/Pico Bonpland Massif. mapcompilation Page 17
.")
18 Map 11 (Mahaney et al., 2000) The glacier outlines and glacier names shown here are based on a map for the Parque Nacional Sierra Nevada Sector Sierra Nevada De Merida Mapa Para Excursionistas (see Map 14). This map included three new glacier names: Glacier Este is used here for what Jahn and Gunther mapped as the Codazzi Glacier and Schubert mapped as the Coromoto Glacier East Remnant. Glacier de La Corona is used here for what is called today the Humboldt Glacier, Jahn mapped as the Laguna Verde Glacier, Gunther described as the Humboldt Glacier, and Schubert mapped as the Coromoto Glacier East Remnant. The name Glacier de La Corona is reasonable as the Pico Humoldt/Pico Bonpland Massif used to be known as the Corona Group (e.g. Blumenthal, 1923; Jahn, 1925; Gunther, 1940, 1941a, b). Glacier La Concha is used here for what Jahn and Gunther mapped as the Garza Glacier and Schubert mapped as the Ño León Glacier. Glacier extent and shape shown on this map are grossly inaccurate. mapcompilation Page 18

19 Map 12 (Mahaney et al., 2009) Annotated 1952 aerial photograph map of the Pico Humboldt/Pico Bonpland Massif. B = Bonpland Lobe C = Center Lobe N = Northern Lobe (= Codazzi Glacier after Jahn and Gunther) Today (2009/2011) the Northern Lobe (or Codazzi Glacier) has disappeared. The Center and Bonpland Lobe (of the Humboldt Glacier) have receded considerably. mapcompilation Page 19
 the Northern Lobe (or Codazzi Glacier) has disappeared.")
20 Map 13 (Mahaney et al., 2009) Mahaney et al. (2009) included this simple sketch map of the Pico Humboldt foreland. The glacier extent shown here was presumably approximated from the 1952 aerial photographs (see Map 12). mapcompilation Page 20

21 Map 14 Section of the map Parque Nacional Sierra Nevada Sector Sierra Nevada De Merida Mapa Para Excursionistas (1:50,000). Glacier extent and shape shown on this map are grossly inaccurate. mapcompilation Page 21
22 Map 15 Section of topographic map NC Merida (1:250,000, contour interval 40 m) produced in 1978 based on 1:100,000 scale topographic maps from 1964 and Glacier extent and shape shown on this map are grossly inaccurate. mapcompilation Page 22
23 Map 16 Section of topographic map HOJA 5941 (1:100,000, contour interval 40 m) produced in 1977 based on aerial photography acquired between 1960 and Glacier extent and shape shown on this map are grossly inaccurate. mapcompilation Page 23
24 Map 17 Section of topographic map HOJA 6041 (1:100,000, contour interval 40 m) produced in 1977 based on aerial photography acquired in Glacier extent and shape shown on this map are grossly inaccurate. mapcompilation Page 24
The Basics of Navigation
 The Basics of Navigation Knowledge of map reading and the use of the compass is an indispensable skill of bushcraft. Without this skill, a walker is a passenger and mere follower on a trip. To become a
How Did These Ocean Features and Continental Margins Form?
 298 10.14 INVESTIGATION How Did These Ocean Features and Continental Margins Form? The terrain below contains various features on the seafloor, as well as parts of three continents. Some general observations
EcoInformatics International Inc.
 1 von 10 03.08.2010 14:25 EcoInformatics International Inc. Home Services - solutions Projects Concepts Tools Links Contact EXPLORING BEAVER HABITAT AND DISTRIBUTION WITH GOOGLE EARTH: THE LONGEST BEAVER
Post Route Maps of. Dallas/Ft Worth/North Texas 1874 1939. By Mike Ludeman mike@ludeman.net
 Post Route Maps of Dallas/Ft Worth/North Texas 1874 1939 By Mike Ludeman mike@ludeman.net Monograph TX-02 Nov. 2011 Post Route Maps of Dallas/Ft Worth/North Texas 1874 1939 By Mike Ludeman mike@ludeman.net
 Benchmark Identify physical & human characteristics of places, regions in North America. Grade Level Indicator Describe, compare landforms, climates, population, vegetation, economic characteristics of
Focus On You Photography TRT from Brockway Summit to Watson Lake
 Tahoe Rim Trail (TRT) From Hwy 267 (Brockway Summit) west to Watson Lake (Strong Intermediate Advanced) This trail is very demanding. It is almost 2100 ft. of climbing. The trail is up and down, up and
DATA VISUALIZATION GABRIEL PARODI STUDY MATERIAL: PRINCIPLES OF GEOGRAPHIC INFORMATION SYSTEMS AN INTRODUCTORY TEXTBOOK CHAPTER 7
 DATA VISUALIZATION GABRIEL PARODI STUDY MATERIAL: PRINCIPLES OF GEOGRAPHIC INFORMATION SYSTEMS AN INTRODUCTORY TEXTBOOK CHAPTER 7 Contents GIS and maps The visualization process Visualization and strategies
Climate, Vegetation, and Landforms
 Climate, Vegetation, and Landforms Definitions Climate is the average weather of a place over many years Geographers discuss five broad types of climates Moderate, dry, tropical, continental, polar Vegetation:
SITE RECOMMENDED FOR INCLUSION IN THE LIST OF HISTORICAL SITES AND MONUMENTS IN ANTARCTICA
 SITE RECOMMENDED FOR INCLUSION IN THE LIST OF HISTORICAL SITES AND MONUMENTS IN ANTARCTICA Introduction This paper was introduced during the XXVI ATCM at Madrid. As per the Report of the Committee for
Warning! Some of the excursions require an adequate preparation, equipment and/or an expert guide because they re dangerous!
 Cable cars The nearest cable cars are located in S. Vigilio 18 km from the Fanes hut. They are connected to the Plan de Corones skiing resort outside the Fanes - Senes - Braies Natural Park. Alpine Skiing
MAPPING THE PREHISTORIC STATUE ROADS ON RAPA NUI USING REMOTE SENSING SATELLITE IMAGERY
 MAPPING THE PREHISTORIC STATUE ROADS ON RAPA NUI USING REMOTE SENSING SATELLITE IMAGERY Gabe Wofford Global Environmental Science University of Hawai i at Manoa ABSTRACT In an extension of the work of
Map Patterns and Finding the Strike and Dip from a Mapped Outcrop of a Planar Surface
 Map Patterns and Finding the Strike and Dip from a Mapped Outcrop of a Planar Surface Topographic maps represent the complex curves of earth s surface with contour lines that represent the intersection
5. GIS, Cartography and Visualization of Glacier Terrain
 5. GIS, Cartography and Visualization of Glacier Terrain 5.1. Garhwal Himalayan Glaciers 5.1.1. Introduction GIS is the computer system for capturing, storing, analyzing and visualization of spatial and
Description of Simandou Archaeological Potential Model. 13A.1 Overview
 13A Description of Simandou Archaeological Potential Model 13A.1 Overview The most accurate and reliable way of establishing archaeological baseline conditions in an area is by conventional methods of
STATE OF NEVADA Department of Administration Division of Human Resource Management CLASS SPECIFICATION
 STATE OF NEVADA Department of Administration Division of Human Resource Management CLASS SPECIFICATION TITLE PHOTOGRAMMETRIST/CARTOGRAPHER V 39 6.102 PHOTOGRAMMETRIST/CARTOGRAPHER II 33 6.110 PHOTOGRAMMETRIST/CARTOGRAPHER
Topographic Maps Practice Questions and Answers Revised October 2007
 Topographic Maps Practice Questions and Answers Revised October 2007 1. In the illustration shown below what navigational features are represented by A, B, and C? Note that A is a critical city in defining
Chapter 5 Topographic Maps Bengt Rystedt, Sweden
 Chapter 5 Topographic Maps Bengt Rystedt, Sweden 5.1 Introduction A topographic map describes a place (topos is Greek for place). For a long time, they have been used for military purposes but are now
STRIKING VARIETY OF THE MOUNTAIN CHAINS APPEARANCE ON SATELLITE IMAGES PROVIDED BY GOOGLE EARTH
 STRIKING VARIETY OF THE MOUNTAIN CHAINS APPEARANCE ON SATELLITE IMAGES PROVIDED BY GOOGLE EARTH Jacek Drachal Instytut Geodezji i Kartografii, ul. Modzelewskiego 27, 02-679 Warszawa, Poland, jacek@igik.edu.pl
Laboratory 6: Topographic Maps
 Name: Laboratory 6: Topographic Maps Part 1: Construct a topographic map of the Egyptian Pyramid of Khafre A topographic map is a two-dimensional representation of a three-dimensional space. Topographic
The Enchanted Mountains in the Spanish Pyrenees. June 13-23, 2016. Level of Difficulty: Strenuous. Cost: $1650. Roman Laba, Trip Leader
 The Enchanted Mountains in the Spanish Pyrenees June 13-23, 2016 Level of Difficulty: Strenuous Cost: $1650 Roman Laba, Trip Leader TRIP IS NOW FULL. The Enchanted Mountains are one of the finest mountain
Benton MacKaye Trail - Section 2. Three Forks (FS 58) to GA. Highway 60. 11.4 miles
 to GA. Highway 60. 11.4 miles") General Benton MacKaye Trail - Section 2 Three Forks (FS 58) to GA. Highway 60 11.4 miles This is the longest and most remote section of the Benton MacKaye Trail (BMT) east of GA 5. It follows the Appalachian
General Benton MacKaye Trail - Section 2 Three Forks (FS 58) to GA. Highway 60 11.4 miles This is the longest and most remote section of the Benton MacKaye Trail (BMT) east of GA 5. It follows the Appalachian
GM IFMGA 2013 in Huaraz Peru
 (AGMP) GM IFMGA 2013 in Huaraz Peru SUGGESTIONS FOR OPTIONAL PROGRAM IN THE REGION OF ANCASH PRIOR TO GENERAL MEETING (4 OR 6 DAYS) Two programs for the time between 9 th and 14 th October 2013 Coordinator
LABORATORY TWO GEOLOGIC STRUCTURES
 EARTH AND ENVIRONMENT THROUGH TIME LABORATORY- EES 1005 LABORATORY TWO GEOLOGIC STRUCTURES Introduction Structural geology is the study of the ways in which rocks or sediments are arranged and deformed
An Analysis of Siting Opportunities for Concentrating Solar Power Plants in the Southwestern United States
 An of Siting Opportunities for Concentrating Solar Power Plants in the Southwestern United States Mark S. Mehos National Renewable Energy Laboratory Golden, Colorado Phone: 303-384-7458 Email: mark_mehos@nrel.gov
Topographic Survey. Topographic Survey. Topographic Survey. Topographic Survey. CIVL 1101 Surveying - Introduction to Topographic Modeling 1/8
 IVL 1 Surveying - Introduction to Topographic Modeling 1/8 Introduction Topography - defined as the shape or configuration or relief or three dimensional quality of a surface Topography maps are very useful
Plate Tectonics. Hi, I am Zed and I am going to take you on a trip learning about Plate Tectonics. And I am Buddy Zed s mascot
 Plate Tectonics Hi, I am Zed and I am going to take you on a trip learning about Plate Tectonics And I am Buddy Zed s mascot Continental Drift Alfred Wegener proposed that continents were not always where
Church Name. Church street address (for UPS delivery): City/State/Zip. Church Telephone: ( ) Church Fax: ( ) Full or Part time?
: City/State/Zip. Church Telephone: ( ) Church Fax: ( ) Full or Part time?") (Rev 6-14) The following information is needed to prepare for the planning process for your church. Please be as thorough as possible in completing this information. Feel free to add pages and make additional
(Rev 6-14) The following information is needed to prepare for the planning process for your church. Please be as thorough as possible in completing this information. Feel free to add pages and make additional
ILLUMINATED CHOROPLETH MAPS
 CO-144 ILLUMINATED CHOROPLETH MAPS KENNELLY P. Long Island University, BROOKVILLE, UNITED STATES ABSTRACT Choropleth maps are commonly used to show statistical variation among map enumerations such as
Part 1 RECENT STATISTICS AND TREND ANALYSIS OF ILLICIT DRUG MARKETS A. EXTENT OF ILLICIT DRUG USE AND HEALTH CONSEQUENCES
 References to Chile Part 1 RECENT STATISTICS AND TREND ANALYSIS OF ILLICIT DRUG MARKETS A. EXTENT OF ILLICIT DRUG USE AND HEALTH CONSEQUENCES El panorama mundial Cocaína In 2010, the regions with a high
Digital Cadastral Maps in Land Information Systems
 LIBER QUARTERLY, ISSN 1435-5205 LIBER 1999. All rights reserved K.G. Saur, Munich. Printed in Germany Digital Cadastral Maps in Land Information Systems by PIOTR CICHOCINSKI ABSTRACT This paper presents
THREE-DIMENSIONAL MOUNTAIN MAP
 THREE-DIMENSIONAL MOUNTAIN MAP M.Sc.Dusan Petrovic Geodetic Institute of Slovenia Jamova 2 1000 Ljubljana Slovenia fax: +386 1 425 06 77 email: dusan.petrovic@geod-is.si ABSTRACT Development of computer
! Mera Peak Ski Expedition Nepal
 ! Mera Peak Ski Expedition Nepal October 17-November 6, 2016 $9,950 October 16-November 5, 2017 land costs (including internal heli and plane flights) Difficulty Level: Introductory Ski No technical climbing
World Tower. Company, Inc. Classification Overview. Categories: Structure Classification Exposure Categories Topographic Effects Geological
 Manufacturing Custom Fabricated Structures since 1979 Professional In-House Design Staff Tower Delivery Service World Tower Company, Inc. Classification Overview Categories: Structure Classification Exposure
Deserts, Wind Erosion and Deposition
 Deserts, Wind Erosion and Deposition By definition, a desert has less than 10 in (25 cm) of precipitation per year. Deserts occur at 30 o and 60 o in regions of descending air. Deserts can be hot or cold.
Igneous rocks formed when hot molten material (magma) cools and hardens (crystallizes).
 cools and hardens (crystallizes).") Objectives You will learn about how the land of North Dakota was formed. Introduction North Dakota is a wonderful place to live. Have you ever though about how it was formed? To answer that question, you
Objectives You will learn about how the land of North Dakota was formed. Introduction North Dakota is a wonderful place to live. Have you ever though about how it was formed? To answer that question, you
Orbital-Scale Climate Change
 Orbital-Scale Climate Change Climate Needed for Ice Age Warm winter and non-frozen oceans so lots of evaporation and snowfall Cool summer so that ice does not melt Ice Age Model When ice growing ocean
The Ice Age By: Sue Peterson
 www.k5learning.com Objective sight words (pulses, intermittent, isotopes, chronicle, methane, tectonic plates, volcanism, configurations, land-locked, erratic); concepts (geological evidence and specific
Chapter 4: Representation of relief
 Introduction To this point in our discussion of maps we have been concerned only with their planimetric properties, those relating to the location of features in two-dimensional space. But of course we
Weekend Cabin Retreat Project Site Plans
 Weekend Cabin Retreat Project Site Plans Sacramento City College EDT 300/ENGR 306 EDT 300/ENGR 306 - Site Plans 1 Cabin Project Site Plan/Bubble Diagram - Assignment 1 =10-0 Floor Plan - Assignment 1/4
UNIVERSITY GEOLOGY DAYTON. and ENVIRONMENTAL GEOLOGY
 UNIVERSITY OF DAYTON GEOLOGY and ENVIRONMENTAL GEOLOGY Meet the Geology Department... 10 Full-time Faculty & Staff 5 Part-time Faculty The Department of Geology at the University of Dayton seeks to prepare
WILLOCHRA BASIN GROUNDWATER STATUS REPORT 2009-10
 WILLOCHRA BASIN GROUNDWATER STATUS REPORT 2009-10 SUMMARY 2009-10 The Willochra Basin is situated in the southern Flinders Ranges in the Mid-North of South Australia, approximately 50 km east of Port Augusta
Send all inquiries to: Glencoe/McGraw-Hill 8787 Orion Place Columbus, Ohio 43240-4027 ISBN 0-07-824996-1. Printed in the United States of America
 Copyright by The McGraw-Hill Companies, Inc. All rights reserved. Permission is granted to reproduce the material contained herein on the condition that such material be reproduced only for classroom use;
5. URBAN AND SOCIOECONOMIC CHARACTERISTICS OF CHICAGO AND BARCELONA
 5. URBAN AND SOCIOECONOMIC CHARACTERISTICS OF CHICAGO AND BARCELONA The first step to understand and analyze a city s public transportation needs is to study its social, historical, and economical characteristics.
Kerlingarfjöll. A unique Icelandic highland resort
 Kerlingarfjöll A unique Icelandic highland resort Main poiners Location & Surroundings Nature and Geology The resort Facilites Highland Centre Kerlingarfjöll a place of its own How to get there Roadmap
MONITORING OF A MELTING ICE PATCH FROM GEOMATIC TECHNIQUES: THE JOU NEGRO
 MONITORING OF A MELTING ICE PATCH FROM GEOMATIC TECHNIQUES: THE JOU NEGRO Abstract Introduction Alan D.J. Atkinson atkinson@unex.es José Juan de Sanjosé Blasco jjblasco@unex.es Departamento de Expresión
Maps A Primer for Content & Production of Topographic Base Maps For Design Presented by SurvBase, LLC
 Maps A Primer for Content & Production of Topographic Base Maps For Design Presented by Definition and Purpose of, Map: a representation of the whole or a part of an area. Maps serve a wide range of purposes.
Planning Your Trip to Mount Rainier National Park!
 Planning Your Trip to Mount Rainier National Park! Grade Level: 5 12+ Overview 100 Learner Objectives: Students will: Recognize how to interpret maps and guidebooks Recognize some interesting places to
Stability Assessment of Chamshir Dam Based on DEM, South West Zagros
 2015 2nd International Conference on Geological and Civil Engineering IPCBEE vol. 80 (2015) (2015) IACSIT Press, Singapore DOI: 10.7763/IPCBEE. 2015. V80. 13 Stability Assessment of Chamshir Dam Based
COUNTRY REPORT GEOSPATIAL INFORMATION MANAGEMENT IN NEPAL
 COUNTRY REPORT ON GEOSPATIAL INFORMATION MANAGEMENT IN NEPAL Government of Nepal Ministry of Land Reform and Management SURVEY DEPARTMENT PO Box 9435 Min Bhavan, Kathmandu Nepal Tel : + 977 1 4622713 +
MEMORANDUM. Further discussion regarding the Community s solid waste facility is described further in this memorandum.
 MEMORANDUM File: Sanikiluaq Improvement of the Existing Wastewater Treatment Facility To: Government of Nunavut Department of Community and Government Services Attention: Mr. Grigor Hope,, Project Officer
As we study each type of perspective, we will look both art work and photographs that exhibit each type of perspective.
 Section 7.3 Perspective Have you ever looked at a painting of a pretty scene of the country side and wondered how the artist was able to capture the beauty and essence of the landscape in the picture.
CHAPTER 9 CONCLUSIONS AND RECOMMENDED MITIGATION
 CHAPTER 9 CONCLUSIONS AND RECOMMENDED MITIGATION 9.1 Conclusions Based on the stability cross-sections down the SE flank of Snodgrass Mountain, most landslides on low- to moderate-gradient slopes have
How to Age Golden Eagles
 ADVANCES IN BIRD IDENTIFICATION How to Age Golden Eagles Techniques for Birds Observed in Flight Hawk identification has advanced considerably in recent years. With the arrival of new field guides, new
Margherita Peak, Mt. Stanley, 8 day trek
 RWENZORI TREKKING Margherita Peak, Mt. Stanley, 8 day trek This 8 day itinerary will take you deep into the Rwenzori Mountains to Margherita Peak, the tallest peak on Mt. Stanley and Africa s third highest
Using Google Earth to Explore Plate Tectonics
 Using Google Earth to Explore Plate Tectonics Laurel Goodell, Department of Geosciences, Princeton University, Princeton, NJ 08544 laurel@princeton.edu Inspired by, and borrows from, the GIS-based Exploring
Problems arising from streaming mathematics students in Australian Christian secondary schools: To stream or not to stream?
 Problems arising from streaming mathematics students in Australian Christian secondary schools: To stream or not to stream? TEACH R Peter Kilgour Executive Director, Seventh-day Adventist Schools (Greater
Examples of glaciers in the Austrian Alps Goldbergkees and Kleinfleißkees 1998 2009
 Uncertainties and re analysis of glacier mass balance measurement: Examples of glaciers in the Austrian Alps Goldbergkees and Kleinfleißkees 1998 2009 Wurtenkees 1998 2006 Bernhard Hynek Zentralanstalt
Reflectance Measurements of Materials Used in the Solar Industry. Selecting the Appropriate Accessories for UV/Vis/NIR Measurements.
 T e c h n i c a l N o t e Reflectance Measurements of Materials Used in the Solar Industry UV/Vis/NIR Author: Dr. Jeffrey L. Taylor PerkinElmer, Inc. 710 Bridgeport Avenue Shelton, CT 06484 USA Selecting
GPR detection of karst and archaeological targets below the historical centre of Merida, Yucatán, Mexico
 Studia Universitatis Babeş-Bolyai, Geologia, 2009, 54 (2), 27 31 GPR detection of karst and archaeological targets below the historical centre of Merida, Yucatán, Mexico Luis BARBA 1*, Jorge BLANCAS 1,
Motion & The Global Positioning System (GPS)
") Grade Level: K - 8 Subject: Motion Prep Time: < 10 minutes Duration: 30 minutes Objective: To learn how to analyze GPS data in order to track an object and derive its velocity from positions and times.
Grade Level: K - 8 Subject: Motion Prep Time: < 10 minutes Duration: 30 minutes Objective: To learn how to analyze GPS data in order to track an object and derive its velocity from positions and times.
Project Title: Quantifying Uncertainties of High-Resolution WRF Modeling on Downslope Wind Forecasts in the Las Vegas Valley
 University: Florida Institute of Technology Name of University Researcher Preparing Report: Sen Chiao NWS Office: Las Vegas Name of NWS Researcher Preparing Report: Stanley Czyzyk Type of Project (Partners
Field Techniques Manual: GIS, GPS and Remote Sensing
 Field Techniques Manual: GIS, GPS and Remote Sensing Section A: Introduction Chapter 1: GIS, GPS, Remote Sensing and Fieldwork 1 GIS, GPS, Remote Sensing and Fieldwork The widespread use of computers
ICC Recommendations for Color Measurement
 White Paper #3 Level: Introductory Date: Dec 2004 ICC Recommendations for Color Measurement Introduction In order to prepare a useful device profile based on the International Color Consortium s Specification,
Permafrost monitoring at Mölltaler Glacier and Magnetköpfl
 Permafrost monitoring at Mölltaler Glacier and Magnetköpfl DAVID OTTOWITZ 1, BIRGIT JOCHUM 1, ROBERT SUPPER 1, ALEXANDER RÖMER 1, STEFAN PFEILER 1 and MARKUS KEUSCHNIG 2, 3 1 Department of Geophysics,
Visual Arts Scope and Sequence
 ART PRODUCTION Visual Arts Scope and Sequence LINE Recognize lines and line characteristics in the environment I R R R Identify and explore tools that make lines (pencils, crayons, markers, paint brushes)
Future needs of remote sensing science in Antarctica and the Southern Ocean: A report to support the Horizon Scan activity of COMNAP and SCAR
 Future needs of remote sensing science in Antarctica and the Southern Ocean: A report to support the Horizon Scan activity of COMNAP and SCAR Thomas Wagner (thomas.wagner@nasa.gov) Charles Webb NASA Cryospheric
The Role of SPOT Satellite Images in Mapping Air Pollution Caused by Cement Factories
 The Role of SPOT Satellite Images in Mapping Air Pollution Caused by Cement Factories Dr. Farrag Ali FARRAG Assistant Prof. at Civil Engineering Dept. Faculty of Engineering Assiut University Assiut, Egypt.
CLIMATE, WATER & LIVING PATTERNS THINGS
 CLIMATE, WATER & LIVING PATTERNS NAME THE SIX MAJOR CLIMATE REGIONS DESCRIBE EACH CLIMATE REGION TELL THE FIVE FACTORS THAT AFFECT CLIMATE EXPLAIN HOW THOSE FACTORS AFFECT CLIMATE DESCRIBE HOW CLIMATES
Plan Plus Volume 1 No 1 2002 (117-123)
") Plan Plus Volume 1 No 1 2002 (117-123) APPLICATION OF GIS (GEOGRAPHIC INFORMATION SYSTEM) FOR LANDSLIDE HAZARD ZONATION AND MAPPING DISASTER PRONE AREA: A STUDY OF KULEKHANI WATERSHED, NEPAL Purna Chandra
Plan Plus Volume 1 No 1 2002 (117-123) APPLICATION OF GIS (GEOGRAPHIC INFORMATION SYSTEM) FOR LANDSLIDE HAZARD ZONATION AND MAPPING DISASTER PRONE AREA: A STUDY OF KULEKHANI WATERSHED, NEPAL Purna Chandra
A KNOWLEDGE-BASED APPROACH FOR REDUCING CLOUD AND SHADOW ABSTRACT
 A KNOWLEDGE-BASED APPROACH FOR REDUCING CLOUD AND SHADOW Mingjun Song, Graduate Research Assistant Daniel L. Civco, Director Laboratory for Earth Resources Information Systems Department of Natural Resources
FRED JONES JR. MUSEUM OF ART THE STUART WING AND ADKINS GALLERY ADDITION
 Client: Fred Jones Jr. Museum of Art, The Stuart Wing and Adkins Gallery Completion: October 2011 Scope: Renovation of existing gallery and addition of new galleries - 54,570 SF Cost: $13 Million Awards:
! Everest Base Camp Trek, South Side An Insider s Look at the Khumbu Valley Nepal
 ! Everest Base Camp Trek, South Side An Insider s Look at the Khumbu Valley Nepal October 14-November 2, 2016 October 13-November 1, 2017 $4,200 (land costs) Difficulty Level: Trekking - No technical climbing
The Earth System. The geosphere is the solid Earth that includes the continental and oceanic crust as well as the various layers of Earth s interior.
 The Earth System The atmosphere is the gaseous envelope that surrounds Earth. It consists of a mixture of gases composed primarily of nitrogen, oxygen, carbon dioxide, and water vapor. The atmosphere and
SECOND GRADE 1 WEEK LESSON PLANS AND ACTIVITIES
 SECOND GRADE 1 WEEK LESSON PLANS AND ACTIVITIES UNIVERSE CYCLE OVERVIEW OF SECOND GRADE UNIVERSE WEEK 1. PRE: Discovering stars. LAB: Analyzing the geometric pattern of constellations. POST: Exploring
Geography at GISSV: An Introduction to the Curriculum
 Geography at GISSV: An Introduction to the Curriculum Classes Geography is taught for two hours per week in Grades 5-9. The only exception is in Grade 8, where class is taught for one hour per week for
LEARNING OUTCOMES INTRODUCTION. 80 Points. 80 Points (30 Trip; 50 Questions)
") 59 80 Points LEARNING OUTCOMES 80 Points (30 Trip; 50 Questions) By the end of this exercise you should be able to: Identify the glacial landforms found in Portage County, WI in the field and on topographic
59 80 Points LEARNING OUTCOMES 80 Points (30 Trip; 50 Questions) By the end of this exercise you should be able to: Identify the glacial landforms found in Portage County, WI in the field and on topographic
ESSENTIAL COMPONENTS OF WATER-LEVEL MONITORING PROGRAMS. Selection of Observation Wells
 ESSENTIAL COMPONENTS OF WATER-LEVEL MONITORING PROGRAMS Before discussing the uses and importance of long-term water-level data, it is useful to review essential components of a water-level monitoring
Verification of Summer Thundestorm Forecasts over the Pyrenees
 Verification of Summer Thundestorm Forecasts over the Pyrenees Introduction Météo-France have conducted a study of summer thunderstorm forecasts in the Pyrenees in order to evaluate the performance, the
Investigation of Progression and Distribution of Cryptic Spots in the Richardson Crater
 Investigation of Progression and Distribution of Cryptic Spots in the Richardson Crater Upper Darby High School, Period 6 Introduction As we begin to gain a greater understanding of Mars, we begin to uncover
Plate Tectonics Chapter 2
 Plate Tectonics Chapter 2 Does not include complete lecture notes. Continental drift: An idea before its time Alfred Wegener First proposed his continental drift hypothesis in 1915 Published The Origin
12 MAPS FOR ORIENTEERING AND FOR FINDING THE CACHE Lazlo Zentai, Hungary
 12 MAPS FOR ORIENTEERING AND FOR FINDING THE CACHE Lazlo Zentai, Hungary What are maps good for? Why do we use maps? How do we use maps? There are several answers to these questions as map users have different
Inductive Reasoning Page 1 of 7. Inductive Reasoning
 Inductive Reasoning Page 1 of 7 Inductive Reasoning We learned that valid deductive thinking begins with at least one universal premise and leads to a conclusion that is believed to be contained in the
FLOOD FORECASTING PRACTICE IN NORTHERN CALIFORNIA
 FLOOD FORECASTING PRACTICE IN NORTHERN CALIFORNIA California Department of Water Resources Post Office Box 219000, Sacramento, California 95821 9000 USA By Maurice Roos, Chief Hydrologist ABSTRACT Although
Symbolizing your data
 Symbolizing your data 6 IN THIS CHAPTER A map gallery Drawing all features with one symbol Drawing features to show categories like names or types Managing categories Ways to map quantitative data Standard
Chapter 5: Working with contours
 Introduction Contoured topographic maps contain a vast amount of information about the three-dimensional geometry of the land surface and the purpose of this chapter is to consider some of the ways in
Topographic change detection analysis of the Lake Hoare region and Canada Glacier in the McMurdo Dry Valleys of Antarctica using.
 Topographic change detection analysis of the Lake Hoare region and Canada Glacier in the McMurdo Dry Valleys of Antarctica using terrestrial LiDAR scans Anna Duewiger Welcome to the McMurdo Dry Valleys
The retreat of glaciers and the original people of the Great Lakes
 Subject/target grade: Grade 9-12 Local History, Ecology, or Earth/Environmental Science classes Duration: Four 50-minute class periods; one optional half-day field activity Setting: Classroom Materials
Operational snow mapping by satellites
 Hydrological Aspects of Alpine and High Mountain Areas (Proceedings of the Exeter Symposium, Juiy 1982). IAHS Publ. no. 138. Operational snow mapping by satellites INTRODUCTION TOM ANDERSEN Norwegian Water
How to analyze synoptic-scale weather patterns Table of Contents
 How to analyze synoptic-scale weather patterns Table of Contents Before You Begin... 2 1. Identify H and L pressure systems... 3 2. Locate fronts and determine frontal activity... 5 3. Determine surface
Assignment #3: Plate Tectonics
 Assignment #3: Plate Tectonics Overview: In this assignment we will examine the ideas of continental drift and of sea-floor spreading that lead to the Theory of Plate Tectonics. This assignment is in two
How To Teach Geology
 A HANDS-ON APPROACH TO UNDERSTANDING TOPOGRAPHIC MAPS AND THEIR CONSTRUCTION Department of Geology and Environmental Science La Salle University Philadelphia, Pennsylvania This article originally appeared
Guide to the Jamey Stillings Photographs of the Mike O Callaghan-Pat Tillman Memorial Bridge and the Hoover Dam
 Guide to the Jamey Stillings Photographs of the Mike O Callaghan-Pat Tillman Memorial Bridge and the Hoover Dam This finding aid was produced using ArchivesSpace on November 17, 2015. English 2015 The
Using LIDAR to monitor beach changes: Goochs Beach, Kennebunk, Maine
 Geologic Site of the Month February, 2010 Using LIDAR to monitor beach changes: Goochs Beach, Kennebunk, Maine 43 o 20 51.31 N, 70 o 28 54.18 W Text by Peter Slovinsky, Department of Agriculture, Conservation
Glacial Meltwater Landforms
 Canadian Landscapes Fact Sheets Glacial Meltwater Landforms A melting ice sheet produces a huge amount of water that runs off the ice or forms lakes in front of it. Several distinctive landforms and are
CATACLYSMIC ERUPTIONS
 CATACLYSMIC ERUPTIONS The really big ones! This figure compares the size of some recent, well-known eruptions. Note how small the eruptions of Mount St. Helens and even Vesuvius are compared to Katmai,
INTERPRETATION ADDENDUM CANADIAN MINING COMPANY INC. SUITE 2300-1066 WEST HASTINGS STREET VANCOUVER, BC V6E 3X2 3D INDUCED POLARIZATION
 INTERPRETATION ADDENDUM FOR CANADIAN MINING COMPANY INC. SUITE 2300-1066 WEST HASTINGS STREET VANCOUVER, BC V6E 3X2 3D INDUCED POLARIZATION ON THE SAN BERNARDO PROJECT EL GOCHICO GRID Approximate Location:
NASA s World Wind Planetary Visualisation software identifies proposed site of ancient Ithaca
 NASA s World Wind Planetary Visualisation software identifies proposed site of ancient Ithaca Homer s description of ancient Ithaca now believed to be accurate Former island was furthest to the west all
Comparison of Satellite Imagery and Conventional Aerial Photography in Evaluating a Large Forest Fire
 Purdue University Purdue e-pubs LARS Symposia Laboratory for Applications of Remote Sensing --98 Comparison of Satellite Imagery and Conventional Aerial Photography in Evaluating a Large Forest Fire G.
GLACIERS OF THE CONTERMINOUS UNITED STATES
 Glaciers of North America GLACIERS OF THE CONTERMINOUS UNITED STATES GLACIERS OF THE WESTERN UNITED STATES By ROBERT M. KRIMMEL With a section on GLACIER RETREAT IN GLACIER NATIONAL PARK, MONTANA By CARL