Corporate Presentation. November 2015
|
|
|
- Ethelbert Shepherd
- 7 years ago
- Views:
Transcription
1 Corporate Presentation November 2015

2 Future Oriented Information (See additional advisories at the end of this document) In the interest of providing information regarding Paramount Resources Ltd. ("Paramount" or the "Company") and its future plans and operations, this presentation contains certain forward-looking information and forward-looking statements. The projections, estimates and forecasts contained in such forward-looking information and statements necessarily involve a number of assumptions, and are subject to both known and unknown risks and uncertainties that may cause the Company's actual performance and financial results in future periods to differ materially from these projections, estimates or forecasts. The Advisories Appendix lists some of the material assumptions, risks and uncertainties that these projections, estimates and forecasts are based on and are subject to. Accordingly, shareholders and potential investors are cautioned that events or circumstances could cause actual results to differ materially from those predicted. Any use of information contained in this presentation is expressly forbidden. 2

3 Corporate Profile Corporate Profile Founded in 1974; IPO in 1978 TSX: POU Market Cap: MM $10.50/share ~ $1.1 Billion ~50% insider ownership Net Debt (Sept 30, 2015): $1.8 Billion 2015 Capital Guidance: $490 MM Low Risk/Repeatable Growth Operations focused on large-scale Deep Basin development Large contiguous acreage Multi-zone potential High condensate/gas ratios Owned and firm service access to infrastructure Significant near-term growth in production and cash flow Q3 2015: 50,000 Boe/d Production mix evolving to ~50% liquids Strategic Investments Exposure to emerging plays: Duvernay Oil sands Liard Basin shale gas (1) Average sales volumes for Q3 2015: 49,990 Boe/d 3

4 Deep Basin Resource Paramount Acreage (gross): 500 Sections Cretaceous Rights 364 Sections Montney Rights 209 Sections Duvernay Rights Deep Basin liquids-rich gas resources in multiple stacked horizons Bcf/section DGIIP (1) ~5 + Bcf EUR/Hz well (1) >10 Tcf DGIIP + NGLs net to POU (1) Liquids-rich Montney gas play ~70 + Bcf/section DGIIP (1) ~ 22 Tcf DGIIP + NGLs net to POU (1) Potential conventional Devonian exploration Potential Duvernay Shale rock play *Graphic courtesy of (1) Internal estimates: EUR denotes Estimated Ultimate Recovery, DGIIP denotes Discovered Gas Initially In Place. Please refer to "Oil and Gas Measures and Definitions" in the Advisories section of this presentation for further information. 4
 Internal estimates: EUR denotes Estimated Ultimate Recovery, DGIIP denotes Discovered Gas Initially In Place.")
5 Cretaceous Gas Resource Hz Dunvegan well at Resthaven Tested 11.3 MMcf/d(1) at 6.2 MPa IP: 8.3 MMcf/d Cost: $8.3 MM d/c/t in 2010 Hz Falher well at Musreau Tested 16.4 MMcf/d(1) at 20.8 MPa IP: 12.0 MMcf/d Cost: $8.6 MM d/c/t in 2010 (1) Please refer to the heading "Test Results" in the Advisories section of this presentation for further information 5
 Please refer to the heading \"Test Results\" in the Advisories")
6 Cretaceous Economics Assumptions Capital: $7.0 MM horizontal well IP 30 : 9.0 MMcf/d Natural Gas (raw): 4.9 Bcf Raw Condensate Gas Ratio (CGR) (1) : 17 Bbl/MMcf C2-C4 NGLs: 61 Bbl/MMcf Deep Cut Facility Economics $2.75 AECO US$45.00 WTI NPV 10% $ 1.6 MM IRR 23% Payout (Years) 2.9 P/I (1) 1.2 (1) Please refer to the heading Well Economics in the Advisories section of this presentation for further information (2) Excludes processing capital fees 6
 Please refer to the heading Well Economics in the Advisories section of this presentation for further")
7 Montney Gas Resource Liquids-rich Montney gas play; Paramount holds ~315 net sections of Montney rights Kaybob Montney Wells IP 30 Natural Gas(1) MMcf/d 4.4 IP , IP IP Wellhead Liquids(1) CGR(1) Bbl/d Bbl/MMcf Total Boe/d 1,350 Wells 43 Wells < 30 days onstream and wells in progress Total Karr Montney Wells IP 30 Natural Gas(1) MMcf/d 2.6 IP IP IP Wellhead Liquids(1) CGR(1) Bbl/d Bbl/MMcf Total Boe/d 724 Wells 24 Wells < 30 days onstream and wells in progress Total 1 25 (1) Please refer to the heading Montney CGRs in the Advisories section of this presentation for further information 7
 MMcf/d 2.6 IP 90 2.0 201 100 534 20 IP 180 2.1 183 88 533 9 IP 270 1.")
8 Montney "Rich" Well Economics "Rich" Montney Wells (1) Gas MMcf/d Liquids Bbl/d CGR Bbl/MMcf Total Boe/d Wells IP , IP , IP IP Wells < 30 days onstream and wells in progress 4 Total 36 Assumptions Capital: $9.2 MM horizontal 1-mile lateral well IP 30 : 5.1 MMcf/d Natural Gas (raw): 3.0 Bcf Raw Condensate Gas Ratio (CGR) (1) : 120 Bbl/MMcf (IP) (77 Bbl/MMcf lifetime average) C2-C4 NGLs: 90 Bbl/MMcf through Deep Cut Facility Economics $2.75 AECO US$45.00 WTI US$65.00 WTI NPV 10% $ 1.3 MM $5.1 MM IRR 18% 43% Payout (Years) P/I (1) (1) Please refer to the headings Well Economics and Montney CGRs in the Advisories section of this presentation for further information (2) Excludes processing capital fees 8
 3.5 2.2 P/I (1) 1.1 1.")
9 Montney "Ultra Rich" Well Economics "Ultra Rich" Montney Wells (1) Gas MMcf/d Liquids Bbl/d CGR (1) Bbl/MMcf Total Boe/d Wells IP ,200 8 IP IP IP Wells < 30 days onstream and wells in progress 20 Total 28 Assumptions Capital: $9.2 MM horizontal 1-mile lateral well IP 30 : 3.25 MMcf/d Natural Gas (raw): 2.0 Bcf Raw Condensate Gas Ratio (CGR) (1) : 320 Bbl/MMcf (IP) (192 Bbl/MMcf lifetime average) C2-C4 NGLs: 90 Bbl/MMcf through Deep Cut Facility Economics $2.75 AECO US$45.00 WTI US$65.00 WTI NPV 10% $ 4.1 MM $9.0 MM IRR 37% 80% Payout (Years) P/I (1) (1) Please refer to the headings Well Economics and Montney CGRs in the Advisories section of this presentation for further information (2) Excludes processing capital fees 9
 2.3 1.4 P/I (1) 1.5 2.")
10 Montney Drilling/Completion Improvements Pad drilling/pad layout Bits/muds/motors Well design: monobores/orientation/reservoir placement Toe up/toe down: effects on production Natural gas fueled rigs Plug and perf/sliding sleeves Cemented liners/open-hole packers (ECP s) Frac sizing/spacing/clusters Frac fluid selection/fluid handling Pumping techniques Frac fluid recycling Proppants Flow back/production practices Working with material and service providers to reduce costs 10

11 Montney Well Cost Progression Key Points Expected Well Cost ($MM) ($MM) 1.0 Mile Lateral 1.5 Mile Lateral Drill $4.3 $5.1 Complete $3.9 $5.8 Equip/Tie in. $1.0 $1.0 Total $9.2 $ mile well cost reductions from 2014 to 2015: $0.5 MM in drilling costs due to price reductions $2.1 MM in completion costs largely due to $1.4 MM reduction in frac oil and additional savings of $0.7 MM from price reductions Switching to 125T foamed water for 1.0 mile completions from 60T oil estimated to save additional $0.4 MM (>1,000 lbs/foot from 500 lbs/foot) Cost per meter of lateral 1.0 vs. 1.5 mile: ($M) 1.0 Mile (1,400 m) 1.5 Mile (2,200 m) Drill $3,070 $2,320 Complete $2,760 $2,630 11
 Cost per meter of lateral 1.0 vs. 1.5 mile: ($M) 1.")
12 Musreau 8-13 Complex October 13, 2014

13 Deep Basin Processing Capacity Gross Raw Gas Capacity MMcf/d Net POU Raw Gas Capacity MMcf/d Potential Sales Volumes Boe/d (1) , , ,000 Karr Capacity ,000 Other Musreau area capacity , , , , Plant , Plant ,000 Subtotal ,000 Projected Total ,900 Musreau Deep Cut Facility Musreau Refrig Facility Smoky Deep Cut Facility Stabilizer Expansion Subtotal Future Capacity Karr Expansion (1) Please refer to the heading Potential Sales Volumes in the Advisories section for further information. 13
 Please refer to the heading Potential Sales Volumes in the Advisories section for further information.")
14 Deep Basin Processing Capacity (1) (1) Please refer to the heading Deep Basin Processing Capacity in the Advisories section for further information. 14

15 Illustrative Deep-Cut - Montney Wells 200 MMcf/d x 23% Shrinkage = 154 MMcf/d Sales Gas (25,667 Boe/d) + 22,000 Bbl/d condensate + 18,000 Bbl/d NGLs Price (1) Deep-Cut Sales Gas $2.75/Mcf Yield Bbl/MMcf 154 MMcf/d $423,500 Condensate $65.00/Bbl ,000 Bbl/d $1,430,000 Butane $35.00/Bbl ,500 Bbl/d $87,500 Propane $10.00/Bbl 25 5,000 Bbl/d $50,000 Ethane $10.00/Bbl ,500 Bbl/d $105,000 Total: 65,667 Boe/d $2,096,000/day Royalty 5% ($104,800/day) Operating Cost ($3.00/Boe) ($197,000/day) Total: (1) Net of transportation 24.0 MMBoe/year $1,794,200/day $655 MM/year $27.29/Boe 15
 Operating Cost ($3.")
16 Paramount Deep-Cut Montney - Illustrative Project Economics Paramount s shallow rights will add substantially to the RLI Paramount has de-risked a substantial amount of its land base and thus could have the potential to add a series of refrigeration or deep cut plants Simple Payout from free cash flow after start up is less than two years Resource Needed: 200 MMcf/d x 365 ~ 73 Bcf/year x 10 year RLI = 730 Bcf 70 ~ 50% recovery = ~ 20 Sections Cost 60 (5 MMcf/d wells) x $10 MM/well = $600 MM Gas Plant = $250 MM Total: $850 MM Annual Deep - Cut Cash Flow Annual Capital = 25 (3.0 Bcf) wells x $10 MM/well Free Cash Flow $655 MM/year $250 MM/year $405 MM/year 16

17 Willesden Green Duvernay Shale Play 64,452 (34,305 net) acres of land Drilled and completed 3 (2.5 net) Hz Duvernay wells to date: 03/ W5: > 1,000 Bbl/MMcf W5: > 200 Bbl/MMcf W5: > 500 Bbl/MMcf Two standing wells to be re-entered at a later date Paramount has explored for ideal combinations of rock quality/liquids ratio/pressure gradient 17

18 Montney Valhalla: ~65 sections (~49 net) Montney/~60 sections (~44 net) Doig rights Montney/Doig Play 16 wells tied in at restricted rates (midstream constraints) Montney wells tested MMcf/d + NGLs/Condensate(1) Doig wells tested MMcf/d + NGLs/Condensate(1) Evaluating long term production/economics to determine future investment levels Birch: ~67 sections (~34 net) Montney rights Montney shale play (50% WI) Seven Hz Montney wells to date NGL yields average 60 Bbl/MMcf New 20 MMcf/d facility onstream November 2015 (1) Please refer to the heading "Test Results" in the Advisories section of this presentation for further information. (2) Based on results from Paramount's wells and publicly disclosed results of competitor wells. 18
 Please refer to the heading \"Test Results\" in the Advisories section of")
19 Paramount Investments
20 Paramount Investments 20
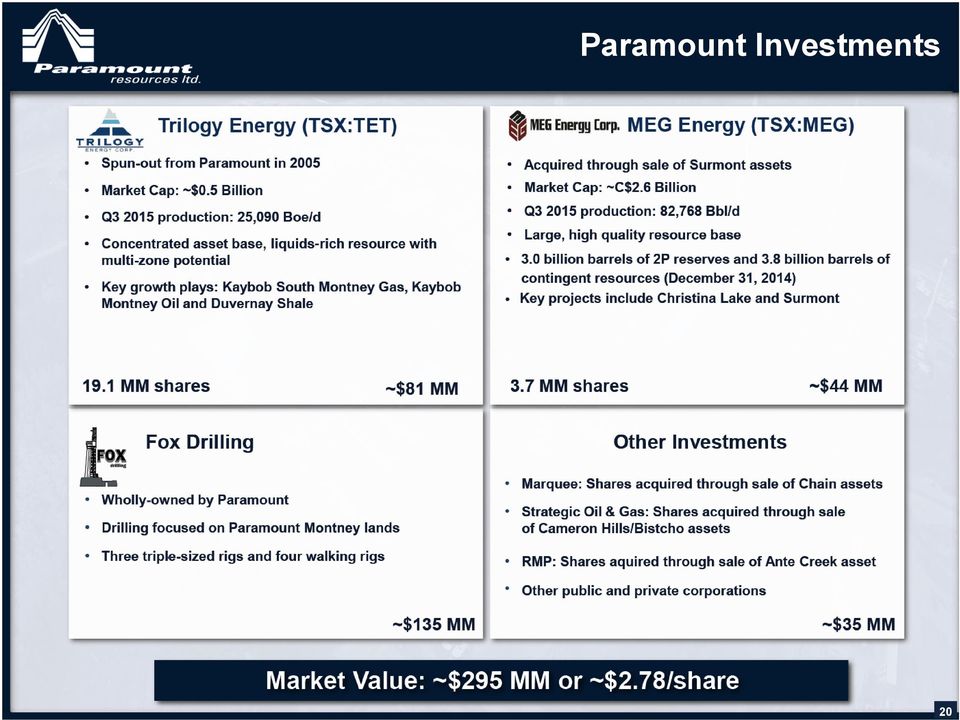
21 Paramount 100% Subsidiary Investments (1) Independent evaluation by McDaniel & Associates Consultants Ltd. effective December 31, 2014 Please refer to "Oil Sands Measures and Definitions" in the Advisories section of this presentation for oil sands resources and related definitions (2) As publicly disclosed by a large U.S. public E&P company with significant landholdings in the Liard Basin. The resource evaluation disclosed by such E&P company was not noted as having been prepared independently or by a qualified reserves evaluator or auditor (as such terms are defined in NI ) or in accordance with the COGE Handbook. This information is relevant to Paramount s landholdings in the Liard Basin as the information is in respect of landholdings in the Liard Basin that are close to Paramount s lands and are, accordingly, likely to have similar geology. 21
22 Quarterly Operating Results 22
23 Conventional Reserves Columns may not add due to rounding. Conventional reserves only. Includes nominal amounts of estimated reserves in respect of Paramount's initial shale gas well at Patry, B.C. Reserves evaluated by McDaniel &Associates Consultants Ltd. in accordance with National Instrument definitions, standards and procedures. 23
24 Summary Exposure to significant reserve opportunities Deep Basin: Cretaceous, Montney Valhalla: Montney, Doig Birch: Montney Willesden Green: Duvernay Significant asset value Trilogy MEG Energy Cavalier Energy Liard Shale Gas Paramount continues to provide long-term value creation for shareholders 24
25 ADVISORIES APPENDIX
26 Advisories Forward-Looking Information Certain statements in this presentation constitute forward-looking information under applicable securities legislation. Forward-looking information typically contains statements with words such as "anticipate", "believe", "estimate", "will", "expect", "plan", "intend", "propose", or similar words suggesting future outcomes or an outlook. Forward looking information in this presentation includes, but is not limited to: projected production and sales volumes including the liquids component thereof; forecast capital expenditures; exploration, development and associated operational plans and strategies (including planned drilling and completion programs, well tie-ins and potential facility expansions and additions and the anticipated timing of such activities); reserves and resources estimates (including internal estimates of DGIIP, EUR and contingent resources related to Paramount's properties and the estimated net present values of reserves and resources); projected type well production profiles and associated net present value, internal rate of return and payout estimates (and the initial production rate, reserves, capital and operating cost, shrinkage, NGLs yield and NGLs pricing assumptions used to generate such profiles and estimates); forecast drilling and completion costs for new wells; projected timelines for, constructing, commissioning and/or starting-up new and expanded natural gas processing and associated facilities, and the Company's Deep Basin processing capacity following the completion of these facilities; illustrative deep-cut project economics (including the commodity price, royalty rate, capital and operating cost, production volume, NGLs yield, well reserves, reserve life index, cash flow and payout assumptions used therein) and Paramount s potential ability to build and utilize additional processing facilities. Such forward-looking information is based on a number of assumptions which may prove to be incorrect. Assumptions have been made with respect to the following matters, in addition to any other assumptions identified in this presentation or Paramount s continuous disclosure documents: future natural gas, natural gas liquids (including condensate), oil and bitumen prices; royalty rates, taxes and capital, operating, general & administrative and other costs; foreign currency exchange rates and interest rates; general economic and business conditions; the ability of Paramount to generate and/or obtain the required capital to finance its exploration, development and other operations and meets its commitments and financial obligations; the ability of Paramount to obtain equipment, services, supplies and personnel in a timely manner and at an acceptable cost to carry out its activities; the ability of Paramount to secure adequate product processing, transportation, de-ethanization, fractionation and storage capacity on acceptable terms; the ability of Paramount to market its natural gas, natural gas liquids, oil and bitumen successfully to current and new customers; the ability of Paramount and its industry partners to obtain drilling success (including in respect of anticipated production volumes, reserves additions and liquids yields and resource recoveries) and operational improvements, efficiencies and results consistent with expectations; the timely receipt of required governmental and regulatory approvals; and anticipated timelines and budgets being met in respect of drilling programs and other operations (including well completions and tie-ins and the construction, commissioning and start-up of new and expanded facilities). Although Paramount believes that the expectations reflected in such forward looking information are reasonable, undue reliance should not be placed on them as Paramount can give no assurance that such expectations will prove to be correct. Forward-looking information is based on current expectations, estimates and projections that involve a number of risks and uncertainties which could cause actual results to differ materially from those anticipated by Paramount and described in the forward-looking information. These risks and uncertainties include and/or relate (but are not limited) to: fluctuations in natural gas, natural gas liquids, oil and bitumen prices; changes in foreign currency exchange rates and interest rates; the uncertainty of estimates and projections relating to future revenue, future production, reserve additions, liquids (including condensate and natural gas ratios), resources recoveries, yields, royalty rates, taxes and costs and expenses; the ability to secure adequate product processing, transportation, de-ethanization, fractionation and storage capacity on acceptable terms; operational risks in exploring for, developing and producing natural gas, natural gas liquids, oil and bitumen; the ability to obtain equipment, services, supplies and personnel in a timely manner and at an acceptable cost; potential disruptions or unexpected technical or other difficulties in designing, developing, expanding or operating new, expanded or existing facilities (including third party facilities); industry wide processing, pipeline, de-ethanization, and fractionation infrastructure outages, disruptions and constraints; risks and uncertainties involving the geology of oil and gas deposits; the uncertainty of reserves and resources estimates (including internal estimates of DGIIP, EUR, and contingent resources); the ability to generate sufficient cash flow from operations and obtain financing at an acceptable cost to fund planned exploration, development and operational activities and meet current and future commitments and obligations (including costs of anticipated new and expanded facilities and other projects and product processing, transportation, de-ethanization, fractionation and similar commitments and debt obligations); changes in, or in the interpretation of, laws, regulations or policies (including environmental laws); the ability to obtain required governmental or regulatory approvals in a timely manner and to enter into and maintain leases and licenses; general business, economic and market conditions; the effects of weather; the timing and costs of future abandonment and reclamation obligations and potential liabilities for environmental damage and contamination; uncertainties regarding aboriginal claims and in maintaining relationships with local populations and other stakeholders; the outcome of existing and potential lawsuits, regulatory actions, audits and assessments; and other risks and uncertainties described elsewhere in this presentation and in Paramount s filings with Canadian securities authorities, including its Annual Information Form. 26
27 Advisories (con't) The foregoing list of risks is not exhaustive. Additional information concerning these and other factors which could impact Paramount are included in Paramount s most recent Annual Information Form. The forward-looking information contained in this presentation is made as of the date hereof and, except as required by applicable securities law, Paramount undertakes no obligation to update publicly or revise any forward-looking statements or information, whether as a result of new information, future events or otherwise. Oil and Gas Measures and Definitions This presentation contains disclosure expressed as "Boe", "MMBoe" and "Boe/d". All oil and natural gas equivalency volumes have been derived using the ratio of six thousand cubic feet of natural gas to one barrel of oil. Equivalency measures may be misleading, particularly if used in isolation. A conversion ratio of six thousand cubic feet of natural gas to one barrel of oil is based on an energy equivalency conversion method primarily applicable at the burner tip and does not represent a value equivalency at the well head. During the nine months ended September 30, 2015, the value ratio between crude oil and natural gas was approximately 22:1. This value ratio is significantly different from the energy equivalency ratio of 6:1. Using a 6:1 ratio would be misleading as an indication of value. Paramount has provided information with respect to certain of its plays and emerging opportunities which is "analogous information" as defined in NI This analogous information includes Paramount's internal estimates of DGIIP or EUR, all as defined in the Canadian Oil and Gas Evaluation Handbook ("COGEH") or by the Society of Petroleum Engineers - Petroleum Resources Management System ("SPE-PRMS"), and/or production type curves in respect of proved plus probable reserves. This analogous information is presented on a basin, sub-basin or area basis utilizing data derived from Paramount's internal sources, as well as from a variety of publicly available information sources which are predominantly independent in nature. These internal estimates are subject to the specific assumptions identified by Paramount in respect of such estimates plus other assumptions contained herein, and are not necessarily representative of the actual resources or production rates associated with Paramount's properties and wells. Conventional reserve estimates include nominal amounts of volumes related to Paramount s completed shale gas well in the Liard Basin in British Columbia. The estimates of reserves for individual properties may not reflect the same confidence level as estimates of reserves for all properties, due to the effects of aggregation. Non-GAAP Measures In this presentation "Net Debt", "Funds Flow", "Free Cash Flow" and "EBITDA", collectively the non-gaap measures, are used and do not have any standardized meaning as prescribed by GAAP. Net Debt is a measure of a company's overall debt position after adjusting for certain working capital amounts and is used by Paramount s management to assess its overall leverage position. Funds flow refers to cash from operating activities before net changes in operating non-cash working capital, geological and geophysical expenses and asset retirement obligation settlements. Funds flow is commonly used in the oil and gas industry to assist management and investors in measuring a company s ability to fund capital programs and meet financial obligations. Free cash flow equals petroleum and natural gas sales less royalties, operating costs, transportation and processing costs and exploration and capital expenditures. EBITDA equals net loss: (i) before interest and financing expenses, share-based compensation, depreciation and depletion, exploration and evaluation expenses, gain or losses on the sale of oil and gas properties, accretion of asset retirement obligations, unrealized foreign exchange gains or losses, unrealized gains or losses on financial commodity contracts, write-downs of investments in securities, gains or losses on the sale of investments, income or loss from equity-accounted investments, income from discontinued operations and income tax expenses or recoveries; plus (ii) dividends from investees. EBITDA is commonly used to assist management and investors in measuring a company s ability to fund capital programs and meet financial obligations. Non-GAAP measures should not be considered in isolation or construed as alternatives to their most directly comparable measure calculated in accordance with GAAP, or other measures of financial performance calculated in accordance with GAAP. Non-GAAP measures are unlikely to be comparable to similar measures presented by other issuers. Test Results The test rates disclosed in this document represent the average rate of gas-flow during post clean-up production testing at the largest choke setting. The flow tests typically range from 4 to 55 hours in duration. Pressure transient analyses and well-test interpretations have not been carried out for any of these wells and, as such, all data should be considered preliminary until such analyses or interpretations have been done. Liquids yields have not been included in the test results as the bulk of the tested wells were fracture stimulated using frac oil with the result that substantially all liquids recovered during the test period were load fluid. Test results are not necessarily indicative of long-term performance or of ultimate recovery. Well Economics Condensate gas ratios ("CGRs") for wells are calculated by dividing total hydrocarbon liquids produced at the wellhead by total raw natural gas produced at the wellhead. Sales volumes will be lower due to shrinkage. The term "P/I" refers to profitability index and is calculated by dividing estimated net cash flows (before tax, discounted at 10 percent) by capital invested (discounted at 10 percent). 27
28 Advisories (con't) Montney CGRs Production rates are the average gross volumes per day measured at the wellhead over the initial 30, 90, 180 and 270 producing days commencing from the day after load oil volumes were completely recovered for wells completed with oil-based fluids and the first producing day for wells completed with water-based fluids (the "Initial Production Period"). Excludes days when the wells did not produce. CGRs were calculated for each well over the applicable Initial Production Period by dividing total hydrocarbon liquids volumes by total natural gas during such period. CGRs were calculated as of October 20, Onstream dates of wells range from January 2012 to September Potential Sales Volumes The term "Potential Sales Volumes" as used in the table on the "Deep Basin Processing Capacity" page, means the potential volumes of saleable natural gas and NGLs (expressed on a combined basis in Boe/d) that could result from processing the associated quantities of raw natural gas set out in the "Net POU Raw Gas Capacity" column in that table. These potential sales volumes should not be construed as a projection of Paramount's Deep Basin production at or by any particular date, as they will include some unavoidably commingled third-party production, and are subject to a number of factors and contingencies including the following: (a) production volumes sufficient to fill Paramount's capacity will not be available in all periods and under certain conditions; (b) during maintenance periods and at other times, the facilities will not operate at design capacity; and (c) NGLs sales volumes will vary depending on the liquids content of individual wells and the manner in which the facilities are operated. The potential sales volumes for each facility have been estimated assuming that natural gas processing and condensate stabilization capacity is fully utilized. Deep Basin Processing Capacity The term "Deep Basin Processing Capacity" as used in the table on the "Deep Basin Processing Capacity" page, means the aggregate capacity of the Company's owned and firm service natural gas and condensate processing facilities in the Alberta Deep Basin. These capacity estimates are subject to a number of assumptions and risks and should not be construed as projections of Paramount's Deep Basin area production volumes at or by any particular date or dates. The Company's net sales volumes will be lower than the capacity shown because of a number of factors including, but not limited to: (a) some unavoidably commingled third-party volumes will be processed using Paramount capacity; (b) the liquids content of wells will vary; (c) production volumes sufficient to fill capacity will not be available in all periods and under certain conditions; and (d) during maintenance periods and at other times, the facilities will not operate at design capacity. Capacity increases are shown at the mid-point of the period in which new facilities and facilities expansions are scheduled to be completed. However, the completion of such facilities may occur at any point during such period or may occur in a different period and the actual ramp-up will be different than depicted. Oil Sands Measures and Definitions "Contingent resources (development pending)" are those quantities of bitumen resources that are estimated, as of a given date, to be potentially recoverable from known accumulations using established technology but which are classified as resources rather than reserves due to one or more non-technical contingencies (such as the absence of detailed design estimates) which can be expected to be resolved within a reasonable time frame. Once these non-technical contingencies are removed, these resources will be re-classified as reserves. Specifically, low, best and high estimates of contingent resources will become proved, probable and possible reserves respectively. "Economic contingent resources" are a sub-category of contingent bitumen resources that are considered to be currently economically recoverable based on the reserves evaluator s then current forecasts of commodity prices and costs. "Best estimate" is considered to be the best estimate of the quantity of contingent resources that will actually be recovered. It is equally likely that the quantities recovered will be greater or less than the best estimate (or stated another way, there is a 50 percent confidence level that the actual quantities recovered will equal or exceed the best estimate amount). "Net present value" or "NPV" of Cavalier s economic contingent resources at Hoole represents McDaniel s estimates of Cavalier s share of future net revenues, before the deduction of income taxes, from these reserves and resources discounted at 10%. In calculating these NPVs McDaniel considered items such as revenues, royalties, operating costs, abandonment costs and capital expenditures (but excluded financing and general and administrative costs). Their calculations assume natural gas is used as a fuel for steam generation, and are based on their forecast commodity prices as of January 1, 2015 and forecast costs as of December 31, Royalties were calculated based on Alberta s Royalty Framework applicable to oil sands projects. McDaniel s estimated NPVs do not represent fair market value. There is no certainty that it will be commercially viable to produce any portion of Cavalier s contingent resources at Hoole. In addition, Cavalier currently has no detailed cost estimates in place for its Hoole Grand Rapids Project or a firm timeline for proceeding with the project, as it is still seeking financing and has not yet received approval from its board of directors to proceed with the project. If the Hoole Grand Rapids Project does proceed it will use steam assisted gravity drainage. 28
29
Corporate Presentation. October 2015
 Corporate Presentation October 2015 Future Oriented Information (See additional advisories at the end of this document) In the interest of providing information regarding Paramount Resources Ltd. ("Paramount"
Corporate Presentation. July 2016
 Corporate Presentation July 2016 Future Oriented Information (See additional advisories at the end of this document) In the interest of providing information regarding Paramount Resources Ltd. ("Paramount"
Trilogy completed the sale of its Dunvegan oil assets in the Kaybob area for net proceeds of $45 million.
 Calgary, Alberta November 5, 2015 News Release: Trilogy Energy Corp. Announces Financial and Operating Results for the Three and Nine Months-Ended September 30, 2015 and Provides Revised Guidance Trilogy
NEWS RELEASE CHINOOK ENERGY INC. ANNOUNCES ITS DECEMBER 31, 2015 RESERVES AND PROVIDES OPERATIONS UPDATE
 NEWS RELEASE CHINOOK ENERGY INC. ANNOUNCES ITS DECEMBER 31, 2015 RESERVES AND PROVIDES OPERATIONS UPDATE CALGARY, ALBERTA February 8, 2016 Chinook Energy Inc. ("Chinook" or the "Company") (TSX: CKE) today
RAGING RIVER EXPLORATION INC. ANNOUNCES 2015 YEAR END RESERVES AND UPDATED 2016 GUIDANCE
 February 3, 2016 RAGING RIVER EXPLORATION INC. ANNOUNCES 2015 YEAR END RESERVES AND UPDATED 2016 GUIDANCE CALGARY, ALBERTA (February 3, 2016) Raging River Exploration Inc. ("Raging River" or the "Company")
SPARTAN ENERGY CORP. ANNOUNCES TWO CONSOLIDATING SOUTHEAST SASKATCHEWAN LIGHT OIL ACQUISITIONS AND BANK LINE REDETERMINATION
 Suite 500, 850 2 nd Street SW Calgary, AB T2P 0R8 Canada Ph.: (403) 355-8920 Fax: (403) 355-2779 SPARTAN ENERGY CORP. ANNOUNCES TWO CONSOLIDATING SOUTHEAST SASKATCHEWAN LIGHT OIL ACQUISITIONS AND BANK
NOVEMBER 2015 UPDATE
 NOVEMBER 2015 UPDATE 1 Started Sept 2010, fourth Storm since Nov 1998 history of per share growth in prod n & asset value 119.3 MM shares + 6.0 MM options, TSX-V symbol SRX management, Board ownership
PRESS RELEASE. November 12, 2013
 PRESS RELEASE November 12, 2013 TORC OIL & GAS LTD. ANNOUNCES THIRD QUARTER 2013 FINANCIAL & OPERATIONAL RESULTS, SUCCESSFUL TRANSITION TO SUSTAINABLE DIVIDEND PLUS GROWTH COMPANY AND INCREASE TO 2013
FOR IMMEDIATE RELEASE TSXV: SOG OPERATIONS UPDATE. last. $90 million, by. drilled five. the Company. up the casing. well 14 35. resource.
 NEWS RELEASE TSXV: SOG February 11, 2016 STRATEGIC OIL & GAS LTD. FOR IMMEDIATE RELEASE PROVIDES OPERATIONS UPDATE, YEAR END RESERVES AND FINANCING ARRANGEMENT Calgary, Alberta Strategic Oil & Gas Ltd.
SPARTAN ENERGY CORP. ANNOUNCES THIRD QUARTER FINANCIAL AND OPERATING RESULTS
 Suite 500, 850 2 nd Street SW Calgary, AB T2P 0R8 Canada Ph.: (403) 355-8920 Fax: (403) 355-2779 SPARTAN ENERGY CORP. ANNOUNCES THIRD QUARTER FINANCIAL AND OPERATING RESULTS CALGARY, ALBERTA (November
Financial strategy supports business plan
 Financial strategy supports business plan Ivor Ruste Executive Vice-President & Chief Financial Officer Investor Day Calgary December 7, 2011 Financial strategy supports business plan Support long-term
KELT INCREASES PLANNED 2015 CAPITAL EXPENDITURES IN BRITISH COLUMBIA, PROVIDES OPERATIONS UPDATE AND ANNOUNCES $78.8 MILLION EQUITY FINANCINGS
 PRESS RELEASE (Stock Symbol KEL TSX) June 15, 2015 Calgary, Alberta KELT INCREASES PLANNED 2015 CAPITAL EXPENDITURES IN BRITISH COLUMBIA, PROVIDES OPERATIONS UPDATE AND ANNOUNCES $78.8 MILLION EQUITY FINANCINGS
energy ltd February 2016 TSX: CQE
 cequence energy ltd February 2016 TSX: CQE Forward-Looking Information and Definitions Summary of Forward-Looking Statements or Information Certain information included in this presentation constitutes
BAYTEX REPORTS Q3 2015 RESULTS
 BAYTEX REPORTS Q3 RESULTS CALGARY, ALBERTA (November 6, ) - Baytex Energy Corp. ("Baytex")(TSX, NYSE: BTE) reports its operating and financial results for the three and nine months ended (all amounts are
ANNUAL INFORMATION FORM For the Year Ended December 31, 2012
 ANNUAL INFORMATION FORM For the Year Ended December 31, 2012 March 7, 2013 TABLE OF CONTENTS INTRODUCTORY INFORMATION... 2 NOTE REGARDING FORWARD-LOOKING STATEMENTS AND ADVISORIES... 3 CORPORATE STRUCTURE...
EPAC: Oil and Gas Investor Showcase. June 10, 2015
 EPAC: Oil and Gas Investor Showcase June 10, 2015 Forward Looking Statement Advisories Certain information contained in this presentation constitutes forward-looking information within the meaning of applicable
MANAGEMENT S DISCUSSION AND ANALYSIS
 MANAGEMENT S DISCUSSION AND ANALYSIS Management s discussion and analysis ( MD&A ) of financial conditions and results of operations should be read in conjunction with NuVista Energy Ltd. s ( NuVista or
Gran Tierra Energy Inc. Announces 2015 Year-End Reserves and Combined Pro Forma Reserves and Resources
 Gran Tierra Energy Inc. Announces 2015 Year-End Reserves and Combined Pro Forma Reserves and Resources CALGARY, Alberta January 21, 2016 Gran Tierra Energy Inc. ( Gran Tierra or the "Company") (NYSE MKT:
Low Risk Glacier Montney Development, Strong Balance Sheet & Hedging Program Supports Profitable & Sustainable Growth
 Low Risk Glacier Montney Development, Strong Balance Sheet & Hedging Program Supports Profitable & Sustainable Growth Investor Presentation TSX / NYSE: AAV October 2015 ADVANTAGE AT A GLANCE TSX, NYSE:
Press Release November 12, 2015
 Press Release November 12, 2015 VALEURA ANNOUNCES THIRD QUARTER 2015 FINANCIAL AND OPERATING RESULTS AND COMMENCEMENT OF DRILLING ON THE FIRST BANARLI EXPLORATION WELL Valeura Energy Inc. ("Valeura" or
2016 Budget Targets 39% Production Growth, $0.75/mcf Total Cash Costs and 1.6x Debt to Cash Flow @ AECO Cdn $2.50/mcf
 2016 Budget Targets 39% Production Growth, $0.75/mcf Total Cash Costs and 1.6x Debt to Cash Flow @ AECO Cdn $2.50/mcf Investor Presentation TSX / NYSE: AAV January 2016 ADVANTAGE AT A GLANCE TSX, NYSE:
SECOND QUARTER HIGHLIGHTS
 Crew Energy Inc. (TSX: CR) of Calgary, Alberta ( Crew or the Company ) is pleased to provide our operating and financial results for the three and six month periods. SECOND QUARTER HIGHLIGHTS Production
Q1 2016 Results Conference Call
 ENCANA CORPORATION Q1 216 Results Conference Call May 3, 216 DELIVERING INDUSTRY LEADING PERFORMANCE AND LOWER COSTS Significant progress on achieving 216 cost savings target of $55 million year-over-year
RMP Energy Reports Third Quarter Financial Results
 NEWS RELEASE November 12, 2015 RMP Energy Reports Third Quarter Financial Results Calgary, Alberta RMP Energy Inc. ( RMP or the Company ) (TSX: RMP) is pleased to report for the three months ended September
CENTURY ENERGY LTD. FORM 51-102F1 MANAGEMENT DISCUSSION AND ANALYSIS FOR THE YEAR ENDED AUGUST 31, 2014
 CENTURY ENERGY LTD. FORM 51-102F1 MANAGEMENT DISCUSSION AND ANALYSIS FOR THE YEAR ENDED AUGUST 31, 2014 The following management s discussion and analysis ( MD&A ), prepared as of December 11, 2014, should
MANAGEMENT S DISCUSSION AND ANALYSIS
 MANAGEMENT S DISCUSSION AND ANALYSIS The following is management s discussion and analysis ( MD&A ) of Perpetual Energy Inc. s ( Perpetual, the Company or the Corporation ) operating and financial results
Tamarack Valley Energy Ltd. Announces Strategic Acquisitions, $72 Million Bought Deal Financing and Increased 2016 Guidance
 TSX: TVE NOT FOR DISTRIBUTION TO U.S. NEWS SERVICES OR DISSEMINATION IN THE UNITED STATES Tamarack Valley Energy Ltd. Announces Strategic Acquisitions, $72 Million Bought Deal Financing and Increased 2016
Upstream Developments Generate Growing Hydrocarbon Gas Liquids Supply! Alan Farquharson, SVP - Reservoir Engineering & Economics!
 Upstream Developments Generate Growing Hydrocarbon Gas Liquids Supply! Alan Farquharson, SVP - Reservoir Engineering & Economics! June 16, 2015 Forward-Looking Statements Certain statements and information
BONTERRA ENERGY CORP.
 BONTERRA ENERGY CORP. JULY 2014 YIELD GROWTH SUSTAINABILITY FORWARD LOOKING INFORMATION Certain statements contained in this Presentation include statements which contain words such as anticipate, could,
PEYTO. Exploration & Development Corp. Interim Report for the three months ended March 31, 2016
 PEYTO Exploration & Development Corp. 1 Interim Report for the three months ended March 31, 2016 HIGHLIGHTS 3 Months Ended March % 31 2016 2015 Change Operations Production Natural gas (mcf/d) 567,230
LAREDO PETROLEUM ANNOUNCES 2015 SECOND-QUARTER FINANCIAL AND OPERATING RESULTS
 15 West 6 th Street, Suite 900 Tulsa, Oklahoma 74119 (918) 513-4570 Fax: (918) 513-4571 www.laredopetro.com LAREDO PETROLEUM ANNOUNCES 2015 SECOND-QUARTER FINANCIAL AND OPERATING RESULTS RAISES ESTIMATED
PENGROWTH ENERGY CORPORATION. Third Quarter 2011 Results
 PENGROWTH ENERGY CORPORATION Third Quarter 2011 Results SUMMARY OF FINANCIAL & OPERATING RESULTS (monetary amounts in thousands, except Three Months ended Nine Months ended per share amounts or as otherwise
Annual General Meeting May 5, 2016
 Annual General Meeting May 5, 2016 Advisory FORWARD-LOOKING STATEMENTS: This presentation contains certain forward-looking statements and forward-looking information (collectively referred to as "forward-looking
Rex Energy Reports Second Quarter 2014 Operational and Financial Results
 Rex Energy Reports Second Quarter 2014 Operational and Financial Results Record quarterly production of 128.8 MMcfe/d, represents a 50% year-over-year increase Average daily production from oil and NGLs
Corporate Presentation
 Corporate Presentation January 2016 David J. Wilson, President & Chief Executive Officer Sadiq H. Lalani, Vice President, Finance & Chief Financial Officer www.keltexploration.com Advisory Regarding Forward-Looking
RMP Energy Provides First Half 2016 Capital Budget and Highlights New Strategic Acreage Positions
 NEWS RELEASE December 17, 2015 RMP Energy Provides First Half 2016 Capital Budget and Highlights New Strategic Acreage Positions Calgary, Alberta RMP Energy Inc. ( RMP or the Company ) (TSX: RMP) is pleased
Bengal Energy Fourth Quarter and Fiscal 2016 Year End Results
 June 17, 2016 Bengal Energy Fourth Quarter and Fiscal 2016 Year End Results Calgary, Alberta Bengal Energy Ltd. (TSX: BNG) ( Bengal or the Company ) today announces its financial and operating results
TD Securities Calgary Energy Conference July 2014
 TD Securities Calgary Energy Conference July 2014 Forward-Looking Statements Certain statements, estimates and financial information contained in this presentation ("Estimates") constitute forwardlooking
Third Quarter 2015 Swift Energy Company November 5, 2015
 Third Quarter 2015 Swift Energy Company November 5, 2015 Forward Looking Statements The material included herein which is not historical fact constitutes forward-looking statements within the meaning of
NOT FOR DISSEMINATION IN THE UNITED STATES. FAILURE TO COMPLY WITH THIS RESTRICTION MAY CONSTITUTE A VIOLATION OF UNITED STATES SECURITIES LAW.
 PRESS RELEASE CRESCENT POINT ANNOUNCES STRATEGIC SOUTHEAST SASKATCHEWAN CONSOLIDATION ACQUISITION OF LEGACY OIL + GAS INC., UPWARDLY REVISED 2015 GUIDANCE AND A CDN$600 MILLION BOUGHT DEAL FINANCING May
2010 financial REVIEW
 2010 financial REVIEW Resource Focus Opportunity Sustainability www.crewenergy.com Corporate Profile Crew Energy Inc. ( Crew ) or ( the Company ) is a growth-oriented oil and natural gas producer. Crew
Corporate Presentation January 2016
 Corporate Presentation January 2016 CAUTIONARY STATEMENTS Certain information regarding the Company contained in this presentation, including our liquidity position, our business strategies, plans and
For the Three and Six months ended June 30, 2012
 Q2 2012 For the Three and Six months ended June 30, 2012 Highlights Twin Butte Energy Ltd. ( Twin Butte or the Company ) (TSX: TBE) is pleased to announce its financial and operational results for the
EnCana and Cenovus Oil & Gas Conversion
 Creating Two Highly Focused Energy Companies Calgary, Alberta September, 2009 Future Oriented Information In the interest of providing EnCana Corporation ( EnCana or the Company ) shareholders and potential
CONE Midstream Partners LP. 1Q 2016 Earnings May 5, 2016
 CONE Midstream Partners LP 1Q 2016 Earnings May 5, 2016 Disclaimer Forward Looking Statements This presentation contains forward-looking statements within the meaning of the federal securities laws. Statements
EQT REPORTS FIRST QUARTER 2015 EARNINGS Significant volume growth continues
 EQT REPORTS FIRST QUARTER 2015 EARNINGS Significant volume growth continues PITTSBURGH, PA (April 23, 2015) -- EQT Corporation (NYSE: EQT) today announced first quarter 2015 net income attributable to
Management s Discussion and Analysis
 PrairieSky Royalty Ltd. Management s Discussion and Analysis For the three months ended PrairieSky Royalty Ltd. Management s Discussion and Analysis This Management s Discussion and Analysis ( MD&A ) for
Corporate Presentation October 2015
 Corporate Presentation October 2015 CAUTIONARY STATEMENTS Certain information regarding the Company contained in this presentation, including our liquidity position, our business strategies, plans and
TOUCHSTONE ANNOUNCES 2015 THIRD QUARTER RESULTS AND ELIMINATION OF NET DEBT; UPDATES TRINIDAD ACQUISITION
 TOUCHSTONE ANNOUNCES 2015 THIRD QUARTER RESULTS AND ELIMINATION OF NET DEBT; UPDATES TRINIDAD ACQUISITION Calgary, Alberta November 13, 2015 Touchstone Exploration Inc. ( Touchstone or the Company ) (TSX:
Q1 FOR THE PERIOD ENDED MARCH 31, 2006
 Q1 FOR THE PERIOD ENDED MARCH 31, 2006 I N T E R I M R E P O R T HIGHLIGHTS For the Three Months Ended March 31 December 31 March 31 2006 2005 2005 Financial ($000, except $ per unit) Revenue oil and
Canadian Oil Sands Reports Over $1 Billion of Cost Savings Achieved at Syncrude Year to Date
 October 29, 2015 TSX: COS Canadian Oil Sands Reports Over $1 Billion of Cost Savings Achieved at Syncrude Year to Date All financial figures are unaudited, have been prepared in accordance with Canadian
Canadian Oil Sands' Second Quarter Results Reflect Continued Progress on Syncrude's Cost Reduction Efforts
 July 30, 2015 TSX: COS Canadian Oil Sands' Second Quarter Results Reflect Continued Progress on Syncrude's Cost Reduction Efforts All financial figures are unaudited, have been prepared in accordance with
President s Message HIGHLIGHTS OPERATIONS REVIEW
 President s Message HIGHLIGHTS On August 17, 2010, Storm Resources Ltd. ( Storm or the Company ) commenced operations after certain assets were transferred to Storm under the Plan of Arrangement involving
Enbridge Income Fund Holdings Inc. Announces Second Quarter Results; Declares Monthly Dividend
 NEWS RELEASE Enbridge Income Fund Holdings Inc. Announces Second Quarter Results; Declares Monthly Dividend HIGHLIGHTS (all financial figures are unaudited and in Canadian dollars) Earnings for the second
Q1 2016 First Quarter Report
 Q1 2016 First Quarter Report Financial and Operating Highlights 2016 2015 Financial ($000, except as otherwise indicated) Sales including realized hedging $ 41,625 $ 39,991 Funds from operations $ 30,236
Management s Discussion & Analysis Period Ended March 31, 2004 as compared to March 31, 2003
 SUITE 700, 505 THIRD STREET S.W., CALGARY, ALBERTA T2P 3E6 FACSIMILE (403)264-7189 TELEPHONE (403)693-1700 Management s Discussion & Analysis March 31, 2004 as compared to March 31, 2003 This Management
Staying the Course Investor Presentation June 2016
 Staying the Course Investor Presentation June 2016 Disclaimer This presentation is not, and under no circumstances is to be construed to be a prospectus, offering memorandum, advertisement or public offering
CRESCENT POINT ENERGY ANNOUNCES $1.45 BILLION CAPITAL EXPENDITURES BUDGET FOR 2015
 PRESS RELEASE CRESCENT POINT ENERGY ANNOUNCES $1.45 BILLION CAPITAL EXPENDITURES BUDGET FOR 2015 January 6, 2015 CALGARY, ALBERTA. Crescent Point Energy Corp. ( Crescent Point or the Company ) (TSX and
CANADIAN NATURAL RESOURCES LIMITED ANNOUNCES 2014 FOURTH QUARTER AND YEAR END RESULTS CALGARY, ALBERTA MARCH 5, 2015 FOR IMMEDIATE RELEASE
 CANADIAN NATURAL RESOURCES LIMITED ANNOUNCES FOURTH QUARTER AND YEAR END RESULTS CALGARY, ALBERTA MARCH 5, 2015 FOR IMMEDIATE RELEASE Commenting on fourth quarter and year end results, Steve Laut, President
Canadian Oil Sands Valuable. For the Long Term. Investor Presentation January 2016
 Canadian Oil Sands Valuable. For the Long Term. Investor Presentation January 2016 Reasons to Reject Suncor s Hostile Bid Significantly Undervalued: - Fails to recognize a new era of lower cost production
All tabular amounts are stated in thousands except per share amounts or as otherwise stated.
 MANAGEMENT S DISCUSSION AND ANALYSIS The following management s discussion and analysis ( MD&A ) should be read in conjunction with Novus Energy Inc. s ( Novus or the Company ) audited consolidated financial
BLACKPEARL RESOURCES INC. 700, 444 7th Avenue SW, Calgary, AB T2P 0X8 Ph. (403) 215-8313 Fax (403) 265-8324 www.blackpearlresources.
 215-8313 Fax (403) 265-8324 www.blackpearlresources.") BLACKPEARL RESOURCES INC. 700, 444 7th Avenue SW, Calgary, AB T2P 0X8 Ph. (403) 215-8313 Fax (403) 265-8324 www.blackpearlresources.ca NEWS RELEASE August 5, 2014 BLACKPEARL ANNOUNCES SECOND QUARTER 2014
BLACKPEARL RESOURCES INC. 700, 444 7th Avenue SW, Calgary, AB T2P 0X8 Ph. (403) 215-8313 Fax (403) 265-8324 www.blackpearlresources.ca NEWS RELEASE August 5, 2014 BLACKPEARL ANNOUNCES SECOND QUARTER 2014
SWIFT ENERGY ANNOUNCES FIRST QUARTER 2015 RESULTS
 17001 NORTHCHASE DR., SUITE 100, HOUSTON, TEXAS 77060 SWIFT ENERGY COMPANY COMPANY CONTACT: Doug Atkinson Manager Investor Relations (281) 874-2700, (800) 777-2412 FOR IMMEDIATE RELEASE SWIFT ENERGY ANNOUNCES
BAYTEX REPORTS Q1 2016 RESULTS
 BAYTEX REPORTS Q1 2016 RESULTS CALGARY, ALBERTA (May 3, 2016) - Baytex Energy Corp. ("Baytex") (TSX, NYSE: BTE) reports its operating and financial results for the three months ended March 31, 2016 (all
EPSILON REPORTS THIRD QUARTER 2015 RESULTS
 News Release EPSILON REPORTS THIRD QUARTER 2015 RESULTS Houston, Texas October 28, 2015 Epsilon Energy Ltd. ( Epsilon or the Company ) (TSX:EPS) today reported third quarter 2015 financial and operating
Q3 Results Conference Call
 ENCANA CORPORATION Q3 Results Conference Call November 12, 215 FOCUSED GROWTH Lowering Costs and Growing High Margin Production Execution in the core four assets on track Permian: top tier operator Eagle
Memorial Production Partners LP Announces Second Quarter 2015 Results, Cash Distribution Update, Updated Hedges and Updated 2015 Guidance
 August 5, 2015 Memorial Production Partners LP Announces Second Quarter 2015 Results, Cash Distribution Update, Updated Hedges and Updated 2015 Guidance HOUSTON, Aug. 5, 2015 (GLOBE NEWSWIRE) -- Memorial
SPYGLASS RESOURCES CORP. ANNOUNCES 2015 FIRST QUARTER RESULTS
 SPYGLASS RESOURCES CORP. ANNOUNCES 2015 FIRST QUARTER RESULTS All values are in Canadian dollars unless otherwise indicated. Conversion of natural gas volumes to barrels of oil equivalent (boe) are at
THIRD QUARTER 2015 RESULTS Earnings Conference Call - November 6, 2015
 THIRD QUARTER 2015 RESULTS Earnings Conference Call - November 6, 2015 Forward-looking Information Certain matters contained in this presentation include "forward-looking statements" within the meaning
Third quarter 2015 results October 29, 2015 Conference call notes
 Third quarter 2015 results October 29, 2015 Conference call notes Kam Sandhar Director, Investor Relations Thank you operator and welcome everyone to our third quarter 2015 results conference call. I would
GeoResources, Inc. Reports First Quarter Financial and Operational Results
 GeoResources, Inc. Reports First Quarter Financial and Operational Results Reports First Quarter Adjusted Net Income of $11.5 Million or $0.44 Per Share and Adjusted EBITDAX of $30.4 Million Houston, Texas,
December 2015. Investor Presentation
 December 2015 Investor Presentation COS Overview Pure-play exposure to a scarce, irreplaceable oil sands mining asset in a low-risk, geopolitically stable country High quality leases border every oil sands
EnerCom s The Oil & Gas Conference August 17-21, 2014 Denver, Colorado
 EnerCom s The Oil & Gas Conference August 17-21, 2014 Denver, Colorado James Bowzer, President and CEO Brian Ector, Senior Vice President, Capital Markets and Public Affairs Advisory Forward-Looking Statements
Creating a Sustainable Business
 Creating a Sustainable Business January 2016 T V E : T S X www.tamarackvalley.ca 1 Forward Looking Information Certain information included in this presentation constitutes forward-looking information
MANAGEMENT S DISCUSSION & ANALYSIS. Nine Months Ended April 30, 2016
 MANAGEMENT S DISCUSSION & ANALYSIS Nine Months April 30, 2016 This management s discussion and analysis of financial position and results of operations ( MD&A ) is prepared as at June 27, 2016 and should
CONDENSED INTERIM FINANCIAL STATEMENTS FOR THE THREE AND NINE MONTHS ENDED SEPTEMBER 30, 2015 (UNAUDITED)
") CONDENSED INTERIM FINANCIAL STATEMENTS FOR THE THREE AND NINE MONTHS ENDED SEPTEMBER 30, 2015 (UNAUDITED) STATEMENTS OF FINANCIAL POSITION (Unaudited; in thousands of Canadian dollars) ($000s) Note September
CONDENSED INTERIM FINANCIAL STATEMENTS FOR THE THREE AND NINE MONTHS ENDED SEPTEMBER 30, 2015 (UNAUDITED) STATEMENTS OF FINANCIAL POSITION (Unaudited; in thousands of Canadian dollars) ($000s) Note September
Acrim Resources Argentina - A Case Study
 Antrim Energy Inc. Management s Discussion and Analysis December 31, 2008 1 MANAGEMENT S DISCUSSION AND ANALYSIS Forward Looking Statements This management discussion and analysis ( MD&A ) and any documents
Corporate Presentation
 Corporate Presentation October 2015 David J. Wilson, President & Chief Executive Officer Sadiq H. Lalani, Vice President, Finance & Chief Financial Officer www.keltexploration.com Advisory Regarding Forward-Looking
Oil and Gas Terms. Anticline: An arch of stratified rock layers that may form a trap for hydrocarbons.
 Oil and Gas Terms American Petroleum Institute (API): The API is the trade organization for the oil and gas industry, which establishes standards governing industry operations, safety and the manufacturing
FORM 51-101 F1. Prepared for: DUNDEE ENERGY LIMITED In respect of assets held by DUNDEE ENERGY LIMITED PARTNERSHIP
 FORM 51-101 F1 Prepared for: DUNDEE ENERGY LIMITED In respect of assets held by DUNDEE ENERGY LIMITED PARTNERSHIP Statement of reserves data and other oil and gas information as of December 31, 2014 Prepared
ANNUAL INFORMATION FORM
 ANNUAL INFORMATION FORM For the year ended December 31, 2015 April 26, 2016 TABLE OF CONTENTS ABBREVIATIONS... 3 CONVERSIONS... 3 BARREL OF OIL EQUIVALENCY... 3 CURRENCY... 4 FORWARD LOOKING STATEMENTS...
For Immediate Release. Superior Plus Corp. to Acquire Canexus Corporation Enhancing and Expanding the Specialty Chemicals Platform
 NEWS TSX: SPB Toronto, October 6, 2015 For Immediate Release Superior Plus Corp. to Acquire Canexus Corporation Enhancing and Expanding the Specialty Chemicals Platform Strong alignment with Superior s
ARC Resources Ltd. A CLEAR Line of Sight FIRST QUARTER
 ARC Resources Ltd. A CLEAR Line of Sight FIRST QUARTER 2013 FINANCIAL & OPERATING HIGHLIGHTS Three Months Ended March 31 2013 2012 FINANCIAL (Cdn$ millions, except per share and per boe amounts) Funds
Sterling Resources Ltd. AGM Presentation. 5 July 2016
 Sterling Resources Ltd AGM Presentation 5 July 2016 Disclaimer The information in this presentation contains certain forward looking statements including expectations of future financial transactions.
BUILT TO LAST NOVEMBER 2015
 BUILT TO LAST NOVEMBER 2015 Built to Last Low Debt Low Decline Strong Capital Efficiencies 2 Cardinal Energy Profile Shares Outstanding (1) : TSX: CJ Basic 64,961,946 Fully Diluted 67,476,387 Annual Dividend
first quarter report for the three months ended March 31, 2004
 2004 first quarter report for the three months ended March 31, 2004 Selected Financial and Operating Results For the three months ended March 31, 2004 2003 Average Daily Production Natural gas (Mcf/day)
Inter Pipeline Fund Announces Strong Third Quarter 2009 Results
 News Release Inter Pipeline Fund Announces Strong Third Quarter 2009 Results CALGARY, ALBERTA, NOVEMBER 5, 2009: Inter Pipeline Fund ( Inter Pipeline ) (TSX: IPL.UN) announced today its financial and operating
23FEB201120562758 ANNUAL INFORMATION FORM. For the year ended December 31, 2015
 23FEB201120562758 ANNUAL INFORMATION FORM For the year ended December 31, 2015 February 19, 2016 TABLE OF CONTENTS Page Page GLOSSARY OF TERMS 1 SUPPLEMENTAL OPERATIONAL INFORMATION 34 ABBREVIATIONS AND
Operational, Reserves and Guidance Update
 Operational, Reserves and Guidance Update NASDAQ: MRD Jay C. Graham CEO February 2016 Andrew J. Cozby SVP and CFO Forward-Looking Statements This presentation includes "forward-looking statements" within
OIL AND GAS RESERVES AND NET PRESENT VALUE OF FUTURE NET REVENUE
 OIL AND GAS RESERVES AND NET PRESENT VALUE OF FUTURE NET REVENUE In accordance with National Instrument 51-101 Standard of Disclosure for Oil and Gas Activities, McDaniel & Associates Consultants Ltd.
Highlights: By The Numbers
 Q2 Second quarter 2014 interim report For the Three and Six Months Ended June 30, 2014 Highlights: By The Numbers Three Months Ended June 30, Six Months Ended June 30, 2014 2013 Change 2014 2013 Change
Pivotal Third Quarter Puts Encana Two Years Ahead on Strategy Execution
 November 12, 2014 Pivotal Third Quarter Puts Encana Two Years Ahead on Strategy Execution CALGARY, AB --(Marketwired - November 12, 2014) - Encana (TSX: ECA) (NYSE: ECA) delivered strong results in a pivotal
Efficient. Sustainable. Disciplined. BONTERRA ENERGY CORP. 2015 ANNUAL REPORT
 Efficient. Sustainable. Disciplined. BONTERRA ENERGY CORP. ANNUAL REPORT 1 BONTERRA ANNUAL REPORT Efficient. Sustainable. Disciplined. BONTERRA ENERGY CORP. IS A DIVIDEND-PAYING, CONVENTIONAL OIL AND GAS
TD Calgary Energy Conference Stampede 2012
 2011 2003 2010 1998 2003 www.peyto.com TD Calgary Energy Conference Stampede 2012 July 2012 Advisory Regarding Forward-Looking Statements This presentation contains forward-looking statements and forward-looking
(713) 627-5353 (713) 627-4747 (24-hour media line) (713) 627-4600. Date: May 3, 2013
 627-5353 (713) 627-4747 (24-hour media line) (713) 627-4600. Date: May 3, 2013") Media: Analysts: Caitlin Currie (713) 627-5353 (713) 627-4747 (24-hour media line) John Arensdorf (713) 627-4600 Date: May 3, 2013 Spectra Energy Reports First Quarter 2013 Results Reported net income
Media: Analysts: Caitlin Currie (713) 627-5353 (713) 627-4747 (24-hour media line) John Arensdorf (713) 627-4600 Date: May 3, 2013 Spectra Energy Reports First Quarter 2013 Results Reported net income
Detour Gold Provides New Life of Mine Plan for Detour Lake
 January 25, 2016 NEWS RELEASE Detour Gold Provides New Life of Mine Plan for Detour Lake Detour Gold Corporation (TSX: DGC) ( Detour Gold or the Company ) is pleased to announce a new life of mine plan
VERMILION ENERGY INC. ANNUAL REPORT
 VERMILION ENERGY INC. ANNUAL REPORT For the Year Ended December 31, 2010 TABLE OF CONTENTS President s Message to Shareholders... 4 Management s Discussion and Analysis... 7 Management s Report to Shareholders...
FIRST QUARTER CONFERENCE CALL MAY 4, 2010
 FIRST QUARTER CONFERENCE CALL MAY 4, 2010 1 Cautionary Statement CAUTIONARY NOTE REGARDING FORWARD-LOOKING STATEMENTS: This presentation contains or incorporates by reference forwardlooking statements
Spectra Energy Reports First Quarter 2012 Results
 Media: Analysts: Wendy Olson (713) 627-4072 (713) 627-4747 (24-hour media line) John Arensdorf (713) 627-4600 Date: May 4, 2012 Spectra Energy Reports First Quarter 2012 Results Reported net income from
CORPORATE PRESENTATION OCTOBER 2015
 CORPORATE PRESENTATION OCTOBER 215 DELPHI: FORWARD-LOOKING STATEMENTS The presentation contains forward-looking statements and forward-looking information within the meaning of applicable Canadian securities