CRESTA DPI OpenMPI Performance Optimisation and Analysis
|
|
|
- Elizabeth Nash
- 3 years ago
- Views:
Transcription
1

2 Version Date Comments, Changes, Status Authors, contributors, reviewers /08/2012 First full version of the deliverable Jens Doleschal (TUD) /09/2012 Review Ben Hall (UCL) /09/2012 Review Adam Carter (EPCC) /09/2012 Incorporate review comments from Adam Carter into document /09/2012 Incorporate review comments from Ben Hall into document /09/2012 Added section Score-P measurement system Added subsubsection s to subsection 4.1 for clarification reasons Final modifications in all sections Jens Doleschal (TUD) Jens Doleschal (TUD) Jens Doleschal (TUD) /09/2012 Final version of the deliverable Jens Doleschal (TUD) CRESTA Consortium Partners 2011 Page 2 of 18
 Jens Doleschal (TUD) Jens Doleschal (TUD) 1.")
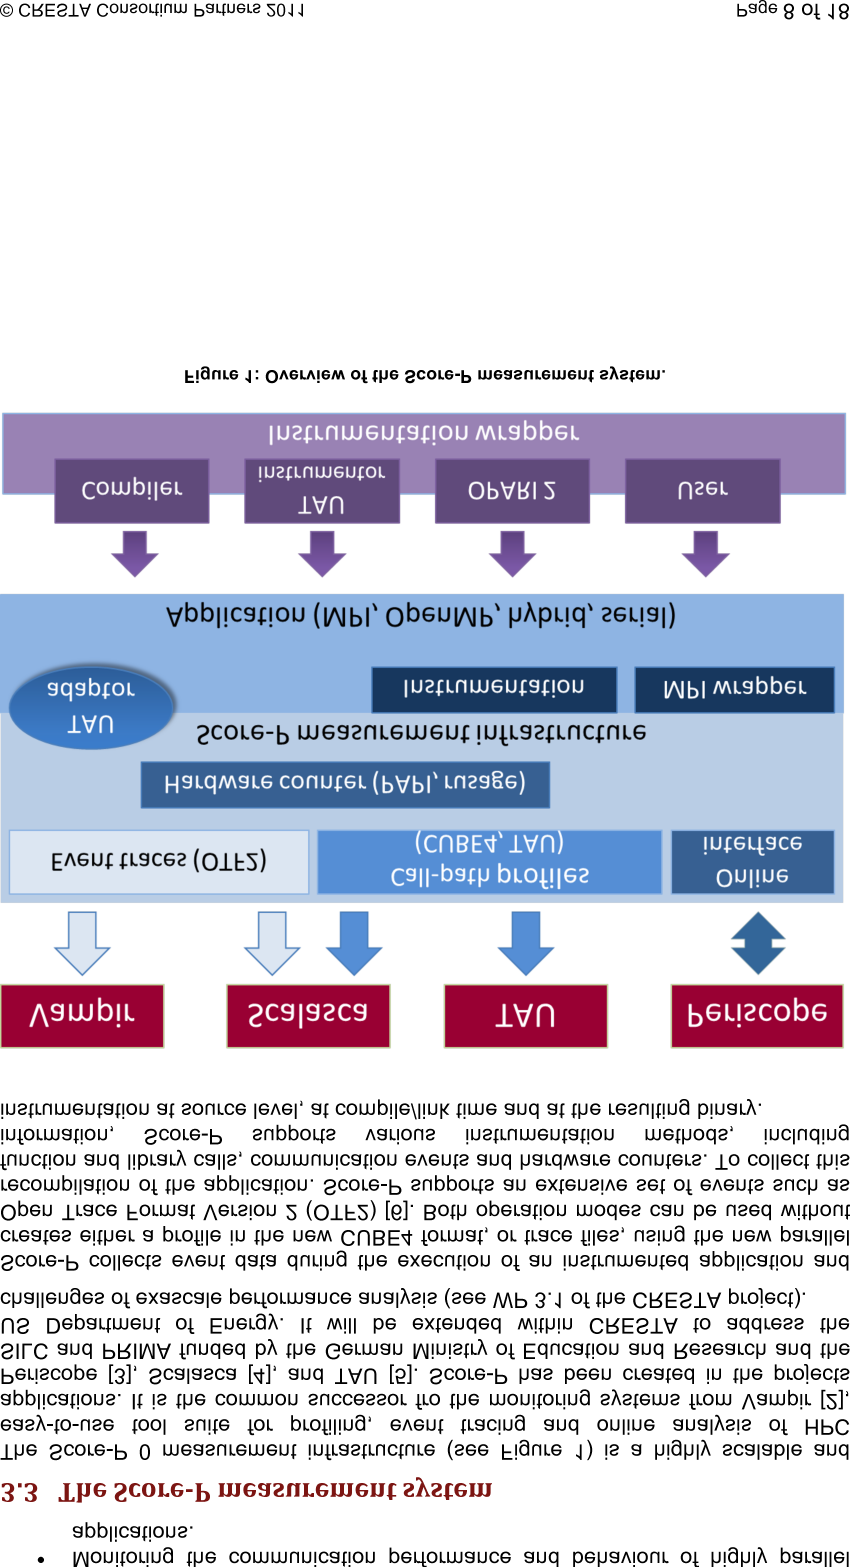
3 Figure 1: Overview of the Score-P measurement system Figure 2: Performance analysis workflow over time with different monitoring and analysis techniques Figure 3: Interactive exploration of performance behaviour in Scalasca along the dimensions performance metric (left), call tree (middle), and process topology (right). 15 Figure 4: Color-coded visualisation of a parallel application run with timeline and statistic displays of the Vampir GUI CRESTA Consortium Partners 2011 Page 3 of 18
, and process topology (right).")
4 This document describes the best practices in performance analysis and optimisation defined in Task of WP 2 of the CRESTA project. This document should guide application developers in the process of tuning and optimising their codes for performance. It focuses on application performance optimisation and analysis, and describes which application performance monitoring techniques should be used in which situation, which performance issues may occur, how the issues can be detected, and which tools should be used in which order to accomplish common performance analysis tasks. Furthermore, this document presents the application performance analysis tools of the CRESTA project Score-P and Vampir. Scalasca, one of the profile analysis tools of Score-P, is also presented to provide a complete workflow of performance analysis tools for an application performance analysis. In general, the application performance optimisation and analysis starts with lightweight monitoring of the application, either by a job-monitoring tool or by a coarse-grained sample-based profiling to identify potential problem areas such as communication, memory, or I/O. Afterwards, a more-detailed call-path profiling should be used to identify phases and functions of interest, and also to locate the main performance problems. These functions and regions of interest can be analysed in more detail by using selective event tracing. This document does not replace the user guides of individual performance analysis tools developed within or outside CRESTA. Our investigations and lessons into auto-tuning and power optimisation are still on going and will be finished in the further progress of the project. Therefore, they cannot be addressed in the current version of this document, but when they are available they will be added within a later version of this document. CRESTA Consortium Partners 2011 Page 4 of 18

5 HPC systems are composed of hundreds of thousands of homogeneous or even heterogeneous processing elements. Running applications efficiently in such highly parallel and complex systems requires orchestrating different levels of concurrency (threads, message passing, I/O, etc.). Therefore, it will be necessary to discover performance bottlenecks originating from the increase of complexity of each level of concurrency and to correct them in the application source codes. Furthermore, the observation of performance problems that originate from the use of shared hardware (network, file system, etc.) becomes fundamental since a minority of processes or processing elements can disturb and affect the whole system. This document should guide application developers in the process of tuning and optimising their codes for performance. It describes which application performance monitoring techniques should be used in which situation, which performance issues may occur, how the issues can be detected, and which tools should be used in which order to accomplish common application performance analysis tasks. Section 3 gives a brief overview of common performance monitoring techniques and recommendations for their use. After that, section 4 describes typical performance issues and gives hints regarding which monitoring techniques and performance metrics should be used to identify a certain performance issue. Finally, section 5 presents a typical application performance analysis workflow. This document describes the best practices in performance analysis and optimisation defined in Task of WP 2 of the CRESTA project and addresses therefore the following topics: Application performance monitoring and analysis techniques Application performance analysis tools workflow cronym CRESTA D MPI OpenMP OTF2 WP Definition Collaborative Research Into Exascale Systemware, Tools and Applications Deliverable Message Passing Interface Open Multi-Processing Open Trace Format Version 2 Work Package CRESTA Consortium Partners 2011 Page 5 of 18

6 This section gives a brief overview of various application monitoring and performance data generation techniques and recommendations for the use of these techniques. For the observation of the state and the behaviour of an application over runtime two main approaches basically exist. Information about an application can be generated either by using instrumentation, i.e. inserting pieces of code into the application source code or binary for an event based measurement, or by using a sampling approach, i.e. observing the state of the application frequently, or a combination of both. The selection of the right technique for a given performance issue is always a trade-off between intrusion and the level of detail. While intrusion does not just slow down the process of obtaining the information, it can actually change the application behaviour and ias a result the measurement information will lose its significance. In contrast, the level of detail is a significant factor in determinijng if a performance issue can be detected or not. The main goal should be to select the best information generation technique for a given application and situation with emphasis on reducing the intrusiveness while providing enough information needed to detect different kinds of performance bottlenecks. Sampling is a monitoring technique that is used to periodically observe the state of an application, i.e., which function is executed at observation time, without any need to modify the application. The sampling frequency is the important steering factor to control the level of detail and the intrusiveness. A low sampling frequency is ideal to get an overview of the application since the total amount of samples and their size is limited, but the detection of the root cause of a performance problem might become impossible. In contrast, a high sampling frequency will increase the possibility to detect the cause of a performance problem, but may also increase the intrusion significantly. As a result, the performance analyst has to choose the optimal sampling frequency depending on the level of detail, the point of time, and the processing element to be observed. An ability of sampling is to dynamically change the sampling frequency during measurement to address the trade-off between intrusion and the level of detail. However, steering the sampling frequency without any knowledge about the application is a challenging task. Recommendations in use: Lightweight monitoring of batch system jobs to get job overview information. Probe-based monitoring to gain insight into the application at a specific point in time In contrast to sampling, event-based monitoring records only information if a specific pre-defined event occurs, e.g. function entry/exit. Therefore, small parts of code have to be inserted into the application, which requires often a rebuild of the application. The following are the most commonly-used ways to generate event information: Compiler instrumentation inserts user-defined code snippets at the very beginning and ending of each function; Source-to-source instrumentation transforms the original application and inserts code snippets at points/regions of interest; Library instrumentation intercepts public functions of an external shared library by using a dlopen interception mechanism; CRESTA Consortium Partners 2011 Page 6 of 18

7 Binary instrumentation modifies the executable either at runtime or before program execution to insert code snippets at function entries and exits; and Manual instrumentation. The level of detail within event monitoring depends therefore on the events which should be monitored, their occurrence, and also duration. Using event-based monitoring can result in detailed information but in the same way the level of detail increases the intrusion which will become more and more critical, especially when tiny and often-used functions are monitored, e.g., constructors and static class methods. For millions of processing elements over a long monitoring period this monitoring technique can result in huge amounts of information. Recommendations in use: Monitoring of tiny functions or regions with short parts of interest, e.g. OpeMP regions with implicit barriers. Selective monitoring of routines of interest, e.g. if the user is only interested in the MPI communication event-based MPI monitoring allows to monitor only these routines. Basically, there are two main approaches to monitor the performance behaviour of parallel applications: profiling and tracing. Profiling aggregates the measurement information and generates statistics for the whole application run or for phases of interest. Flat profiles provide statistical information in a list style with various metrics like inclusive runtime and number of invocations. For a more detailed analysis, in particular to analyse performance in the context of caller-callee relationships, call-path and call-graph profiles are scalable techniques to provide more insight into highly complex and parallel applications. Profiling with its nature of summarization offers an opportunity to be extremely scalable, since the reduction of information can be done during the application runtime. Nevertheless, profiles may lack crucial information about message runtimes and bandwidth, since message matching is usually infeasible during profiling. Therefore, analysis of communication-based performance issues is usually only possible by interpreting the aggregated time spent in the communication routines. Recommendations in use: Profiling should be used to get an overview of the performance behaviour of highly parallel applications. Profiling may also help to identify potential performance problems since these issues or their effects are usually included in several performance indicators, e.g., occurrence and runtime information of communication routines can be used to identify potential communication issues. Identification of functions and regions of interest can be used to steer the upcoming monitor runs and to focus only on these parts of interest. For a detailed analysis of functions and parts of interest tracing should be used afterwards. Event tracing records each event of a parallel application in detail. Thus, it allows the dynamic interaction between thousands of concurrent processing elements to be captured and it is possible to identify outliers from the regular behaviour. As a result, tracing will produce an enormous amount of data and with this monitoring of long running applications is challenging. Recommendations in use: Detailed performance monitoring of functions and regions of interest. CRESTA Consortium Partners 2011 Page 7 of 18

8
9 This section gives a compact overview of potential performance issues that may occur during the application runtime. In addition, indicators, e.g. performance metrics, are provided that may help to decide whether an application suffers from an inherent performance problem or whether application interference may have been at the root of unsatisfactory behaviour. It also should help to get a first assessment regarding the nature of a potential performance problem and help to decide on further analysis steps using the most appropriate monitoring and analysis techniques. In general, it is highly application-dependent whether a metric is too high or low. Therefore, it is not possible to define any fixed thresholds and it is up to the user to interpret the data. The decision as to whether an application behaves inefficiently or not cannot be easily given. Often it is the sum of a multitude of factors and therefore it is advisable to identify essential parts of the application and to focus on important components of the code, e.g. communication, computation and I/O, first. After that, a hypothesis about potential performance problems can be created and checked. To identify a certain performance problem it is important to use well-suited monitoring techniques in combination with appropriate performance metrics to gain insight into the complex behaviour of the application. Performance issues originating from the interference between applications, e.g. reduced communication performance due to overall network saturation, are often only detectable by involving or comparing the global monitoring information of the entire machine with the application performance information. In general, communication as opposed to computation does not directly contribute to the calculation of results. Therefore, communication (which basically depends on the type and the number of communication routines, the size of the transferred data, and the communication scheme) should be minimized as much as possible and the fraction of time spent in communication routines like MPI kept low. Performance issue: The communication dominates the computation or the fraction of time spent in communication routines increases linearly or even worse with the number of processing elements. This usually results in limited scalability of the application. Performance metric(s): Exclusive time of communication routines. Performance technique: To identify this performance issue a profiling technique should be used first. Initially, a call-path profiling, e.g., from Scalasca (see A.1), should be used to identify which communication routines in which calling context are dominating the application runtime. After identification of the main problem(s) a more detailed analysis of the problem should be followed by using an event tracing approach that monitors the communication routines and finally can be analysed for example with Vampir s (see A.2) master timeline and function summary displays. The cause for an increased communication time can have various reasons. These can vary from load or communication imbalances that result in asymmetric communication behaviour and in increased waiting times to inefficient and non-scalable communication schemes and unsuitable communication routines. Also, the number and size of the data sent within the communication routines influences the communication time significantly. These problems (which are described in more detail in the following subsections) usually prevent scaling to larger processor counts and should therefore be eliminated. Load and communication imbalances typically result in an increased waiting time. Examples for performance issues for point-to-point messages with increased waiting time are the late-sender and the late-receiver problem. For each performance problem CRESTA Consortium Partners 2011 Page 9 of 18

10 one communication partner (either the sending or the receiving partner) arrives too late in the communication so that the other partner has to wait. An overview of communication performance issues can be found in [7] figure 2. The goal should be to identify load imbalances and to reduce the overall waiting time of the application either by using another communication scheme or an improved load balancing mechanism. Performance issue: Increased communication time due to load or communication imbalance. Performance metric(s): Minimum and maximum of the exclusive time spent in communication routines. Performance technique: A first indicator of load or communication imbalances can be identified with call-path profiling by comparing the minimum and maximum time spent in the several communication routines. Also, the automatic communication wait-state-analysis of Scalasca (see A.1) or tracing the application in combination with Vampir s (see A.2) master timeline can help to identify load imbalances within the application. The communication time of applications that rely on a huge number of small messages is influenced significantly by the latency of each message. This will limit the lower bound of the communication and in result also the scalability of the application. It is advisable to reduce the number of used messages and to pack multiple small messages into a larger message, if possible. Performance issue: The communication is dominated by a large number of small messages; network latency can be a limiting factor of applications scalability. Performance metric(s): Number of short messages, minimum message transfer time, message data rate. Performance technique: To identify scalability issues caused by a large number of small messages, a profiling technique, which is able to distinguish the size of messages can be used or a tracing approach that monitors the communication in combination with Vampir s (see A.2) communication matrix and message summary displays is suited to identify this kind of performance issue. In contrast, if the majority of messages are large, the limiting factor may be network bandwidth and with this the possibilities to decrease the communication time are limited. Opportunities are the use of other communication schemes or the reduction of the overall message data size. Performance issue: Increased communication time because the majority of messages are large and network bandwidth is a limiting factor. Performance metric(s): message data rate, message data volume. Performance technique: Communication performance issues of the application caused by the limited bandwidth of the network can be identified when the user knows the theoretical bandwidth of the network and uses a profiling technique that is able to provide information about the minimum, average, and maximum message data rate of a communication function in combination with the several message data size. Event tracing is also able to monitor the communication routines and Vampir provides the message data rates of different message size within its communication and message summary display. CRESTA Consortium Partners 2011 Page 10 of 18
: Minimum and maximum of the exclusive time spent in communication routines.")
11 A further performance issue that increases the communication time and decreases the scalability is the use of unnecessary consecutive synchronisation routines like barriers. The goal should be to identify unnecessary communication routines and to remove them. Performance issue: The application spent a lot of time in unnecessary synchronisation routines, e.g. barriers. Performance metric(s): Number of synchronisation calls, exclusive time spent in synchronisation routines. Performance technique: The occurrence of synchronisation routines can be identified initially with a call-path profiling from Scalasca (see A.1) and can be analysed in more detail with event tracing in combination with Vampir s (see A.2) master timeline and function summary displays. Finally, low communication performance may also be caused by application interference when multiple jobs that run simultaneously compete for the network. Investigating global monitoring information of the underlying network and comparing with the communication performance of the application can verify this. Some measurement infrastructures like Score-P, the monitoring system of Scalasca, Vampir, TAU and Periscope, allow for the inclusion of global monitoring information of the entire machine state and as a result this information can be visualized within the counter displays of Vampir (see A.2). Efficient usage of today s highly complex multi- and many-core processors is a key component for efficient and highly parallel applications. On one side the application should utilize the hardware efficiently, i.e. the pipelines of the hardware units should be almost always busy. On the other side highly complex memory hierarchies have to be considered. Increasing the efficiency of memory usage, i.e. by decreasing the number of memory data misses like cache misses, and providing enough instructions per data location, e.g. by avoiding sparse loops, can reduce performance issues in computation. Analysing the efficiency of hardware and memory usage can be done by almost every performance monitoring technique that allows monitoring of hardware performance counters. The techniques only differ in granularity of information. Most of the measurement tools use PAPI to request the hardware information. As a result this hardware performance information can tell how well the hardware and memory infrastructure of the underlying machine are utilized. Performance issue: Too many cycles per instruction more than the theoretical minimum can be caused be pipeline hazards or by the memory access latency. Performance metric(s): Number of instructions, Cycles per instruction. Performance issue: Inefficient usage of the memory hierarchy due to low locality. Performance metric(s): L1/L2/L3 hit and miss rates, Number of instructions. Performance issue: Increased computing time due to low floating-point performance. Performance metric(s): Floating-point operations per second, Floating-point instructions. In addition to the previously mentioned hardware utilization and memory access issues, an unbalanced computation caused, for example, by serial parts of the computation or CRESTA Consortium Partners 2011 Page 11 of 18

12 processes/threads that take longer to compute their parts ( single late comer ), results in idle processes and threads that decrease in the end the parallel efficiency of the computational part and may also affect the waiting time in communication routines. In general, I/O performance of an application highly dependents on the current load of the I/O subsystem and may change significantly between runs. This means thatdiagnosing an I/O bottleneck usually requires multiple runs and may affect also the tuning results. Typical I/O performance issues are I/O bandwidth bounded computation parts, slow I/O operations, sequential I/O on a single process, which mostly results in idle time for all other concurrent processing elements, and last but not least I/O load imbalance may affect the parallel efficiency of an application. Scalasca (see A.1) may help identify expensive I/O calls, while Vampir (see A.2) can be used to analyse I/O patterns and their performance in more detail. Global monitoring with load information of the file system can help to decide whether an application was disturbed by other applications or not. In the near future, it will be possible to add this information as external data within an application OTF2 trace file and finally it can be analysed with Vampir s (see A.2) counter timeline and performance radar displays. CRESTA Consortium Partners 2011 Page 12 of 18

13

14 [1] D. an Mey, S. Biersdorff, C. Bischof, K. Diethelm, D. Eschweiler, M. Gerndt, A. Knüpfer, D. Lorenz, A. D. Malony, W. E. Nagel, Y. Oleynik, C. Rössel, P. Saviankou, D. Schmidl, S.S. Shende, M. Wagner, B. Wesarg, and F. Wolf: Score-P: A Unified Performance Measurement System for Petascale Applications. In Proc. of the CiHPC: Competence in High Performance Computing, HPC Status Konferenz der Gauß-Allianz e.v., Schwetzingen, Germany, June 2010, pages Gauß-Allianz, Springer, [2] W. Nagel, M. Weber, H.-C. Hoppe, and K. Solchenbach. VAMPIR: Visualization and Analysis of MPI Resources. Supercomputer, 12(1):69 80, [3] M. Gerndt and M. Ott. Automatic Performance Analysis with Periscope. Concurrency and Computation: Practice and Experience, 22(6): , [4] M. Geimer, F. Wolf, B.J.N. Wylie, E. Ábrahám, D. Becker, B. Mohr: The Scalasca performance toolset architecture. Concurrency and Computation: Practice and Experience, 22(6): , April [5] S. Shende and A. D. Malony. The TAU Parallel Performance System. International Journal of High Performance Computing Applications, 20(2): , SAGE Publications. [6] D. Eschweiler, M. Wagner, M. Geimer, A. Knüpfer, W. E. Nagel, and F. Wolf: Open Trace Format 2 - The Next Generation of Scalable Trace Formats and Support Libraries. In Proc. of the Intl. Conference on Parallel Computing (ParCo), Ghent, Belgium, 2011, volume 22 of Advances in Parallel Computing, pages , IOS Press, [7] B. Mohr, A. Kühnal, M. Hermanns, and F. Wolf: Performance Analysis of Onesided Communication Mechanisms. In Proc. of the Conference on Parallel Computing (ParCo), Malaga, Spain, September 2005, Minisymposium Performance Analysis. CRESTA Consortium Partners 2011 Page 14 of 18
![of the CiHPC: Competence in High Performance Computing, HPC Status Konferenz der Gauß-Allianz e.v., Schwetzingen, Germany, June 2010, pages 85 97. Gauß-Allianz, Springer, 2012. [2] W. Nagel, M.](/docs-images/48/18574781/images/page_14.jpg "Weber, H.-C. Hoppe, and K. Solchenbach. VAMPIR: Visualization and Analysis of MPI Resources. Supercomputer, 12(1):69 80, 1996. [3] M. Gerndt and M. Ott. Automatic Performance Analysis with Periscope.")
15 Scalasca is a free software tool that supports the performance optimisation of parallel programs by measuring and analysing their runtime behaviour. The tool has been specifically designed for use on large-scale systems including IBM Blue Gene and Cray XE, but is also well suited for small- and medium-scale HPC platforms. The analysis identifies potential performance bottlenecks, in particular those concerning communication and synchronization. The user of Scalasca can choose between two different analysis modes: (i) performance overview on the call-path level via profiling and (ii) the analysis of wait-state formation via event tracing. Wait states often occur in the wake of load imbalance and are serious obstacles to achieving satisfactory performance. Performance-analysis results are presented to the user in an interactive explorer called Cube (Figure 3) that allows the investigation of the performance behaviour on different levels of granularity along the dimensions performance problem, call path, and process. The software has been installed at numerous sites in the world and has been successfully used to optimise academic and industrial simulation codes. Which call-paths in my program consume most of the time? Why is the time spent in communication or synchronisation higher than expected? Does my program suffer from load imbalance and why? Scalasca supports applications based on the programming interfaces MPI and OpenMP, including hybrid applications based on a combination of the two. Figure 3: Interactive exploration of performance behaviour in Scalasca along the dimensions performance metric (left), call tree (middle), and process topology (right). The analyses offered by Scalasca rest on profiles in the CUBE-4 format and event traces in the OTF-2 format. Both performance data formats can be generated using Score-P. Summary profile: The summary profile can be used to identify the most resourceintensive call paths or processes. It tells how the execution time and other performance CRESTA Consortium Partners 2011 Page 15 of 18
 performance overview on the call-path level via profiling and (ii) the analysis of wait-state formation via event tracing.")
16 metrics including hardware counters are distributed across the call tree and the set of processes or threads. Time-series profile: The time-series profile can be used to analyse how the performance behaviour evolves over time even if the application runs for a longer period. Essentially, a time-series profile provides a separate summary profile for every iteration of the main loop. Wait state analysis: This analysis extracts from event traces the location of wait states. Detected instances are both classified and quantified. High amounts of wait states usually indicate load or communication imbalance. Delay analysis: The delay analysis extends the wait-state analysis in that it identifies the root causes of wait states. It traces wait states back to the call paths causing them and determines the amount of waiting time a particular call path is responsible for. It considers both direct wait states and those created via propagation. Critical-path analysis: This trace-based analysis determines the effect of imbalance on program runtime. It calculates a set of compact performance indicators that allow users to evaluate load balance, identify performance bottlenecks, and determine the performance impact of load imbalance at first glance. The analysis is applicable to both SPMD and MPMD-style programs. User code is instrumented in source code (automatically by compiler or PDT instrumentor, or manually with macros or pragmas). OpenMP constructs are instrumented in source code (automatically by the OPARI2 instrumentation tool). MPI calls are intercepted automatically through library interposition. The software is available under the New BSD license. Website: Support scalasca@fz-juelich.de Quick reference guide: installation directory under $SCALASCA_ROOT/doc/manuals/QuickReference.pdf Scalasca user guide: installation directory under $SCALASCA_ROOT/doc/manuals/UserGuide.pdf CUBE user guide: installation directory under $CUBE_ROOT/doc/manuals/cube3.pdf Vampir is a graphical analysis framework that provides a large set of different chart representations of event-based performance data. These graphical displays, including timelines and statistics, can be used by developers to obtain a better understanding of their parallel program's inner working and to subsequently optimise it. See Figure 4 for a color-coded visualisation of a parallel application with the Vampir GUI. Vampir is designed to be an intuitive tool, with a GUI that enables developers to quickly display program behaviour at any level of detail. Different timeline displays show application activities and communication along a time axis, which can be zoomed and scrolled. Statistical displays provide quantitative results for the currently selected time interval. Powerful zooming and scrolling along the timeline and process/thread axis allows pinpointing the causes of performance problems. All displays have contextsensitive menus, which provide additional information and customisation options. Extensive filtering capabilities for processes, functions, messages or collective operations help to narrow down the information to the interesting spots. Vampir is based on Qt and is available for all major workstation operation systems as well as on most parallel production systems. The parallel version of Vampir, VampirServer, provides fast interactive analysis of ultra large data volumes. CRESTA Consortium Partners 2011 Page 16 of 18

17 Figure 4: Color-coded visualisation of a parallel application run with timeline and statistic displays of the Vampir GUI. What happens in my application execution during a given time in a given process or thread? How do the communication patterns of my application execute on a real system? Are there any imbalances in computation, I/O or memory usage and how do they affect the parallel execution of my application? Vampir supports applications based on the programming interfaces MPI and OpenMP, including hybrid applications based on a combination of the two. Furthermore Vampir also analyses hardware-accelerated applications using CUDA and/or OpenCL. The analyses offered by Vampir rest on event traces in the OTF/OTF-2 format generated by the runtime measurement system VampirTrace/Score-P. The timeline displays show the sequence of recorded events on a horizontal time axis that can be zoomed to any level of detail. They allow an in-depth analysis of the dynamic behaviour of an application. There are several types of timeline displays. Master timeline: This display shows the processes of the parallel program on the vertical axis. Point-to-point messages, global communication, as well as I/O operations are displayed as arrows. This allows for a very detailed analysis of the parallel program flow including communication patterns, load imbalances, and I/O bottlenecks. Process timeline: This display focuses on a single process only. Here, the vertical axis shows the sequence of events on their respective call-stack levels, allowing a detailed analysis of function calls. CRESTA Consortium Partners 2011 Page 17 of 18

18 Counter data timeline: This chart displays selected performance counters for processes aligned to the master timeline or the process timelines. This is useful to locate anomalies indicating performance problems. Performance radar timeline: This chart displays selected performance counters overall processes of the parallel program over time. This is useful to locate differences in the performance behaviour between the processes. The statistical displays are provided in addition to the timeline displays. They show summarised information according to the currently selected time interval in the timeline displays. This is the most interesting advantage over pure profiling data because it allows specific statistics to be shown for selected parts of an application, e.g., initialisation or finalisation, or individual iterations without initialisation and finalisation. Different statistical displays provide information about various program aspects, such as execution times of functions or groups, the function call tree, point-to-point messages, as well as I/O events. Application code can be instrumented by the compiler or with source-code modification (automatically by the PDT instrumentor, or manually using the VampirTrace/Score-P user API). OpenMP constructs can be instrumented by the OPARI tool using automatic source-to-source instrumentation. MPI calls are intercepted automatically through library interposition. Vampir is a commercial product distributed by GWT-TUD GmbH. For evaluation, a free demo version is available on the website. Website: Support service@vampir.eu Vampir manual: installation directory under $VAMPIR_ROOT/doc/vampirmanual.pdf CRESTA Consortium Partners 2011 Page 18 of 18

Unified Performance Data Collection with Score-P
 Unified Performance Data Collection with Score-P Bert Wesarg 1) With contributions from Andreas Knüpfer 1), Christian Rössel 2), and Felix Wolf 3) 1) ZIH TU Dresden, 2) FZ Jülich, 3) GRS-SIM Aachen Fragmentation
HOPSA Project. Technical Report. A Workflow for Holistic Performance System Analysis
 HOPSA Project Technical Report A Workflow for Holistic Performance System Analysis September 2012 Felix Wolf 1,2,3, Markus Geimer 2, Judit Gimenez 4, Juan Gonzalez 4, Erik Hagersten 5, Thomas Ilsche 6,
Application Performance Analysis Tools and Techniques
 Mitglied der Helmholtz-Gemeinschaft Application Performance Analysis Tools and Techniques 2012-06-27 Christian Rössel Jülich Supercomputing Centre c.roessel@fz-juelich.de EU-US HPC Summer School Dublin
Performance Analysis for GPU Accelerated Applications
 Center for Information Services and High Performance Computing (ZIH) Performance Analysis for GPU Accelerated Applications Working Together for more Insight Willersbau, Room A218 Tel. +49 351-463 - 39871
Improving Time to Solution with Automated Performance Analysis
 Improving Time to Solution with Automated Performance Analysis Shirley Moore, Felix Wolf, and Jack Dongarra Innovative Computing Laboratory University of Tennessee {shirley,fwolf,dongarra}@cs.utk.edu Bernd
Performance Analysis and Optimization Tool
 Performance Analysis and Optimization Tool Andres S. CHARIF-RUBIAL andres.charif@uvsq.fr Performance Analysis Team, University of Versailles http://www.maqao.org Introduction Performance Analysis Develop
Analysis report examination with CUBE
 Analysis report examination with CUBE Brian Wylie Jülich Supercomputing Centre CUBE Parallel program analysis report exploration tools Libraries for XML report reading & writing Algebra utilities for report
End-user Tools for Application Performance Analysis Using Hardware Counters
 1 End-user Tools for Application Performance Analysis Using Hardware Counters K. London, J. Dongarra, S. Moore, P. Mucci, K. Seymour, T. Spencer Abstract One purpose of the end-user tools described in
A Pattern-Based Approach to. Automated Application Performance Analysis
 A Pattern-Based Approach to Automated Application Performance Analysis Nikhil Bhatia, Shirley Moore, Felix Wolf, and Jack Dongarra Innovative Computing Laboratory University of Tennessee (bhatia, shirley,
How To Visualize Performance Data In A Computer Program
 Performance Visualization Tools 1 Performance Visualization Tools Lecture Outline : Following Topics will be discussed Characteristics of Performance Visualization technique Commercial and Public Domain
MAQAO Performance Analysis and Optimization Tool
 MAQAO Performance Analysis and Optimization Tool Andres S. CHARIF-RUBIAL andres.charif@uvsq.fr Performance Evaluation Team, University of Versailles S-Q-Y http://www.maqao.org VI-HPS 18 th Grenoble 18/22
Load Imbalance Analysis
 With CrayPat Load Imbalance Analysis Imbalance time is a metric based on execution time and is dependent on the type of activity: User functions Imbalance time = Maximum time Average time Synchronization
A Scalable Approach to MPI Application Performance Analysis
 A Scalable Approach to MPI Application Performance Analysis Shirley Moore 1, Felix Wolf 1, Jack Dongarra 1, Sameer Shende 2, Allen Malony 2, and Bernd Mohr 3 1 Innovative Computing Laboratory, University
Introduction to application performance analysis
 Introduction to application performance analysis Performance engineering We want to get the most science and engineering through a supercomputing system as possible. The more efficient codes are, the more
Performance analysis with Periscope
 Performance analysis with Periscope M. Gerndt, V. Petkov, Y. Oleynik, S. Benedict Technische Universität München September 2010 Outline Motivation Periscope architecture Periscope performance analysis
Score-P A Unified Performance Measurement System for Petascale Applications
 Score-P A Unified Performance Measurement System for Petascale Applications Dieter an Mey(d), Scott Biersdorf(h), Christian Bischof(d), Kai Diethelm(c), Dominic Eschweiler(a), Michael Gerndt(g), Andreas
Data Structure Oriented Monitoring for OpenMP Programs
 A Data Structure Oriented Monitoring Environment for Fortran OpenMP Programs Edmond Kereku, Tianchao Li, Michael Gerndt, and Josef Weidendorfer Institut für Informatik, Technische Universität München,
Scalable performance analysis of large-scale parallel applications
 Scalable performance analysis of large-scale parallel applications Brian Wylie & Markus Geimer Jülich Supercomputing Centre scalasca@fz-juelich.de April 2012 Performance analysis, tools & techniques Profile
A Pattern-Based Approach to Automated Application Performance Analysis
 A Pattern-Based Approach to Automated Application Performance Analysis Nikhil Bhatia, Shirley Moore, Felix Wolf, and Jack Dongarra Innovative Computing Laboratory University of Tennessee {bhatia, shirley,
Spring 2011 Prof. Hyesoon Kim
 Spring 2011 Prof. Hyesoon Kim Today, we will study typical patterns of parallel programming This is just one of the ways. Materials are based on a book by Timothy. Decompose Into tasks Original Problem
Tools for Analysis of Performance Dynamics of Parallel Applications
 Tools for Analysis of Performance Dynamics of Parallel Applications Yury Oleynik Fourth International Workshop on Parallel Software Tools and Tool Infrastructures Technische Universität München Yury Oleynik,
A Systematic Multi-step Methodology for Performance Analysis of Communication Traces of Distributed Applications based on Hierarchical Clustering
 A Systematic Multi-step Methodology for Performance Analysis of Communication Traces of Distributed Applications based on Hierarchical Clustering Gaby Aguilera, Patricia J. Teller, Michela Taufer, and
Recent Advances in Periscope for Performance Analysis and Tuning
 Recent Advances in Periscope for Performance Analysis and Tuning Isaias Compres, Michael Firbach, Michael Gerndt Robert Mijakovic, Yury Oleynik, Ventsislav Petkov Technische Universität München Yury Oleynik,
Performance Monitoring of Parallel Scientific Applications
 Performance Monitoring of Parallel Scientific Applications Abstract. David Skinner National Energy Research Scientific Computing Center Lawrence Berkeley National Laboratory This paper introduces an infrastructure
Automatic Tuning of HPC Applications for Performance and Energy Efficiency. Michael Gerndt Technische Universität München
 Automatic Tuning of HPC Applications for Performance and Energy Efficiency. Michael Gerndt Technische Universität München SuperMUC: 3 Petaflops (3*10 15 =quadrillion), 3 MW 2 TOP 500 List TOTAL #1 #500
High Performance Computing in Aachen
 High Performance Computing in Aachen Christian Iwainsky iwainsky@rz.rwth-aachen.de Center for Computing and Communication RWTH Aachen University Produktivitätstools unter Linux Sep 16, RWTH Aachen University
Integrating TAU With Eclipse: A Performance Analysis System in an Integrated Development Environment
 Integrating TAU With Eclipse: A Performance Analysis System in an Integrated Development Environment Wyatt Spear, Allen Malony, Alan Morris, Sameer Shende {wspear, malony, amorris, sameer}@cs.uoregon.edu
Online Performance Observation of Large-Scale Parallel Applications
 1 Online Observation of Large-Scale Parallel Applications Allen D. Malony and Sameer Shende and Robert Bell {malony,sameer,bertie}@cs.uoregon.edu Department of Computer and Information Science University
UTS: An Unbalanced Tree Search Benchmark
 UTS: An Unbalanced Tree Search Benchmark LCPC 2006 1 Coauthors Stephen Olivier, UNC Jun Huan, UNC/Kansas Jinze Liu, UNC Jan Prins, UNC James Dinan, OSU P. Sadayappan, OSU Chau-Wen Tseng, UMD Also, thanks
PART IV Performance oriented design, Performance testing, Performance tuning & Performance solutions. Outline. Performance oriented design
 PART IV Performance oriented design, Performance testing, Performance tuning & Performance solutions Slide 1 Outline Principles for performance oriented design Performance testing Performance tuning General
Petascale Software Challenges. William Gropp www.cs.illinois.edu/~wgropp
 Petascale Software Challenges William Gropp www.cs.illinois.edu/~wgropp Petascale Software Challenges Why should you care? What are they? Which are different from non-petascale? What has changed since
Parallel Scalable Algorithms- Performance Parameters
 www.bsc.es Parallel Scalable Algorithms- Performance Parameters Vassil Alexandrov, ICREA - Barcelona Supercomputing Center, Spain Overview Sources of Overhead in Parallel Programs Performance Metrics for
Uncovering degraded application performance with LWM 2. Aamer Shah, Chih-Song Kuo, Lucas Theisen, Felix Wolf November 17, 2014
 Uncovering degraded application performance with LWM 2 Aamer Shah, Chih-Song Kuo, Lucas Theisen, Felix Wolf November 17, 214 Motivation: Performance degradation Internal factors: Inefficient use of hardware
Parallel Programming Survey
 Christian Terboven 02.09.2014 / Aachen, Germany Stand: 26.08.2014 Version 2.3 IT Center der RWTH Aachen University Agenda Overview: Processor Microarchitecture Shared-Memory
Introduction to Cloud Computing
 Introduction to Cloud Computing Parallel Processing I 15 319, spring 2010 7 th Lecture, Feb 2 nd Majd F. Sakr Lecture Motivation Concurrency and why? Different flavors of parallel computing Get the basic
Scalability evaluation of barrier algorithms for OpenMP
 Scalability evaluation of barrier algorithms for OpenMP Ramachandra Nanjegowda, Oscar Hernandez, Barbara Chapman and Haoqiang H. Jin High Performance Computing and Tools Group (HPCTools) Computer Science
Contributions to Gang Scheduling
 CHAPTER 7 Contributions to Gang Scheduling In this Chapter, we present two techniques to improve Gang Scheduling policies by adopting the ideas of this Thesis. The first one, Performance- Driven Gang Scheduling,
Load Balancing In Concurrent Parallel Applications
 Load Balancing In Concurrent Parallel Applications Jeff Figler Rochester Institute of Technology Computer Engineering Department Rochester, New York 14623 May 1999 Abstract A parallel concurrent application
Trace-Based and Sample-Based Profiling in Rational Application Developer
 Trace-Based and Sample-Based Profiling in Rational Application Developer This document is aimed at highlighting the importance of profiling in software development and talks about the profiling tools offered
HPC Wales Skills Academy Course Catalogue 2015
 HPC Wales Skills Academy Course Catalogue 2015 Overview The HPC Wales Skills Academy provides a variety of courses and workshops aimed at building skills in High Performance Computing (HPC). Our courses
Analysis and Optimization of a Hybrid Linear Equation Solver using Task-Based Parallel Programming Models
 Available online at www.prace-ri.eu Partnership for Advanced Computing in Europe Analysis and Optimization of a Hybrid Linear Equation Solver using Task-Based Parallel Programming Models Claudia Rosas,
Search Strategies for Automatic Performance Analysis Tools
 Search Strategies for Automatic Performance Analysis Tools Michael Gerndt and Edmond Kereku Technische Universität München, Fakultät für Informatik I10, Boltzmannstr.3, 85748 Garching, Germany gerndt@in.tum.de
MPI and Hybrid Programming Models. William Gropp www.cs.illinois.edu/~wgropp
 MPI and Hybrid Programming Models William Gropp www.cs.illinois.edu/~wgropp 2 What is a Hybrid Model? Combination of several parallel programming models in the same program May be mixed in the same source
SECTION 4 TESTING & QUALITY CONTROL
 Page 1 SECTION 4 TESTING & QUALITY CONTROL TESTING METHODOLOGY & THE TESTING LIFECYCLE The stages of the Testing Life Cycle are: Requirements Analysis, Planning, Test Case Development, Test Environment
CHAPTER 1 INTRODUCTION
 1 CHAPTER 1 INTRODUCTION Exploration is a process of discovery. In the database exploration process, an analyst executes a sequence of transformations over a collection of data structures to discover useful
Review of Performance Analysis Tools for MPI Parallel Programs
 Review of Performance Analysis Tools for MPI Parallel Programs Shirley Moore, David Cronk, Kevin London, and Jack Dongarra Computer Science Department, University of Tennessee Knoxville, TN 37996-3450,
NVIDIA Tools For Profiling And Monitoring. David Goodwin
 NVIDIA Tools For Profiling And Monitoring David Goodwin Outline CUDA Profiling and Monitoring Libraries Tools Technologies Directions CScADS Summer 2012 Workshop on Performance Tools for Extreme Scale
A Brief Survery of Linux Performance Engineering. Philip J. Mucci University of Tennessee, Knoxville mucci@pdc.kth.se
 A Brief Survery of Linux Performance Engineering Philip J. Mucci University of Tennessee, Knoxville mucci@pdc.kth.se Overview On chip Hardware Performance Counters Linux Performance Counter Infrastructure
Sequential Performance Analysis with Callgrind and KCachegrind
 Sequential Performance Analysis with Callgrind and KCachegrind 4 th Parallel Tools Workshop, HLRS, Stuttgart, September 7/8, 2010 Josef Weidendorfer Lehrstuhl für Rechnertechnik und Rechnerorganisation
Performance Analysis of Web based Applications on Single and Multi Core Servers
 Performance Analysis of Web based Applications on Single and Multi Core Servers Gitika Khare, Diptikant Pathy, Alpana Rajan, Alok Jain, Anil Rawat Raja Ramanna Centre for Advanced Technology Department
A Review of Customized Dynamic Load Balancing for a Network of Workstations
 A Review of Customized Dynamic Load Balancing for a Network of Workstations Taken from work done by: Mohammed Javeed Zaki, Wei Li, Srinivasan Parthasarathy Computer Science Department, University of Rochester
Combining Instrumentation and Sampling for Trace-based Application Performance Analysis
 Combining Instrumentation and Sampling for Trace-based Application Performance Analysis Thomas Ilsche, Joseph Schuchart, Robert Schöne, and Daniel Hackenberg Abstract Performance analysis is vital for
How To Build A Supermicro Computer With A 32 Core Power Core (Powerpc) And A 32-Core (Powerpc) (Powerpowerpter) (I386) (Amd) (Microcore) (Supermicro) (
 And A 32-Core (Powerpc) (Powerpowerpter) (I386) (Amd) (Microcore) (Supermicro) (") TECHNICAL GUIDELINES FOR APPLICANTS TO PRACE 7 th CALL (Tier-0) Contributing sites and the corresponding computer systems for this call are: GCS@Jülich, Germany IBM Blue Gene/Q GENCI@CEA, France Bull Bullx
TECHNICAL GUIDELINES FOR APPLICANTS TO PRACE 7 th CALL (Tier-0) Contributing sites and the corresponding computer systems for this call are: GCS@Jülich, Germany IBM Blue Gene/Q GENCI@CEA, France Bull Bullx
BSC vision on Big Data and extreme scale computing
 BSC vision on Big Data and extreme scale computing Jesus Labarta, Eduard Ayguade,, Fabrizio Gagliardi, Rosa M. Badia, Toni Cortes, Jordi Torres, Adrian Cristal, Osman Unsal, David Carrera, Yolanda Becerra,
System Models for Distributed and Cloud Computing
 System Models for Distributed and Cloud Computing Dr. Sanjay P. Ahuja, Ph.D. 2010-14 FIS Distinguished Professor of Computer Science School of Computing, UNF Classification of Distributed Computing Systems
-------- Overview --------
 ------------------------------------------------------------------- Intel(R) Trace Analyzer and Collector 9.1 Update 1 for Windows* OS Release Notes -------------------------------------------------------------------
GPU System Architecture. Alan Gray EPCC The University of Edinburgh
 GPU System Architecture EPCC The University of Edinburgh Outline Why do we want/need accelerators such as GPUs? GPU-CPU comparison Architectural reasons for GPU performance advantages GPU accelerated systems
Overlapping Data Transfer With Application Execution on Clusters
 Overlapping Data Transfer With Application Execution on Clusters Karen L. Reid and Michael Stumm reid@cs.toronto.edu stumm@eecg.toronto.edu Department of Computer Science Department of Electrical and Computer
HPC enabling of OpenFOAM R for CFD applications
 HPC enabling of OpenFOAM R for CFD applications Towards the exascale: OpenFOAM perspective Ivan Spisso 25-27 March 2015, Casalecchio di Reno, BOLOGNA. SuperComputing Applications and Innovation Department,
Sequential Performance Analysis with Callgrind and KCachegrind
 Sequential Performance Analysis with Callgrind and KCachegrind 2 nd Parallel Tools Workshop, HLRS, Stuttgart, July 7/8, 2008 Josef Weidendorfer Lehrstuhl für Rechnertechnik und Rechnerorganisation Institut
Chapter 18: Database System Architectures. Centralized Systems
 Chapter 18: Database System Architectures! Centralized Systems! Client--Server Systems! Parallel Systems! Distributed Systems! Network Types 18.1 Centralized Systems! Run on a single computer system and
Making Multicore Work and Measuring its Benefits. Markus Levy, president EEMBC and Multicore Association
 Making Multicore Work and Measuring its Benefits Markus Levy, president EEMBC and Multicore Association Agenda Why Multicore? Standards and issues in the multicore community What is Multicore Association?
Programming models for heterogeneous computing. Manuel Ujaldón Nvidia CUDA Fellow and A/Prof. Computer Architecture Department University of Malaga
 Programming models for heterogeneous computing Manuel Ujaldón Nvidia CUDA Fellow and A/Prof. Computer Architecture Department University of Malaga Talk outline [30 slides] 1. Introduction [5 slides] 2.
CHAPTER 1 INTRODUCTION
 1 CHAPTER 1 INTRODUCTION 1.1 MOTIVATION OF RESEARCH Multicore processors have two or more execution cores (processors) implemented on a single chip having their own set of execution and architectural recourses.
160 Numerical Methods and Programming, 2012, Vol. 13 (http://num-meth.srcc.msu.ru) UDC 004.021
 UDC 004.021") 160 Numerical Methods and Programming, 2012, Vol. 13 (http://num-meth.srcc.msu.ru) UDC 004.021 JOB DIGEST: AN APPROACH TO DYNAMIC ANALYSIS OF JOB CHARACTERISTICS ON SUPERCOMPUTERS A.V. Adinets 1, P. A.
160 Numerical Methods and Programming, 2012, Vol. 13 (http://num-meth.srcc.msu.ru) UDC 004.021 JOB DIGEST: AN APPROACH TO DYNAMIC ANALYSIS OF JOB CHARACTERISTICS ON SUPERCOMPUTERS A.V. Adinets 1, P. A.
Introduction to the TAU Performance System
 Introduction to the TAU Performance System Leap to Petascale Workshop 2012 at Argonne National Laboratory, ALCF, Bldg. 240,# 1416, May 22-25, 2012, Argonne, IL Sameer Shende, U. Oregon sameer@cs.uoregon.edu
Performance Testing. Slow data transfer rate may be inherent in hardware but can also result from software-related problems, such as:
 Performance Testing Definition: Performance Testing Performance testing is the process of determining the speed or effectiveness of a computer, network, software program or device. This process can involve
Application Performance Analysis Tools and Techniques
 Mitglied der Helmholtz-Gemeinschaft Application Performance Analysis Tools and Techniques 2011-07-15 Jülich Supercomputing Centre c.roessel@fz-juelich.de Performance analysis: an old problem The most constant
GEDAE TM - A Graphical Programming and Autocode Generation Tool for Signal Processor Applications
 GEDAE TM - A Graphical Programming and Autocode Generation Tool for Signal Processor Applications Harris Z. Zebrowitz Lockheed Martin Advanced Technology Laboratories 1 Federal Street Camden, NJ 08102
Studying Code Development for High Performance Computing: The HPCS Program
 Studying Code Development for High Performance Computing: The HPCS Program Jeff Carver 1, Sima Asgari 1, Victor Basili 1,2, Lorin Hochstein 1, Jeffrey K. Hollingsworth 1, Forrest Shull 2, Marv Zelkowitz
PERFORMANCE TUNING OF PARALLEL REAL- TIME VOICE COMMUNICATION SOFTWARE
 PERFORMANCE TUNING OF PARALLEL REAL- TIME VOICE COMMUNICATION SOFTWARE Hermann Hellwagner, Klaus Leopold 1 ; Ralf Schlatterbeck, Carsten Weich 2 1 Institute of Information Technology, University Klagenfurt,
Private Public Partnership Project (PPP) Large-scale Integrated Project (IP)
 Large-scale Integrated Project (IP)") Private Public Partnership Project (PPP) Large-scale Integrated Project (IP) D9.4.2: Application Testing and Deployment Support Tools Project acronym: FI-WARE Project full title: Future Internet Core Platform
Private Public Partnership Project (PPP) Large-scale Integrated Project (IP) D9.4.2: Application Testing and Deployment Support Tools Project acronym: FI-WARE Project full title: Future Internet Core Platform
ParFUM: A Parallel Framework for Unstructured Meshes. Aaron Becker, Isaac Dooley, Terry Wilmarth, Sayantan Chakravorty Charm++ Workshop 2008
 ParFUM: A Parallel Framework for Unstructured Meshes Aaron Becker, Isaac Dooley, Terry Wilmarth, Sayantan Chakravorty Charm++ Workshop 2008 What is ParFUM? A framework for writing parallel finite element
Part I Courses Syllabus
 Part I Courses Syllabus This document provides detailed information about the basic courses of the MHPC first part activities. The list of courses is the following 1.1 Scientific Programming Environment
Running a Workflow on a PowerCenter Grid
 Running a Workflow on a PowerCenter Grid 2010-2014 Informatica Corporation. No part of this document may be reproduced or transmitted in any form, by any means (electronic, photocopying, recording or otherwise)
GPU Profiling with AMD CodeXL
 GPU Profiling with AMD CodeXL Software Profiling Course Hannes Würfel OUTLINE 1. Motivation 2. GPU Recap 3. OpenCL 4. CodeXL Overview 5. CodeXL Internals 6. CodeXL Profiling 7. CodeXL Debugging 8. Sources
Windows Server Performance Monitoring
 Spot server problems before they are noticed The system s really slow today! How often have you heard that? Finding the solution isn t so easy. The obvious questions to ask are why is it running slowly
Understanding applications using the BSC performance tools
 Understanding applications using the BSC performance tools Judit Gimenez (judit@bsc.es) German Llort(german.llort@bsc.es) Humans are visual creatures Films or books? Two hours vs. days (months) Memorizing
Analytics for Performance Optimization of BPMN2.0 Business Processes
 Analytics for Performance Optimization of BPMN2.0 Business Processes Robert M. Shapiro, Global 360, USA Hartmann Genrich, GMD (retired), Germany INTRODUCTION We describe a new approach to process improvement
An Implementation of the POMP Performance Monitoring Interface for OpenMP Based on Dynamic Probes
 An Implementation of the POMP Performance Monitoring Interface for OpenMP Based on Dynamic Probes Luiz DeRose Bernd Mohr Seetharami Seelam IBM Research Forschungszentrum Jülich University of Texas ACTC
The Evolution of Load Testing. Why Gomez 360 o Web Load Testing Is a
 Technical White Paper: WEb Load Testing To perform as intended, today s mission-critical applications rely on highly available, stable and trusted software services. Load testing ensures that those criteria
ScaAnalyzer: A Tool to Identify Memory Scalability Bottlenecks in Parallel Programs
 ScaAnalyzer: A Tool to Identify Memory Scalability Bottlenecks in Parallel Programs ABSTRACT Xu Liu Department of Computer Science College of William and Mary Williamsburg, VA 23185 xl10@cs.wm.edu It is
Vampir 7 User Manual
 Vampir 7 User Manual Copyright c 2011 GWT-TUD GmbH Blasewitzer Str. 43 01307 Dresden, Germany http://gwtonline.de Support / Feedback / Bugreports Please provide us feedback! We are very interested to hear
FAKULTÄT FÜR INFORMATIK. Automatic Characterization of Performance Dynamics with Periscope
 FAKULTÄT FÜR INFORMATIK DER TECHNISCHEN UNIVERSITÄT MÜNCHEN Dissertation Automatic Characterization of Performance Dynamics with Periscope Yury Oleynik Technische Universität München FAKULTÄT FÜR INFORMATIK
- An Essential Building Block for Stable and Reliable Compute Clusters
 Ferdinand Geier ParTec Cluster Competence Center GmbH, V. 1.4, March 2005 Cluster Middleware - An Essential Building Block for Stable and Reliable Compute Clusters Contents: Compute Clusters a Real Alternative
How To Monitor Performance On A Microsoft Powerbook (Powerbook) On A Network (Powerbus) On An Uniden (Powergen) With A Microsatellite) On The Microsonde (Powerstation) On Your Computer (Power
 On A Network (Powerbus) On An Uniden (Powergen) With A Microsatellite) On The Microsonde (Powerstation) On Your Computer (Power") A Topology-Aware Performance Monitoring Tool for Shared Resource Management in Multicore Systems TADaaM Team - Nicolas Denoyelle - Brice Goglin - Emmanuel Jeannot August 24, 2015 1. Context/Motivations
A Topology-Aware Performance Monitoring Tool for Shared Resource Management in Multicore Systems TADaaM Team - Nicolas Denoyelle - Brice Goglin - Emmanuel Jeannot August 24, 2015 1. Context/Motivations
1.1 Difficulty in Fault Localization in Large-Scale Computing Systems
 Chapter 1 Introduction System failures have been one of the biggest obstacles in operating today s largescale computing systems. Fault localization, i.e., identifying direct or indirect causes of failures,
Optimizing Shared Resource Contention in HPC Clusters
 Optimizing Shared Resource Contention in HPC Clusters Sergey Blagodurov Simon Fraser University Alexandra Fedorova Simon Fraser University Abstract Contention for shared resources in HPC clusters occurs
RevoScaleR Speed and Scalability
 EXECUTIVE WHITE PAPER RevoScaleR Speed and Scalability By Lee Edlefsen Ph.D., Chief Scientist, Revolution Analytics Abstract RevoScaleR, the Big Data predictive analytics library included with Revolution
Parallel Programming at the Exascale Era: A Case Study on Parallelizing Matrix Assembly For Unstructured Meshes
 Parallel Programming at the Exascale Era: A Case Study on Parallelizing Matrix Assembly For Unstructured Meshes Eric Petit, Loïc Thebault, Quang V. Dinh May 2014 EXA2CT Consortium 2 WPs Organization Proto-Applications
Experiences with Tools at NERSC
 Experiences with Tools at NERSC Richard Gerber NERSC User Services Programming weather, climate, and earth- system models on heterogeneous mul>- core pla?orms September 7, 2011 at the Na>onal Center for
Desktop Activity Intelligence
 Desktop Activity Intelligence Table of Contents Cicero Discovery Delivers Activity Intelligence... 1 Cicero Discovery Modules... 1 System Monitor... 2 Session Monitor... 3 Activity Monitor... 3 Business
Resource Utilization of Middleware Components in Embedded Systems
 Resource Utilization of Middleware Components in Embedded Systems 3 Introduction System memory, CPU, and network resources are critical to the operation and performance of any software system. These system
Integration and Synthess for Automated Performance Tuning: the SYNAPT Project
 Integration and Synthess for Automated Performance Tuning: the SYNAPT Project Nicholas Chaimov, Boyana Norris, and Allen D. Malony {nchaimov,norris,malony}@cs.uoregon.edu Department of Computer and Information
Centralized Systems. A Centralized Computer System. Chapter 18: Database System Architectures
 Chapter 18: Database System Architectures Centralized Systems! Centralized Systems! Client--Server Systems! Parallel Systems! Distributed Systems! Network Types! Run on a single computer system and do
Chapter 12: Multiprocessor Architectures. Lesson 01: Performance characteristics of Multiprocessor Architectures and Speedup
 Chapter 12: Multiprocessor Architectures Lesson 01: Performance characteristics of Multiprocessor Architectures and Speedup Objective Be familiar with basic multiprocessor architectures and be able to
CA Insight Database Performance Monitor for DB2 for z/os
 PRODUCT SHEET CA Insight Database Performance Monitor for DB2 for z/os CA Insight Database Performance Monitor for DB2 for z/os CA Insight Database Performance Monitor for DB2 for z/os (CA Insight DPM)
find model parameters, to validate models, and to develop inputs for models. c 1994 Raj Jain 7.1
 Monitors Monitor: A tool used to observe the activities on a system. Usage: A system programmer may use a monitor to improve software performance. Find frequently used segments of the software. A systems
Visualization Enables the Programmer to Reduce Cache Misses
 Visualization Enables the Programmer to Reduce Cache Misses Kristof Beyls and Erik H. D Hollander and Yijun Yu Electronics and Information Systems Ghent University Sint-Pietersnieuwstraat 41, Gent, Belgium
theguard! ApplicationManager System Windows Data Collector
 theguard! ApplicationManager System Windows Data Collector Status: 10/9/2008 Introduction... 3 The Performance Features of the ApplicationManager Data Collector for Microsoft Windows Server... 3 Overview