GEOL 5310 Advanced Igneous and Metamorphic Petrology Fall 09 Igneous Lab 2: Geochemical Plots of Igneous Rocks
|
|
|
- Hester O’Neal’
- 8 years ago
- Views:
Transcription
1 GEOL 5310 Advanced Igneous and Metamorphic Petrology Fall 09 Igneous Lab 2: Geochemical Plots of Igneous Rocks Objective: In this lab, we will become familiar with geochemical databases associated with various tectonic environments and how to portray that data on various geochemical plots using IGPET 2001 software. Procedure: Using geochemical databases from the web and those provided, you will be asked to evaluate the data by making a variety of geochemical plots commonly applied to igneous rocks. Part 1 Working with Data from Specific Tectonic Environment 1) Acquiring a Geochemical Database. There are a number of website that have been developed recently that seek to compile geochemical data for igneous rocks in a variety of tectonomagmatic environments. One of the best of these is the GEOROC website maintained by Max Plank Institute in Mainz, Germany ( mainz.gwdg.de/georoc/entry.html). a) Click on the link to Geologic Settings b) Choose one of the eleven geologic settings and then select a specific geological location. c) You will then be asked to further specify the what type of data you are seeking with your choices depending on the breadth of the database; continue on parsing your selection until requested to make a sample selection criteria d) Choose rock type and then select volcanic rocks e) When prompted to select chemical criteria, click the All box for major elements, trace elements, and REE f) At the metadata prompt, select standard output and download g) On the next page, click on Download the Table for Excel h) Open the downloaded.cvs file in Excel and save as an Excel workbook file. 2) Preparing a Data Table for Plotting in IGPET. IGPET has some basic requirements of data tables in order to plot geochem data. We will work with the data you downloaded from the GEOROC website to prepare it for plotting in IGPET. a) There are lots of ancillary information associated with each GEOROC analysis that is unnecessary for our purposes. Of the 27 or so attribute columns leading to the actual analyses, delete everything but the sample name and the rock name. For the data, delete all columns indicating analytical methods. b) There are also lots of data that are incomplete analyses. As a first pass, delete all analyses that do not have REE data; as a second pass, delete all analyses that do not have major element analyses. If you have more than 50 analyses after these two filters, you can delete more analyses until you whittle the total down to 50, but be sure to keep a good mix of different rock names. c) Resave your Excel spreadsheet. d) IGPET requires that the first four columns be 1) Sample, 2) Jcode, 3) Kcode, and 4) Lcode. Basically delete the work Name in the first cell in your spreadsheet so it just reads Sample. Then insert 3 columns after the sample columns and label the first row cells 1
 Acquiring a Geochemical Database.")
2 Jcode, Kcode, and Lcode. The code columns provide the opportunity to sort data by up to three criteria. We will sort the data by rock name using the Kcode. Asign a different number for each rock name (e.g., 1 basalt, 2 basaltic andesite, 3 andesite ). e) IGPET also is looking for standard oxides and elements in the first row. This requires that you delete any wt%, ppm, or similar tags on the composition headings. You will also need to convert all of your Fe analyses to FeO(total); to convert Fe2O3 to FeO, multiply by f) After the major element data, insert two columns. For these calculate the mg# and An% (both in mol%) from your major element data. Remember mg# = MgO/(FeOt+MgO)*100 and An% =CaO/(CaO+Na2O+K2O)*100. (Don t forget to divide your wt% values by the molecular weights of each oxide to get results that are in mol%) g) When you table is cleaned up, you should save it in Excel, then save it again as a Unicode text file, which is compatible with IGPET. 3) Making X Y (Harker) Plots in IGPET. We will now load our table into IGPET and make a variety of petrologically useful plots from this data. We will start with simple X Y Harker plots. a) Open IGPET b) Pull down the File menu and select Open File ; find the text file you saved of your GEOROC data and open it. c) To check on the data file, select File Operation from the File menu and click on Modify Data. The first four columns should again be 1) Sample, 2) Jcode, 3) Kcode, and 4) Lcode with your rock type attributes distinguished in the K code column. If OK, cancel. If not OK, go back to your Excel table and modify. d) From the Plot menu select XY. You will then be prompted to select among various compositional parameters for the X axis. We will use the standard parameter of SiO2. Then you will be prompted to select a Y axis parameter. Initially choose MgO. An SiO2 Mgo diagram should appear. (If the diagram doesn t show the lower part of the diagram, click Position from the Edit menu and choose Lndscp UR ). e) To discriminate the different rock types, select Symbols from the Edit menu. In the window, select the Kcode in the upper left. You may also need to refresh the symbols to see the types. If you want to reduce their size, click on New Size and reduce the default size (0.7) to a lower value. Close the window and different symbols should appear corresponding to your Kcode selections e) Save this plot as a Word Metafile (.wmf) by selecting Save diagram to wmf file diagram from the File menu (it will place it in the same folder as the data). Give it a name like Si Mg. f) Make more Harker diagrams for SiO2 vs. FeOt*, Al2O3, CaO, TiO2, K2O, and P2O5 and save them as WMF files. (*You want to plot total Fe, which may be as Fe2O3t or FeO+Fe2O3 which you can make as a new parameter when the menu in d) appears ). Compile your data into a series of stacked Harker plots in either Word or Illustrator. Draw regression lines showing the main trends of the data Comment on whether your data define a reasonable magma series as discussed in the lecture on Monday. If any inflections appear in your data trends, can you speculate as to a possible explanation (e.g. a change in the fractionating mineral assemblage)? If your data show significant scatter, can you proffer any explanations for that? 2
 After the major element data, insert two columns. For these calculate the mg# and An% (both in mol%) from your major element data.")
3 4) Making AFM Plots in IGPET. IGPET has a number of canned discrimination plots of well accepted petrologic significance. First you will determine whether you data are alkaline or subalkaline using an SiO2 Alkali plot. Then for the subalkaline data, you will use an Alkali Iron Magnesium (AFM) ternary plot to discriminate tholeiitic from calc alkaline magma series based on the work of Irvine and Baragar (1970). a) With your GEOROC data table loaded, select Diagrams from the Plot menu. b) This will open a window asking you to find a.dgm file. You will need to browse to the IGPET 2001 folder. Opening this, you will see several.dgm files; select the Irvbar.dgm file. c) A select diagram menu will pop up; select SiO2 alk alk vs subalk ; a ternary plot of your data should appear. Again, you may need to adjust the diagram position to see it entirely. d) Save this diagram as a wmf file. e) ID the samples that plot in the alkaline field; reopen your text file in Excel and assign those data plotting in the alkaline field an Lcode of 0; assign the subalkaline rocks an Lcode of 1. f) Select the Irvbar.dgm file again and this time select AFM thol vs. calc alk ; a ternary plot of your data should appear. From the edit menu, select symbols and have data sorted by the L code (you may also want to reduce the size of the symbols). This will then show the data that are subalkaline as large symbols and the alkaline data as small symbols. d) Save this diagram as a wmf file. Place all your figures in a word document and answer the questions below. Is your subalkaline data mostly tholeiitic or calc alkaline? Does this make sense knowing the tectonic environment of your data set? If you replot your data on the AFM diagram and discriminate by rock type (Kcode), do certain rock types tend to plot in one field or the other? Add a plot of this diagram to your Word document. 5) Tectonic Discrimination Diagrams in IGPET. IGPET also has various tectonic discrimination diagrams based on various trace element abundances and ratios. a) With your GEOROC data table loaded, again select Diagrams from the Plot menu; browse for the IGPET 2001 folder and this time select discrim.dgm b) This will open a select diagram window of displaying various discrimination diagrams. c) Plot your data on at least three different diagrams and save each as a wmf file. Place all your figures in a word document and comment on whether the indicated tectonic environments are consistent with the known tectonic environment of your data. Part 2 Comparing Data from Different Tectonomagmatic Environments with Spidergrams 1) Download Database From the class website, download the text file BSLT ANDST. This lists average compositions of primitive basalt compositions from various island arc (IAB) and continental arc (CAB) settings complied by Keleman et al. (2004). It also lists their average compositions for MORB, oceanic basalt (OIB), continental basalt (CFB), oceanic andesite (OA), continental andesites (CA) and oceanic bonninite (OBn). The text table is already formatted for being read into IGPET. 3
 With your GEOROC data table loaded, select Diagrams from the Plot menu. b) This will open a window asking you to find a.dgm file. You will need to browse to the IGPET 2001 folder.")
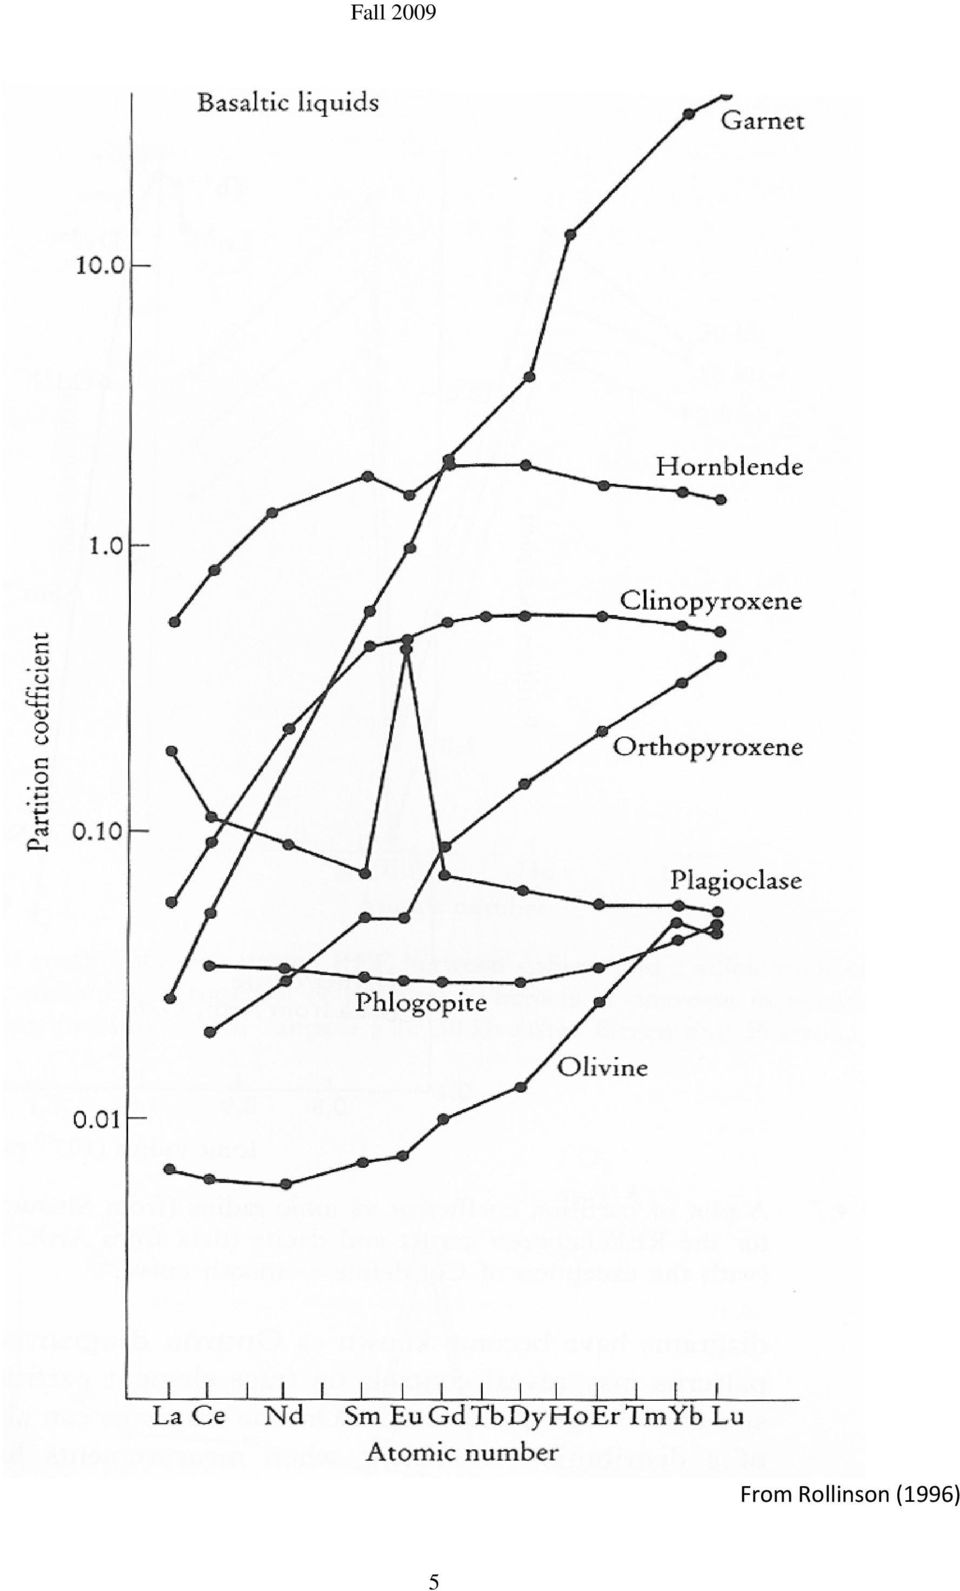
4 2) Make REE plots IGPET has several normalization data sets to create REE spider diagrams for you data. We will use the plots normalized to chondrites as determined by Sun and McDonough (1989). a) Open the BSLT ANDST text file in IGPET, then select Spider from the Plot menu; choose the first plot REEs Sun and McD chondrites b) The next window will ask you select specific samples to be plotted (double click to select). Assignment You should plot (and save as wmf files) the following data pairs: A) MORB, Avg Oceanic Basalt (OIB) B) Avg Oceanic Basalt (OIB), Avg Continental Basalt (CFB) C) Avg Oceanic Basalt (OIB), Avg Oceanic Andesite D) Avg Cont Basalt, Avg Aleutian Andesite E) Suite of Island Arc Basalts (IAB), Suite of Continental Arc Basalts (CAB) F) Avg Aleutian Andesite, Avg Boninite Andesite Paste the six plots into Word and comment on; 1) how the REE patterns differ from each other in terms of shape and enrichment relative to bulk earth (chondrite) composition, and 2) what minerals might be involved in the generation of the magmas either through partial melting or fractional crystallization. Realize that all of the basalt compositions are relatively primitive, such that their signatures may be most representative of partial melting processes, whereas andesitic compositions were like generated by fractionation of basalts. The figure on the next page may be helpful in this evaluation. Also, you should look into the origin of boninitic magma to evaluate Data Pair F. 3) Make Spidergram plots To compare a broader range of incompatible trace elements, we will plot spidergrams using Thompson (1982) element suite normalized to chondrite. a) Using the BSLT ANDST text file, select the Thompson, R.N., 1982 double chondrite Spider diagram. Assignment Again, make, save, and paste into Word, plots of the same six data pairs as for the REE Comment on the contrasting patterns and degrees of enrichment Point out any positive or negative anomalies 4
 the following data pairs: A) MORB, Avg Oceanic Basalt (OIB) B) Avg Oceanic Basalt (OIB), Avg Continental Basalt (CFB) C) Avg Oceanic Basalt (OIB),")
5 From Rollinson (1996) 5
PetroPlot, a plotting and data management tool set for Microsoft Excel. PetroPlot Tutorial
 PetroPlot, a plotting and data management tool set for Microsoft Excel Yongjun Su, Charles H. Langmuir Department of Earth and Environmental Sciences Columbia University Palisades, NY 10964 Paul D. Asimow
Igneous Geochemistry. What is magma? What is polymerization? Average compositions (% by weight) and liquidus temperatures of different magmas
 and liquidus temperatures of different magmas") 1 Igneous Geochemistry What is magma phases, compositions, properties Major igneous processes Making magma how and where Major-element variations Classification using a whole-rock analysis Fractional crystallization
1 Igneous Geochemistry What is magma phases, compositions, properties Major igneous processes Making magma how and where Major-element variations Classification using a whole-rock analysis Fractional crystallization
G 3. AN ELECTRONIC JOURNAL OF THE EARTH SCIENCES Published by AGU and the Geochemical Society
 Geosystems G 3 AN ELECTRONIC JOURNAL OF THE EARTH SCIENCES Published by AGU and the Geochemical Society Technical Brief Volume 4, Number 3 26 March 2003 1030, doi:10.1029/2002gc000323 ISSN: 1525-2027 PetroPlot:
Petros = Rock Ultimate source of all rocks Weathering erosion of pre-existing rocks
 GEOLOGY 326 INTRODUCTION TO PETROLOGY Igneous = Sedimentary = Metamorphic = Petros = Rock Ultimate source of all rocks Weathering erosion of pre-existing rocks Change in form The chemical and petrologic
What is a Mail Merge?
 NDUS Training and Documentation What is a Mail Merge? A mail merge is generally used to personalize form letters, to produce mailing labels and for mass mailings. A mail merge can be very helpful if you
Using Microsoft Excel to Plot and Analyze Kinetic Data
 Entering and Formatting Data Using Microsoft Excel to Plot and Analyze Kinetic Data Open Excel. Set up the spreadsheet page (Sheet 1) so that anyone who reads it will understand the page (Figure 1). Type
EXCEL Tutorial: How to use EXCEL for Graphs and Calculations.
 EXCEL Tutorial: How to use EXCEL for Graphs and Calculations. Excel is powerful tool and can make your life easier if you are proficient in using it. You will need to use Excel to complete most of your
Estimating a market model: Step-by-step Prepared by Pamela Peterson Drake Florida Atlantic University
 Estimating a market model: Step-by-step Prepared by Pamela Peterson Drake Florida Atlantic University The purpose of this document is to guide you through the process of estimating a market model for the
MICROSOFT EXCEL 2010 ANALYZE DATA
 MICROSOFT EXCEL 2010 ANALYZE DATA Microsoft Excel 2010 Essential Analyze data Last Edited: 2012-07-09 1 Basic analyze data... 4 Use diagram to audit formulas... 4 Use Error Checking feature... 4 Use Evaluate
MARS STUDENT IMAGING PROJECT
 MARS STUDENT IMAGING PROJECT Data Analysis Practice Guide Mars Education Program Arizona State University Data Analysis Practice Guide This set of activities is designed to help you organize data you collect
Volcanoes Around the Globe
 Volcanoes Around the Globe Volcanoes fed by relatively silica-rich (SiO 2 -rich) magmas tend to explode while those fed by silica-poor magmas usually erupt gently. Where are the explosive volcanoes and
UM Processes UM Processes and Reports UM Student Financials Process Daily Balancing Reports
 It is important and advisable to run daily balancing reports to ensure transactions to student accounts have been properly recorded. The myzou Daily Balancing Report, more commonly known as a D041, pulls
Using Excel as a Management Reporting Tool with your Minotaur Data. Exercise 1 Customer Item Profitability Reporting Tool for Management
 Using Excel as a Management Reporting Tool with your Minotaur Data with Judith Kirkness These instruction sheets will help you learn: 1. How to export reports from Minotaur to Excel (these instructions
II. Earth Science (Geology) Section (9/18/2013)
 Section (9/18/2013)") EAPS 100 Planet Earth Lecture Topics Brief Outlines II. Earth Science (Geology) Section (9/18/2013) 1. Interior of the Earth Learning objectives: Understand the structure of the Earth s interior crust,
EAPS 100 Planet Earth Lecture Topics Brief Outlines II. Earth Science (Geology) Section (9/18/2013) 1. Interior of the Earth Learning objectives: Understand the structure of the Earth s interior crust,
CONTENTS MANUFACTURERS GUIDE FOR PUBLIC USERS
 OPA DATABASE GUIDE FOR PUBLIC USERS - MARCH 2013 VERSION 5.0 CONTENTS Manufacturers 1 Manufacturers 1 Registering a Manufacturer 2 Search Manufacturers 3 Advanced Search Options 3 Searching for Manufacturers
SAP BusinessObjects Financial Consolidation Web User Guide
 SAP BusinessObjects Financial Consolidation Document Version: 10.0 Support Package 18 2016-02-19 SAP BusinessObjects Financial Consolidation Web User Guide Content 1 General user functions....12 1.1 To
A Guide to Using Excel in Physics Lab
 A Guide to Using Excel in Physics Lab Excel has the potential to be a very useful program that will save you lots of time. Excel is especially useful for making repetitious calculations on large data sets.
Figure 1. An embedded chart on a worksheet.
 8. Excel Charts and Analysis ToolPak Charts, also known as graphs, have been an integral part of spreadsheets since the early days of Lotus 1-2-3. Charting features have improved significantly over the
Making Visio Diagrams Come Alive with Data
 Making Visio Diagrams Come Alive with Data An Information Commons Workshop Making Visio Diagrams Come Alive with Data Page Workshop Why Add Data to A Diagram? Here are comparisons of a flow chart with
Quick Start Guide. Highly customizable automated trading Automate your trades according to rules and models you create.
 POWER E*TRADE PRO EXCEL MANAGER Quick Start Guide We are pleased to announce the launch of Excel Manager, an exciting new feature in Power E*TRADE Pro that leverages the flexibility of Microsoft Excel
Monthly Payroll to Finance Reconciliation Report: Access and Instructions
 Monthly Payroll to Finance Reconciliation Report: Access and Instructions VCU Reporting Center... 2 Log in... 2 Open Folder... 3 Other Useful Information: Copying Sheets... 5 Creating Subtotals... 5 Outlining
Microsoft Excel 2010 Pivot Tables
 Microsoft Excel 2010 Pivot Tables Email: training@health.ufl.edu Web Page: http://training.health.ufl.edu Microsoft Excel 2010: Pivot Tables 1.5 hours Topics include data groupings, pivot tables, pivot
Viscosity experiments: physical controls and implications for volcanic hazards. Ben Edwards Dept of Geology, Dickinson College
 Viscosity experiments: physical controls and implications for volcanic hazards Student Name: Ben Edwards Dept of Geology, Dickinson College OBJECTIVES OF LAB Learn about the rheological property called
SAS Add-In 2.1 for Microsoft Office: Getting Started with Data Analysis
 SAS Add-In 2.1 for Microsoft Office: Getting Started with Data Analysis The correct bibliographic citation for this manual is as follows: SAS Institute Inc. 2007. SAS Add-In 2.1 for Microsoft Office: Getting
Tutorial 2: Using Excel in Data Analysis
 Tutorial 2: Using Excel in Data Analysis This tutorial guide addresses several issues particularly relevant in the context of the level 1 Physics lab sessions at Durham: organising your work sheet neatly,
BMV-602 Data Link Manual
 BMV-602 Data Link Manual 1 Contents of the kit 1 x BMV-602 data link cable. 1 x Installation CD 2 System Requirements 2.1 Hardware requirements A BMV-602 with software version 2.03 or higher. A spare RS-232
Working together with Word, Excel and PowerPoint
 Working together with Word, Excel and PowerPoint Have you ever wanted your Word document to include data from an Excel spreadsheet, or diagrams you ve created in PowerPoint? This note shows you how to
Mail Merge Microsoft Word and Excel Queries Scott Kern Senior Consultant
 Mail Merge Microsoft Word and Excel Queries Scott Kern Senior Consultant What We ll Cover 1. Enabling database connections through Microsoft Excel 2. Accessing the data stored in the SQL Database via the
A Short Introduction to Eviews
 A Short Introduction to Eviews Note You are responsible to get familiar with Eviews as soon as possible. All homeworks are likely to contain questions for which you will need to use this software package.
BusinessObjects: General Report Writing for Version 5
 BusinessObjects: General Report Writing for Version 5 Contents 1 INTRODUCTION...3 1.1 PURPOSE OF COURSE...3 1.2 LEVEL OF EXPERIENCE REQUIRED...3 1.3 TERMINOLOGY...3 1.3.1 Universes...3 1.3.2 Objects...4
Guide to using Cumulus software (a.k.a., the Cumulus "client")
") Guide to using Cumulus software (a.k.a., the Cumulus "client") January 2012 Stanford Law School s images database is in Cumulus a digital asset manager made by Canto Software http://www.canto.com. Stanford
Guide to using Cumulus software (a.k.a., the Cumulus "client") January 2012 Stanford Law School s images database is in Cumulus a digital asset manager made by Canto Software http://www.canto.com. Stanford
Years after 2000. US Student to Teacher Ratio 0 16.048 1 15.893 2 15.900 3 15.900 4 15.800 5 15.657 6 15.540
 To complete this technology assignment, you should already have created a scatter plot for your data on your calculator and/or in Excel. You could do this with any two columns of data, but for demonstration
EENS 2120 Petrology Prof. Stephen A. Nelson Igneous Rocks of the Ocean Basins. The Ocean Basins
 Page 1 of 18 EENS 2120 Petrology Prof. Stephen A. Nelson Igneous Rocks of the This document last updated on 03-Feb-2011 The The ocean basins cover the largest area of the Earth's surface. Because of plate
Using the PDF for material identification using elemental data. from XRF and SEM EDS.
 XRF and SEM EDS Using the PDF for material identification using elemental data from XRF and SEM EDS. XRF and SEM EDS What? The Powder Diffraction File contains data on pure solid state compounds of well
ProExtra eclaiming User Guide
 ProExtra eclaiming User Guide Welcome to ProExtra eclaiming. You can use this system to submit claims to ProCare, for the services you have provided to patients referred to you by their GPs. You will need
Summary of important mathematical operations and formulas (from first tutorial):
:") EXCEL Intermediate Tutorial Summary of important mathematical operations and formulas (from first tutorial): Operation Key Addition + Subtraction - Multiplication * Division / Exponential ^ To enter a
EXCEL Intermediate Tutorial Summary of important mathematical operations and formulas (from first tutorial): Operation Key Addition + Subtraction - Multiplication * Division / Exponential ^ To enter a
How to Improve Solidworks Bill of Material Auto Population
 How to Improve Solidworks Bill of Material Auto Population Auto Population of Solidworks Bill of Materials: By Ed Thompson V1.0 10/15/2015 Setting up the auto population of bills of material (BOM) requires
Introduction to the TI-Nspire CX
 Introduction to the TI-Nspire CX Activity Overview: In this activity, you will become familiar with the layout of the TI-Nspire CX. Step 1: Locate the Touchpad. The Touchpad is used to navigate the cursor
Groundwater Chemistry
 Mapping and Modeling Groundwater Chemistry By importing Excel spreadsheets into ArcGIS 9.2 By Mike Price, Entrada/San Juan, Inc. In ArcGIS 9.2, Microsoft Excel spreadsheet data can be imported and used
Excel Tutorial. Bio 150B Excel Tutorial 1
 Bio 15B Excel Tutorial 1 Excel Tutorial As part of your laboratory write-ups and reports during this semester you will be required to collect and present data in an appropriate format. To organize and
Tutorial for proteome data analysis using the Perseus software platform
 Tutorial for proteome data analysis using the Perseus software platform Laboratory of Mass Spectrometry, LNBio, CNPEM Tutorial version 1.0, January 2014. Note: This tutorial was written based on the information
Instructions for Importing (migrating) Data
 Data") Instructions for Importing (migrating) Data from CTAS Version 7 to CTAS Version 8 For Windows 8 and 8.1 CTAS Version 8 is designed to work with your Version 7 data if you choose to. These instructions
Instructions for Importing (migrating) Data from CTAS Version 7 to CTAS Version 8 For Windows 8 and 8.1 CTAS Version 8 is designed to work with your Version 7 data if you choose to. These instructions
Use Mail Merge to create a form letter
 Use Mail Merge to create a form letter Suppose that you want to send a form letter to 1,000 different contacts. With the Mail Merge Manager, you can write one form letter, and then have Word merge each
Microsoft Excel Tutorial
 Microsoft Excel Tutorial by Dr. James E. Parks Department of Physics and Astronomy 401 Nielsen Physics Building The University of Tennessee Knoxville, Tennessee 37996-1200 Copyright August, 2000 by James
Sage Intelligence Reporting. Microsoft FRx to Sage Intelligence Report Designer Add-In Conversion Guide. Sage 100 ERP
 Sage Intelligence Reporting Microsoft FRx to Sage Intelligence Report Designer Add-In Conversion Guide Sage 100 ERP The software described in this document is protected by copyright, and may not be copied
MS Data Analysis I: Importing Data into Genespring and Initial Quality Control
 Homework: Session 2 GENESPRING MS ONLINE TRAINING SESSION 2 MS Data Analysis I: Importing Data into Genespring and Initial Quality Control Introduction and Lab Overview: If you need help during completion
EXCEL PIVOT TABLE David Geffen School of Medicine, UCLA Dean s Office Oct 2002
 EXCEL PIVOT TABLE David Geffen School of Medicine, UCLA Dean s Office Oct 2002 Table of Contents Part I Creating a Pivot Table Excel Database......3 What is a Pivot Table...... 3 Creating Pivot Tables
Spreadsheets and Laboratory Data Analysis: Excel 2003 Version (Excel 2007 is only slightly different)
") Spreadsheets and Laboratory Data Analysis: Excel 2003 Version (Excel 2007 is only slightly different) Spreadsheets are computer programs that allow the user to enter and manipulate numbers. They are capable
Spreadsheets and Laboratory Data Analysis: Excel 2003 Version (Excel 2007 is only slightly different) Spreadsheets are computer programs that allow the user to enter and manipulate numbers. They are capable
Working with Excel in Origin
 Working with Excel in Origin Limitations When Working with Excel in Origin To plot your workbook data in Origin, you must have Excel version 7 (Microsoft Office 95) or later installed on your computer
Acclipse Document Manager
 Acclipse Document Manager Administration Guide Edition 22.11.2010 Acclipse NZ Ltd Acclipse Pty Ltd PO Box 2869 PO Box 690 Level 3, 10 Oxford Tce Suite 15/40 Montclair Avenue Christchurch, New Zealand Glen
Using the Bulk Export/Import Feature
 Using the Bulk Export/Import Feature Through Bulksheet Export and Import, agencies have the ability to download complete campaign structures and statistics across multiple clients and providers, and to
Sales Person Commission
 Sales Person Commission Table of Contents INTRODUCTION...1 Technical Support...1 Overview...2 GETTING STARTED...3 Adding New Salespersons...3 Commission Rates...7 Viewing a Salesperson's Invoices or Proposals...11
Smart Web. User Guide. Amcom Software, Inc.
 Smart Web User Guide Amcom Software, Inc. Copyright Version 4.0 Copyright 2003-2005 Amcom Software, Inc. All Rights Reserved. Information in this document is subject to change without notice. The software
Lesson 07: MS ACCESS - Handout. Introduction to database (30 mins)
") Lesson 07: MS ACCESS - Handout Handout Introduction to database (30 mins) Microsoft Access is a database application. A database is a collection of related information put together in database objects.
Lesson 07: MS ACCESS - Handout Handout Introduction to database (30 mins) Microsoft Access is a database application. A database is a collection of related information put together in database objects.
Produced by Flinders University Centre for Educational ICT. PivotTables Excel 2010
 Produced by Flinders University Centre for Educational ICT PivotTables Excel 2010 CONTENTS Layout... 1 The Ribbon Bar... 2 Minimising the Ribbon Bar... 2 The File Tab... 3 What the Commands and Buttons
University of Southern California Marshall Information Services
 University of Southern California Marshall Information Services Determine Breakeven Price Using Excel - Using Goal Seek, Data Tables, Vlookup & Charts This guide covers how to determine breakeven price
Business Objects InfoView Quick-start Guide
 Business Objects InfoView Quick-start Guide Last Modified: 10/28/2015 The latest PDF version of this document can be found at: http://www.calpolycorporation.com/docs/finance/boeinfoviewquickstart.pdf What
ACCOUNT RECEIVABLES TABLE OF CONTENTS
 ACCOUNT RECEIVABLES TABLE OF CONTENTS 1. SETUP CUSTOMER...2 2. CUSTOMER LISTING...6 3. CUSTOMER INVOICE...7 4. CUSTOMER INVOICE LISTING...12 5. ENTER CREDITS / REFUNDS...14 6. CUSTOMER CREDITS LISTING...20
TIBCO Spotfire Business Author Essentials Quick Reference Guide. Table of contents:
 Table of contents: Access Data for Analysis Data file types Format assumptions Data from Excel Information links Add multiple data tables Create & Interpret Visualizations Table Pie Chart Cross Table Treemap
Using Excel in Research. Hui Bian Office for Faculty Excellence
 Using Excel in Research Hui Bian Office for Faculty Excellence Data entry in Excel Directly type information into the cells Enter data using Form Command: File > Options 2 Data entry in Excel Tool bar:
Tools for Excel Modeling. Introduction to Excel2007 Data Tables and Data Table Exercises
 Tools for Excel Modeling Introduction to Excel2007 Data Tables and Data Table Exercises EXCEL REVIEW 2009-2010 Preface Data Tables are among the most useful of Excel s tools for analyzing data in spreadsheet
Importing TSM Data into Microsoft Excel using Microsoft Query
 Importing TSM Data into Microsoft Excel using Microsoft Query An alternate way to report on TSM information is to use Microsoft Excel s import facilities using Microsoft Query to selectively import the
User Guide. November 2010
 User Guide November 2010 Table of Contents Contact information...4 Support from your AppShore account...4 Support from www.appshore.com...4 Support from the AppShore team...4 Logging into AppShore...5
Joomla! 2.5.x Training Manual
 Joomla! 2.5.x Training Manual Joomla is an online content management system that keeps track of all content on your website including text, images, links, and documents. This manual includes several tutorials
Council of Ontario Universities. COFO Online Reporting System. User Manual
 Council of Ontario Universities COFO Online Reporting System User Manual Updated September 2014 Page 1 Updated September 2014 Page 2 Table of Contents 1. Security... 5 Security Roles Defined in the Application...
E-mailing a large amount of recipients
 E-mailing a large amount of recipients DO NOT use the TO or CC field! If you have a large list of recipients you need to send an email you, you should never try sending one large email with all of the
Market Pricing Override
 Market Pricing Override MARKET PRICING OVERRIDE Market Pricing: Copy Override Market price overrides can be copied from one match year to another Market Price Override can be accessed from the Job Matches
Create a PivotTable or PivotChart report
 Page 1 of 5 Excel Home > PivotTable reports and PivotChart reports > Basics Create or delete a PivotTable or PivotChart report Show All To analyze numerical data in depth and to answer unanticipated questions
Electronic Ticket System
 UNIVERSITY OF GEORGIA Electronic Ticket System New Options Available as of January 2010 Insert the complete email address (valid UGA address only) instead of the UGA MyID to send tickets to Approvers.
Drawing a histogram using Excel
 Drawing a histogram using Excel STEP 1: Examine the data to decide how many class intervals you need and what the class boundaries should be. (In an assignment you may be told what class boundaries to
MIP Ad Hoc Reporting System (MARS) Training
 Training") MIP Ad Hoc Reporting System (MARS) Training 1 Overview of MIP Ad Hoc Reporting System Purpose Provide selected MIP users with the ability to create ad hoc reports on demand Pilot - Deployed Rapid Query
MIP Ad Hoc Reporting System (MARS) Training 1 Overview of MIP Ad Hoc Reporting System Purpose Provide selected MIP users with the ability to create ad hoc reports on demand Pilot - Deployed Rapid Query
Business Objects Enterprise version 4.1. Report Viewing
 Business Objects Enterprise version 4.1 Note about Java: With earlier versions, the Java run-time was not needed for report viewing; but was needed for report writing. The default behavior in version 4.1
RA MODEL VISUALIZATION WITH MICROSOFT EXCEL 2013 AND GEPHI
 RA MODEL VISUALIZATION WITH MICROSOFT EXCEL 2013 AND GEPHI Prepared for Prof. Martin Zwick December 9, 2014 by Teresa D. Schmidt (tds@pdx.edu) 1. DOWNLOADING AND INSTALLING USER DEFINED SPLIT FUNCTION
Introduction to Pivot Tables in Excel 2007
 The Company Rocks Introduction to Pivot Tables in Excel 2007 Step-by-step instructions to accompany video lessons Danny Rocks 4/11/2011 Introduction to Pivot Tables in Excel 2007 Pivot Tables are the most
Mitigation Planning Portal MPP Reporting System
 Mitigation Planning Portal MPP Reporting System Updated: 7/13/2015 Introduction Access the MPP Reporting System by clicking on the Reports tab and clicking the Launch button. Within the system, you can
Intellect Platform - Tables and Templates Basic Document Management System - A101
 Intellect Platform - Tables and Templates Basic Document Management System - A101 Interneer, Inc. 4/12/2010 Created by Erika Keresztyen 2 Tables and Templates - A101 - Basic Document Management System
www.auditexcel.co.za
 Spreadsheet Professional Quick Start Guide Contact Details Adrian Miric Mobile: +27 83 272 2552-1 - Introduction The aim of this document is too give you a quick introduction on using Spreadsheet Professional.
Installing S500 Power Monitor Software and LabVIEW Run-time Engine
 EigenLight S500 Power Monitor Software Manual Software Installation... 1 Installing S500 Power Monitor Software and LabVIEW Run-time Engine... 1 Install Drivers for Windows XP... 4 Install VISA run-time...
Excel Add-ins Quick Start Guide
 Excel Add-ins Quick Start Guide Contents Bloomberg - Excel Add-In... 2 Datastream - Excel Add-in... 9 FactSet - Excel Add-in... 13 Thomson Reuters Eikon - Excel Add-in... 19 Bloomberg - Excel Add-In Bloomberg
G 3. AN ELECTRONIC JOURNAL OF THE EARTH SCIENCES Published by AGU and the Geochemical Society
 Geosystems G 3 AN ELECTRONIC JOURNAL OF THE EARTH SCIENCES Published by AGU and the Geochemical Society Technical Brief Volume 6, Number 7 26 July 2005 Q07011, doi:10.1029/2005gc000932 ISSN: 1525-2027
Example 3: Predictive Data Mining and Deployment for a Continuous Output Variable
 Página 1 de 6 Example 3: Predictive Data Mining and Deployment for a Continuous Output Variable STATISTICA Data Miner includes a complete deployment engine with various options for deploying solutions
30. Excel Add-In Functions
 HSC 8 Excel Add-Ins 30. Excel Add-In Functions 14020-ORC-J 1 (11) 30.1. Getting started With HSC Add-In functions it is possible to use the HSC database directly under Microsoft Excel 97-2013 and in that
Budget Process using PeopleSoft Financial 9.1
 Section 14 Budget 14.1 Budget Overview Each council must prepare a yearly operating budget and, in many cases, multiple budgets to respond to the needs of the council and the legal requirement to expend
GEOL 101: Introduction to Geology
 GEOL 101: Introduction to Geology Course Overview Welcome to GEOL 101: Introduction to Geology! I'm Carrie Bartek, and I'll be your instructor for the course. In this course you will learn about the processes
STATGRAPHICS Online. Statistical Analysis and Data Visualization System. Revised 6/21/2012. Copyright 2012 by StatPoint Technologies, Inc.
 STATGRAPHICS Online Statistical Analysis and Data Visualization System Revised 6/21/2012 Copyright 2012 by StatPoint Technologies, Inc. All rights reserved. Table of Contents Introduction... 1 Chapter
Lecture 5. elements (Figure 1). In addition, there are many ways of classifying trace elements.
. In addition, there are many ways of classifying trace elements.") Lecture 5 Nomenclature for Trace Element Classification We have already grouped elements into two classes, major elements and trace elements (Figure 1). In addition, there are many ways of classifying
Lecture 5 Nomenclature for Trace Element Classification We have already grouped elements into two classes, major elements and trace elements (Figure 1). In addition, there are many ways of classifying
VALUE LINE INVESTMENT SURVEY ONLINE USER S GUIDE VALUE LINE INVESTMENT SURVEY ONLINE. User s Guide
 VALUE LINE INVESTMENT SURVEY ONLINE User s Guide Welcome to Value Line Investment Survey Online. This user guide will show you everything you need to know to access and utilize the wealth of information
Abstract. For notes detailing the changes in each release, see the MySQL for Excel Release Notes. For legal information, see the Legal Notices.
 MySQL for Excel Abstract This is the MySQL for Excel Reference Manual. It documents MySQL for Excel 1.3 through 1.3.6. Much of the documentation also applies to the previous 1.2 series. For notes detailing
DPL. Portfolio Manual. Syncopation Software, Inc. www.syncopation.com
 1 DPL Portfolio Manual Syncopation Software, Inc. www.syncopation.com Copyright 2009 Syncopation Software, Inc. All rights reserved. Printed in the United States of America. March 2009: First Edition.
Rock Cycle Part I Student Guide
 Rock Cycle Part I Student Guide Write your answers on the separate answer sheet provided. Introduction Why are there different kinds of rock on Earth? Earth rocks are recycled so that new rock is constantly
SECTION 5: Finalizing Your Workbook
 SECTION 5: Finalizing Your Workbook In this section you will learn how to: Protect a workbook Protect a sheet Protect Excel files Unlock cells Use the document inspector Use the compatibility checker Mark
Finance Reporting. Millennium FAST. User Guide Version 4.0. Memorial University of Newfoundland. September 2013
 Millennium FAST Finance Reporting Memorial University of Newfoundland September 2013 User Guide Version 4.0 FAST Finance User Guide Page i Contents Introducing FAST Finance Reporting 4.0... 2 What is FAST
Excel: Analyze PowerSchool Data
 Excel: Analyze PowerSchool Data Trainer Name Trainer/Consultant PowerSchool University 2012 Agenda Welcome & Introductions Organizing Data with PivotTables Displaying Data with Charts Creating Dashboards
Web Intelligence User Guide
 Web Intelligence User Guide Office of Financial Management - Enterprise Reporting Services 4/11/2011 Table of Contents Chapter 1 - Overview... 1 Purpose... 1 Chapter 2 Logon Procedure... 3 Web Intelligence
Excel 2003: Ringtones Task
 Excel 2003: Ringtones Task 1. Open up a blank spreadsheet 2. Save the spreadsheet to your area and call it Ringtones.xls 3. Add the data as shown here, making sure you keep to the cells as shown Make sure
Bulk Upload Tool (Beta) - Quick Start Guide 1. Facebook Ads. Bulk Upload Quick Start Guide
 - Quick Start Guide 1. Facebook Ads. Bulk Upload Quick Start Guide") Bulk Upload Tool (Beta) - Quick Start Guide 1 Facebook Ads Bulk Upload Quick Start Guide Last updated: February 19, 2010 Bulk Upload Tool (Beta) - Quick Start Guide 2 Introduction The Facebook Ads Bulk
Bulk Upload Tool (Beta) - Quick Start Guide 1 Facebook Ads Bulk Upload Quick Start Guide Last updated: February 19, 2010 Bulk Upload Tool (Beta) - Quick Start Guide 2 Introduction The Facebook Ads Bulk
Below is a very brief tutorial on the basic capabilities of Excel. Refer to the Excel help files for more information.
 Excel Tutorial Below is a very brief tutorial on the basic capabilities of Excel. Refer to the Excel help files for more information. Working with Data Entering and Formatting Data Before entering data
Using Word 2007 For Mail Merge
 Using Word 2007 For Mail Merge Introduction This document assumes that you are familiar with using Word for word processing, with the use of a computer keyboard and mouse and you have a working knowledge
Call Recorder Apresa User Manual
 Call Recorder Apresa User Manual Version. 1.000.10 Vidicode Call Recorder Apresa User Manual Vidicode 2010 1 Care and Maintenance Keep the CR Apresa dry. If it gets wet, wipe it dry immediately with a
MOLAR MASS AND MOLECULAR WEIGHT Themolar mass of a molecule is the sum of the atomic weights of all atoms in the molecule. Molar Mass.
 Counting Atoms Mg burns in air (O 2 ) to produce white magnesium oxide, MgO. How can we figure out how much oxide is produced from a given mass of Mg? PROBLEM: If If 0.200 g of Mg is is burned, how much