2. National Museum, Václavské náměstí 68, Praha 1, Czech Republic.
|
|
|
- Doris Kelly
- 8 years ago
- Views:
Transcription
1 This is author version of article published as: Frost, Ray L. and Cejka, Jiri and Ayoko, Godwin A. and Weier, Matt L. (2007) Raman spectroscopic and SEM analysis of sodium zippeite. Journal of Raman Spectroscopy 38(10):pp Copyright 2007 John Wiley & Sons Raman spectroscopic and SEM analysis of sodium zippeite Ray L. Frost 1*, Jiří Čejka 1,2, Godwin A. Ayoko 1 and Matt L. Weier 1 1. Inorganic Materials Research Program, School of Physical and Chemical Sciences, Queensland University of Technology, GPO Box 2434, Brisbane, Queensland 4001, Australia. 2. National Museum, Václavské náměstí 68, Praha 1, Czech Republic. Abstract Raman at 298 and 77 K and infrared spectra of two samples of sodium-zippeite were studied and interpreted. U-O bond lengths in uranyl were calculated and compared with those inferred from the X-ray single crystal structure data of a synthetic sodium-zippeite analog. Hydrogenbonding network in the studied samples is discussed. O-H O bond lengths were calculated and compared with those predicted from the X-ray single crystal structure analysis. Key words: sodium-zippeite, uranyl mineral, Raman and infrared spectroscopy, U-O bond lengths in uranyl, hydrogen-bonding network Introduction Uranyl sulfates of the zippeite group are common constituents in the oxidized zone of uranium deposits 1,2. Zippeites may impact upon the mobility of uranium and heavy metals in mine tailings and may form in a geological repository for nuclear waste such as results from spent nuclear fuel. Uranyl sulfates may determine the mobility and fate of uranium in natural systems. These uranyl sulfates are also important as alteration products of nuclear waste. They may incorporate radionuclides into their crystal structure, thus impacting the mobility of some radionuclides 2. Uranyl sulfate minerals are not abundant, however, they are widespread, occurring in uranium deposits worldwide. The uranyl sulfate minerals including zippeites originate and are formed as a result of the oxidation of sulfide minerals connected with the formation of sulfate anions in the presence of hexavalent uranium in the form of uranyl ions, (UO 2 ) Uranyl minerals of the zippeite-group have been poorly-defined for many years 3-5. Very few spectroscopic studies have been undertaken even though Raman spectroscopy has been applied to other minerals containing the uranyl group It is presumed that the zippeite minerals are simple hydrated uranyl sulfates. Frondel and Weeks first showed that these minerals are not simple hydrated uranyl sulfates, but in fact each contain a cation in addition to the uranyl ion 4. Desription and comparison of natural samples with their synthetic 1

2 analogues were published in 1976 by Frondel et al. 5. Chemical composition, refractive indices and X-ray powder patterns were included in this paper. However, some confusions in these results were observed. O Brien and Williams 12 and Haacke and Williams 13 presented ΔG o f values for synthetic K-, (NH 4 )-, Na-, Mg-, Ni-, Co- and Zn-zippeites and assumed extensive solid solution formation between divalent cation containg zippeites, between K- and (NH 4 )-zippeites, but not between K- and Na-zippeites. Extensive crystallochemical and structural study of synthetic zippeites was recently published by Burns et al. 14 followed by a dissertation describing in detail some natural zippeites 2. Both authors found the layered zippeites are topologically identical. The sheet contains zig-zag chains of edge-sharing uranyl pentagonal dipyramids, and the chains are connected by the sharing of vertices between the uranyl pentagonal dipyramids and sulfate tetrahedra. Each sulfate tetrahedron is linked to four different uranyl dipyramids 15. The sheet is made up of chains of uranyl pentagonal dipyramids that are two polyhedra wide. The chains are crosslinked through (SO 4 ) 2- tetrahedra, resulting in uranyl sulfate sheets. The composition of the sheet is dependant upon the distribution of (O 2- )/(OH) - in each zippeite phase 2. The uranyl sulfate sheets are in some cases (e.g. Mg-, Zn-, Co-, (NH 4 )-zippeites) anhydrous, [(UO 2 ) 2 (SO 2 )O 2 ], or oxy anions may be partly substituted by hydroxyls e. g. in zippeite (the name zippeite proposed by Frondel for K-zippeite from Jáchymov, studied by Nováček in , [(UO 2 ) 4 (SO 4 ) 2 O 3 (OH)], or in sodium-zippeite, [(UO 2 ) 4 (SO 4 ) 4 O 5 (OH) 3 )] 14,15. Burns et al. 14 concluded that the distribution of interlayer constituents, i.e. mono- and divalent cations and water molecules can be rationalized on the basis of the bonding requirements of the uranyl sulfate sheets 15. It may be assumed that the (UO 2 )/(SO 4 ) 2- molar ratio in the layers is probably close to 2 with some variability in the O/OH ratio. However, McCollam 2 proved that practically in all analysed natural zippeites the molar ratio M + (M 2+ )/(UO 2 ) 2+ /(SO 4 ) 2- was lower than expected from the stoichiometry. The interlayer is open and able to include monovalent and divalent cations for balancing the charge of the layers together with water molecules. Hydrogen-bonding network plays also an important role for the origin and stability of zippeites. Frondel et al. 5 attributed to natural and synthetic sodium-zippeite the formula Na 4 [(UO 2 ) 6 (SO 4 ) 3 (OH) 10 ]. 4H 2 O. According to Burns et al. 14, the formula for synthetic sodium-zippeite is Na 5 (H 2 O) 12 [(UO 2 ) 8 (SO 4 ) 4 O 5 (OH) 3 ] with Z = 4, 8 symmetrically distinct U 6+ atoms (one UO 2 O 5, five UO 2 O 4 (OH) and two UO 2 O 3 (OH) 2 ) and four symetrically distinct S 6+ atoms. Each (OH) - group is bonded to two U 6+ cations, and is located at a common equatorial vertex. In Na-zippeite, there are three symmetrically distinct (OH) - groups, two of which occur along a shared edge between uranyl pentagonal dipyramids 14. The presence of some U x (O,OH) y groupings was assumed and proved in the crystal structure of synthetic Na-zippeite. In the interlayer, Na cations are coordinated by six or seven ligands (O uranyl atoms and/or O U-S atoms and/or water molecules). Five Na cations and twelve water molecules form a complex interlayer in synthetic Na-zippeite. Eight water molecules are shared between two Na + cations and four are bonded to only one Na + cation. The interlayer of the synthetic Na-zippeite contains also a substantial number of hydrogen bonds thus forming a complex hydrogen-bonding network 14. It has been shown that the uranyl sulfate sheet topology is very similar in all zippeitetype minerals and their synthetic analogues 14,16,17. However, the relatively large interlayer enables complex localization of monovalent and/or divalent cations and the formation of solid solutions, and of water molecules. Water molecules may be coordinated by cations or only hydrogen bonded. McCollam 2 assumes possible existence of solid solutions of zippeites containing monovalent cations Na +, K + and (NH 4 ) +, and may also contain divalent cations. 2
-zippeites, but not between K- and Na-zippeites.")
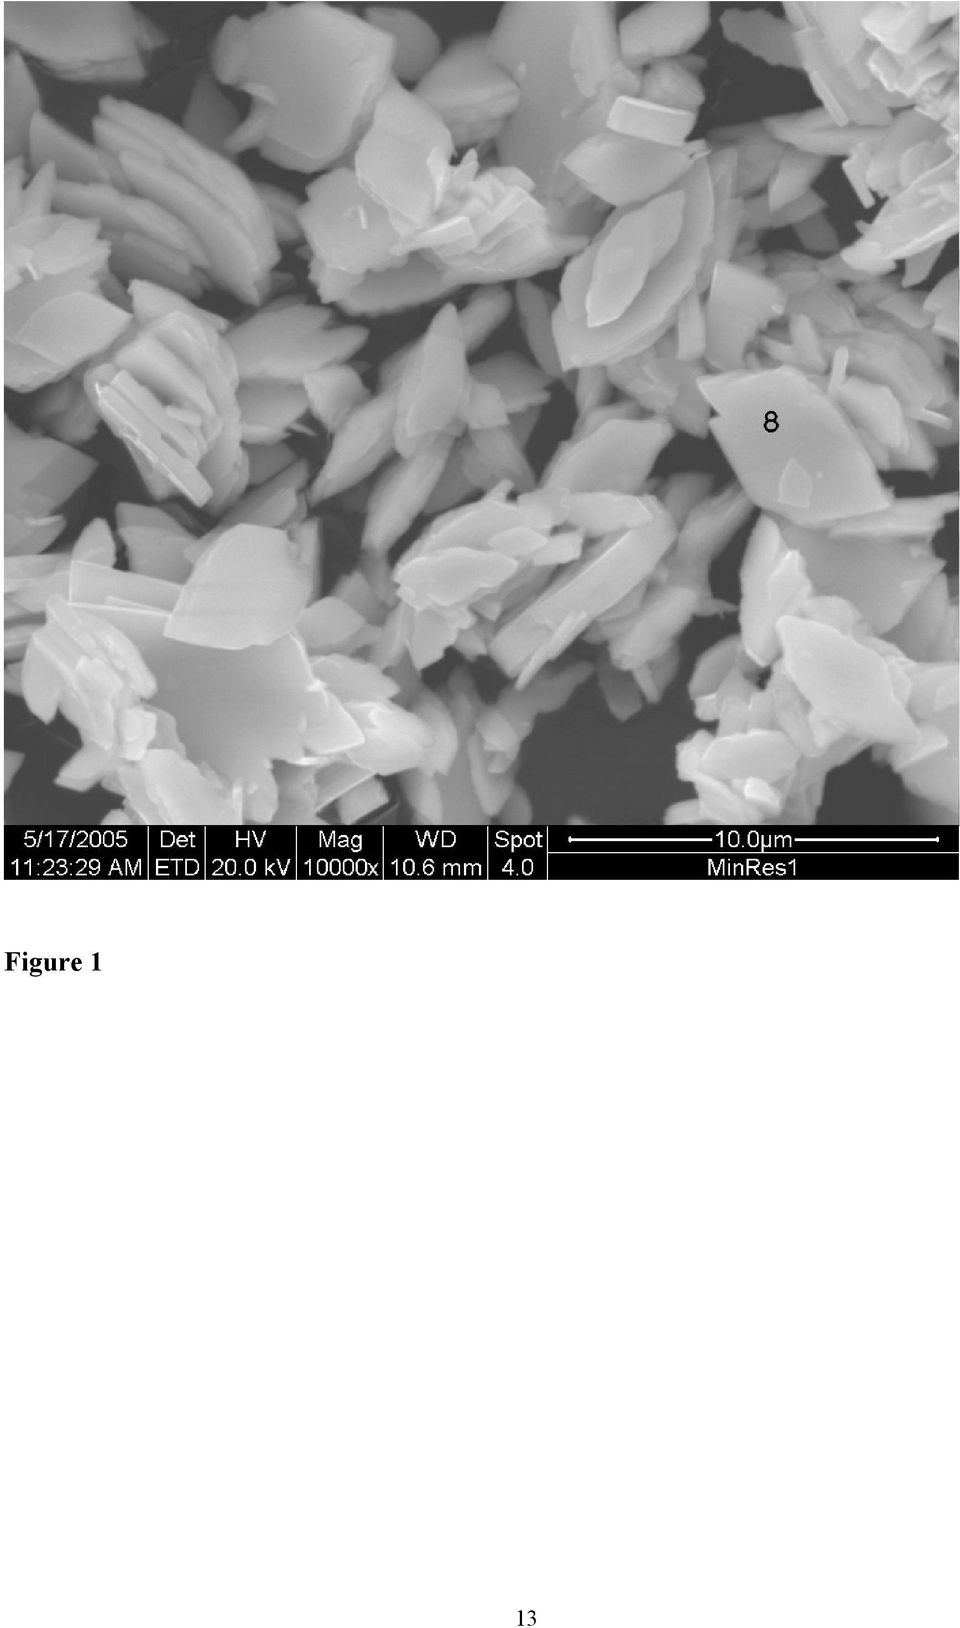
3 Water molecules from the interlayer and hydroxyls in the sheets participate in formation of a very complex hydrogen-bonding network in Na-zippeite 14. Sodium-zippeite was described from Jáchymov, Czech Republic 18, Geevor mine, St. Just, Cornwall, England 19 Rožná, Czech Republic 20 La Creusaz uranium prospect, Switzerland 21, Jánská žíla, Březové Hory, Příbram, Czech Republic 22. Infrared spectra and thermal analysis of natural and synthetic zippeites were reviewed by Čejka 23. Raman spectroscopy has proven very useful for the study of minerals Indeed Raman spectroscopy has proven most useful for the study of diagentically related minerals as often occurs with uranyl secondary minerals 7-10,27. Some previous studies have been undertaken by the authors using Raman spectroscopy to study complex secondary minerals formed by crystallisation from concentrated sulphate solutions 28. The aim of this paper is to present Raman and infrared spectra of natural sodium-zippeite and to discuss the spectra from the structural point of view. The paper is a part of systematic studies of vibrational spectra of minerals of secondary origin in the oxide supergene zone and their synthetic analogs. Experiments Minerals The Na-zippeite minerals used in this work were obtained from the Mineralogical research Company and originated from The Happy Jack Mine, White Canyon District, San Juan County, USA. The mineral was analysed by EDX for chemical compoistion and by powder X-ray diffraction for phase identification. SEM and X-ray microanalysis Zippeite samples were coated with a thin layer of evaporated carbon and secondary electron images were obtained using an FEI Quanta 200 scanning electron microscope (SEM). For X-ray microanalysis (EDX), three samples were embedded in Araldite resin and polished with diamond paste on Lamplan 450 polishing cloth using water as a lubricant. The samples were coated with a thin layer of evaporated carbon for conduction and examined in a JEOL 840A analytical SEM at 25kV accelerating voltage. Preliminary analyses of the zippeite samples were carried out on the FEI Quanta SEM using an EDAX microanalyser, and microanalysis of the clusters of fine crystals was carried out using a full standards quantitative procedure on the JEOL 840 SEM using a Moran Scientific microanalysis system. Uranium oxide was used as a standard for U. The K-Kα peak is strongly overlapped by the U-M lines and was deconvolved using a peak strip routine, which gave similar results to a peak fit routine used by the EDAX analysis software. However some uncertainty remains in the quantitative measurements of K in the presence of U. Oxygen was not measured directly but was calculated using assumed stoichiometries to the other elements analysed. Raman spectroscopy Crystals of the sodium zippeite were placed on the stage of an Olympus BHSM microscope, equipped with 10x and 50x objectives and part of a Renishaw 1000 Raman microscope system, which also includes a monochromator, a filter system and a Charge Coupled Device (CCD). Raman spectra were excited by a HeNe laser (633 nm) at a resolution of 2 cm -1 in the range between 100 and 4000 cm -1. Repeated acquisition using the highest magnification was accumulated to improve the signal to noise ratio. Spectra were calibrated 3

4 using the cm -1 line of a silicon wafer. In order to ensure that the correct spectra are obtained, the incident excitation radiation was scrambled. Previous studies by the authors provide more details of the experimental technique. Spectra at liquid nitrogen temperature were obtained using a Linkam thermal stage (Scientific Instruments Ltd, Waterfield, Surrey, England). Details of the technique have been published by the authors Infrared Spectroscopy Infrared spectra were obtained using a Nicolet Nexus 870 FTIR spectrometer with a smart endurance single bounce diamond ATR cell. Spectra over the cm -1 range were obtained by the co-addition of 64 scans with a resolution of 4 cm -1 and a mirror velocity of cm/s. Spectral manipulation such as baseline adjustment, smoothing and normalisation was performed using the GRAMS software package (Galactic Industries Corporation, Salem, NH, USA). Results and discussion Scanning Electron Microscopy The SEM image of the Na zippeite studied in this work is shown in Figures 1. The numbers on the image show the points where EDX analyses were undertaken. Figure 1 shows a mass of crystals agglomerated together. The crystals appear to have been formed in solution as a colloid and possibly because of electrostatic attraction have assembled into a crystalline mass. The agglomerated crystals are > 5 µm in length. Figure 1 shows the close relationship between different single crystals and several edge to face and face to face stacking may be observed. Such stacking supports the concept of electrostatic attraction between the particles. Figure 1 seems to show the particles have been damaged through some mechanochemical treatment such as a tumbling action. Many of the crystals are large and greater than 10 microns. SEM images reveal that the zippeite morphology consists of an array of rosettes of flat elongated crystals. The rosettes may be up to 50 µm in diameter while individual crystals are up to 20 µm in length and less than 0.5 µm in thickness. The results of the EDX analyses of the zippeite are reported in Table 1. The analyses are taken from different crystals. The presence of carbon results from the coating of the sample. The zippeite from The Happy Jack Mine are based upon sodium as the monovalent cation. Thus the formula of the zippeite samples studied is close to that for synthetic Na-zippeite by Burns et al. 14. In Dana s new mineralogy and Anthony s Handbook, a number of zippeites are characterised. One of the minerals among others from The Happy Jack Mine is a sodium zippeite. Both report the Na-zippeite to be orthorhombic 33. It is noted that a synthetic sodium-zippeite as prepared by Burns 14, Na 5 (H 2 O) 12 [(UO 2 ) 8 (SO 4 ) 4 O 5 (OH) 3 ], was monoclinic, P2 1 /a, a (110, b (9), c (11) Å, β (1) o, Z = 4. Raman and Infrared Spectroscopy In the crystal structure of synthetic Na zippeite, there are present four symmetrically distinct S 6+ [as (SO 4 ) 2- units]. Because of the Td symmetry lowering, all (SO 4 ) 2- vibrations may be infrared and Raman active, and the doubly degenerate ν 2 (SO 4 ) 2- bending vibrations, the triply degenerate antisymmetric stretching vibrations ν 3 (SO 4 ) 2- and the triply degenerate 4

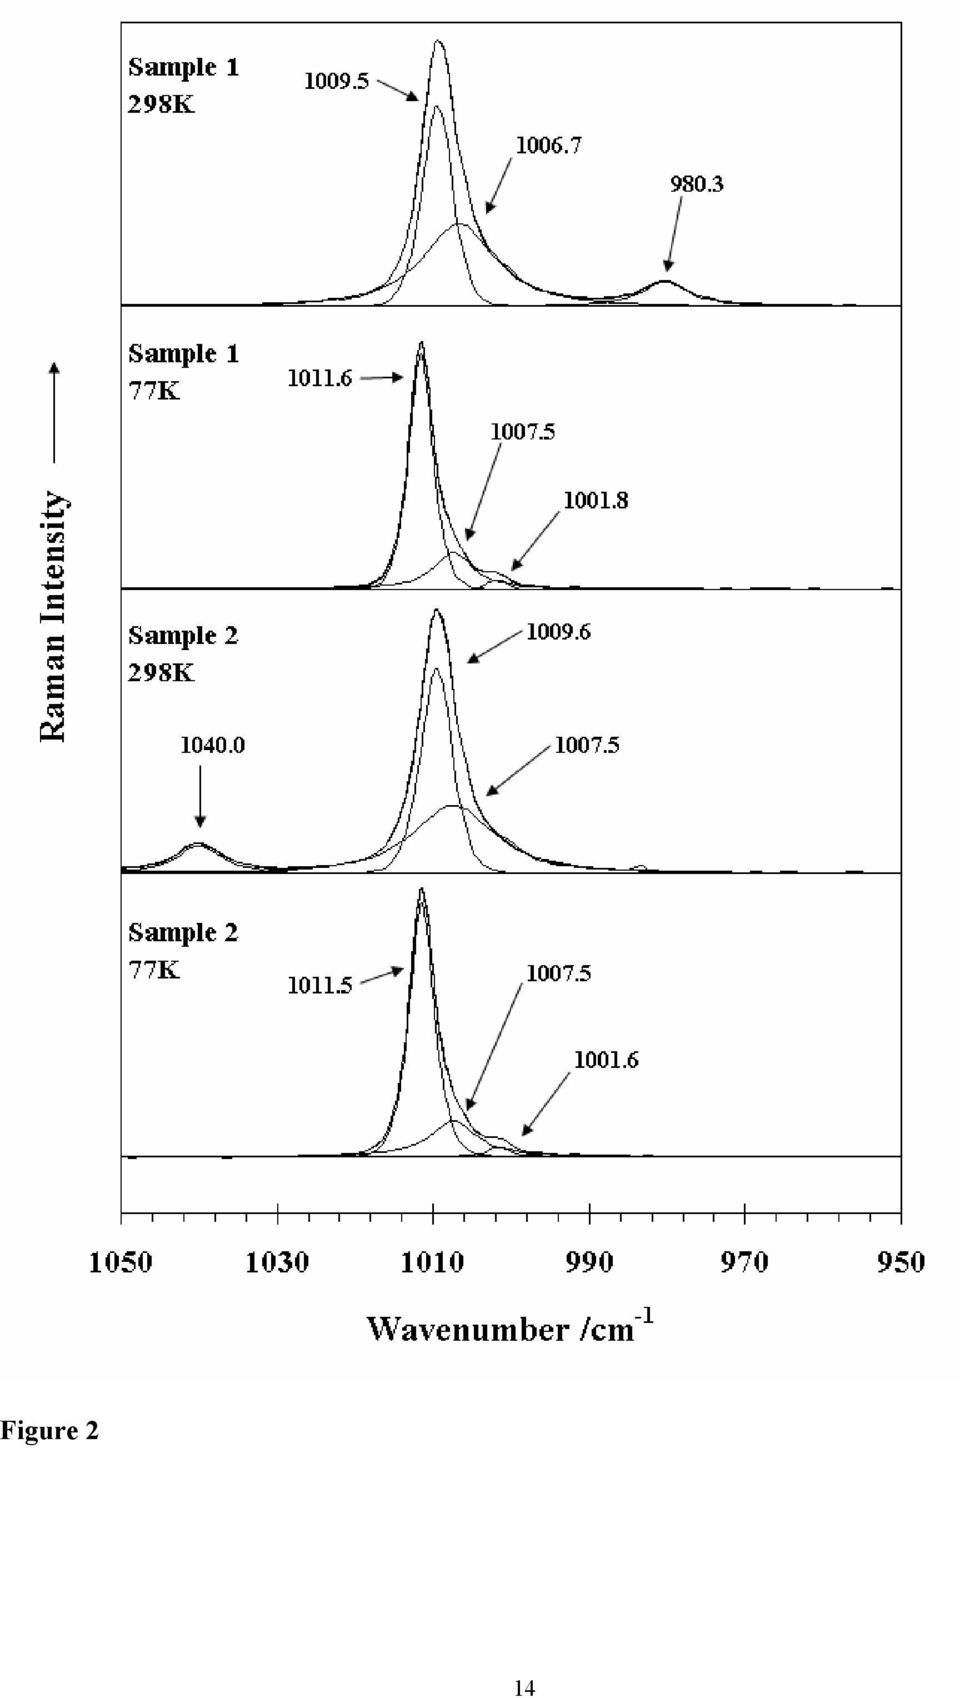
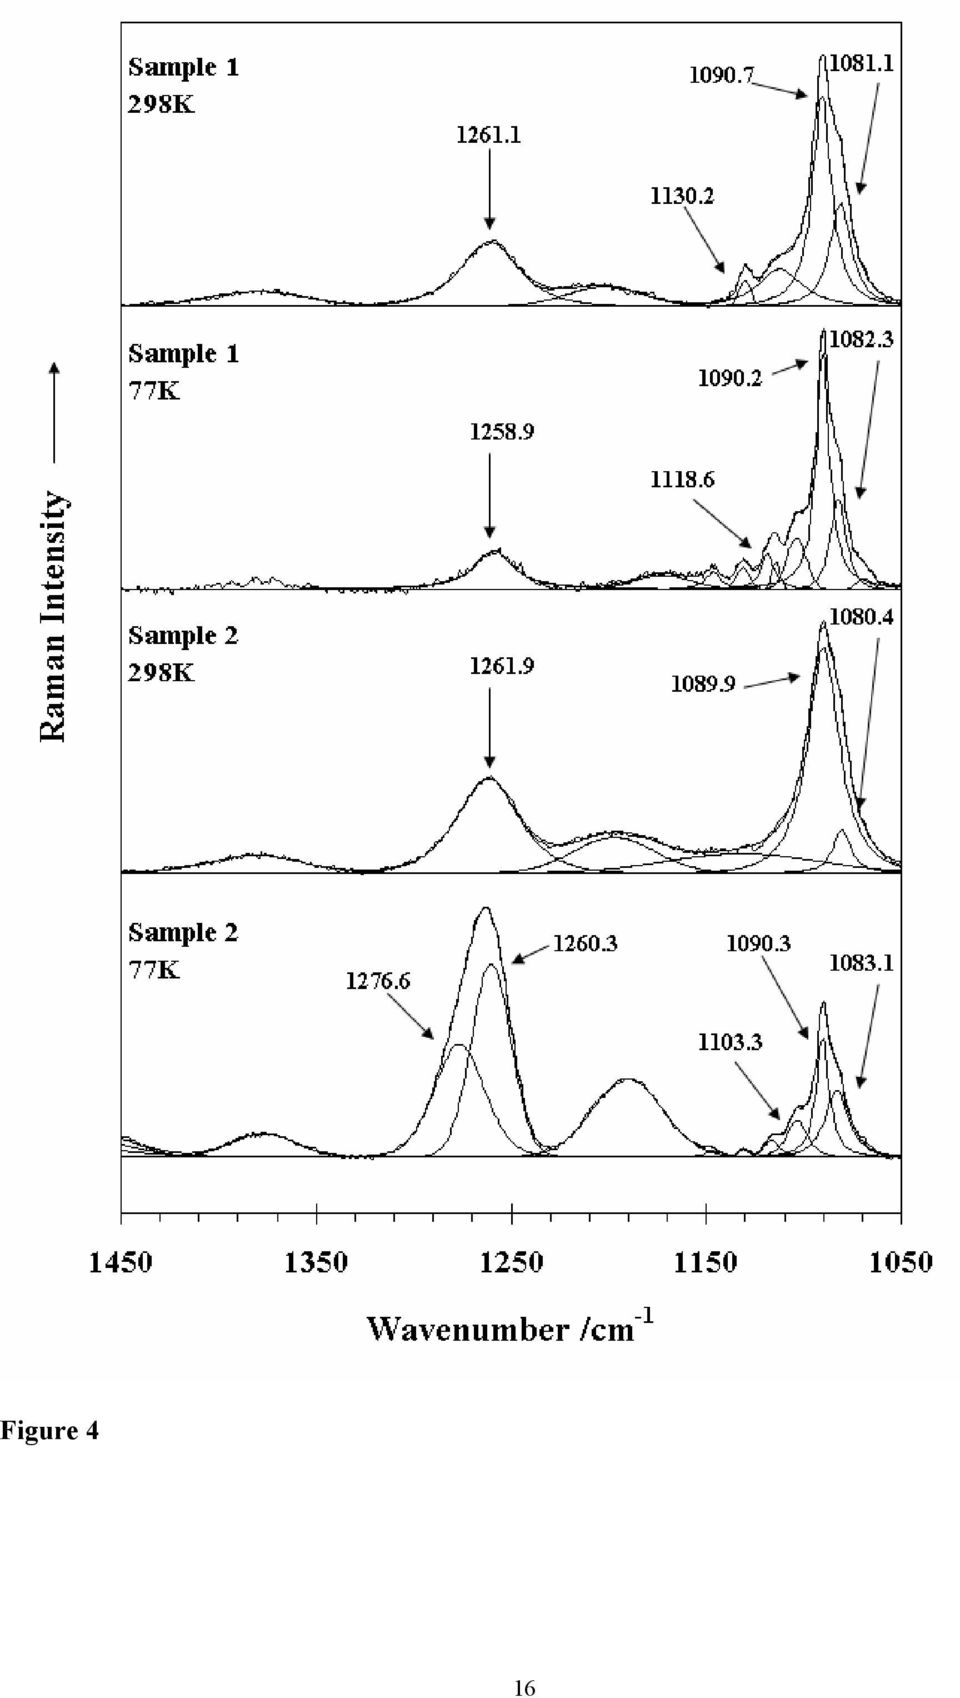
5 bending vibrations ν 4 (SO 4 ) 2- split. Raman and infrared bands assigned to the ν 3 (SO 4 ) 2- are located in the region cm -1, bands attributed to the ν 1 symmetric stretching vibrations (SO 4 ) -1 in cm -1, and bands assigned to the ν 4 (SO 4 ) 2- and ν 2 (SO 4 ) 2- bending vibration in cm -1 and cm -1, respectively. As in the case of the (UO 2 ) 2+ stretching vibrations, some overlap or coincidence of the (SO 4 ) 2- stretching vibrations and δ U-OH bending is possible. Bands connected with libration modes of water molecules may coincide especially with bands attributed to the (SO 4 ) 2- bending vibrations. The Raman spectra in the 950 to 1050 cm -1 region of two mineral samples from the happy Jack Mine are shown in Figure 2. The reason for showing the spectra of two samples is to prove consistency of measurement. An intense band at cm -1 in the 298 K spectrum which shifts to cm in the 77 K spectrum is attributed to the SO4 symmetric stretching vibration. The bands are asymmetric on the lower wavenumber side and an additional band in the cm -1 position is observed. A single band was observed for uranopilite at around cm -1 in the 298 K spectrum and at cm -1 in the 77 K 2- spectrum and is assigned to the SO 4 symmetric stretching vibration 6-11,28. The band shows a slight shift to higher wavenumbers upon cooling to 77 K. The infrared spectra of zippeite is shown in Figure 3. A number of overlapping infrared bands are observed at 1173, 1140, 1100, 1069 and 1051 cm -1. A low intensity band is observed at ~1015 cm -1 and is assigned to the infrared activated SO 2-4 symmetric stretching vibration. The infrared spectra of uranyl secondary minerals containing the sulphate anion as 2- reported by Čejka show that bands in the SO - 4 symmetric stretching region may be but need not be observed 34. Serezhkina et al. (1981) observed two bands at 1012 and 1002 cm -1 and attributed them to the ν 1 (SO 4 ) The Raman spectrum is clearer with a sharp intense band at 1042 cm -1 attributed to the (SO 4 ) 2- symmetric stretching vibration. Three Raman bands are observed at 1147, 1100 and 1090 cm -1 and are assigned to the (SO 4 ) 2- antisymmetric stretching vibrations. In the infrared spectrum two bands are observed at 1145 and 1086 cm Serezhkina et al. (1982) attributed bands at 1227, 1160, 1140, 1070 and 1037 to the ν 3 SO 4. Čejka proposes that the symmetry of the (SO 4 ) 2- anion must be of C 1 symmetry. If this is so then the ν 1 and ν 2 bands become infrared active. In this work no infrared band equivalent to the symmetric stretching mode is observed. Thus it is suggested that a higher site symmetry C 3v is possible. However, Serezhkina et al. (1982) assigned two bands to the ν 1 SO mentioned above. A number of Raman bands are observed in the 1050 to 1150 cm -1 region and are 2- assigned to the SO 4 antisymmetric stretching vibrations (Figure 4). Raman bands are observed at 1081, and 1130 cm -1 and shift to 1082, 1090 and 1132 cm -1 at 77 K. An intense Raman band is observed for zippeite at 1261 cm-1 which shows a slight shift to lower wavenumbers upon cooling to 77 K. One possible assignment is that this band is due to a U- OH deformation mode. Four bands were observed for uranopilite at around 1178, 1145, 1115 and 1096 cm (Frost et al in press). These bands were ascribed the SO 4 antisymmetric stretching vibrations. A broad band is also observed for uranopilite at 1272 cm -1. It is not known what the attribution of this band is due to, but one possibility is that it is assignable to U-OH deformation modes. There are four bands observed for zippeite in the spectral profile centred upon as 5
 2+ stretching vibrations, some overlap or coincidence of the (SO 4 ) 2- stretching vibrations and δ U-OH bending is possible.")
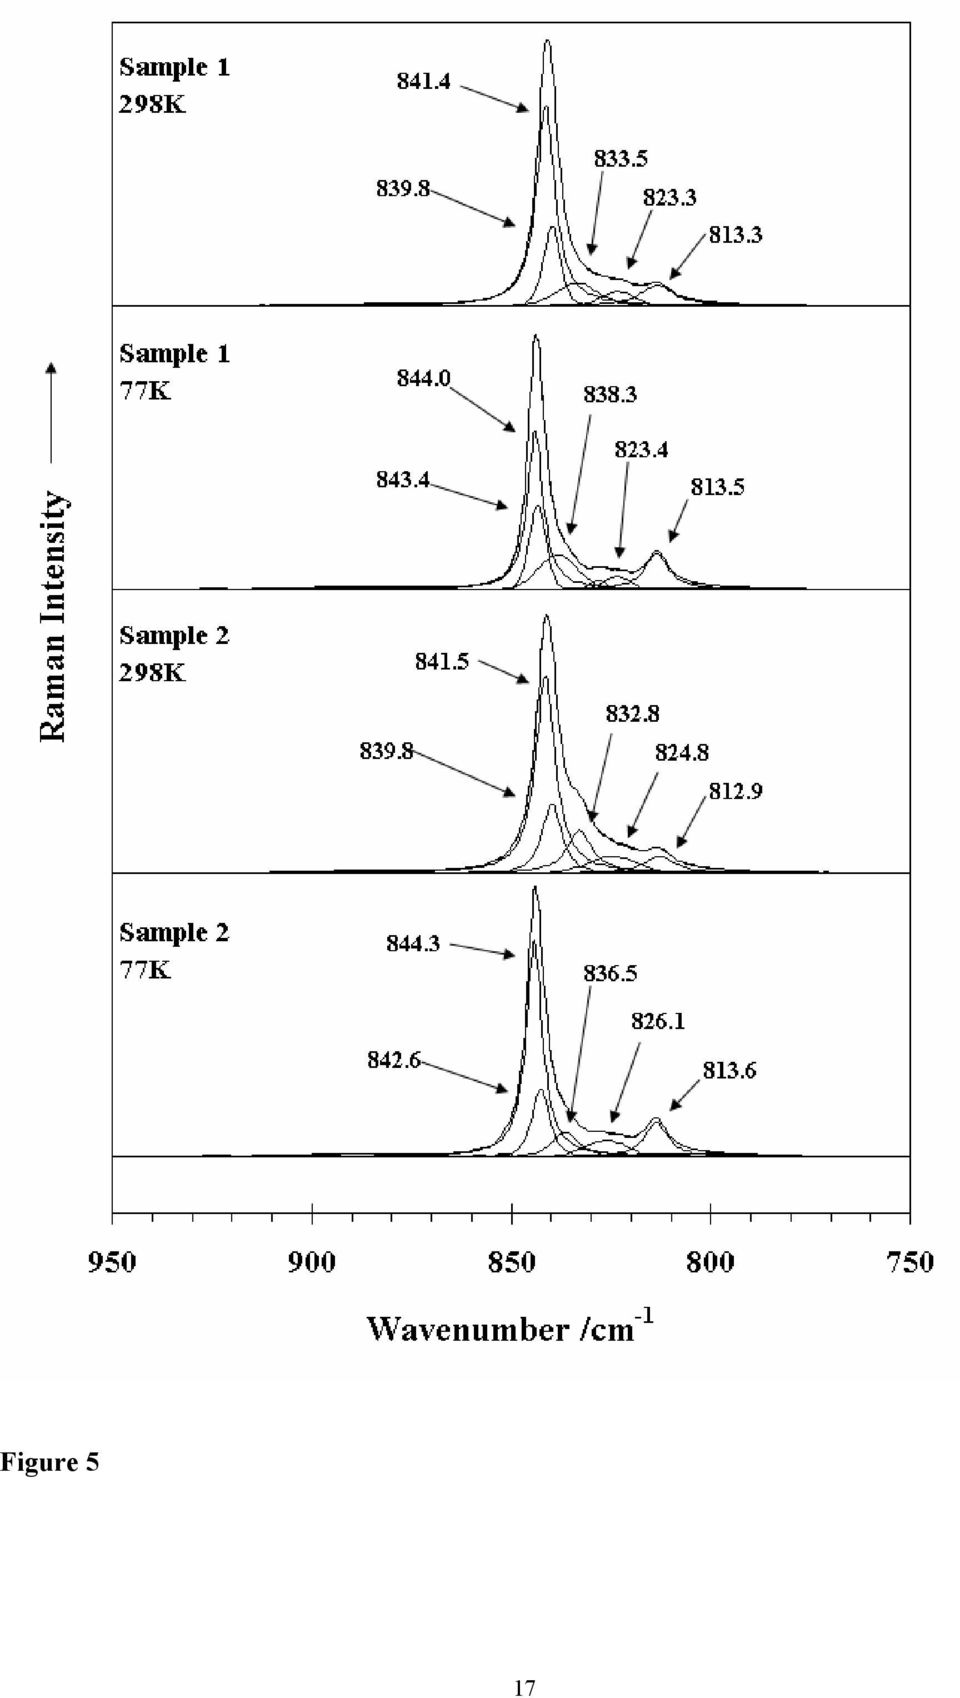
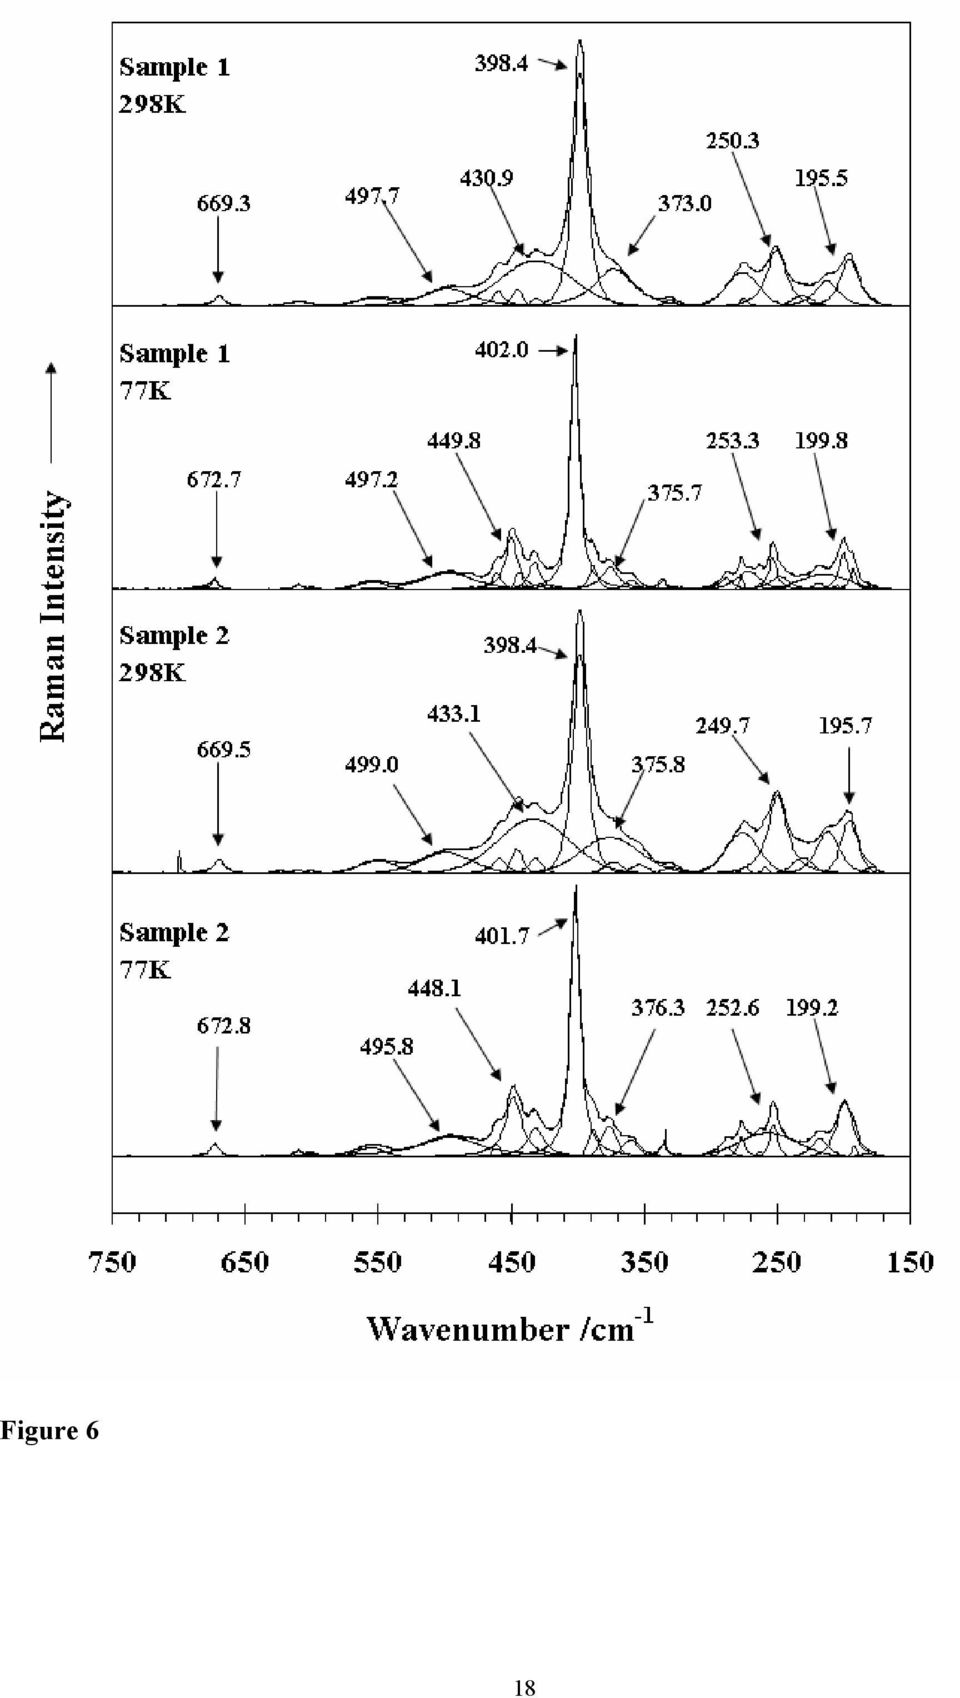
6 cm -1 at 840, 841, 833 and 823 cm -1 (Figure 5). These bands are assigned to the ν 1 (UO 2 ) 2+ symmetric stretching vibrations. The bands show a slight shift to higher wavenumbers upon collecting the spectra at 77 K. In the infrared spectrum of zippeite (Figure 3) two low intensity bands are observed at 815 and 821 cm -1 and are attributed to the infrared ν 1 (UO 2 ) 2+ symmetric stretching vibrations. The two infrared bands at 880 and 912 cm -1 are assigned to the ν 3 (UO 2 ) 2+ antisymmetric stretching vibrations. No Raman bands are observed in these positions for Na zippeite. In the Raman spectrum of johannite in the 650 to 1100 cm -1 range at 298 K three bands are observed at 812, 788 and 756 cm -1 and are attributed to the ν 1 symmetric stretching modes of the (UO 2 ) 2+ units. In the infrared spectrum of johannite two bands are observed at 936 (as a shoulder) and 898 cm -1. Čejka assigned these bands to the ν 3 antisymmetric stretching modes of the (UO 2 ) 2+ units 23. In the infrared spectrum a band of uranopilite is observed at 838 cm -1 and are ascribed to the infrared activated symmetric stretching modes. Multiple infrared bands for uranopilite are observed at 932, 912, 888 and 863 cm -1. The probable assignment of these bands is to the ν 3 antisymmetric stretching modes of the (UO 2 ) 2+ units, although there may be also a coincidence of the uranyl stretching vibrations bands and those of δ U-OH bending bands. U-O bond lengths in uranyls may be calculated with the empirical relations by Bartlett and Cooney 36. Raman bands, observed in sample No.1 at cm -1 /1.794 Å (298 K) and cm -1 /1.793 Å (77 K) (IR bands cm -1 /1.765 Å; cm -1 /1.778 Å; cm -1 /1.789 Å; cm -1 /1.796 Å ; cm -1 /1.801 Å; cm -1 /1.817 Å) and in sample No. 2 at 887 cm -1 /1.794 Å (298 K) and at cm -1 /1.767 Å; cm -1 /1.787 Å; cm -1 /1.793 Å; cm -1 /1.807 Å; cm -1 /1.816 Å(77 K) (IR bands cm -1 /1.766 Å; 912 cm -1 /1.776 Å; cm -1 /1.799 Å; 858 cm -1 /1.816 Å) are attributed to the ν 3 (UO 2 ) 2+ antisymmetric stretching vibrations. Raman bands in sample No. 1 at cm -1 /1.770 Å; cm -1 /1.771 Å; cm -1 /1.777 Å; cm -1 /1.787 Å; cm -1 /1.797 Å (298 K) and at 844 cm -1 /1.767 Å; cm -1 /1.768 Å; cm -1 /1.773 Å; cm -1 /1/783 Å; cm -1 /1.787 Å; cm -1 /1.797 Å; cm -1 /1.808 Å (298 K) (IR bands at cm -1 /1.767 Å; cm -1 /1.790 Å; cm -1 /1.809 Å; 794 cm -1 /1.817 Å) and in sample No cm -1 /1.770 Å; cm -1 /1.771 Å; cm -1 /1.778 Å; cm -1 /1.786 Å; cm -1 /1.798 Å; cm -1 /1.803 Å) are assigned to the ν 1 (UO 2 ) 2+ symmetric stretching vibrations. U-O bond lengths calculated with two empirical relations 36 are in agreement with those from the single crystal structure data 1.77 Å 14. An overlap / a coincidence of the (UO 2 ) 2+ stretching vibrations and δ U-OH bending vibrations may be expected and cannot be excluded. Raman and especially infrared bands connected with δ U-OH bending vibrations are observed also in the region cm -1 (Figure 4). Bands in the region cm -1 mostly connected with the (SO 4 ) 2- bending vibrations are discussed below. However, some of the Raman bands in the range cm -1 may be attributed to the ν (bridge elongation) (U 3 O), cm -1 to the ν (group elongation) U 3 (OH) 3, to the γ (out-of-plane bending) (U 3 O), and cm -1 to the γ (out-of-plane bending) and δ (in-plane bending) U 3 (OH) 3. The presence of such units may be predicted from the structure of synthetic sodium-zippeite. Bands observed at lower wavenumbers than approximately 210 cm -1 are related to lattice vibrations and translations. The Raman spectrum of the low wavenumber region of zippeite at 298 and 77 K are shown in Figure 6. A band is observed at 669 cm -1 at 298 K and is assigned to the triply degenerate ν 4 bending vibration of the (SO 4 ) 2- units. This band is found at 672 cm -1 at 77 K. No additional bands were resolved at this temperature in this spectral region. In the infrared spectrum two absorption bands are observed at 619 and 605 cm -1 and may be assigned to this vibrational mode. Čejka found absorption band at 619 cm -1 which is in good agreement with this work 23, 6
 2+ antisymmetric stretching vibrations. No Raman bands are observed in these positions for Na zippeite.")
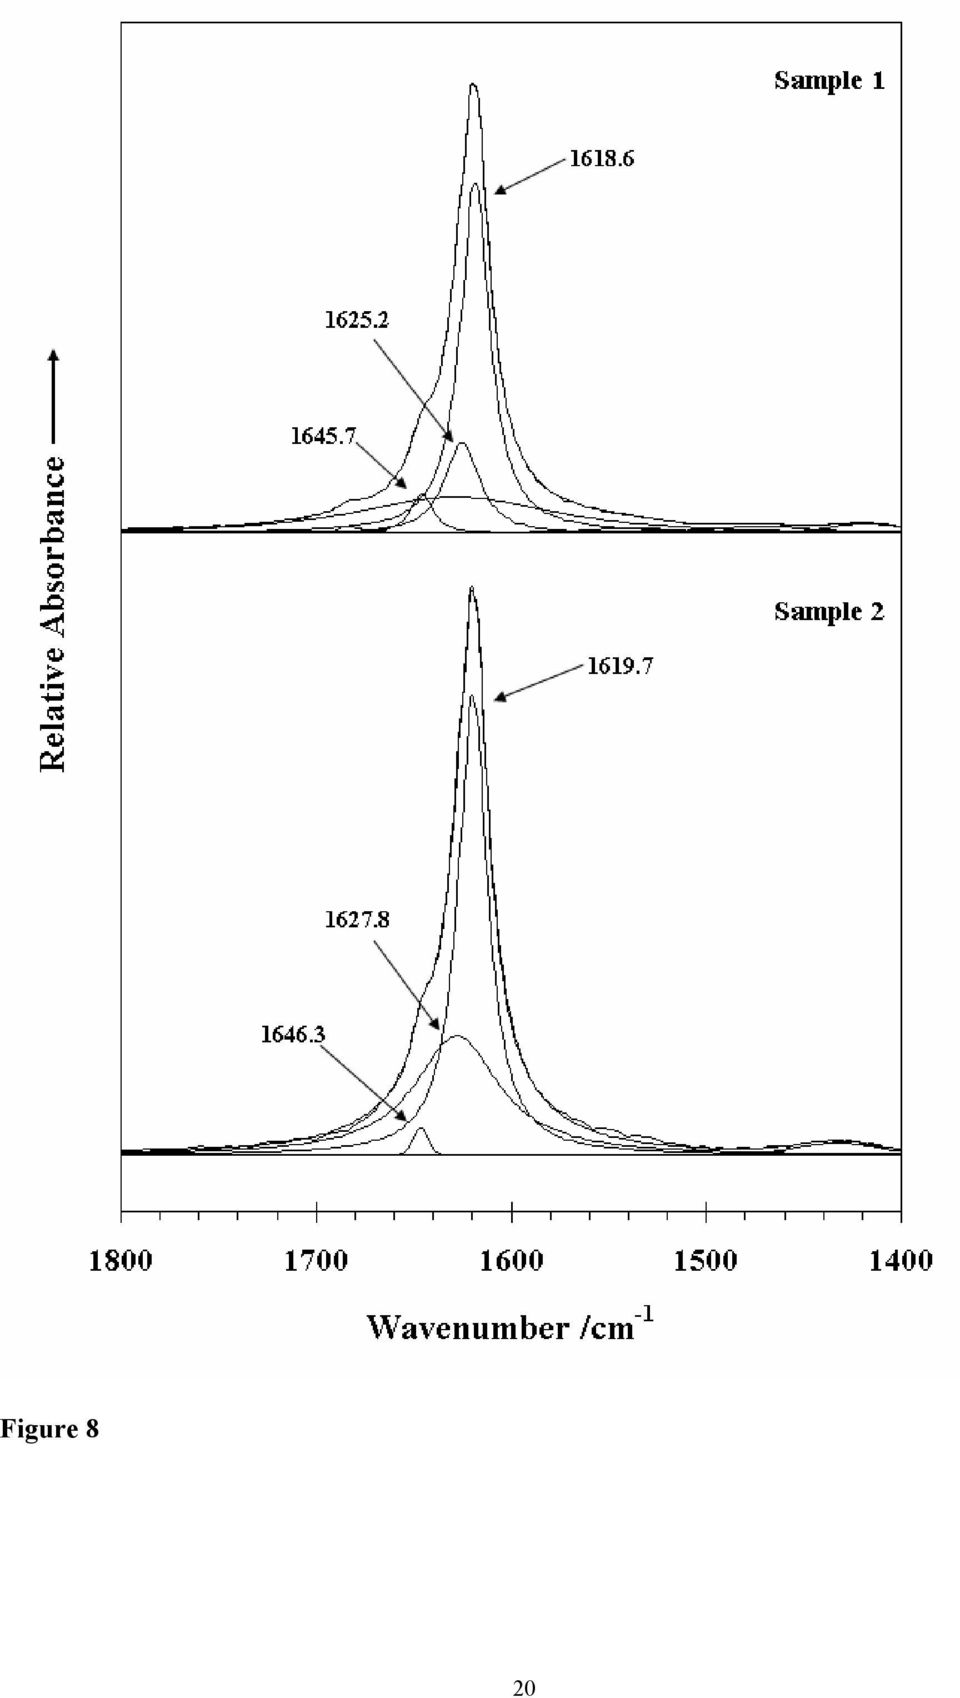
7 and Serezhkina et al. found four bands at 642, 611, 605 and 595 cm -1 for johannite assigned to the ν 4 (SO 4 ) 2-. Intense bands are observed in the 373 to 497 cm -1 region and are attributed to the ν 2 bending modes of the (SO 4 ) 2- units. The observation of more than one band in this spectral region suggests a lowering of the symmetry of the sulphate anion to C 3v or less. Bands in the 398 cm -1 region are assigned to the ν 2 SO 4 2- bending vibrations. Some bands may be also related to the ν U-O equatorial, i.e. U-O ligand vibrations 37. Intense bands observed in the Raman spectra at 77 K are also connected with these ν 2 SO 4 2- bending vibrations. Bands at wavenumbers lower than 320 cm -1 observed in the Raman spectra (Fig. 6) - not measured in the infrared spectra, are attributed to the ν 2 (δ) UO 2 2+ bending vibrations and the lowest bands ( cm -1 ) may be assigned to the lattice and/or O I -U-O ligand vibrations 38 and /or cation and anion librations 39. In each of the spectra bands are observed at around 322, 294, 260 cm - 1. Any unambiguous assignment of bands in this range is very complex. In the 298 K spectrum for johannite Frost et al found three bands are observed at 302, 277 and 205 cm -1. In the 77 K spectrum, bands shifted to 306, 282, 231 and 210 cm -1 with other low intensity bands found at 191, 170 and 149 cm -1. In the infrared spectrum of johannite Čejka assigned the two bands at 257 and 216 cm -1 to the doubly degenerate ν 2 bending vibration of the (UO 2 ) 2+ units. OH stretching region In the crystal structure of sodium-zippeite, there are three symmetrically distinct hydroxyls in the uranyl anion sheet, and twelve water molecules in the interlayer 14. Water molecules are coordinated to Na + -cations and participate together with the sheet hydroxyls in formation of hydrogen-bonding network. This hydrogen-bonding network influences origin and formation of the crystal structure of sodium-zippeite and plays an important role in the stability of this natural phase Infrared bands in the range cm -1 are attributed to the ν OH stretching vibrations of water molecules and hydroxyls without any possible resolution the ν 1 and ν 3 (Figure 7). Libowitzky s empirical relation enables to infer the O- H O bond lengths from the wavenumbers of the observed tops of bands 43. These lengths (cm -1 /Å) are for sample No />3.2; /3.04; /2.902; /2873; /2853; /2.75; /2.676; /2.63 and for sample No />3.2; /3.042; /2.905; /2853; /2.85; /2.74; / From the observed and calculated data may be inferred that there are free or very weakly bonded three (OH) - units in the structure of both sodium-zippeite samples. This is in agreement with the structure 14. Deconvolution of broad bands enables to prove the presence of strongly hydrogen bonded water molecules 14. Uranyl oxygen and some other uranyl anion sheet oxygens and hydroxyls may participate in the formation and arrangement of the hydrogen-bonding network with water molecules from the interlayer. Hydrogen bonding between water molecules in the interlayer is also supposed. According to Hawthorne 44, a complex crystal structure may be understood as composed of two units - strongly bonded structural units uranyl anion sheets, and the weakly bonded interstitial complex the interlayer. The bonding interaction between the structural unit and the interstitial complex is weak. This weak interaction controls the stability of the structure 44. A set of 5 bands (1645.7; ; ; cm -1 ) for sample No. 1 and of 3 bands (1646.3; ; cm -1 ) may be assigned to the δ H 2 O bending vibrations (Figure 8). Only bands at cm -1 (298 K) and cm -1 (77 K) were observed in the Raman 7

8 spectra of sample No. 2. Raman and infrared spectroscopy study of sodium-zippeite confirms that structurally nonequivalent water molecules are present in its structure. This is in agreement with the structure 14 and thermal analysis 23 of synthetic sodium-zippeite. Conclusions (a) Raman and infrared spectra of two samples of sodium-zippeite from Happy Jack Mine were studied. (b) Bands connected with the (UO 2 ) 2+ and (SO 4 ) 2- stretching and bending vibrations were attributed respecting their number as a result of FGA-correlation. (c) Coincidence of some of these bands with the bands assigned to U-OH bending vibrations is probable. (d) U-O bond lengths in uranyls were calculated and compared with the X-ray single crystal structure data. Both data are in good agreement. (e) Three free or very weak hydrogen bonded symmetrically distinct hydroxyls located in the sheets were inferred from the spectra. This agrees with the structure of sodium-zippeite. (f) Water molecules of the interlayer participate in a set of hydrogen bonds forming thus a complex hydrogen-bonding network which influences the origin, formation and stability of the mineral. (g) Relatively large interlayer probably enables introducing of mono- and/or divalent-cations and water molecules influencing thus possible existence of solid solutions 2 and mineral stability by hydrogen-bonding network 40,41,44. 8
 Bands connected with the (UO 2 ) 2+ and (SO 4 ) 2- stretching and bending vibrations were attributed respecting their number as a result of FGA-correlation.")
9 References 1. Finch, R, Murakami, T. Reviews in Mineralogy 1999; 38: McCollam, BE. University of Notre Dame Frondel, C Systematic Mineralogy of Uranium and Thorium, Frondel, C, Weeks, AD. Proc. UN Intern. Conf. Peaceful Uses Atomic Energy, 2nd, Geneva, ; 2: Frondel, C, Ito, J, Honea, RM, Weeks, AM. Canadian Mineralogist 1976; 14: Frost, RL, Cejka, J, Weier, M, Ayoko, GA. Journal of Raman Spectroscopy 2006; 37: Frost, RL, Cejka, J, Weier, M, Martens, WN. Journal of Raman Spectroscopy 2006; 37: Frost, RL, Cejka, J, Weier, ML, Martens, W. Journal of Raman Spectroscopy 2006; 37: Frost, RL, Weier, ML, Cejka, J, Kloprogge, JT. Journal of Raman Spectroscopy 2006; 37: Frost, RL, Weier, ML, Reddy, BJ, Cejka, J. Journal of Raman Spectroscopy 2006; 37: Frost, RL, Henry, DA, Erickson, K. Journal of Raman Spectroscopy 2004; 35: O'Brien, TJ, Williams, PA. Inorganic and Nuclear Chemistry Letters 1981; 17: Haacke, DF, Williams, PA. Mineralogical Magazine 1979; 43: Burns, PC, Deely, KM, Hayden, LA. Canadian Mineralogist 2003; 41: Burns, PC. Can. Mineral 2005; 43: Burns, PC, Ewing, RC, Hawthorne, FC. Canadian Mineralogist 1997; 35: Burns, PC, Miller, ML, Ewing, RC. Canadian Mineralogist 1996; 34: Ondrus, P, Veselovsky, F, Hlousek, J, Skala, R, Vavrin, I, Fryda, J, Cejka, J, Gabasova, A. Journal of the Czech Geological Society 1997; 42: Elton, NJ, Hooper, JJ. Mineralogical Magazine 1993; 57: Paulis, P, Sikola, D, Holeczy, D. Vestnik Ceskeho Geologickeho Ustavu 1994; 69: Meisser, N Sejkora, J, Cejka, J, Škácha, P, Gabašová, A, Novotná, M. Bull. mineral.-petrolog. Odd. Nár. Muz (Praha) 2003; 11: Cejka, J. Reviews in Mineralogy 1999; 38: Frost, RL, Palmer, SJ, Bouzaid, JM, Reddy, BJ. Journal of Raman Spectroscopy 2007; 38: Frost, RL, Henry, DA, Weier, ML, Martens, W. Journal of Raman Spectroscopy 2006; 37: Frost, RL, Musumeci, AW, Kloprogge, JT, Adebajo, MO, Martens, WN. Journal of Raman Spectroscopy 2006; 37: Frost, RL, Weier, ML, Martens, WN, Kloprogge, JT, Kristof, J. Journal of Raman Spectroscopy 2005; 36: Frost, RL, Wills, R-A, Weier, ML, Martens, W. Journal of Raman Spectroscopy 2005; 36: Frost, RL, Weier, ML. Thermochimica Acta 2003; 406: Frost, RL, Weier, ML, Kloprogge, JT. Journal of Raman Spectroscopy 2003; 34: Frost, RL, Weier, ML. Journal of Raman Spectroscopy 2003; 34: Frost, RL, Weier, ML. Thermochimica Acta 2004; 409: Gaines, RV, Skinner, HCW, Foord, EE, Mason, B, Rosenzweig, A Dana's new mineralogy, 8th ed.; John Wiley and Sons: New York, Cejka, J, Urbanec, Z, Cejka, J, Jr., Mrazek, Z. Neues Jahrbuch fuer Mineralogie, Abhandlungen 1988; 159: Serezhkin, VN. Geokhimiya 1981: Bartlett, JR, Cooney, RP. Journal of Molecular Structure 1989; 193: Hoekstra, HR, Siegel, S. Journal of Inorganic and Nuclear Chemistry 1973; 35: Volod'ko, LV, Komyak, AI, Umreiko, DS Uranyl Compounds, Vol. 1: Spectra, Structure, Anderson, A, Chieh, C, Irish, DE, Tong, JPK. Canadian Journal of Chemistry 1980; 58: Hawthorne, FC. Zeitschrift fuer Kristallographie 1992; 201: Hawthorne, FC. Acta Crystallographica, Section B: Structural Science 1994; B50: Hawthorne, FC. EMU Notes in Mineralogy ; European Mineralogical Union: Libowitzky, E. Monatshefte fuer Chemie 1999; 130: Hawthorne, FC. Geologiya Rudnykh Mestorozhdenii 2003; 45:

10 Table 1. Elemental concentrations in weight % from EDX analyses of crystal clusters from the zippeite sample from Happy Jack Mine, USA. Oxygen was calculated indirectly by stoichiometry. Wt % C O U S Na Total

11 ν 3 cm -1 IR Raman 298 K Raman 298 K Raman 77 K Å Å Å Å Å Å Å Å Å Å Å Å ν 1 cm -1 IR Raman 298 K Raman 298 K Raman 77 K 850.4/ /827.3/ / Å Å Å Å Å Å Å Å Table 2 Comparison of the bond lengths as calculated from the ν 1 and ν 3 band positions 11

12 List of Figures Figure 1 SEM image of sodium zippeite from the Happy Jack Mine. (The numeric indicates an exasmple of the the position of the EDX analyses) Figure 2 Raman spectra of sodium zippeite in the 950 to 1050 cm -1 region at 298 and 77 K. Figure 3 Infrared spectra of sodium zippeite in the 500 to 1300 cm -1 region Figure 4 Raman spectra of sodium zippeite in the 1050 to 1450 cm -1 region at 298 and 77 K. Figure 5 Raman spectra of sodium zippeite in the 750 to 950 cm -1 region at 298 and 77 K. Figure 6 Raman spectra of sodium zippeite in the 150 to 750 cm -1 region at 298 and 77 K. Figure 7 Infrared spectra of sodium zippeite in the 2550 to 3700 cm -1 region Figure 8 Infrared spectra of sodium zippeite in the 1400 to 1800 cm -1 region List of Tables Table 1. Elemental concentrations in weight % from EDX analyses of crystal clusters from the zippeite sample from Happy Jack Mine, USA. Oxygen was calculated indirectly by stoichiometry. Table 2 Comparison of the bond lengths as calculated from the ν 1 and ν 3 band positions 12

13 Figure 1 13
14 Figure 2 14
15 Figure 3 15

16 Figure 4 16
17 Figure 5 17
18 Figure 6 18
19 Figure 7 19

20 Figure 8 20
21 21
COVER SHEET. This is the author version of article published as:
 COVER SHEET This is the author version of article published as: Frost, Ray L. and Musumeci, Anthony W. and Waclawik, Eric R. (2007) A spectroscopic study of the mineral paceite (calcium acetate). Spectrochimica
Raman spectroscopy Lecture
 Raman spectroscopy Lecture Licentiate course in measurement science and technology Spring 2008 10.04.2008 Antti Kivioja Contents - Introduction - What is Raman spectroscopy? - The theory of Raman spectroscopy
h e l p s y o u C O N T R O L
 contamination analysis for compound semiconductors ANALYTICAL SERVICES B u r i e d d e f e c t s, E v a n s A n a l y t i c a l g r o u p h e l p s y o u C O N T R O L C O N T A M I N A T I O N Contamination
Back to Basics Fundamentals of Polymer Analysis
 Back to Basics Fundamentals of Polymer Analysis Using Infrared & Raman Spectroscopy Molecular Spectroscopy in the Polymer Manufacturing Process Process NIR NIR Production Receiving Shipping QC R&D Routine
Infrared Spectroscopy 紅 外 線 光 譜 儀
 Infrared Spectroscopy 紅 外 線 光 譜 儀 Introduction Spectroscopy is an analytical technique which helps determine structure. It destroys little or no sample (nondestructive method). The amount of light absorbed
Infrared Spectroscopy: Theory
 u Chapter 15 Infrared Spectroscopy: Theory An important tool of the organic chemist is Infrared Spectroscopy, or IR. IR spectra are acquired on a special instrument, called an IR spectrometer. IR is used
Chemical Calculations: The Mole Concept and Chemical Formulas. AW Atomic weight (mass of the atom of an element) was determined by relative weights.
 was determined by relative weights.") 1 Introduction to Chemistry Atomic Weights (Definitions) Chemical Calculations: The Mole Concept and Chemical Formulas AW Atomic weight (mass of the atom of an element) was determined by relative weights.
1 Introduction to Chemistry Atomic Weights (Definitions) Chemical Calculations: The Mole Concept and Chemical Formulas AW Atomic weight (mass of the atom of an element) was determined by relative weights.
The Mole Concept. The Mole. Masses of molecules
 The Mole Concept Ron Robertson r2 c:\files\courses\1110-20\2010 final slides for web\mole concept.docx The Mole The mole is a unit of measurement equal to 6.022 x 10 23 things (to 4 sf) just like there
Determining the Structure of an Organic Compound
 Determining the Structure of an Organic Compound The analysis of the outcome of a reaction requires that we know the full structure of the products as well as the reactants In the 19 th and early 20 th
Amount of Substance. http://www.avogadro.co.uk/definitions/elemcompmix.htm
 Page 1 of 14 Amount of Substance Key terms in this chapter are: Element Compound Mixture Atom Molecule Ion Relative Atomic Mass Avogadro constant Mole Isotope Relative Isotopic Mass Relative Molecular
QUANTITATIVE INFRARED SPECTROSCOPY. Willard et. al. Instrumental Methods of Analysis, 7th edition, Wadsworth Publishing Co., Belmont, CA 1988, Ch 11.
 QUANTITATIVE INFRARED SPECTROSCOPY Objective: The objectives of this experiment are: (1) to learn proper sample handling procedures for acquiring infrared spectra. (2) to determine the percentage composition
Symmetric Stretch: allows molecule to move through space
 BACKGROUND INFORMATION Infrared Spectroscopy Before introducing the subject of IR spectroscopy, we must first review some aspects of the electromagnetic spectrum. The electromagnetic spectrum is composed
MISCIBILITY AND INTERACTIONS IN CHITOSAN AND POLYACRYLAMIDE MIXTURES
 MISCIBILITY AND INTERACTIONS IN CHITOSAN AND POLYACRYLAMIDE MIXTURES Katarzyna Lewandowska Faculty of Chemistry Nicolaus Copernicus University, ul. Gagarina 7, 87-100 Toruń, Poland e-mail: reol@chem.umk.pl
Features of the formation of hydrogen bonds in solutions of polysaccharides during their use in various industrial processes. V.Mank a, O.
 Features of the formation of hydrogen bonds in solutions of polysaccharides during their use in various industrial processes. V.Mank a, O. Melnyk b a National University of life and environmental sciences
1 The water molecule and hydrogen bonds in water
 The Physics and Chemistry of Water 1 The water molecule and hydrogen bonds in water Stoichiometric composition H 2 O the average lifetime of a molecule is 1 ms due to proton exchange (catalysed by acids
DETERMINACIÓN DE ESTRUCTURAS ORGÁNICAS (ORGANIC SPECTROSCOPY) IR SPECTROSCOPY
 IR SPECTROSCOPY") DETERMINACIÓN DE ESTRUCTURAS ORGÁNICAS (ORGANIC SPECTROSCOPY) IR SPECTROSCOPY Hermenegildo García Gómez Departamento de Química Instituto de Tecnología Química Universidad Politécnica de Valencia 46022
DETERMINACIÓN DE ESTRUCTURAS ORGÁNICAS (ORGANIC SPECTROSCOPY) IR SPECTROSCOPY Hermenegildo García Gómez Departamento de Química Instituto de Tecnología Química Universidad Politécnica de Valencia 46022
GIANT FREQUENCY SHIFT OF INTRAMOLECULAR VIBRATION BAND IN THE RAMAN SPECTRA OF WATER ON THE SILVER SURFACE. M.E. Kompan
 GIANT FREQUENCY SHIFT OF INTRAMOLECULAR VIBRATION BAND IN THE RAMAN SPECTRA OF WATER ON THE SILVER SURFACE M.E. Kompan Ioffe Institute, Saint-Peterburg, Russia kompan@mail.ioffe.ru The giant frequency
IUCLID 5 COMPOSITION AND ANALYSIS GUIDANCE DOCUMENT: IRON ORES, AGGLOMERATES [EINECS NUMBER 265 996 3, CAS NUMBER 65996 65 8] IRON ORE PELLETS
![IUCLID 5 COMPOSITION AND ANALYSIS GUIDANCE DOCUMENT: IRON ORES, AGGLOMERATES [EINECS NUMBER 265 996 3, CAS NUMBER 65996 65 8] IRON ORE PELLETS](/thumbs/40/20960122.jpg "IUCLID 5 COMPOSITION AND ANALYSIS GUIDANCE DOCUMENT: IRON ORES, AGGLOMERATES [EINECS NUMBER 265 996 3, CAS NUMBER 65996 65 8] IRON ORE PELLETS") IUCLID 5 COMPOSITION AND ANALYSIS GUIDANCE DOCUMENT: IRON ORES, AGGLOMERATES [EINECS NUMBER 265 996 3, CAS NUMBER 65996 65 8] IRON ORE PELLETS INTRODUCTION Each REACH registrant is required to file its
IUCLID 5 COMPOSITION AND ANALYSIS GUIDANCE DOCUMENT: IRON ORES, AGGLOMERATES [EINECS NUMBER 265 996 3, CAS NUMBER 65996 65 8] IRON ORE PELLETS INTRODUCTION Each REACH registrant is required to file its
A Raman spectroscopic study of thermally treated glushinskite the natural magnesium oxalate dihydrate
 A Raman spectroscopic study of thermally treated glushinskite the natural magnesium oxalate dihydrate Ray L. Frost, Moses Adebajo, Matt L. Weier Inorganic Materials Research Program, Queensland University
Pesticide Analysis by Mass Spectrometry
 Pesticide Analysis by Mass Spectrometry Purpose: The purpose of this assignment is to introduce concepts of mass spectrometry (MS) as they pertain to the qualitative and quantitative analysis of organochlorine
INFRARED SPECTROSCOPY (IR)
") INFRARED SPECTROSCOPY (IR) Theory and Interpretation of IR spectra ASSIGNED READINGS Introduction to technique 25 (p. 833-834 in lab textbook) Uses of the Infrared Spectrum (p. 847-853) Look over pages
INFRARED SPECTROSCOPY (IR) Theory and Interpretation of IR spectra ASSIGNED READINGS Introduction to technique 25 (p. 833-834 in lab textbook) Uses of the Infrared Spectrum (p. 847-853) Look over pages
The Fundamentals of Infrared Spectroscopy. Joe Van Gompel, PhD
 TN-100 The Fundamentals of Infrared Spectroscopy The Principles of Infrared Spectroscopy Joe Van Gompel, PhD Spectroscopy is the study of the interaction of electromagnetic radiation with matter. The electromagnetic
Chemical Equations & Stoichiometry
 Chemical Equations & Stoichiometry Chapter Goals Balance equations for simple chemical reactions. Perform stoichiometry calculations using balanced chemical equations. Understand the meaning of the term
DETECTION OF COATINGS ON PAPER USING INFRA RED SPECTROSCOPY
 DETECTION OF COATINGS ON PAPER USING INFRA RED SPECTROSCOPY Eduard Gilli 1,2 and Robert Schennach 1, 2 1 Graz University of Technology, 8010 Graz, Austria 2 CD-Laboratory for Surface Chemical and Physical
13C NMR Spectroscopy
 13 C NMR Spectroscopy Introduction Nuclear magnetic resonance spectroscopy (NMR) is the most powerful tool available for structural determination. A nucleus with an odd number of protons, an odd number
Chapter 1: Moles and equations. Learning outcomes. you should be able to:
 Chapter 1: Moles and equations 1 Learning outcomes you should be able to: define and use the terms: relative atomic mass, isotopic mass and formula mass based on the 12 C scale perform calculations, including
Preface Light Microscopy X-ray Diffraction Methods
 Preface xi 1 Light Microscopy 1 1.1 Optical Principles 1 1.1.1 Image Formation 1 1.1.2 Resolution 3 1.1.3 Depth of Field 5 1.1.4 Aberrations 6 1.2 Instrumentation 8 1.2.1 Illumination System 9 1.2.2 Objective
The excitation in Raman spectroscopy is usually. Practical Group Theory and Raman Spectroscopy, Part II: Application of Polarization
 Electronically reprinted from March 214 Molecular Spectroscopy Workbench Practical Group Theory and Raman Spectroscopy, Part II: Application of Polarization In this second installment of a two-part series
0 10 20 30 40 50 60 70 m/z
 Mass spectrum for the ionization of acetone MS of Acetone + Relative Abundance CH 3 H 3 C O + M 15 (loss of methyl) + O H 3 C CH 3 43 58 0 10 20 30 40 50 60 70 m/z It is difficult to identify the ions
CHE334 Identification of an Unknown Compound By NMR/IR/MS
 CHE334 Identification of an Unknown Compound By NMR/IR/MS Purpose The object of this experiment is to determine the structure of an unknown compound using IR, 1 H-NMR, 13 C-NMR and Mass spectroscopy. Infrared
Ion Beam Sputtering: Practical Applications to Electron Microscopy
 Ion Beam Sputtering: Practical Applications to Electron Microscopy Applications Laboratory Report Introduction Electron microscope specimens, both scanning (SEM) and transmission (TEM), often require a
Suggested solutions for Chapter 3
 s for Chapter PRBLEM Assuming that the molecular ion is the base peak (00% abundance) what peaks would appear in the mass spectrum of each of these molecules: (a) C5Br (b) C60 (c) C64Br In cases (a) and
A reinterpretation of the phase transitions in Na 2 CO 3
 Acta Crystallographica Section B Structural Science ISSN 0108-7681 Editor: Carolyn P. Brock A reinterpretation of the phase transitions in Na 2 CO 3 Alla Arakcheeva and Gervais Chapuis Copyright International
Journal of the University of Chemical Technology and Metallurgy, 42, 2, 2007. 2) are in C 1
 are in C 1") Journal of the University of Chemical M. Georgiev, Technology D. Stoilova and Metallurgy, 42, 2, 2007, 211-216 METAL-WATER INTERACTINS AND HYDRGEN BND STRENGTH M. Georgiev 1, D. Stoilova 2 1 University
Journal of the University of Chemical M. Georgiev, Technology D. Stoilova and Metallurgy, 42, 2, 2007, 211-216 METAL-WATER INTERACTINS AND HYDRGEN BND STRENGTH M. Georgiev 1, D. Stoilova 2 1 University
TiO 2. : Manufacture of Titanium Dioxide. www.rsc.org/learn-chemistry Registered charity number 207890
 TiO 2 : Manufacture of Titanium Dioxide www.rsc.org/learn-chemistry Registered charity number 207890 5: Manufacture of titanium dioxide Titanium dioxide has many uses. It is now the common white pigment
Application Note AN4
 TAKING INVENTIVE STEPS IN INFRARED. MINIATURE INFRARED GAS SENSORS GOLD SERIES UK Patent App. No. 2372099A USA Patent App. No. 09/783,711 World Patents Pending INFRARED SPECTROSCOPY Application Note AN4
Chem 115 POGIL Worksheet - Week 4 Moles & Stoichiometry
 Chem 115 POGIL Worksheet - Week 4 Moles & Stoichiometry Why? Chemists are concerned with mass relationships in chemical reactions, usually run on a macroscopic scale (grams, kilograms, etc.). To deal with
Modification of Pd-H 2 and Pd-D 2 thin films processed by He-Ne laser
 Modification of Pd-H 2 and Pd-D 2 thin films processed by He-Ne laser V.Nassisi #, G.Caretto #, A. Lorusso #, D.Manno %, L.Famà %, G.Buccolieri %, A.Buccolieri %, U.Mastromatteo* # Laboratory of Applied
SILA Sistema Integrato di Laboratori per l Ambiente. CENTRE FOR MICROSCOPY AND MICROANALYSIS Scientific coordinator: Prof.ssa Rosanna De Rosa
 CENTRE FOR MICROSCOPY AND MICROANALYSIS Scientific coordinator: Prof.ssa Rosanna De Rosa 0 The Centre for Microscopy and Microanalysis (CM2) is an interdisciplinary service centre, a comprehensive suite
Raman Spectroscopy. 1. Introduction. 2. More on Raman Scattering. " scattered. " incident
 February 15, 2006 Advanced Physics Laboratory Raman Spectroscopy 1. Introduction When light is scattered from a molecule or crystal, most photons are elastically scattered. The scattered photons have the
ION EXCHANGE FOR DUMMIES. An introduction
 ION EXCHANGE FOR DUMMIES An introduction Water Water is a liquid. Water is made of water molecules (formula H 2 O). All natural waters contain some foreign substances, usually in small amounts. The water
Chapter 13 Spectroscopy NMR, IR, MS, UV-Vis
 Chapter 13 Spectroscopy NMR, IR, MS, UV-Vis Main points of the chapter 1. Hydrogen Nuclear Magnetic Resonance a. Splitting or coupling (what s next to what) b. Chemical shifts (what type is it) c. Integration
Mole Notes.notebook. October 29, 2014
 1 2 How do chemists count atoms/formula units/molecules? How do we go from the atomic scale to the scale of everyday measurements (macroscopic scale)? The gateway is the mole! But before we get to the
Tutorial 4.6 Gamma Spectrum Analysis
 Tutorial 4.6 Gamma Spectrum Analysis Slide 1. Gamma Spectrum Analysis In this module, we will apply the concepts that were discussed in Tutorial 4.1, Interactions of Radiation with Matter. Slide 2. Learning
It has long been a goal to achieve higher spatial resolution in optical imaging and
 Nano-optical Imaging using Scattering Scanning Near-field Optical Microscopy Fehmi Yasin, Advisor: Dr. Markus Raschke, Post-doc: Dr. Gregory Andreev, Graduate Student: Benjamin Pollard Department of Physics,
Element of same atomic number, but different atomic mass o Example: Hydrogen
 Atomic mass: p + = protons; e - = electrons; n 0 = neutrons p + + n 0 = atomic mass o For carbon-12, 6p + + 6n 0 = atomic mass of 12.0 o For chlorine-35, 17p + + 18n 0 = atomic mass of 35.0 atomic mass
Keywords: Planar waveguides, sol-gel technology, transmission electron microscopy
 Structural and optical characterisation of planar waveguides obtained via Sol-Gel F. Rey-García, C. Gómez-Reino, M.T. Flores-Arias, G.F. De La Fuente, W. Assenmacher, W. Mader ABSTRACT Planar waveguides
Hydrogen Bonds in Water-Methanol Mixture
 Bulg. J. Phys. 34 (2007) 103 107 Hydrogen Bonds in Water-Methanol Mixture G.M. Georgiev, K. Vasilev, K. Gyamchev Faculty of Physics, University of Sofia 5J.Bourchier Blvd., 1164 Sofia, Bulgaria Received
IB Chemistry. DP Chemistry Review
 DP Chemistry Review Topic 1: Quantitative chemistry 1.1 The mole concept and Avogadro s constant Assessment statement Apply the mole concept to substances. Determine the number of particles and the amount
Organic Spectroscopy. UV - Ultraviolet-Visible Spectroscopy. !! 200-800 nm. Methods for structure determination of organic compounds:
 Organic Spectroscopy Methods for structure determination of organic compounds: X-ray rystallography rystall structures Mass spectroscopy Molecular formula -----------------------------------------------------------------------------
Anharmonicity and Weak Mode Assignment in La 2 x Sr x CuO 4 with Oxygen Isotopic Substitution
 Vol. 111 (2007) ACTA PHYSICA POLONICA A No. 1 Proceedings of the Symposium K: Complex Oxide Materials for New Technologies of E-MRS Fall Meeting 2006, Warsaw, September 4 8, 2006 Anharmonicity and Weak
MOLAR MASS AND MOLECULAR WEIGHT Themolar mass of a molecule is the sum of the atomic weights of all atoms in the molecule. Molar Mass.
 Counting Atoms Mg burns in air (O 2 ) to produce white magnesium oxide, MgO. How can we figure out how much oxide is produced from a given mass of Mg? PROBLEM: If If 0.200 g of Mg is is burned, how much
2. Molecular stucture/basic
 2. Molecular stucture/basic spectroscopy The electromagnetic spectrum Spectral region for atomic and molecular spectroscopy E. Hecht (2nd Ed.) Optics, Addison-Wesley Publishing Company,1987 Spectral regions
Unit 2: Quantities in Chemistry
 Mass, Moles, & Molar Mass Relative quantities of isotopes in a natural occurring element (%) E.g. Carbon has 2 isotopes C-12 and C-13. Of Carbon s two isotopes, there is 98.9% C-12 and 11.1% C-13. Find
3 - Atomic Absorption Spectroscopy
 3 - Atomic Absorption Spectroscopy Introduction Atomic-absorption (AA) spectroscopy uses the absorption of light to measure the concentration of gas-phase atoms. Since samples are usually liquids or solids,
Supporting Information
 Supporting Information Simple and Rapid Synthesis of Ultrathin Gold Nanowires, Their Self-Assembly and Application in Surface-Enhanced Raman Scattering Huajun Feng, a Yanmei Yang, a Yumeng You, b Gongping
The Characteristics of Clay. Table of Contents
 The Characteristics of Clay Table of Contents Preview...2 Objectives...2 Readings...2 Introduction...3 Structure of clay minerals...3 Physical features...3 Mineralogical features...4 A. Basic structure
NMR and other Instrumental Techniques in Chemistry and the proposed National Curriculum.
 NMR and other Instrumental Techniques in Chemistry and the proposed National Curriculum. Dr. John Jackowski Chair of Science, Head of Chemistry Scotch College Melbourne john.jackowski@scotch.vic.edu.au
Applications of Infrared Multiple Angle Incidence Resolution Spectrometry
 Electronically reprinted from August 2015 Applications of Infrared Multiple Angle Incidence Resolution Spectrometry Multiple angle incidence resolution spectrometry (MAIRS has proven useful for characterization
Organic Spectroscopy
 1 Organic Spectroscopy Second Year, Michaelmas term, 8 lectures: Dr TDW Claridge & Prof BG Davis Lectures 1 4 highlight the importance of spectroscopic methods in the structural elucidation of organic
Getting the most from this book...4 About this book...5
 Contents Getting the most from this book...4 About this book....5 Content Guidance Topic 1 Atomic structure and the periodic table...8 Topic 2 Bonding and structure...14 Topic 2A Bonding....14 Topic 2B
= 16.00 amu. = 39.10 amu
 Using Chemical Formulas Objective 1: Calculate the formula mass or molar mass of any given compound. The Formula Mass of any molecule, formula unit, or ion is the sum of the average atomic masses of all
Atoms, Ions and Molecules The Building Blocks of Matter
 Atoms, Ions and Molecules The Building Blocks of Matter Chapter 2 1 Chapter Outline 2.1 The Rutherford Model of Atomic Structure 2.2 Nuclides and Their Symbols 2.3 Navigating the Periodic Table 2.4 The
The Unshifted Atom-A Simpler Method of Deriving Vibrational Modes of Molecular Symmetries
 Est. 1984 ORIENTAL JOURNAL OF CHEMISTRY An International Open Free Access, Peer Reviewed Research Journal www.orientjchem.org ISSN: 0970-020 X CODEN: OJCHEG 2012, Vol. 28, No. (1): Pg. 189-202 The Unshifted
Chemical Composition. Introductory Chemistry: A Foundation FOURTH EDITION. Atomic Masses. Atomic Masses. Atomic Masses. Chapter 8
 Introductory Chemistry: A Foundation FOURTH EDITION by Steven S. Zumdahl University of Illinois Chemical Composition Chapter 8 1 2 Atomic Masses Balanced equation tells us the relative numbers of molecules
Absorption by atmospheric gases in the IR, visible and UV spectral regions.
 Lecture 6. Absorption by atmospheric gases in the IR, visible and UV spectral regions. Objectives: 1. Gaseous absorption in thermal IR. 2. Gaseous absorption in the visible and near infrared. 3. Gaseous
Raman Scattering Theory David W. Hahn Department of Mechanical and Aerospace Engineering University of Florida (dwhahn@ufl.edu)
") Introduction Raman Scattering Theory David W. Hahn Department of Mechanical and Aerospace Engineering University of Florida (dwhahn@ufl.edu) The scattering of light may be thought of as the redirection
Introduction Raman Scattering Theory David W. Hahn Department of Mechanical and Aerospace Engineering University of Florida (dwhahn@ufl.edu) The scattering of light may be thought of as the redirection
The interaction of Cu(100)-Fe surfaces with oxygen studied with photoelectron spectroscopy. I
-Fe surfaces with oxygen studied with photoelectron spectroscopy. I") 5 The interaction of Cu(100)-Fe surfaces with oxygen studied with photoelectron spectroscopy. I Mg Kα excited photoemission. Abstract The oxidation of Cu(100)-Fe surfaces was studied using XPS. Surfaces
5 The interaction of Cu(100)-Fe surfaces with oxygen studied with photoelectron spectroscopy. I Mg Kα excited photoemission. Abstract The oxidation of Cu(100)-Fe surfaces was studied using XPS. Surfaces
Scanning Electron Microscopy Services for Pharmaceutical Manufacturers
 Scanning Electron Microscopy Services for Pharmaceutical Manufacturers Author: Gary Brake, Marketing Manager Date: August 1, 2013 Analytical Testing Laboratory www.atl.semtechsolutions.com Scanning Electron
Secondary Ion Mass Spectrometry
 Secondary Ion Mass Spectrometry A PRACTICAL HANDBOOK FOR DEPTH PROFILING AND BULK IMPURITY ANALYSIS R. G. Wilson Hughes Research Laboratories Malibu, California F. A. Stevie AT&T Bell Laboratories Allentown,
Unit 3 Notepack Chapter 7 Chemical Quantities Qualifier for Test
 Unit 3 Notepack Chapter 7 Chemical Quantities Qualifier for Test NAME Section 7.1 The Mole: A Measurement of Matter A. What is a mole? 1. Chemistry is a quantitative science. What does this term mean?
Ionic Bonding Pauling s Rules and the Bond Valence Method
 Ionic Bonding Pauling s Rules and the Bond Valence Method Chemistry 754 Solid State Chemistry Dr. Patrick Woodward Lecture #14 Pauling Rules for Ionic Structures Linus Pauling,, J. Amer. Chem. Soc. 51,,
Chapter 4. Chemical Composition. Chapter 4 Topics H 2 S. 4.1 Mole Quantities. The Mole Scale. Molar Mass The Mass of 1 Mole
 Chapter 4 Chemical Composition Chapter 4 Topics 1. Mole Quantities 2. Moles, Masses, and Particles 3. Determining Empirical Formulas 4. Chemical Composition of Solutions Copyright The McGraw-Hill Companies,
MOLES, MOLECULES, FORMULAS. Part I: What Is a Mole And Why Are Chemists Interested in It?
 NAME PARTNERS SECTION DATE_ MOLES, MOLECULES, FORMULAS This activity is designed to introduce a convenient unit used by chemists and to illustrate uses of the unit. Part I: What Is a Mole And Why Are Chemists
A kinetic approach of sulphate behaviour in borosilicate glasses Implications for sulphate incorporation in nuclear waste glasses
 A kinetic approach of sulphate behaviour in borosilicate glasses Implications for sulphate incorporation in nuclear waste glasses Marion LENOIR 1,3, Agnès GRANDJEAN 2, D.R. NEUVILLE 3 1 CEA/ Nuclear Energy
EXPERIMENT 12: Empirical Formula of a Compound
 EXPERIMENT 12: Empirical Formula of a Compound INTRODUCTION Chemical formulas indicate the composition of compounds. A formula that gives only the simplest ratio of the relative number of atoms in a compound
Chemical Proportions in Compounds
 Chapter 6 Chemical Proportions in Compounds Solutions for Practice Problems Student Textbook page 201 1. Problem A sample of a compound is analyzed and found to contain 0.90 g of calcium and 1.60 g of
THE MOLE / COUNTING IN CHEMISTRY
 1 THE MOLE / COUNTING IN CHEMISTRY ***A mole is 6.0 x 10 items.*** 1 mole = 6.0 x 10 items 1 mole = 60, 00, 000, 000, 000, 000, 000, 000 items Analogy #1 1 dozen = 1 items 18 eggs = 1.5 dz. - to convert
CHEM 51LB: EXPERIMENT 5 SPECTROSCOPIC METHODS: INFRARED AND NUCLEAR MAGNETIC RESONANCE SPECTROSCOPY
 CHEM 51LB: EXPERIMENT 5 SPECTROSCOPIC METHODS: INFRARED AND NUCLEAR MAGNETIC RESONANCE SPECTROSCOPY REACTIONS: None TECHNIQUES: IR, NMR Infrared (IR) and nuclear magnetic resonance (NMR) spectroscopy are
Chapter 8 How to Do Chemical Calculations
 Chapter 8 How to Do Chemical Calculations Chemistry is both a qualitative and a quantitative science. In the laboratory, it is important to be able to measure quantities of chemical substances and, as
Vibrations of Carbon Dioxide and Carbon Disulfide
 Vibrations of Carbon Dioxide and Carbon Disulfide Purpose Vibration frequencies of CO 2 and CS 2 will be measured by Raman and Infrared spectroscopy. The spectra show effects of normal mode symmetries
IR Applied to Isomer Analysis
 DiscovIR-LC TM Application Note 025 April 2008 Deposition and Detection System IR Applied to Isomer Analysis Infrared spectra provide valuable information about local configurations of atoms in molecules.
SPECTROSCOPY. Light interacting with matter as an analytical tool
 SPECTROSCOPY Light interacting with matter as an analytical tool Electronic Excitation by UV/Vis Spectroscopy : X-ray: core electron excitation UV: valance electronic excitation IR: molecular vibrations
Name: Class: Date: Multiple Choice Identify the letter of the choice that best completes the statement or answers the question.
 Class: Date: Minerals Study Guide Modified True/False Indicate whether the sentence or statement is true or false. If false, change the identified word or phrase to make the sentence or statement true.
Physics 441/2: Transmission Electron Microscope
 Physics 441/2: Transmission Electron Microscope Introduction In this experiment we will explore the use of transmission electron microscopy (TEM) to take us into the world of ultrasmall structures. This
18 electron rule : How to count electrons
 18 electron rule : How to count electrons The rule states that thermodynamically stable transition metal organometallic compounds are formed when the sum of the metal d electrons and the electrons conventionally
electron does not become part of the compound; one electron goes in but two electrons come out.
 Characterization Techniques for Organic Compounds. When we run a reaction in the laboratory or when we isolate a compound from nature, one of our first tasks is to identify the compound that we have obtained.
Al 2 O 3, Its Different Molecular Structures, Atomic Layer Deposition, and Dielectrics
 Al 2 O 3, Its Different Molecular Structures, Atomic Layer Deposition, and Dielectrics Mark Imus Douglas Sisk, Ph.D., Mentor Marian High School RET Program University of Notre Dame Project Proposal Tunneling
Introduction to Fourier Transform Infrared Spectrometry
 Introduction to Fourier Transform Infrared Spectrometry What is FT-IR? I N T R O D U C T I O N FT-IR stands for Fourier Transform InfraRed, the preferred method of infrared spectroscopy. In infrared spectroscopy,
High-pressure Raman spectroscopic studies of hydrous wadsleyite II
 American Mineralogist, Volume 91, pages 1102 1109, 2006 High-pressure Raman spectroscopic studies of hydrous wadsleyite II ANNETTE K. KLEPPE, 1, * ANDREW P. JEPHCOAT, 1,2 AND JOSEPH R. SMYTH 3 1 Department
Chapter 3. Chemical Reactions and Reaction Stoichiometry. Lecture Presentation. James F. Kirby Quinnipiac University Hamden, CT
 Lecture Presentation Chapter 3 Chemical Reactions and Reaction James F. Kirby Quinnipiac University Hamden, CT The study of the mass relationships in chemistry Based on the Law of Conservation of Mass
QUANTITATIVE DETERMINATION OF COMMON TYPES OF ASBESTOS BY DIFFUSE REFLECTANCE FTIR
 MATERIALS ANALYSIS QUANTITATIVE DETERMINATION OF COMMON TYPES OF ASBESTOS BY DIFFUSE REFLECTANCE FTIR Solutions for Your Analytical Business Markets and Applications Programs Solution Note Materials Author(s)
Oxidation States of Copper Two forms of copper oxide are found in nature, copper(i) oxide and copper(ii) oxide.
 oxide and copper(ii) oxide.") The Empirical Formula of a Copper Oxide Reading assignment: Chang, Chemistry 10 th edition, pp. 55-58. Goals The reaction of hydrogen gas with a copper oxide compound will be studied quantitatively. By
The Empirical Formula of a Copper Oxide Reading assignment: Chang, Chemistry 10 th edition, pp. 55-58. Goals The reaction of hydrogen gas with a copper oxide compound will be studied quantitatively. By
Determination of Molecular Structure by MOLECULAR SPECTROSCOPY
 Determination of Molecular Structure by MOLEULAR SPETROSOPY hemistry 3 B.Z. Shakhashiri Fall 29 Much of what we know about molecular structure has been learned by observing and analyzing how electromagnetic
ANALYSIS OF ASPIRIN INFRARED (IR) SPECTROSCOPY AND MELTING POINT DETERMINATION
 SPECTROSCOPY AND MELTING POINT DETERMINATION") Chem 306 Section (Circle) M Tu W Th Name Partners Date ANALYSIS OF ASPIRIN INFRARED (IR) SPECTROSCOPY AND MELTING POINT DETERMINATION Materials: prepared acetylsalicylic acid (aspirin), stockroom samples
Chem 306 Section (Circle) M Tu W Th Name Partners Date ANALYSIS OF ASPIRIN INFRARED (IR) SPECTROSCOPY AND MELTING POINT DETERMINATION Materials: prepared acetylsalicylic acid (aspirin), stockroom samples
Chem 31 Fall 2002. Chapter 3. Stoichiometry: Calculations with Chemical Formulas and Equations. Writing and Balancing Chemical Equations
 Chem 31 Fall 2002 Chapter 3 Stoichiometry: Calculations with Chemical Formulas and Equations Writing and Balancing Chemical Equations 1. Write Equation in Words -you cannot write an equation unless you
NMR SPECTROSCOPY A N I N T R O D U C T I O N T O... Self-study booklet NUCLEAR MAGNETIC RESONANCE. 4 3 2 1 0 δ PUBLISHING
 A N I N T R O D U T I O N T O... NMR SPETROSOPY NULEAR MAGNETI RESONANE 4 3 1 0 δ Self-study booklet PUBLISING NMR Spectroscopy NULEAR MAGNETI RESONANE SPETROSOPY Origin of Spectra Theory All nuclei possess
X Ray Flourescence (XRF)
") X Ray Flourescence (XRF) Aspiring Geologist XRF Technique XRF is a rapid, relatively non destructive process that produces chemical analysis of rocks, minerals, sediments, fluids, and soils It s purpose
X Ray Flourescence (XRF) Aspiring Geologist XRF Technique XRF is a rapid, relatively non destructive process that produces chemical analysis of rocks, minerals, sediments, fluids, and soils It s purpose
The chemical interactions of the template molecule are primarily dependent on the choice of polymer
 Study of the Surface Morphology of Methyl 4-nitrobenzoate Template Thin-film Molecularly Imprinted Polymers Gary Kaganas Dartmouth College and Center for Nanomaterials Research at Dartmouth, Hanover NH
Advanced Solutions for Gas Monitoring
 Continuous Emissions Monitoring Stack Testing Process Monitoring Quality Control Engine Exhaust Gas Monitoring Workplace Air Quality Monitoring Combustion Research Emergency Rescue Services Advanced Solutions