Complex Studies of a Complex Subject: Data Visualization and Visitors
|
|
|
- Marcia Harrison
- 8 years ago
- Views:
Transcription
1 Complex Studies of a Complex Subject: Data Visualization and Visitors Lifelong Learning Group: Mary Ann Wojton, Joe Heimlich Indiana University: Lisel Record, Katy Borner, Adam Maltese Palmquist & Associates: Sasha Palmquist Science Museum of Minnesota: Zdanna Tranby, Marjorie Bequette New York Hall of Science: Steven Uzzo Visitor Studies Association July 2015

2

3

4

5

6

7
8

9

10

11

12

13
14
15
16

17

18

19

20 Research Questions How do visitors to museums and science centers react to conceptual science maps? How do people engage with and understand reference systems?

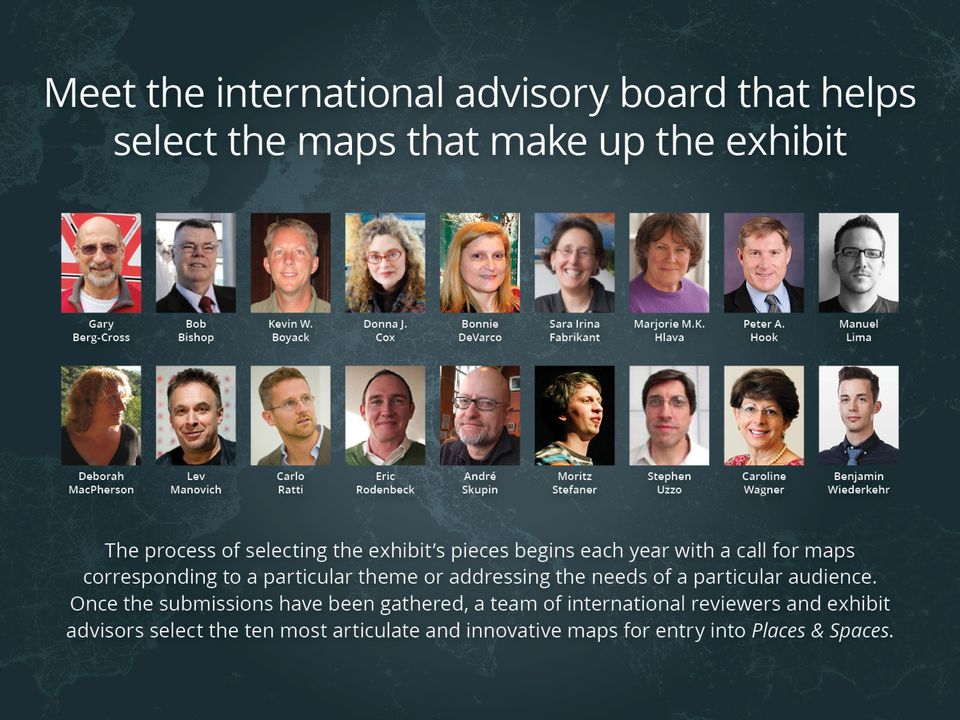
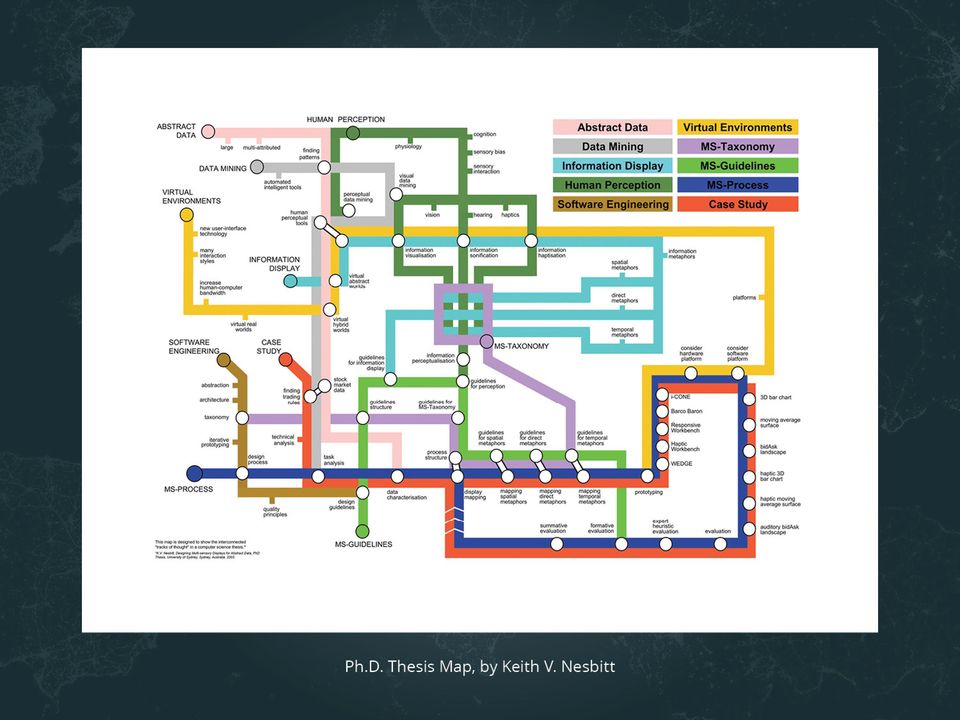
21 Visualization Recognition & Meaning Making
22
23
24
25
26
27 Visualization Recognition & Meaning Making
28 Design Does this type of data presentation look at all familiar? How do you think you read this type of data presentation? What would you call this type of data presentation? What types of data do you think would makes sense for this type of presentation? In addition, each individual/group was asked to rank the five visualizations based on ease of readability.
29 Findings Participants were unable to accurately describe the meanings of many of the reference systems Participants tended to prefer those visuals that had a familiarity in terms of the reference system.
30 Findings Topics do matter in terms of which visuals people prefer Color and visual appeal are important and for some people these factors drive preference.
31 Construction and Deconstruction
32 Participating Museums: COSI, Koshland, New York Hall of Science, and Wonder Lab
33 Airports reachable from Chicago O Hare International Airport in 2008 Circle size equals number of flights per day.
34 Airports reachable from Chicago O Hare International Airport in 2008 Circle size equals number of flights per day. Need a legend
35 Airports reachable from Chicago O Hare International Airport in 2008 Links represent flight connections.
36 Airports reachable from Chicago O Hare International Airport in 2008 Circle size equals number of flights per day.
37 O Hare Flight Map Familiar graphic common reference system Simple graphics Labels
38
39
40
41
42 Competitive Eating Records Associated with food Incomplete understanding unless they were aware of competitive eating X Y graph and bar graph were familiar
43 Gapminder World 2012 X Y axis was familiar Majority understood, although it may have taken some time
44 Padgett's Florentine Families
45 Padgett's Florentine Families Label: Family Name
46 Padgett's Florentine Families Label: Family Name
47 Padgett's Florentine Families Circle size: Family's net wealth (in thousands of lira) in year 1427.
48 Padgett's Florentine Families Circle color: Number of seats on the civic council held
49 Padgett's Florentine Families Link color: Business ties, e.g., loans, credits, and joint partnerships.
50 Padgett's Florentine Families Link color: Marriage alliances.
51 Padgett's Florentine Families Link color: Marriage alliances.
52 Padgett s Florentine Families Most challenging graphic to understand Unfamiliar format Unfamiliar content. Children were likely to make pictures from the dots and lines.
53 Visitors engaged in constructing the graphics were more likely to use cumulative reasoning; making deeper meaning as they viewed the graphic one layer at a time.
54 Data visualizations exist on a continuum from simple to complex.
55 Guests knowledge of and familiarity with data visualizations exist on a continuum from unfamiliar to familiar.
56 Implications for the Field
57 What do visitors think when they hear the words Big Data
58 Implications for the Field
59 Big Data Insight Needs Sort Pasta sauce Tofu Peaches Vienna Sausage Lasagna Carrots Ham sandwich
60 Two Main Sorting Methods Method 1. (Most Popular) Sort cards into emergent categories Method 2. Examine all cards, decide on categories, and sort cards
61 Dissonance in the data
62 Recoding and Outliers
63 Implications for Project Stakeholders Researchers Formal Educators Museum Professionals
64 Researchers
65 Emergent study design taught us what we needed to know Pulling back to what people actually know vs. assumptions of what they should know Insight into thinking of content experts led us to ask better questions
66 Museum Staff
67 Different audiences at different sites provided greater understanding of typical visitor responses to this topic Exhibit designers used knowledge gained through literature reviews and evaluation in thinking about a macroscope and proposal that grew out of it Program developers used data to create a theater program
68 Formal Education
69 One of (if not THE) most common responses was that participants interface with these visualizations as part of their formal education Both parents and youth had challenges, so can t count on support at home to get it right when interpreting visualization as part of homework or studying
70 Questions
71 Contact Information Mary Ann Wojton Lisel Record Sasha Palmquist
72
73
Sense-making of Big Data Team
 Sense Making of Big Data Front-end study on familiarity with terms October, 2014 Prepared by: Joe E. Heimlich, Ph.D Zdanna Tranby Mary Ann Wojton, Ph.D Prepared for: Sense-making of Big Data Team This
Visualization Quick Guide
 Visualization Quick Guide A best practice guide to help you find the right visualization for your data WHAT IS DOMO? Domo is a new form of business intelligence (BI) unlike anything before an executive
HISTORICAL DEVELOPMENTS AND THEORETICAL APPROACHES IN SOCIOLOGY Vol. I - Social Network Analysis - Wouter de Nooy
 SOCIAL NETWORK ANALYSIS University of Amsterdam, Netherlands Keywords: Social networks, structuralism, cohesion, brokerage, stratification, network analysis, methods, graph theory, statistical models Contents
Excel Charts & Graphs
 MAX 201 Spring 2008 Assignment #6: Charts & Graphs; Modifying Data Due at the beginning of class on March 18 th Introduction This assignment introduces the charting and graphing capabilities of SPSS and
Infographics in the Classroom: Using Data Visualization to Engage in Scientific Practices
 Infographics in the Classroom: Using Data Visualization to Engage in Scientific Practices Activity 4: Graphing and Interpreting Data In Activity 4, the class will compare different ways to graph the exact
Visualizing Data from Government Census and Surveys: Plans for the Future
 Censuses and Surveys of Governments: A Workshop on the Research and Methodology behind the Estimates Visualizing Data from Government Census and Surveys: Plans for the Future Kerstin Edwards March 15,
4. Are you satisfied with the outcome? Why or why not? Offer a solution and make a new graph (Figure 2).
.") Assignment 1 Introduction to Excel and SPSS Graphing and Data Manipulation Part 1 Graphing (worksheet 1) 1. Download the BHM excel data file from the course website. 2. Save it to the desktop as an excel
Assignment 1 Introduction to Excel and SPSS Graphing and Data Manipulation Part 1 Graphing (worksheet 1) 1. Download the BHM excel data file from the course website. 2. Save it to the desktop as an excel
Variable: characteristic that varies from one individual to another in the population
 Goals: Recognize variables as: Qualitative or Quantitative Discrete Continuous Study Ch. 2.1, # 1 13 : Prof. G. Battaly, Westchester Community College, NY Study Ch. 2.1, # 1 13 Variable: characteristic
Effective Big Data Visualization
 Effective Big Data Visualization Every Picture Tells A Story Don t It? Mark Gamble Dir Technical Marketing Actuate Corporation 1 Data Driven Summit 2014 Agenda What is data visualization? What is good?
The Information Literacy (IL) and Information Technology (IT) Teaching and Learning Circle. Summary, Overview and Index
 and Information Technology (IT) Teaching and Learning Circle. Summary, Overview and Index") The Information Literacy (IL) and Information Technology (IT) Teaching and Learning Circle Summary, Overview and Index The IL-IT Teaching and Learning Circle met during the summer and fall of 2002. The
The Information Literacy (IL) and Information Technology (IT) Teaching and Learning Circle Summary, Overview and Index The IL-IT Teaching and Learning Circle met during the summer and fall of 2002. The
Data Visualization with Google Fusion Tables
 Data Visualization with Google Fusion Tables a.k.a Don t Be Scared. It s Not That Hard. handout created by Brittny Goodsell Spring 2012 britg07@gmail.com Google Fusion Tables. It s just a phrase that means
Data Visualization Basics for Students
 Data Visualization Basics for Students Dionisia de la Cerda Think about Your Message You want your audience to understand your message. This takes time. Think about your audience and plan your message.
Dashboards as Easy To Use as Amazon
 AUGUST 2013 Dashboards as Easy To Use as Amazon Sponsored by QlikView Contents The Business Intelligence Usability Crisis 1 Why Is Amazon So Useful? 1 Why Do We Need a More Amazon-like BI Experience? 3
Credit Score Basics, Part 1: What s Behind Credit Scores? October 2011
 Credit Score Basics, Part 1: What s Behind Credit Scores? October 2011 OVERVIEW Today, credit scores are often used synonymously as an absolute statement of consumer credit risk. Or, credit scores are
Modifying Colors and Symbols in ArcMap
 Modifying Colors and Symbols in ArcMap Contents Introduction... 1 Displaying Categorical Data... 3 Creating New Categories... 5 Displaying Numeric Data... 6 Graduated Colors... 6 Graduated Symbols... 9
ART MUSEUMS BY THE NUMBERS 2014
 M Last year, after the Association of Art Museum Directors relaunched its website, AAMD began a systematic digitization and upgrade of its annual membership survey tools, with three goals: improve the
Our Process: Website Design & Development
 Our Process: Website Design & Development HOW WE BUILD YOUR VIRTUAL HABITAT The process for building your website is a lot like building a new home. Like any good architect, this means asking questions
Data Visualization Handbook
 SAP Lumira Data Visualization Handbook www.saplumira.com 1 Table of Content 3 Introduction 20 Ranking 4 Know Your Purpose 23 Part-to-Whole 5 Know Your Data 25 Distribution 9 Crafting Your Message 29 Correlation
Analyzing Data Using Excel
 Analyzing Data Using Excel What you will do: Create a spreadsheet Use formulas and basic formatting Import text files Save worksheets as web pages Add interactivity to web worksheets Use pivot tables Create
Business Intelligence. Technology Innovation and Business Solutions
 Introductions Tyler Sherman :: CEO, Motivity Solutions» Defining» How business intelligence is being used by mortgage bankers today Jim Connell :: CIO, Sierra Pacific Mortgage» Defining your scorecard»
EXECUTIVE SUMMARY. List all of the program s learning outcomes: (regardless of whether or not they are being assessed this year)
") STUDENT LEARNING ASSESSMENT REPORT SUBMITTED BY: BRIDGET MURPHY DATE: FEBRUARY 2, 2015 BRIEFLY DESCRIBE WHERE AND HOW ARE DATA AND DOCUMENTS USED TO GENERATE THIS REPORT BEING STORED: The majority of student
STUDENT LEARNING ASSESSMENT REPORT SUBMITTED BY: BRIDGET MURPHY DATE: FEBRUARY 2, 2015 BRIEFLY DESCRIBE WHERE AND HOW ARE DATA AND DOCUMENTS USED TO GENERATE THIS REPORT BEING STORED: The majority of student
UNLOCK EMAIL ROI WITH MDR s. Email Campaign Analyzer EXCLUSIVE EDUCATION MARKET INSIGHT TO DRIVE. improved results
 UNLOCK EMAIL ROI WITH MDR s Email Campaign Analyzer EXCLUSIVE EDUCATION MARKET INSIGHT TO DRIVE improved results learn more FROM YOUR E-MARKETING With MDR s exclusive, new Campaign Analyzer! Market smarter
28 th Annual Visitor Studies Association Conference
 1 Taking Action for Improvement, Growth, and Social Change 28 th Annual Visitor Studies Association Conference July 14-18, 2015 Indianapolis, IN Workshop Schedule and Descriptions Tuesday, July 14 9:00
Between Friends Sites like Facebook are proving the value of the "social graph."
 Page 1 of 10 March/April 2008 Between Friends Sites like Facebook are proving the value of the "social graph." By Erica Naone The idea of a social graph--a representation of a person's network of friends,
USING EXCEL IN AN INTRODUCTORY STATISTICS COURSE: A COMPARISON OF INSTRUCTOR AND STUDENT PERSPECTIVES
 USING EXCEL IN AN INTRODUCTORY STATISTICS COURSE: A COMPARISON OF INSTRUCTOR AND STUDENT PERSPECTIVES Cynthia L. Knott Marymount University, 2807 N. Glebe Road, Arlington, VA 22207 cynthia.knott@marymount.edu
Ron Shaham. Expert Witness in Islamic Courts : Medicine and Crafts in the Service of Law. : University of Chicago Press,. p 38
 : University of Chicago Press,. p 38 http://site.ebrary.com/id/10381149?ppg=38 : University of Chicago Press,. p 39 http://site.ebrary.com/id/10381149?ppg=39 : University of Chicago Press,. p 40 http://site.ebrary.com/id/10381149?ppg=40
. Perspectives on the Economics of Aging. : University of Chicago Press,. p 3 http://site.ebrary.com/id/10209979?ppg=3 Copyright University of
 : University of Chicago Press,. p 3 http://site.ebrary.com/id/10209979?ppg=3 : University of Chicago Press,. p 4 http://site.ebrary.com/id/10209979?ppg=4 : University of Chicago Press,. p 297 http://site.ebrary.com/id/10209979?ppg=297
May not be reproduced in any form without permission from the publisher, except fair uses permitted under U.S. or applicable copyright law.
 : University of Chicago Press,. p 24 http://site.ebrary.com/id/10292358?ppg=24 : University of Chicago Press,. p 25 http://site.ebrary.com/id/10292358?ppg=25 : University of Chicago Press,. p 26 http://site.ebrary.com/id/10292358?ppg=26
Making an Impact with your Poster
 Making an Impact with your Poster Jan 2012 Contents 1. Introduction 2. Planning your Poster 4. Layout 6. Using Images and Graphs 9. Clear Use of Text 10. Using Colour Effectively 12. Help and Support 13.
Introduction... 1 Welcome Screen... 2 Map View... 3. Generating a map... 3. Map View... 4. Basic Map Features... 4
 Quick Start Guide Contents Introduction... 1 Welcome Screen... 2 Map View... 3 Generating a map... 3 Map View... 4 Basic Map Features... 4 Adding a Secondary Indicator... 5 Adding a Secondary Indicator...
HOW TO USE DATA VISUALIZATION TO WIN OVER YOUR AUDIENCE
 HOW TO USE DATA VISUALIZATION TO WIN OVER YOUR AUDIENCE + TABLE OF CONTENTS HOW DATA SUPPORTS YOUR MESSAGE 1 Benefits of Data Visualization WHEN TO USE DATA VISUALIZATION HOW TO FIND THE STORY IN YOUR
Simple Data Analysis Techniques
 Simple Data Analysis Techniques Three of the most common charts used for data analysis are pie, Pareto and trend charts. These are often linked together in a data trail. Pie Charts Pie charts provide a
CSU, Fresno - Institutional Research, Assessment and Planning - Dmitri Rogulkin
 My presentation is about data visualization. How to use visual graphs and charts in order to explore data, discover meaning and report findings. The goal is to show that visual displays can be very effective
Becoming Style Conscious
 Becoming Style Conscious PPCA Inc 78 Marbella, San Clemente, CA 92673 (949)488-8339 Ronald Surz Ron@PPCA-Inc.com This is the original version of an article published in final form in the Fall 2010 Journal
How to Activate People to Adopt Data Governance
 How to Activate People to Adopt Data Governance Awareness, Ownership and Accountability A whitepaper by First San Francisco Partners 2010 Copyright First San Francisco Partners How to Activate People to
OVERVIEW BANNATYNE CAMPUS U OF M SCHEDULING INITIATIVE: ASSIGNING CLASSROOM, MEETING AND EVENT SPACE
 OVERVIEW BANNATYNE CAMPUS U OF M SCHEDULING INITIATIVE: ASSIGNING CLASSROOM, MEETING AND EVENT SPACE OVERVIEW BANNATYNE CAMPUS U OF M SCHEDULING INITIATIVE: ASSIGNING CLASSROOM, MEETING AND EVENT SPACE
From Web Analytics to Engagement Analytics
 white paper From Web Analytics to Engagement Analytics Table of Contents Executive Summary 1 Engagement Analytics 2 Measuring Quality with Engagement Value Points 2 Engagement Analytics Examples 5 Overall
Web Analytics with Google Analytics (GA) TRAINING MANUAL FOR WEB EDITORS
 TRAINING MANUAL FOR WEB EDITORS") Web Analytics with Google Analytics (GA) TRAINING MANUAL FOR WEB EDITORS LSA WEB SERVICES Google Analytics Training Manual LSA Web Services Haven Hall, Suite 6051 505 South State Street Ann Arbor, MI 48109-1045
Web Analytics with Google Analytics (GA) TRAINING MANUAL FOR WEB EDITORS LSA WEB SERVICES Google Analytics Training Manual LSA Web Services Haven Hall, Suite 6051 505 South State Street Ann Arbor, MI 48109-1045
Data Analysis, Statistics, and Probability
 Chapter 6 Data Analysis, Statistics, and Probability Content Strand Description Questions in this content strand assessed students skills in collecting, organizing, reading, representing, and interpreting
2.0 COMMON FORMS OF DATA VISUALIZATION
 The Importance of Data Visualization to Business Decision Making by Rebeckah Blewett, Product Manager, Dundas Data Visualization, Inc.Sunday, June 12, 2011 1.0 INTRODUCTION Informed decision making is
CentralMass DataCommon
 CentralMass DataCommon User Training Guide Welcome to the DataCommon! Whether you are a data novice or an expert researcher, the CentralMass DataCommon can help you get the information you need to learn
List all of the program s learning outcomes: (regardless of whether or not they are being assessed this year)
") STUDENT LEARNING ASSESSMENT REPORT SUBMITTED BY: BRIDGET MURPHY DATE: SEPTEMBER 27, 2013 BRIEFLY DESCRIBE WHERE AND HOW ARE DATA AND DOCUMENTS USED TO GENERATE THIS REPORT BEING STORED: The majority of
STUDENT LEARNING ASSESSMENT REPORT SUBMITTED BY: BRIDGET MURPHY DATE: SEPTEMBER 27, 2013 BRIEFLY DESCRIBE WHERE AND HOW ARE DATA AND DOCUMENTS USED TO GENERATE THIS REPORT BEING STORED: The majority of
Diagrams and Graphs of Statistical Data
 Diagrams and Graphs of Statistical Data One of the most effective and interesting alternative way in which a statistical data may be presented is through diagrams and graphs. There are several ways in
Class Assignment. College Bus Graphics Design VCP 118-2 DIGITAL IMAGING III ASSIGNMENT DUE OCTOBER 25 TH FALL 2010
 FALL 2010 Class Assignment CECIL COLLEGE College Bus Graphics Design Choosing the right graphics for a job can be an overwhelming task. To begin the selection process, it is critical to ask two important
Customizing ehealth Reports
 ehealth reports provide an easy-to-read picture of the historical and current performance of your entire infrastructure. While ehealth makes it easy to run reports by providing default report settings,
K N O W L E D G E M A N A G E M E N T S E R I E S V I S U A L I Z A T I O N
 K N O W L E D G E M A N A G E M E N T S E R I E S V I S U A L I Z A T I O N Visualization GBA CONSULTING (P) LTD Knowledge Management Series ISSUE 3 VOLUME 1 DECEMBER/2011 VISUALIZATION A TOOL Editorial
Empowering Museum Educators to Evaluate
 From the Guest Editors Empowering Museum Educators to Evaluate Joy Kubarek Laureen Trainer Museum educators today operate in an outcomes-based work environment, one riddled with accountability and pressure
TIBCO Spotfire Business Author Essentials Quick Reference Guide. Table of contents:
 Table of contents: Access Data for Analysis Data file types Format assumptions Data from Excel Information links Add multiple data tables Create & Interpret Visualizations Table Pie Chart Cross Table Treemap
Jan 28 th, 2015 FREE Webinar by
 Google Analytics Data Mining with R (includes 3 Real Applications) Jan 28 th, 2015 FREE Webinar by 1/28/2015 1 Our Speakers Kushan Shah Maintainer of RGoogleAnalytics Library & Web Analyst at Tatvic @
Examples of Data Representation using Tables, Graphs and Charts
 Examples of Data Representation using Tables, Graphs and Charts This document discusses how to properly display numerical data. It discusses the differences between tables and graphs and it discusses various
Fundamentals of Design
 Fundamentals of Design One of Ottawa s most prominent marketing and communications firms, gordongroup offers award-winning design for a complete range of communications products from corporate brand identities
Situational Awareness Through Network Visualization
 CYBER SECURITY DIVISION 2014 R&D SHOWCASE AND TECHNICAL WORKSHOP Situational Awareness Through Network Visualization Pacific Northwest National Laboratory Daniel M. Best Bryan Olsen 11/25/2014 Introduction
Driving business intelligence to new destinations
 IBM SPSS Modeler and IBM Cognos Business Intelligence Driving business intelligence to new destinations Integrating IBM SPSS Modeler and IBM Cognos Business Intelligence Contents: 2 Mining for intelligence
Association of Public Data Users Annual Conference September 21, 2011
 Data Visualization in the NEW American FactFinder Association of Public Data Users Annual Conference September 21, 2011 After viewing this presentation, you will be able to: 1. Create a Reference Map 2.
Probability and Statistics
 Activity: TEKS: Overview: Problems Kids Care About (K.12) Probability and statistics. The student constructs and uses graphs of real objects or pictures to answer questions. The student is expected to:
An Invitation to Apply: University of Missouri-St. Louis (UMSL) College of Education Orthwein Endowed Professor for Life-Long Learning in the Sciences
 College of Education Orthwein Endowed Professor for Life-Long Learning in the Sciences") An Invitation to Apply: University of Missouri-St. Louis (UMSL) College of Education Orthwein Endowed Professor for Life-Long Learning in the Sciences THE SEARCH The Department of Teaching and Learning
An Invitation to Apply: University of Missouri-St. Louis (UMSL) College of Education Orthwein Endowed Professor for Life-Long Learning in the Sciences THE SEARCH The Department of Teaching and Learning
Social Selling: Building Relationships in a Social Media World
 Social Selling: Building Relationships in a Social Media World RLI Design Professionals Design Professionals Learning Event DPLE 161 November 18, 2015 RLI Design Professionals is a Registered Provider
Metrics 101. Produced by the TMF Reference Model Metrics and Reporting Sub-team. 1 August 2014
 Metrics 101 Produced by the TMF Reference Model Metrics and Reporting Sub-team 1 August 2014 Agenda Why a metrics program? Goals of a metrics program Types of metrics Further analytics on metrics Metrics
Get to the Point HOW GOOD DATA VISUALIZATION IMPROVES BUSINESS DECISIONS
 Get to the Point HOW GOOD DATA VISUALIZATION IMPROVES BUSINESS DECISIONS Whatever presents itself quickly and clearly to the mind sets it to work, to reason, and to think. - William Playfair, inventor
Search Engine Optimisation (SEO) for cultural content producers
 for cultural content producers") Search Engine Optimisation (SEO) for cultural content producers Summary Everything starts with search. A Pew internet survey found that 92% of online adults use search. Free online search tools will help
Search Engine Optimisation (SEO) for cultural content producers Summary Everything starts with search. A Pew internet survey found that 92% of online adults use search. Free online search tools will help
Microsoft Report Builder 3.0 with SQL 2008R2, SQL 2012 Express and SQL 2012 Course 55005A; 2 Days, Instructor-led
 Microsoft Report Builder 3.0 with SQL 2008R2, SQL 2012 Express and SQL 2012 Course 55005A; 2 Days, Instructor-led Course Description Builder 3.0 - The training environment includes SQL 2008R2, SQL Express
PSYC 502 Applied Behavior Analysis Summer 2016. Course Description
 Instructor: Tiffany Kodak Email: kodak@uwm.edu Office: 238E Garland Hall Course Dates: May 31, 2016- July 9, 2016 Course Description This advanced undergraduate course is designed to provide an introduction
Average Counselor Salary
 Average Salary Note: This information serves as a guide to a s salary. The charts and graphs here are a representation of average salaries for counselors of differing specialties, across 5 states: Michigan,
Gephi Tutorial Visualization
 Gephi Tutorial Welcome to this Gephi tutorial. It will guide you to the basic and advanced visualization settings in Gephi. The selection and interaction with tools will also be introduced. Follow the
Campus Instructional Consulting Franklin Hall 004, 855-9023, www.indiana.edu/~teaching. Page 1
 Laboratory Notebook Grading Rubric (http://www.rickhershberger.com/bioactivesite/lab/notebook_rubric.htm) For a grade of "C", your notebook should enable you to repeat and interpret your experiment. o
Dashboards with Live Data For Predictive Visualization. G. R. Wagner, CEO GRW Studios, Inc.
 Dashboards with Live Data For Predictive Visualization G. R. Wagner, CEO GRW Studios, Inc. Computer dashboards the formatted display of business data which allows decision makers and managers to gauge
WSMC High School Competition The Pros and Cons Credit Cards Project Problem 2007
 WSMC High School Competition The Pros and Cons Credit Cards Project Problem 2007 Soon, all of you will be able to have credit cards and accounts. They are an important element in the fabric of the United
Creating Graphs. Learning Objective-To create graphs that show data.
 Creating Graphs Summary- Key Words- Students will be able to identify graphs, components of graphs, interpret graphs, and construct various types of graphs. Pictograph Bar Graph Circle Graph Background
Website/Database Integration
 Website/Database Integration System Specification Team 5: Sitaram Chowdary Omkar Gadgil Shweta Joshi Navya Karyappa Benjamin Larson Mahalakshmi Venkataraman Sumanth Yajamanyam October 22, 2014 Table of
HOW TO USE CUSTOMER DATA TO RECHARGE YOUR MARKETING
 advanced THE 3-STEP MARKETING AUDIT: HOW TO USE CUSTOMER DATA TO RECHARGE YOUR MARKETING Learn How To Find Valuable Insights About Your Lead Conversion Experience By Running a HubSpot Customer Audit A
Dashboard reports created in Microsoft Excel are powerful, flexible. Dashboard Your Scorecard. Unleash the power of Excel for visual data analysis.
 Dashboard Your Scorecard Unleash the power of Excel for visual data analysis. by Mark W. Lehman, CPA, Carol M. Lehman and Jim Feazell Dashboard reports created in Microsoft Excel are powerful, flexible
GRAPHING DATA FOR DECISION-MAKING
 GRAPHING DATA FOR DECISION-MAKING Tibor Tóth, Ph.D. Center for Applied Demography and Survey Research (CADSR) University of Delaware Fall, 2006 TABLE OF CONTENTS Introduction... 3 Use High Information
ESTIMATING THE DISTRIBUTION OF DEMAND USING BOUNDED SALES DATA
 ESTIMATING THE DISTRIBUTION OF DEMAND USING BOUNDED SALES DATA Michael R. Middleton, McLaren School of Business, University of San Francisco 0 Fulton Street, San Francisco, CA -00 -- middleton@usfca.edu
4.4 Transforming Circles
 Specific Curriculum Outcomes. Transforming Circles E13 E1 E11 E3 E1 E E15 analyze and translate between symbolic, graphic, and written representation of circles and ellipses translate between different
R Graphics Cookbook. Chang O'REILLY. Winston. Tokyo. Beijing Cambridge. Farnham Koln Sebastopol
 R Graphics Cookbook Winston Chang Beijing Cambridge Farnham Koln Sebastopol O'REILLY Tokyo Table of Contents Preface ix 1. R Basics 1 1.1. Installing a Package 1 1.2. Loading a Package 2 1.3. Loading a
Wallingford Public Schools - HIGH SCHOOL COURSE OUTLINE
 Wallingford Public Schools - HIGH SCHOOL COURSE OUTLINE Course Title: Marketing Education Course Number: 8513 Department: Career and Technical Education Grade(s): 10-12 Level(s): Academic Credit: 1 Course
MetroBoston DataCommon Training
 MetroBoston DataCommon Training Whether you are a data novice or an expert researcher, the MetroBoston DataCommon can help you get the information you need to learn more about your community, understand
Science Notebooks. a tool for increasing student understanding of inquiry and science content a tool for enhancing literacy skills
 Science Notebooks a tool for increasing student understanding of inquiry and science content a tool for enhancing literacy skills s Table of Contents Investigation/Activity Page Advantages of Science Notebooks
Unit 9 Describing Relationships in Scatter Plots and Line Graphs
 Unit 9 Describing Relationships in Scatter Plots and Line Graphs Objectives: To construct and interpret a scatter plot or line graph for two quantitative variables To recognize linear relationships, non-linear
Understanding Data: A Comparison of Information Visualization Tools and Techniques
 Understanding Data: A Comparison of Information Visualization Tools and Techniques Prashanth Vajjhala Abstract - This paper seeks to evaluate data analysis from an information visualization point of view.
Search help. More on Office.com: images templates
 Page 1 of 7 PowerPoint 2010 Home > PowerPoint 2010 Help and How-to > Getting started with PowerPoint Search help More on Office.com: images templates Basic tasks in PowerPoint 2010 Here are some basic
CREATIVE INDUSTRIES REPORTS:
 CREATIVE INDUSTRIES REPORTS: PUTTING THE DATA TO WORK WITH BUSINESSES What do creative industries mean to the business community? As it turns out, a great deal. This tool-kit includes best practices and
Section 1: Asset Mapping
 UCLA CENTER FOR HEALTH POLICY RESEARCH Section 1: Asset Mapping Purpose Asset mapping provides information about the strengths and resources of a community and can help uncover solutions. Once community
College Of Arts And. Creative Enterprises COLLEGE OF ARTS AND CREATIVE ENTERPRISES
 College Of Arts And Creative Enterprises COLLEGE OF ARTS AND CREATIVE ENTERPRISES Contact Us 00971-2-5993111 (Abu Dhabi) 00971-4-4021111 (Dubai) @Zayed_U www.facebook.com/zayeduniversity www.zu.ac.ae Introduction
Impact. How to choose the right campaign for maximum effect. RKM Research and Communications, Inc., Portsmouth, NH. All Rights Reserved.
 Impact How to choose the right campaign for maximum effect RKM Research and Communications, Inc., Portsmouth, NH. All Rights Reserved. Executive summary Advertisers depend on traditional methods of testing
Assignment #1: Spreadsheets and Basic Data Visualization Sample Solution
 Assignment #1: Spreadsheets and Basic Data Visualization Sample Solution Part 1: Spreadsheet Data Analysis Problem 1. Football data: Find the average difference between game predictions and actual outcomes,
USING DATA DISCOVERY TO MANAGE AND MITIGATE RISK: INSIGHT IS EVERYONE S JOB
 USING DATA DISCOVERY TO MANAGE AND MITIGATE RISK: INSIGHT IS EVERYONE S JOB If you manage risk in your organization, you re probably surrounded by paper right now. After all, you need reports to help mitigate
Employee Engagement Survey Results. Sample Company. All Respondents
 Employee Engagement Survey Results All Respondents Summary Results from 246 Respondents February, 2009 Table of Contents All Respondents (n = 246) 1 Employee Engagement Two-Factor Profile of Employee Engagement
Do Something Graphic Design Quilt
 Do Something Graphic Design Quilt Graphic Design Lesson High School Adapted by: Meghan Collins 5 x 82 min classes Learning Statement: High School students will explore the inequalities in their community
A Business Owner s Guide to: Landing Pages
 A Business Owner s Guide to: Landing Pages A Business Owner s Guide to: Landing Pages Are you looking to increase your online conversion rates? Are you tired of getting traffic but not having anything
MARS STUDENT IMAGING PROJECT
 MARS STUDENT IMAGING PROJECT Data Analysis Practice Guide Mars Education Program Arizona State University Data Analysis Practice Guide This set of activities is designed to help you organize data you collect
Gaining Key Insights from Big Data
 Gaining Key Insights from Big Data Katy Börner, CNS, SLIS, Indiana University, Bloomington, Indiana katy@indiana.edu http://cns.iu.edu D.C. Art Science Evening Rendezvous (DASER) NAS Building, 2101 Constitution
Sales Performance Management Using Salesforce.com and Tableau 8 Desktop Professional & Server
 Sales Performance Management Using Salesforce.com and Tableau 8 Desktop Professional & Server Author: Phil Gilles Sales Operations Analyst, Tableau Software March 2013 p2 Executive Summary Managing sales
Creating Timelines for Litigation Presentations:
 ATTORNEY SUPPORT Creating Timelines for Litigation Presentations: By Timothy A. Piganelli Attorney teams frequently require assistance creating chronologies of events based on either facts or documents.
Romain André Graphic Design and Art Direction. 07 82 17 97 35 bonjour@romainandre.com
 Romain André Graphic Design and Art Direction 07 82 17 97 35 bonjour@romainandre.com Concept and Design of a bus shelter poster and scratch-off postcard insert for the exhibition The Way of the Shovel:
SAS BI Dashboard 3.1. User s Guide
 SAS BI Dashboard 3.1 User s Guide The correct bibliographic citation for this manual is as follows: SAS Institute Inc. 2007. SAS BI Dashboard 3.1: User s Guide. Cary, NC: SAS Institute Inc. SAS BI Dashboard
Quantitative vs. Categorical Data: A Difference Worth Knowing Stephen Few April 2005
 Quantitative vs. Categorical Data: A Difference Worth Knowing Stephen Few April 2005 When you create a graph, you step through a series of choices, including which type of graph you should use and several
2015 SPONSORSHIP PROSPECTUS
 BUILDING OWNERS AND MANAGERS ASSOCIATION OF CHICAGO 2015 SPONSORSHIP PROSPECTUS ABOUT BOMA/CHICAGO Who We Are BOMA/Chicago is a trade association that has represented the interests of the Chicago office
High School Algebra Reasoning with Equations and Inequalities Solve systems of equations.
 Performance Assessment Task Graphs (2006) Grade 9 This task challenges a student to use knowledge of graphs and their significant features to identify the linear equations for various lines. A student