Analysis and Reporting of I-V Curve Data from Large PV Arrays
|
|
|
- Bryce Hines
- 8 years ago
- Views:
Transcription


1 Analysis and Reporting of I-V Curve Data from Large PV Arrays Solmetric Webinar March 6, 2014 Paul Hernday Senior Applications Engineer cell


2 I-V Data Analysis Reveal the real hardware performance Weather Issues Low irradiance Variable irradiance Wind Obstruction Issues Shade Soiling Actual hardware performance can be hidden by the influence of weather, obstructions, or measurement technique. Data analysis should sort this out and provide a summary report to the client. Hmm Actual array performance Measurement Issues Irradiance sensor not in POA Thermocouple not attached Thermocouple location Resistive losses Depending on the contract, issues may need to be resolved and retested before final data analysis and reporting.


3 Deviations from Normal I-V Curve Each will be explained later in the webinar Note: Other measurement methods do not reveal many of these effects.

4 Topics PV Analyzer operation PV principles useful for data analysis Using the I-V Data Analysis Tool Interpreting your results Creating a summary Measurement tips

5 PVA1000 PV Analyzer & SolSensor Provides a much more complete picture of PV array performance, in much less time, than separate current and voltage measurements. Array performance can be measured and issues resolved even before the inverter arrives. Full I-V curve for maximum detail ± ½% accuracy for I and V 20A, 1000V ranges Wireless interconnection 100m sensor range


6 How It Works Wireless mesh network Irradiance Temperature Tilt Module make & model Azimuth Irradiance Module temperature Tilt Latitude Longitude Date & time Built-in PV models 3 red dots predict curve shape I-V data


7 Mesh Network View Links pop-up When instruments are close to your PC, the wireless links are direct. When SolSensor is far away, the mesh network automatically switches to use the I-V Unit as a high power transmitter as a relay station (as shown in this example). View Links button

8 Current The Measured I-V Curve from the curve tracer Isc Actual I-V curve. No adjustments for irradiance or temperature. Not affected by your performance model. Voltage Voc

9 Current The Predicted I-V Curve from the PV model Isc Imp, Vmp Expected I-V curve shape, based on the design details and the present irradiance and temperature. Voltage Voc

10 Current Measurement vs. Prediction What you see on screen; the bottom line Isc Imp, Vmp Performance Factor is 100% if measured max power value agrees with the prediction of the PV model. Voltage Voc

11 Typical Measurement Setup Courtesy of Chevron Energy Solutions 2011


12 Typical Measurement Setup PC running PVA software


13 Saving a Measurement 2 1 3

14 Viewing the Measurement


15 Exporting I-V Curve Data
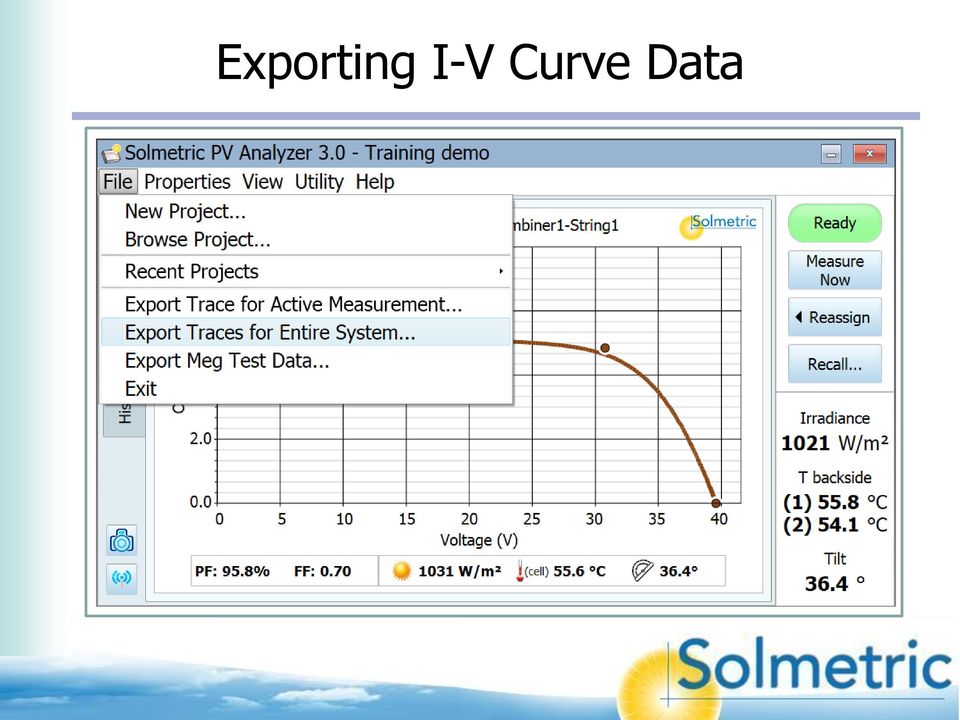

16 Exported Data The PVA software automatically creates this data directory tree on your hard drive (you select the location). The I-V Data Analysis Tool (DAT) accesses data from this tree. Each string folder contains a csv file of your string measurement. If you also measured the modules that make up the string, there will be modulelevel folders within the string folders. The DAT can import at the level of a single inverter or all inverters (entire system).

 Contains your PV model and I-V measurement data Easy to share between offices, and with")
17 The Project File xxxxxx.pvapx (v3.x) xxxxxx.pvap (v2.x) Contains your PV model and I-V measurement data Easy to share between offices, and with Solmetric for technical and applications support.

18 Topics PV Analyzer operation PV principles useful for data analysis Using the I-V Data Analysis Tool Interpreting your results Creating a summary Measurement tips

19 Current Power I-V and P-V Curves Expect this shape for healthy cells, modules, strings, arrays Isc Imp I-V curve Pmax P-V curve Voltage Vmp Voc The P-V (power vs. voltage) curve is calculated from the measured I-V curve Both curves auto-scale, so the relative heights of the curves is not important.
 curve is calculated from the measured I-V curve Both curves")
20 Current Building Block Concept Slide 1 Troubleshooting is easier if we think of the array (or string) I-V curve as a wall of module I-V building blocks. Voltage

21 Current Building Block Concept Slide 2 If we shade a module anywhere in the array, we lose a brick in the upper right corner of the wall. Voltage
22 Current Building Block Concept Slide 3 The smallest brick in the wall is the cell group. A typical 72 cell module has three cell groups, each protected by a bypass diode. Voltage
23 Current Building Block Concept Slide 4 If we shade a cell group anywhere in the array, we lose a smaller brick in the upper right corner of the wall. Voltage
24 Current Depth of the Step The depth of the step tells us the degree of impairment. Series 60% If we cover a cell group with shade cloth that blocks 60% of the light, we see a step of that depth. Voltage 60% sun block
25 Current Width of the Step The width of the step tells us how many cell groups are involved. 2/3 Voc (of module) Series In 72-cell modules, the narrowest steps are 10-12V wide, corresponding to individual cell groups. Voltage 60% sun block
26 Bypass Diode Action shade Icell Idiode % of cell hard shaded
27 The Most Impaired Cell Principle Cell groups The most shaded cell determines the current at which the bypass diode turns on. A B C In this seagull example, in what order do the bypass diodes turn on? (lowest to highest current)
28 Summary A bypass diode turns on when the most shaded cell in its cell group can no longer keep up with the rest of the module or string. The depth of the current step in the I-V curve tells us how heavily the most shaded (or soiled) cell is obstructed. The width of the current step tells us how many cell groups are obstructed The location of the current step in the I-V curve does not tell us where the shading is located in the string under test. The deepest steps always appear at the higher voltages (the right-hand region of the I-V curve), regardless of where the obstruction is in the array.
29 Current (A) Irradiance Effects Conventional crystalline silicon module W/m 2 Isc doubles when irradiance doubles, but this rule does not apply at all points along the curve Below 400 W/m 2, and especially below 200, cell voltages drop significantly. Low-light measurements do not accurately predict performance at high irradiance! That s true of ANY performance testing method, not just curve tracing Voltage (V) See a great demo of I-V curve vs irradiance at:
30 Current (A) Temperature Effects Conventional crystalline silicon module C Vmp and Voc drop %/C. Smaller effect for irradiance, but still important. The PV model accounts for these temperature effects The modeling is more accurate if the temperature measurement is accurate Temperature affects voltage more strongly than the current Voltage (V)
31 Current Square-ness of the I-V Curve Isc Increased square-ness means increased Pmax An important figure of merit of a PV source is the square-ness of its I-V curve. Squarer means higher Pmax for a given Isc and Voc. In an ideal world, the curve would be perfectly square and output power would be Isc x Voc. But this is not physically possible. Voltage Voc
32 Current Fill Factor A measure of the square-ness of the I-V curve Isc Imp Current ratio Imp/Isc Max Power Point Voltage ratio Vmp/Voc Voltage Vmp Voc Area of green rectangle Fill Factor = = Area of blue rectangle Imp x Vmp (watts) Isc x Voc (watts) For xsi, the Fill Factor is normally > 0.7
33 Topics PV Analyzer operation PV principles useful for data analysis Using the I-V Data Analysis Tool Interpreting your results Creating a summary Measurement tips
34 Data Analysis Steps 1. Export entire project s data from PVA software. This exports the most recent measurement for each location in the array tree. 2. Open the Data Analysis Tool (MS Excel workbook with macros) 3. Import the data and automatically crunch the numbers 4. Review and interpret data 5. Generate punch list if needed, fix issues, re-test as needed 6. Update the analysis 7. Generate DAT report 8. Supplement DAT report with a summary document (optional)
35 Frequency Current (Amps) What the DAT Displays String Table (all strings) I-V Graphs (combiner box) Voltage (Volts) 7 Histograms (all strings) Pmax (Watts)
36 String Table Limits (user settable) Statistics (per column) Parameter values (per string)
37 # of strings Histograms Show the consistency of the data Example: Histogram of Isc values for 99 strings Bin or bucket (0.5A wide in this histogram) Counts are whole numbers Isc (A)

38 Histogram Shapes Normal or bell-shaped Examples: Fill Factor of healthy PV strings Left skewed Fill Factor of randomly soiled strings Double-peak Voc of strings measured on a cold morning and a hot afternoon Plateau Isc values measured over a long day

39 Outliers Any type of distribution can have outliers. Here s an example of low-side and high-side outliers of a bell shaped distribution: Data analysis should identify outlier strings and sort out the possible causes.
40 Using the Data Analysis Tool
41 1. Selecting Which Sensor Data to Import This slide needs work given the new definition of features

42 1. Select Which Sensor Data to Import
43 2. Browse for Your I-V Data Tree (exported from the PVA software)

44 2. Browse for Your I-V Data Tree (exported from the PVA software) Select the desired level. All data below that level will be imported to the Data Analysis Tool. Exported PVA data Washington High School System Inverter1 Inverter2 Inverter3 Inverter4 Inverter5 Combiner1 Combiner2
45 3. Import and Analyze the Data
46 Frequency 3. Import and Analyze the Data Pmax (Watts) Samples of the Table and Histogram worksheets of the DAT. These displays are automatically generated.
47 4. Compare Measured vs. Modeled Values
48 4. Compare Measured vs. Modeled Values Home File Path I sc (Amps) I mp (Amps) V mp (Volts) V oc (Volts) Measured Model Measured Model Measured Model Measured Model Combiner1\String1\String PM.csv Combiner1\String10\String PM.csv Combiner1\String11\String PM.csv Combiner1\String12\String PM.csv Combiner1\String13\String PM.csv Combiner1\String14\String PM.csv Combiner1\String15\String PM.csv Combiner1\String16\String PM.csv Combiner1\String17\String PM.csv Combiner1\String18\String PM.csv Combiner1\String19\String PM.csv Combiner1\String2\String PM.csv Combiner1\String20\String PM.csv Combiner1\String21\String PM.csv Sample of the Model worksheet of the DAT. This table is automatically generated.
49 5. Select Data for I-V Curve Graphs Usually we want to plot the entire population of data
50 6. Plot I-V Curves
51 6. Plot I-V Curves Sample of an I-V Curves worksheet of the DAT. One graph is automatically generated for each combiner box.
52 7. Generate Report
53 Topics PV Analyzer operation PV principles useful for data analysis Using the I-V Data Analysis Tool Interpreting your results Creating a summary Measurement tips
 Histograms Scan for outliers and odd shapes Correlate shapes with variability of irradiance and temperature Table")
54 Starting Points for Interpreting I-V Data The starting point for your analysis is a matter of personal preference, but if you like your information in graphical form, this is a good flow. I-V Curve Graphs Scan for outliers and identify those strings (hover with cursor) Histograms Scan for outliers and odd shapes Correlate shapes with variability of irradiance and temperature Table Check the statistics (rows 5-9) Enter limit values (blue fields) to identify outliers (shaded yellow)
55 Standards for Pass/Fail Normally the contract will call out the critical parameters and standards. Common standards: a. Consistent values across the population of strings (eg Voc ± 2%) b. High values of Performance Factor (90-100%) c. Agreement of translated curves with STC-based model Other metrics and typical values: 1. Clean I-V curves 2. Performance Factor values above 90% 3. Fill Factor values > Current ratio values > Voltage ratio values > 0.78 High irradiance is assumed. Limit values vary by module technology and manufacturer.
56 Deviations from Normal I-V Curve Next we ll review common causes for each type of deviation. PV module degradation/failure is always a possible cause, but other causes should be considered first. Conventional measurements do not reveal many of these effects.
57 Steps in the I-V Curve

58 Steps in the I-V Curve Typically caused by shade, soiling, debris, snow, or cracked cells 350 Clark i1c3 The small steps represent shaded cell groups within modules. The width of the step tells us how many cell groups are involved. The height of the step tells us about the extent of shading on the most shaded cell in the group; lower amps means it s more shaded. We can t tell from the I-V curve where the shaded cell groups are located in the string. Record the string ID (for example i3c4s7) for the punch list and/or report.
59 Partially shaded residential array
60 Partially shaded residential array Approximately 40% reduction in string s output power

61 Hockey Sticks Hockey sticks often represent systematic shading over several adjacent cell groups or modules. In this case, the low current value of the hockey stick steps suggests that at least one cell in each of the cell groups is almost completely shaded. This type of pattern is unlikely to be caused by soiling or scattered shade because of the extent and uniformity of the obstruction and the fact that it happens on only a few of the strings.

62 Random Non-uniform Soiling Seagull example Effect similar to partial shading Steps in the I-V curve Smallest steps correspond to individual cell groups
63 Light Snow Cover on Array
64 Heavier Snow Cover on Array
65 Low Isc
66 Low Current Due to Soiling Uniform soiling and dirt dams are common causes Uniform soiling and dirt dams can both reduce Isc without causing steps in the I-V curve. This array had both types. Curves measured before and after cleaning showed that each caused 50% of the measured drop in string performance. Dirt dam Uniform soiling
67 Low Voc
68 Normal Variations in Voc In this set of curves from a combiner box, the shapes and levels are very consistent. Most likely, the irradiance and temperature were stable throughout and the strings were quite uniform.
69 Normal Variations in Voc In this set of curves from another combiner box, the shapes are mostly consistent but the voltages are slightly spread - why? Here are several possibilities: 1.Strings are slightly mismatched in voltage 2.Temperature is rapidly changing due to wind or shifting clouds 3.The strings don t all get the same amount of ventilation behind the modules. 4.Voc changes at low irradiance, but that doesn t fit this situation.
70 Possible Shorted Bypass Diodes FW Solar Field Voc Histogram If Voc is shifted downward by approximately a module Voc/N it may indicate a dropped cell group, likely caused by a shorted bypass diode. In this example at least two strings are likely to have one or more dropped cell groups. Validate dropped cell group by comparing the apparent Voc in the I-V curve with the true Voc value in the Table tab. Full shading of a PV cell causes a similar looking left-shift, but a tail is usually present where curve approaches x-axis.
71 Low Voc vs. Last Point Effect The green trace s Voc value is about 12 volts lower than the average of the other strings. This is likely caused by a shorted bypass diode. s12 s14 Voc s13 Voc 513 s11 Voc 498 Others (Avg) Voc 510 The blue and orange traces (s12,13) do not reach all the way down to the x-axis. This is because the 100 I-V points were used up before the curve reached zero current. This sometimes happens when Isc is very low or there is a low- current tail on the curve, as shown here. If the curve does not reach the x- axis, look at the table value of Voc, which is from a Voc measurement performed immediately before the I-V curve is measured.
72 South string, west module Potential Induced Degradation Fill Factor Histogram PID is driven by high voltage stress. It s more likely to occur at higher voltages and negative polarity, and in modules with less effective encapsulation. Electro-corrosion type is not reversible. Symptoms include reduced Voc and Fill Factor (more rounded knee). Can be seen at string or module levels.
73 Rounder Knee
74 Rounder Knee A rounder knee is difficult to differentiate from changes of slope in the horizontal and vertical legs of the curve.
75 Reduced Slope in Vertical Leg
76 Current - A Increased Series Resistance Reduced slope in vertical leg of curve Failed module Neighboring strings String 4B14 String 4B Voltage - V

77 Increased Slope in Horizontal Leg
78 Increased Slope in Horizontal Leg Shunt resistance The normal slope in the horizontal leg of the I-V curve is caused by shunt resistance in the PV cells. Shunt resistance allows a small current to flow backward through the cells, and the level of that current is proportional to the cell voltage, giving that leg of the curve its familiar linear downward slope. Over time it is possible for cells to degrade to lower levels of shunt resistance, which increases the slope in the horizontal leg. Image courtesy of:

79 350 Clark i2c Increased Slope in Horizontal Leg Tapered shading or soiling Typically caused by tapered shading or tapered soiling. For a uniform slope, each cell group must be obstructed to a slightly different extent. Often slight steps will remain. Common causes are inter-row shading early or late in the day, or dirt dams that get progressively wider across a string of modules in portrait mode. Electrical shunts can cause slopes, but it s much less common. PID can also cause the slope, and may be accompanied by low Voc.

80 Increased Slope in Horizontal Leg Potential Induced Degradation PID is driven by high voltage stress. It s more likely to occur at higher voltages and negative polarity, and in modules with less effective encapsulation. Electro-corrosion type is not reversible. Symptoms include reduced Voc, rounder knee, and increased slope in the horizontal leg of the curve. Can be seen at string or module levels.

81 Fill Factor Representation of steps and slopes in the curve 350 Clark i2c3 The stepped and sloped I-V curves are represented as lowside outliers in the Fill Factor histogram. Fill Factor is a good diagnostic tool because it is not strongly affected by level of irradiance.

82 350 Clark i3 Strongly Irradiance-Dependent Parameters These tend to have irradiance-like distributions unless blurred by other issues Irradiance Isc Imp Pmax Histograms of the same population of measurements
83 Less Irradiance-Dependent Parameters (At high light levels. At low light levels, their dependence increases.) 350 Clark i3 Irradiance Fill Factor Shade effects Performance Factor Shade effects Histograms of the same population of measurements
84 Creating your own custom graphs Easiest to do in the Table worksheet
85 Limitations of STC Translation Not unique to curve tracing! Traditionally, translation or normalization of I-V data to STC conditions is much less accurate if the curves were measured at low light conditions, especially at <400W/m 2. The PV model used in PVA-1000 with SolSensor improves this situation by modeling low light effects, whenever low-light parameters are available in the database. If irradiance is unstable, there will be more ± scatter in the translated data. This is minimized by the PVA-1000 with SolSensor by wirelessly triggering the I-V and sensor measurements simultaneously. Measured temperature may poorly track the strings under test due to wind, array temperature gradients, or inconsistent placement of thermocouples.
86 Topics PV Analyzer operation PV principles useful for data analysis Using the I-V Data Analysis Tool Interpreting your results Creating a summary Measurement tips

87 Summary Template in MS Word Companion document to (or substitute for) the actual DAT report. Represents the findings in a compact, easy to understand format. Discusses only those strings that have issues. Concludes with an executive summary.

88 Summary Template in MS Excel Select Deviation and Follow-up items from drop-down lists, or enter your own text Data filtering allows sorting for particular cases Can send the worksheet to a printer or PDF file
89 Topics PV Analyzer operation PV principles useful for data analysis Using the I-V Data Analysis Tool Interpreting your results Creating a summary Measurement tips
90 Top 10 Measurement Tips (Many are not unique to curve tracing!) 1. Set your PC clock to the correct local time, time zone, and daylight savings status. 2. Orient the irradiance sensor in the plane of the array. 3. Measure array performance at high irradiance (ideally 1000, never less than 400). 4. Avoid mounting the irradiance sensor in shade or strong reflections. 5. In diffuse light conditions, locate the irradiance sensor for an open view of the sky. 6. Remember that the SmartTemp method requires a backside thermocouple. 7. Make sure the thermocouple is in firm contact with the module backside. 8. Place the thermocouple at a location with average temperature, and make the thermocouple mounting location consistent from sub-array to sub-array. 9. Re-measure the first trace of the session if it has straight line segments. 10. Check for PVA software updates!
91 The First Trace Effect The PVA uses the first trace to optimize internal settings The PVA software uses the first trace to learn the voltage and current characteristics of the PV source. The PVA then selects internal circuit settings to optimize the measurement of that type of device. If you get a first trace that has long straight line segments, that s the learning trace. Just take the measurement over. All subsequent measurements will use those optimized internal settings. If the type of device you are measuring changes in mid-session, you may see the first trace effect again, and need to take that first measurement over.
92 Time Zone Considerations Setting up for making measurements The PVA software date/time stamps each measurement. The date and time are used in the model to predict the values of the Isc, Imp, Vmp, Voc, and Performance Factor. Before measuring, set your PC to the correct local date, time, time zone, and Daylight Savings status. Exporting Project data Before exporting Project data from PVA software 2.x or 3.0, set your PC s UTC/GMT offset to the value that was used when the measurements were actually taken. Starting with v3.1, you will not need to fake your time zone before exporting data.
93 GMT Offset, Time Zone, DLS UTC/GMT Offset (hours) Pacific time Mountain time Central time Eastern time DST off DST on Check to look up the time zone and Daylight Savings details for your site.
94 Temperature Profile Flush Mounted Array
95 Consistency of Thermocouple Location Choose a good location and repeat it on each sub-array Photo courtesy of Sun Lion Energy Systems
96 Products Available from Solmetric SunEye 210 Shade Tool PV Analyzer I-V Curve Tracers PV Designer Software Megger MIT-430 Insulation Tester FLIR Infrared Cameras
97 Analysis and Reporting of I-V Curve Data from Large PV Arrays Solmetric Webinar February 5, 2014 Paul Hernday Senior Applications Engineer cell Ask about the survey! ls/poster?lead=
Application Note - How to Design a SolarEdge System Using PVsyst
 March 2015 Application Note - How to Design a SolarEdge System Using PVsyst As of version 5.20, PVsyst - the PV system design software - supports the design of SolarEdge systems. This application note
Solar Power at Vernier Software & Technology
 Solar Power at Vernier Software & Technology Having an eco-friendly business is important to Vernier. Towards that end, we have recently completed a two-phase project to add solar panels to our building
PentaMetric battery Monitor System Sentry data logging
 PentaMetric battery Monitor System Sentry data logging How to graph and analyze renewable energy system performance using the PentaMetric data logging function. Bogart Engineering Revised August 10, 2009:
Application Note: Understanding the Solmetric SunEye
 Application Note: Understanding the Solmetric SunEye Abstract Thorough site evaluation will not guarantee a successful solar installation, but it can definitely increase the chances. Solar site evaluation
PSIM Tutorial. How to Use Solar Module Physical Model. - 1 - Powersim Inc. www.powersimtech.com
 PSIM Tutorial How to Use Solar Module Physical Model - 1 - Powersim Inc. This tutorial describes how to use the solar module physical model. The physical model of the solar module can take into account
Solar Cell Optimization: Cutting Costs and Driving Performance
 Solar Cell Optimization: Cutting Costs and Driving Performance 1 Executive Summary Over the past several years, DC optimizers have become an important technological ingredient in many residential, commercial
Photovoltaic String Inverters and Shade-Tolerant Maximum Power Point Tracking: Toward Optimal Harvest Efficiency and Maximum ROI
 Figure at left Ut alissen dignibh esse dipsumsan velisse tem zzriliquis alit lore facidui etum zzrillan hendignit, ver irit augait luptat faccum iliquatue facilit aliquis molore. Photovoltaic String Inverters
Universal Simple Control, USC-1
 Universal Simple Control, USC-1 Data and Event Logging with the USB Flash Drive DATA-PAK The USC-1 universal simple voltage regulator control uses a flash drive to store data. Then a propriety Data and
Plots, Curve-Fitting, and Data Modeling in Microsoft Excel
 Plots, Curve-Fitting, and Data Modeling in Microsoft Excel This handout offers some tips on making nice plots of data collected in your lab experiments, as well as instruction on how to use the built-in
Solar Heating Basics. 2007 Page 1. a lot on the shape, colour, and texture of the surrounding
 2007 Page 1 Solar Heating Basics Reflected radiation is solar energy received by collectorsfrom adjacent surfaces of the building or ground. It depends a lot on the shape, colour, and texture of the surrounding
Renewable Energy Test Station (RETS) TEST PROCEDURES FOR SOLAR TUKI
 TEST PROCEDURES FOR SOLAR TUKI") Renewable Energy Test Station (RETS) TEST PROCEDURES FOR SOLAR TUKI March 2007 A. Test Procedures for Solar Tuki Lamp S. No. Test Parameters Technical Requirements Instruments Required Test Methods A.
Renewable Energy Test Station (RETS) TEST PROCEDURES FOR SOLAR TUKI March 2007 A. Test Procedures for Solar Tuki Lamp S. No. Test Parameters Technical Requirements Instruments Required Test Methods A.
FREE FALL. Introduction. Reference Young and Freedman, University Physics, 12 th Edition: Chapter 2, section 2.5
 Physics 161 FREE FALL Introduction This experiment is designed to study the motion of an object that is accelerated by the force of gravity. It also serves as an introduction to the data analysis capabilities
KADUNA CLINICS SOLAR SYSTEMS PERFORMANCE TESTING
 KADUNA CLINICS SOLAR SYSTEMS PERFORMANCE TESTING Oct 24, 2015 KADUNA PERFORMANCE TESTING PROCESS OFFGRID PV SOLAR SYSTEMS FOR PRIMARY HEALTHCARE CENTERS IN KADUNA STATE Prepared for: Crown Agents Limited
High Resolution Spatial Electroluminescence Imaging of Photovoltaic Modules
 High Resolution Spatial Electroluminescence Imaging of Photovoltaic Modules Abstract J.L. Crozier, E.E. van Dyk, F.J. Vorster Nelson Mandela Metropolitan University Electroluminescence (EL) is a useful
Stand Alone PV System Sizing Worksheet (example)
") Stand Alone PV System Sizing Worksheet (example) Application: Stand alone camp system 7 miles off grid Location: Baton Rouge, La Latitude: 31.53 N A. Loads A1 Inverter efficiency 85 A2 Battery Bus voltage
Stand Alone PV System Sizing Worksheet (example) Application: Stand alone camp system 7 miles off grid Location: Baton Rouge, La Latitude: 31.53 N A. Loads A1 Inverter efficiency 85 A2 Battery Bus voltage
TIBCO Spotfire Business Author Essentials Quick Reference Guide. Table of contents:
 Table of contents: Access Data for Analysis Data file types Format assumptions Data from Excel Information links Add multiple data tables Create & Interpret Visualizations Table Pie Chart Cross Table Treemap
Drawing a histogram using Excel
 Drawing a histogram using Excel STEP 1: Examine the data to decide how many class intervals you need and what the class boundaries should be. (In an assignment you may be told what class boundaries to
Data representation and analysis in Excel
 Page 1 Data representation and analysis in Excel Let s Get Started! This course will teach you how to analyze data and make charts in Excel so that the data may be represented in a visual way that reflects
Exploratory Spatial Data Analysis
 Exploratory Spatial Data Analysis Part II Dynamically Linked Views 1 Contents Introduction: why to use non-cartographic data displays Display linking by object highlighting Dynamic Query Object classification
Diagrams and Graphs of Statistical Data
 Diagrams and Graphs of Statistical Data One of the most effective and interesting alternative way in which a statistical data may be presented is through diagrams and graphs. There are several ways in
Your Personal Trading Journal
 Your Personal Trading Journal This guide provides instructions for the setup and helps you getting started with your Edgewonk trading journal. It is recommended that you read it thoroughly to fully leverage
BNG 202 Biomechanics Lab. Descriptive statistics and probability distributions I
 BNG 202 Biomechanics Lab Descriptive statistics and probability distributions I Overview The overall goal of this short course in statistics is to provide an introduction to descriptive and inferential
SECTION 2-1: OVERVIEW SECTION 2-2: FREQUENCY DISTRIBUTIONS
 SECTION 2-1: OVERVIEW Chapter 2 Describing, Exploring and Comparing Data 19 In this chapter, we will use the capabilities of Excel to help us look more carefully at sets of data. We can do this by re-organizing
Exercise 1.12 (Pg. 22-23)
") Individuals: The objects that are described by a set of data. They may be people, animals, things, etc. (Also referred to as Cases or Records) Variables: The characteristics recorded about each individual.
Individuals: The objects that are described by a set of data. They may be people, animals, things, etc. (Also referred to as Cases or Records) Variables: The characteristics recorded about each individual.
Appendix 2.1 Tabular and Graphical Methods Using Excel
 Appendix 2.1 Tabular and Graphical Methods Using Excel 1 Appendix 2.1 Tabular and Graphical Methods Using Excel The instructions in this section begin by describing the entry of data into an Excel spreadsheet.
Renewable Energy. Solar Power. Courseware Sample 86352-F0
 Renewable Energy Solar Power Courseware Sample 86352-F0 A RENEWABLE ENERGY SOLAR POWER Courseware Sample by the staff of Lab-Volt Ltd. Copyright 2009 Lab-Volt Ltd. All rights reserved. No part of this
Tutorial 2: Using Excel in Data Analysis
 Tutorial 2: Using Excel in Data Analysis This tutorial guide addresses several issues particularly relevant in the context of the level 1 Physics lab sessions at Durham: organising your work sheet neatly,
Using Excel (Microsoft Office 2007 Version) for Graphical Analysis of Data
 for Graphical Analysis of Data") Using Excel (Microsoft Office 2007 Version) for Graphical Analysis of Data Introduction In several upcoming labs, a primary goal will be to determine the mathematical relationship between two variable
Using Excel (Microsoft Office 2007 Version) for Graphical Analysis of Data Introduction In several upcoming labs, a primary goal will be to determine the mathematical relationship between two variable
Chapter 4 Creating Charts and Graphs
 Calc Guide Chapter 4 OpenOffice.org Copyright This document is Copyright 2006 by its contributors as listed in the section titled Authors. You can distribute it and/or modify it under the terms of either
Tutorial for Tracker and Supporting Software By David Chandler
 Tutorial for Tracker and Supporting Software By David Chandler I use a number of free, open source programs to do video analysis. 1. Avidemux, to exerpt the video clip, read the video properties, and save
Plotting: Customizing the Graph
 Plotting: Customizing the Graph Data Plots: General Tips Making a Data Plot Active Within a graph layer, only one data plot can be active. A data plot must be set active before you can use the Data Selector
seven Statistical Analysis with Excel chapter OVERVIEW CHAPTER
 seven Statistical Analysis with Excel CHAPTER chapter OVERVIEW 7.1 Introduction 7.2 Understanding Data 7.3 Relationships in Data 7.4 Distributions 7.5 Summary 7.6 Exercises 147 148 CHAPTER 7 Statistical
How To Use The Csi Ebpp Calculator
 CSI EPBB Design Factor Calculator User Guide 1. Guide Overview This User Guide is intended to provide background on the California Solar Initiative (CSI) Expected Performance Based Buydown (EPBB) Design
Ver.19 December 17, 2013. Program & Document Principles DOCUMENT INTENT, OBJECTIVES & MANAGEMENT. PART I Definitions, Overview & Objectives
 PSEG Long Island SOLAR PIONEER & SOLAR ENTREPRENEUR PROGRAM IMPLEMENTATION GUIDE FOR INSTALLATION CONTRACTORS Rules & Procedures for Solar PV Systems Production Estimating & Rebate Determination Ver.19
Using Excel for Analyzing Survey Questionnaires Jennifer Leahy
 University of Wisconsin-Extension Cooperative Extension Madison, Wisconsin PD &E Program Development & Evaluation Using Excel for Analyzing Survey Questionnaires Jennifer Leahy G3658-14 Introduction You
Replacing Fuel With Solar Energy
 Replacing Fuel With Solar Energy Analysis by Michael Hauke, RSA Engineering January 22, 2009 The Right Place for Solar Energy Harvesting solar energy at South Pole can reduce the fuel consumption needed
Unit 7 Quadratic Relations of the Form y = ax 2 + bx + c
 Unit 7 Quadratic Relations of the Form y = ax 2 + bx + c Lesson Outline BIG PICTURE Students will: manipulate algebraic expressions, as needed to understand quadratic relations; identify characteristics
Density Curve. A density curve is the graph of a continuous probability distribution. It must satisfy the following properties:
 Density Curve A density curve is the graph of a continuous probability distribution. It must satisfy the following properties: 1. The total area under the curve must equal 1. 2. Every point on the curve
Tutorial 3: Graphics and Exploratory Data Analysis in R Jason Pienaar and Tom Miller
 Tutorial 3: Graphics and Exploratory Data Analysis in R Jason Pienaar and Tom Miller Getting to know the data An important first step before performing any kind of statistical analysis is to familiarize
Solar Powered Wireless Sensors & Instrumentation: Energy Harvesting Technology Reduces Operating Cost at Remote Sites
 Solar Powered Wireless Sensors & Instrumentation: Energy Harvesting Technology Reduces Operating Cost at Remote Sites Standards Certification Education & Training Publishing Conferences & Exhibits Michael
Excel -- Creating Charts
 Excel -- Creating Charts The saying goes, A picture is worth a thousand words, and so true. Professional looking charts give visual enhancement to your statistics, fiscal reports or presentation. Excel
Siting of Active Solar Collectors and Photovoltaic Modules
 SOLAR CENTER INFORMATION NCSU Box 7401 Raleigh, NC 27695 (919) 515-3480 Toll Free 1-800-33-NC SUN Siting of Active Solar Collectors and Photovoltaic Modules To install a solar energy system properly, it
Creating Drawings in Pro/ENGINEER
 6 Creating Drawings in Pro/ENGINEER This chapter shows you how to bring the cell phone models and the assembly you ve created into the Pro/ENGINEER Drawing mode to create a drawing. A mechanical drawing
Dual Axis Sun Tracking System with PV Panel as the Sensor, Utilizing Electrical Characteristic of the Solar Panel to Determine Insolation
 Dual Axis Sun Tracking System with PV Panel as the Sensor, Utilizing Electrical Characteristic of the Solar Panel to Determine Insolation Freddy Wilyanto Suwandi Abstract This paper describes the design
GUIDELINES FOR PREPARING POSTERS USING POWERPOINT PRESENTATION SOFTWARE
 Society for the Teaching of Psychology (APA Division 2) OFFICE OF TEACHING RESOURCES IN PSYCHOLOGY (OTRP) Department of Psychology, Georgia Southern University, P. O. Box 8041, Statesboro, GA 30460-8041
TABLE OF CONTENTS. INTRODUCTION... 5 Advance Concrete... 5 Where to find information?... 6 INSTALLATION... 7 STARTING ADVANCE CONCRETE...
 Starting Guide TABLE OF CONTENTS INTRODUCTION... 5 Advance Concrete... 5 Where to find information?... 6 INSTALLATION... 7 STARTING ADVANCE CONCRETE... 7 ADVANCE CONCRETE USER INTERFACE... 7 Other important
Heat Map Explorer Getting Started Guide
 You have made a smart decision in choosing Lab Escape s Heat Map Explorer. Over the next 30 minutes this guide will show you how to analyze your data visually. Your investment in learning to leverage heat
Design of Grid Connect PV systems. Palau Workshop 8 th -12 th April
 Design of Grid Connect PV systems Palau Workshop 8 th -12 th April INTRODUCTION The document provides the minimum knowledge required when designing a PV Grid connect system. The actual design criteria
MyOra 3.0. User Guide. SQL Tool for Oracle. Jayam Systems, LLC
 MyOra 3.0 SQL Tool for Oracle User Guide Jayam Systems, LLC Contents Features... 4 Connecting to the Database... 5 Login... 5 Login History... 6 Connection Indicator... 6 Closing the Connection... 7 SQL
Running the Electric Meter Backwards: Real-Life Experience with a Residential Solar Power System
 Running the Electric Meter Backwards: Real-Life Experience with a Residential Solar Power System Brooks Martner Lafayette, Colorado University of Toledo Spring 2015 PHYS 4400 - Principles and Varieties
Reference Guide. Vantage PRO2 Quick
 3465 Diablo Avenue, Hayward, CA 94545-2778 U.S.A. 510-732-9229 Fax: 510-732-9188 E-mail: info@davisnet.com www.davisnet.com Vantage PRO2 Quick Reference Guide Part Number: 07395.235 Rev C (1/6/2012) 2012
Instructions for Creating a Poster for Arts and Humanities Research Day Using PowerPoint
 Instructions for Creating a Poster for Arts and Humanities Research Day Using PowerPoint While it is, of course, possible to create a Research Day poster using a graphics editing programme such as Adobe
If you know exactly how you want your business forms to look and don t mind detail
 Advanced Form Customization APPENDIX E If you know exactly how you want your business forms to look and don t mind detail work, you can customize QuickBooks forms however you want. With QuickBooks Layout
SE05: Getting Started with Cognex DataMan Bar Code Readers - Hands On Lab Werner Solution Expo April 8 & 9
 SE05: Getting Started with Cognex DataMan Bar Code Readers - Hands On Lab Werner Solution Expo April 8 & 9 Learning Goals: At the end of this lab, the student should have basic familiarity with the DataMan
Guide To Creating Academic Posters Using Microsoft PowerPoint 2010
 Guide To Creating Academic Posters Using Microsoft PowerPoint 2010 INFORMATION SERVICES Version 3.0 July 2011 Table of Contents Section 1 - Introduction... 1 Section 2 - Initial Preparation... 2 2.1 Overall
Exploratory data analysis (Chapter 2) Fall 2011
 Fall 2011") Exploratory data analysis (Chapter 2) Fall 2011 Data Examples Example 1: Survey Data 1 Data collected from a Stat 371 class in Fall 2005 2 They answered questions about their: gender, major, year in school,
Exploratory data analysis (Chapter 2) Fall 2011 Data Examples Example 1: Survey Data 1 Data collected from a Stat 371 class in Fall 2005 2 They answered questions about their: gender, major, year in school,
How To Use Tigo Energy
 System Owner s Manual Tigo Energy Maximizer System Applies to the following: Tigo Energy Module Maximizer (MM-ES) Tigo Energy Dual Maximizer (MM-2ES) Tigo Energy Maximizer Management Unit (MMU) Model numbers:
Hydras 3 LT Quick Start
 Catalog Number 6234218 Hydras 3 LT Quick Start SOFTWARE MANUAL December 2005, Edition 2 Hach Company, 2005. All rights reserved. Printed in the U.S.A. Catalog Number 6234218 Hydras 3 LT SOFTWARE MANUAL
SA-9600 Surface Area Software Manual
 SA-9600 Surface Area Software Manual Version 4.0 Introduction The operation and data Presentation of the SA-9600 Surface Area analyzer is performed using a Microsoft Windows based software package. The
Common Tools for Displaying and Communicating Data for Process Improvement
 Common Tools for Displaying and Communicating Data for Process Improvement Packet includes: Tool Use Page # Box and Whisker Plot Check Sheet Control Chart Histogram Pareto Diagram Run Chart Scatter Plot
There are six different windows that can be opened when using SPSS. The following will give a description of each of them.
 SPSS Basics Tutorial 1: SPSS Windows There are six different windows that can be opened when using SPSS. The following will give a description of each of them. The Data Editor The Data Editor is a spreadsheet
MARS STUDENT IMAGING PROJECT
 MARS STUDENT IMAGING PROJECT Data Analysis Practice Guide Mars Education Program Arizona State University Data Analysis Practice Guide This set of activities is designed to help you organize data you collect
Years after 2000. US Student to Teacher Ratio 0 16.048 1 15.893 2 15.900 3 15.900 4 15.800 5 15.657 6 15.540
 To complete this technology assignment, you should already have created a scatter plot for your data on your calculator and/or in Excel. You could do this with any two columns of data, but for demonstration
Intellect Platform - The Workflow Engine Basic HelpDesk Troubleticket System - A102
 Intellect Platform - The Workflow Engine Basic HelpDesk Troubleticket System - A102 Interneer, Inc. Updated on 2/22/2012 Created by Erika Keresztyen Fahey 2 Workflow - A102 - Basic HelpDesk Ticketing System
Intro to Excel spreadsheets
 Intro to Excel spreadsheets What are the objectives of this document? The objectives of document are: 1. Familiarize you with what a spreadsheet is, how it works, and what its capabilities are; 2. Using
Solar Energy Systems. Matt Aldeman Senior Energy Analyst Center for Renewable Energy Illinois State University
 Solar Energy Solar Energy Systems Matt Aldeman Senior Energy Analyst Center for Renewable Energy Illinois State University 1 SOLAR ENERGY OVERVIEW 1) Types of Solar Power Plants 2) Describing the Solar
Solar Matters III Teacher Page
 Solar Matters III Teacher Page Solar Powered System - 2 Student Objective Given a photovoltaic system will be able to name the component parts and describe their function in the PV system. will be able
Application Note: String sizing Conext CL Series
 : String sizing Conext CL Series 965-0066-01-01 Rev A DANGER RISK OF FIRE, ELECTRIC SHOCK, EXPLOSION, AND ARC FLASH This Application Note is in addition to, and incorporates by reference, the installation
All V7 registers support barcode printing, except the Sharp 410/420 1A ROM and that limitation is based upon the register.
 Tools Section Barcode Printing These are basic instructions for Version 7 Polling barcode printing. Users will need to have a PLU/UPC file containing either UPC-A, UPC-E, EAN 13 or EAN 8 numbers, label
SPSS Manual for Introductory Applied Statistics: A Variable Approach
 SPSS Manual for Introductory Applied Statistics: A Variable Approach John Gabrosek Department of Statistics Grand Valley State University Allendale, MI USA August 2013 2 Copyright 2013 John Gabrosek. All
Watch Your Garden Grow
 Watch Your Garden Grow The Brinno GardenWatchCam is a low cost, light weight, weather resistant, battery operated time-lapse camera that captures the entire lifecycle of any garden season by taking photos
GENERAL INSTALLATION MANUAL FOR EGING PV MODULES
 GENERAL INSTALLATION MANUAL FOR EGING PV MODULES PLEASE READ THIS MANUAL CAREFULLY BEFORE INSTALLING OR USING THE MODULES. PLEASE PASS ALONG THE ATTACHED USER MANUAL TO YOUR CUSTOMER. 1. INTRODUCTION This
Chapter 1 Kingsoft Office for Android: A Close Look. Compatible with Microsoft Office: With Kingsoft Office for Android, users are allowed to create,
 Introduction From the globally respected software company Kingsoft, comes an extraordinary new Office software for your Android mobile or tablet device. Utilizing decades of leading innovation, Kingsoft
EFFICIENT EAST-WEST ORIENTATED PV SYSTEMS WITH ONE MPP TRACKER
 EFFICIENT EAST-WEST ORIENTATED PV SYSTEMS WITH ONE MPP TRACKER A willingness to install east-west orientated photovoltaic (PV) systems has lacked in the past. Nowadays, however, interest in installing
12 SOLAR PHOTOVOLTAIC POWER SUPPLY SYSTEMS by John Ware. PV modules are current-limiting
 12 SOLAR PHOTOVOLTAIC POWER by John Ware IT IS PLANNED for BS 7671:2008 to include a new Section 712 providing additional requirements for safety applicable to solar photovoltaic (pv) power supply systems.
Instructions for Use. CyAn ADP. High-speed Analyzer. Summit 4.3. 0000050G June 2008. Beckman Coulter, Inc. 4300 N. Harbor Blvd. Fullerton, CA 92835
 Instructions for Use CyAn ADP High-speed Analyzer Summit 4.3 0000050G June 2008 Beckman Coulter, Inc. 4300 N. Harbor Blvd. Fullerton, CA 92835 Overview Summit software is a Windows based application that
Summarizing and Displaying Categorical Data
 Summarizing and Displaying Categorical Data Categorical data can be summarized in a frequency distribution which counts the number of cases, or frequency, that fall into each category, or a relative frequency
Custom Reporting System User Guide
 Citibank Custom Reporting System User Guide April 2012 Version 8.1.1 Transaction Services Citibank Custom Reporting System User Guide Table of Contents Table of Contents User Guide Overview...2 Subscribe
Basic Excel Handbook
 2 5 2 7 1 1 0 4 3 9 8 1 Basic Excel Handbook Version 3.6 May 6, 2008 Contents Contents... 1 Part I: Background Information...3 About This Handbook... 4 Excel Terminology... 5 Excel Terminology (cont.)...
SOLAR RADIATION AND YIELD. Alessandro Massi Pavan
 SOLAR RADIATION AND YIELD Alessandro Massi Pavan Sesto Val Pusteria June 22 nd 26 th, 2015 DEFINITIONS Solar radiation: general meaning Irradiation [Wh/m 2 ]: energy received per unit area Irradiance [W/m
STC: Descriptive Statistics in Excel 2013. Running Descriptive and Correlational Analysis in Excel 2013
 Running Descriptive and Correlational Analysis in Excel 2013 Tips for coding a survey Use short phrases for your data table headers to keep your worksheet neat, you can always edit the labels in tables
Instruction Manual for SPC for MS Excel V3.0
 Frequency Business Process Improvement 281-304-9504 20314 Lakeland Falls www.spcforexcel.com Cypress, TX 77433 Instruction Manual for SPC for MS Excel V3.0 35 30 25 LSL=60 Nominal=70 Capability Analysis
STATGRAPHICS Online. Statistical Analysis and Data Visualization System. Revised 6/21/2012. Copyright 2012 by StatPoint Technologies, Inc.
 STATGRAPHICS Online Statistical Analysis and Data Visualization System Revised 6/21/2012 Copyright 2012 by StatPoint Technologies, Inc. All rights reserved. Table of Contents Introduction... 1 Chapter
How does the Review Program work?
 Welcome Welcome to the Heavy Weather Review application (Review), the essential tool for analysis & visualization. Review works together with Heavy Weather Software and uses the collected data to generate
The APOLLO cloud product statistics Web service
 The APOLLO cloud product statistics Web service Introduction DLR and Transvalor are preparing a new Web service to disseminate the statistics of the APOLLO cloud physical parameters as a further help in
Creating Interactive PDF Forms
 Creating Interactive PDF Forms Using Adobe Acrobat X Pro Information Technology Services Outreach and Distance Learning Technologies Copyright 2012 KSU Department of Information Technology Services This
1 Table of Contents SolarEdge Site Design Tool
 1 Table of Contents SolarEdge Site Design Tool SolarEdge Site Designer V2.2 2 Table of Contents Table of Contents... 2 Introduction... 3 Starting to Use the Site Designer... 4 Begin a New Project... 9
Ohio University Computer Services Center August, 2002 Crystal Reports Introduction Quick Reference Guide
 Open Crystal Reports From the Windows Start menu choose Programs and then Crystal Reports. Creating a Blank Report Ohio University Computer Services Center August, 2002 Crystal Reports Introduction Quick
Intellect Platform - Parent-Child relationship Basic Expense Management System - A103
 Intellect Platform - Parent-Child relationship Basic Expense Management System - A103 Interneer, Inc. Updated 2/29/2012 Created by Erika Keresztyen Fahey 2 Parent-Child relationship - A103 - Basic Expense
ACCESS 2007. Importing and Exporting Data Files. Information Technology. MS Access 2007 Users Guide. IT Training & Development (818) 677-1700
 677-1700") Information Technology MS Access 2007 Users Guide ACCESS 2007 Importing and Exporting Data Files IT Training & Development (818) 677-1700 training@csun.edu TABLE OF CONTENTS Introduction... 1 Import Excel
Information Technology MS Access 2007 Users Guide ACCESS 2007 Importing and Exporting Data Files IT Training & Development (818) 677-1700 training@csun.edu TABLE OF CONTENTS Introduction... 1 Import Excel
Create a Poster Using Publisher
 Contents 1. Introduction 1. Starting Publisher 2. Create a Poster Template 5. Aligning your images and text 7. Apply a background 12. Add text to your poster 14. Add pictures to your poster 17. Add graphs
Fundamentals of Signature Analysis
 Fundamentals of Signature Analysis An In-depth Overview of Power-off Testing Using Analog Signature Analysis www.huntron.com 1 www.huntron.com 2 Table of Contents SECTION 1. INTRODUCTION... 7 PURPOSE...
Design of a Photovoltaic Data Monitoring System and Performance Analysis of the 56 kw the Murdoch University Library Photovoltaic System
 School of Engineering and Information Technology ENG460 Engineering Thesis Design of a Photovoltaic Data Monitoring System and Performance Analysis of the 56 kw the Murdoch University Library Photovoltaic
NCSS Statistical Software Principal Components Regression. In ordinary least squares, the regression coefficients are estimated using the formula ( )
") Chapter 340 Principal Components Regression Introduction is a technique for analyzing multiple regression data that suffer from multicollinearity. When multicollinearity occurs, least squares estimates
Chapter 340 Principal Components Regression Introduction is a technique for analyzing multiple regression data that suffer from multicollinearity. When multicollinearity occurs, least squares estimates
User Tutorial on Changing Frame Size, Window Size, and Screen Resolution for The Original Version of The Cancer-Rates.Info/NJ Application
 User Tutorial on Changing Frame Size, Window Size, and Screen Resolution for The Original Version of The Cancer-Rates.Info/NJ Application Introduction The original version of Cancer-Rates.Info/NJ, like
REDUCING UNCERTAINTY IN SOLAR ENERGY ESTIMATES
 REDUCING UNCERTAINTY IN SOLAR ENERGY ESTIMATES Mitigating Energy Risk through On-Site Monitoring Marie Schnitzer, Vice President of Consulting Services Christopher Thuman, Senior Meteorologist Peter Johnson,
Solar Energy Discovery Lab
 Solar Energy Discovery Lab Objective Set up circuits with solar cells in series and parallel and analyze the resulting characteristics. Introduction A photovoltaic solar cell converts radiant (solar) energy
ZOINED RETAIL ANALYTICS. User Guide
 ZOINED RETAIL ANALYTICS User Guide Contents Using the portal New user Profile Email reports Portal use Dashboard Drilling down into the data Filter options Analytics Managing analysis Saving the analysis
Microsoft Access 2010 Overview of Basics
 Opening Screen Access 2010 launches with a window allowing you to: create a new database from a template; create a new template from scratch; or open an existing database. Open existing Templates Create
Optimum Solar Orientation: Miami, Florida
 Optimum Solar Orientation: Miami, Florida The orientation of architecture in relation to the sun is likely the most significant connection that we can make to place in regards to energy efficiency. In