Size-dependent predation risk for young bivalves
|
|
|
- Verity Murphy
- 8 years ago
- Views:
Transcription
1 Size-dependent predation risk for young bivalves

2 ISBN: Cover painting: Elise Andresen-Bunjes, Watt vor Sylt 2009, acryl on canvas, cm Photos: Page 6 and 82 made by Oscar Bos Page 34 and 151 made by Jan Drent Printed by Ipskamp drukkers The research in this thesis was carried out at the Department of Marine Ecology, Royal Netherlands Institute for Sea Research (NIOZ), P.O. Box 59, 1790 AB Den Burg, The Netherlands, with financial support from the Netherlands Organization for Scientific Research (NWO) and Netherlands-Bremen Oceanography (NEBROC).
, P.O.")
3 VRIJE UNIVERSITEIT Size-dependent predation risk for young bivalves ACADEMISCH PROEFSCHRIFT ter verkrijging van de graad Doctor aan de Vrije Universiteit Amsterdam, op gezag van de rector magnificus prof.dr. L.M. Bouter, in het openbaar te verdedigen ten overstaan van de promotiecommissie van de Faculteit der Aard- en Levenswetenschappen op dinsdag 8 januari 2013 om uur in de aula van de universiteit, De Boelelaan 1105 door Henrike Andresen geboren te Hamburg, Duitsland

4 promotor: prof.dr. J. van der Meer

5 Contents Chapter 1 Introduction 7 Chapter 2 Chapter 3 Chapter 4 Chapter 5 Chapter 6 Size-selective predation mortality and growth rates of 0-group bivalves Macoma balthica modeled from of size-distributions Growth and size-dependent loss of newly settled bivalves in two distant regions of the Wadden Sea Seasonal timing of bivalve settlement and arrival of crustaceans in the Wadden Sea, and resulting predator-prey body size ratios Brown shrimp (Crangon crangon, L.) functional response to density of different sized juvenile bivalves Macoma balthica (L.) Estimation of density-dependent mortality of juvenile bivalves in the Wadden Sea Chapter 7 Discussion 123 Summary 135 Samenvatting 139 Zusammenfassung 143 Acknowledgements 149 Author addresses 153
 Estimation of density-dependent mortality of juvenile bivalves in the Wadden Sea 21 35 63 83 105 Chapter 7 Discussion 123 Summary 135 Samenvatting 139 Zusammenfassung 143 Acknowledgements")
6
7 Chapter 1 Introduction Population dynamics and Wadden Sea bivalves Population ecology is the study of population sizes and of the processes that determine these sizes (Begon et al. 1996). Population size changes by mortality or reproduction. Processes that can affect survival and reproductive success are, for example, resource availability, climate, diseases or predation, which effects can carry through via altered demographics (age structure or sex ratio). Investigating population dynamics is both academically fascinating and essentially important for conservation purposes (e.g. Armbruster and Lande 1993). Man induced population changes occur among other reasons through hunting or fisheries, and manipulation of habitats and resource availability (Ravera 1991). The Wadden Sea is suited for studying marine population dynamics, because it is home to a comparably low number of species, with high numbers of individuals (Beukema 1976). As the world s largest uninterrupted system of intertidal flats, the Wadden Sea has recently received the world heritage status of Fig. 1.1 Long-term changes of three bivalve populations at Balgzand in the Dutch Wadden Sea. a) Cerastoderma edule, b) Mya arenaria, c) Macoma balthica (Rob Dekker, pers. comm.). AFDW=ash-free dry weight. 7
. Investigating population dynamics is both academically fascinating and essentially important for conservation purposes (e.g. Armbruster and Lande 1993).")
8 Chapter 1 the UNESCO. It is ecologically relevant beyond its geographic extension, because it functions as a stopover for migrating birds (van de Kam et al. 2004), and as a nursery ground for North Sea fish (van der Veer et al. 2001). Bivalves are a major component of this ecosystem; they usually comprise more than 50% of the biomass of the macrozoobenthos in the Wadden Sea (Beukema 1992a). Bivalves are also suitable for studying population dynamics, because their shells make age and growth determination possible, and they are quite hardy in experiments. Long-term observations (Beukema 1982) show that big year-to-year changes in bivalve abundance are the rule (Fig. 1.1 a). However, there are also long-term trends and changes which ask for research. In the past decades the share of the gaper clam Mya arenaria has increased (Fig. 1.1 b). New species, the razor clam Ensis americanus (Armonies and Reise 1999) and the Pacific Oyster Crassostrea gigas (Diederich et al. 2005), have been accidentally introduced. Mussels Mytilus edulis (Beukema 1993) and cockles Cerastoderma edule (Kraan et al. 2007) have been fished, and Baltic tellin Macoma balthica records are on their all-time low in the Western Wadden Sea (Fig. 1.1 c). Population dynamics are determined by recruitment success In many marine animal populations, the survival of juveniles is commonly decisive for population dynamics (Ólafsson et al. 1994). Early in life the mortality is high and variable, and after that the relative strength of an age class is more or less set, it decreases through a rather constant mortality, but does not change dramatically. The stage at which survivors of the youngest age group are regarded to be added to a population is called recruitment. The exact time is arbitrarily defined and involves practical reasons. For fish this is often when they become available for fisheries, but can also refer to a distinct biological phase, for example when they move to a different habitat. Bivalves in the Wadden Sea are usually termed recruits when they are retained on a 1 mm sieve at sampling in the end of the summer (Strasser et al. 2003), but sometimes after the first winter (van der Meer et al. 2001). The number of adult bivalves strongly correlates with their number as recruits observed in the first summer (Fig. 1.2 a). Conversely, there is no proportional increase of the number of offspring with increasing parent stock (Fig. 1.2 b). Juvenile mortality typically leads to asymptotic stock-recruitment curves. The numbers of parents in the gametes producing stock do not determine the numbers in the new generation the following year (van der Meer et al. 2001). The apparent lack of a stock-recruitment relationship is the central problem of fisheries science (Cushing 1996). Many fish and bivalve species spawn in excess, 8

9 Introduction this acts as an insurance against unpredictable dramatic events (Fuiman and Werner 2002). But then why do we not see huge year classes more often? Somewhere between larval phase and recruitment strong mortality takes place. The scattered observations about a horizontal line were often interpreted as lack of relationship, whereas it is evidence of strong density dependence worth consideration (Shepherd and Cushing 1980). There is still not sufficient understanding of how and when the magnitude of bivalve recruitment is determined. Fig. 1.2 a) Recruitment-stock relationship, b) stock-recruitment relationship of Macoma balthica at Balgzand in the Dutch Wadden Sea (Rob Dekker and Jan Drent, pers. comm.). Recruitment success is influenced by predation Unusual events can teach us a lot about the processes that usually take place. From exceptional years in which recruitment was very good, we know that predation plays a big role in pre-recruit mortality. Good recruitment of several bivalve species all over the Wadden Sea was typically observed after cold winters (Beukema 1982, Jensen and Jensen 1985). After cold winters, the abundances of their crustacean predators, shrimp (Crangon crangon) and crabs (Carcinus maenas), increase later and stay lower than after mild winters (Beukema 1991, 1992b). Field experiments confirmed differential predation being the major reason behind the winter effect on bivalve recruitment (Strasser 2002). The importance of predation is further backed by the evolvement of predation 9

10 Chapter 1 avoiding migration behavior in Macoma balthica (Hiddink et al. 2002). Predation on pre-recruits has been found relevant for other marine taxa, from sessile invertebrates (Osman and Whitlatch 2004) to flatfish (van der Veer and Bergman 1987). Predation is influenced by prey size The advantageous effect of the delayed shrimp arrival after cold winters is thought to act via body size (Strasser 2002). Most of the young bivalves are already too big to be consumed by the predators at the time they meet. After mild winters, when the crustaceans arrive earlier, the bivalves are still well within or below the preferred size range of the predators. This has been concluded from observations of recruit size distributions, which were shaped differently between contrasting years (Strasser 2002). These observations asked for studying the role of body size explicitly. Body size is fundamental to predation risk (Kerfoot and Sih 1987). Predators can only ingest prey up to a certain maximum size (Nilsson and Bronmark 2000). Below that size, they may choose their prey according to energetic profitability (Krebs and Davies 1981) or to avoid damage of their feeding apparatus (Hummel et al. 2011, Smallegange and van der Meer 2003). In prey organisms the ability to hide (Gibson and Robb 1992), escape (Schmidt et al. 2008) or defend against predation (Tollrian 1995) changes with body size. Thus, different sized prey have a different risk of mortality. Size-selective predation is widespread and important for almost all animal taxa studied (Fryxell and Lundberg 1998). While typical terrestrial taxa such as holometabolic insects or birds reach a final body size early in life (Kooijman 2000), indeterminate growth is common among aquatic and marine taxa, such as mollusks and fish (Kozlowski 1996). As a consequence, marine predators and prey may co-occur over a large range of possible body size ratios during their lives. Prey size is influenced by life history traits Life history theory is concerned with strategies that increase the number of surviving offspring via scheduling of and investment in processes and events of the life cycle, such as development, number of offspring, parental care and reproductive lifespan (Stearns 1992). Two life history traits in particular, namely individual growth and timing of annual reproduction (e.g. Kooi and van der Meer 2010), 10

11 Introduction can influence the sizes of Wadden Sea bivalves at the time they encounter their crustacean predators. Timing of life history events Phenology is the timing of life history events depending on seasonal and interannual climate variations. For important events such as reproduction, migration or hiatus, the timing is essential. Temperature often functions as a cue to good circumstances, such as food availability. When different species react to changing cues in different ways, their interactions may be altered, because they encounter at different stages (Yang and Rudolf 2010). One example of this became famous through the documentary An inconvenient truth about effects of climate change: Caterpillar abundances in the Netherlands peak earlier and earlier in the year with increasing spring temperatures, but their bird predators, migratory great tits (Parus major), at their wintering grounds do not have knowledge of local temperatures when they decide to return to their breeding habitat in the Netherlands (Visser et al. 2004). As a result, the chicks now hatch mainly after the caterpillars pupate (Fig. 1.3). Consequences may be reduced hatchling survival, increased predation pressure on alternative prey, and limited control of the caterpillar population. In the Wadden Sea, bivalve spawning is triggered by water temperature in spring (Drent 2004). This is usually a good indicator of algal food availability. In contrast, winter temperature decides when their crustacean predators arrive Fig. 1.3 Example how phenology affects stage-dependent species interactions. Warming climate promotes earlier appearance of caterpillars, an important food item of newly hatched great tits. Hatching of great tits however does not advance in time, because the adults have no information of the local environment at the time they decide to migrate from their wintering to their breeding grounds. They miss the time of highest caterpillar availability. Curves are scaled to the respective maximum. Adapted after Visser et al. (2006). 11
.")
12 Chapter 1 back from their winter retreat in the deeper North Sea and reproduce (Beukema 1991, 1992b). Therefore, although spring and winter temperature may be correlated, the relative timing of predators and prey varies between years (Strasser and Günther 2001). Yet, what that means for the body sizes that actually encounter had not been studied explicitly yet. This becomes especially important since cold winters are getting rare. Individual growth rates Most obviously body growth rate influences body size trajectories over time. Together with the timing of reproduction, growth rates will determine the duration of susceptibility to predation (Ebenman and Person 1988). Cerastoderma edule in Ireland for example experience high mortality during their whole life, they reproduce early and then grow rapidly. Modiolus modiolus in the same area suffer intense predation early in life, but after escaping further predation by growing large, they reproduce at slower growth rates and live long (Seed and Brown 1978). These strategies are the result of natural selection. In the past decades, man selected for lower growth rates in fish, because larger mesh sizes were used in fisheries with the aim to reduce overfishing (Nussle et al. 2011). Conversely, selection for small prey should promote fast growth. The investment in the best tactic is constrained within the energetic possibilities. Rapid growth was accompanied by increased susceptibility to predation in the fish Menidia menidia, this was explained with decreased physiological performance through the costs of rapid growth (Munch and Conover 2003). In larval Japanese anchovy (Engraulis japonicas) not only size-selective, but among individuals of the same size also growth-selective predation has been found, probably because a bad condition causes bad growth and at the same time ineffectiveness of antipredation behavior (Takasuka et al. 2003). Infaunal bivalves that feed at the sediment-water interface have to pay the predation avoiding effect of deep burrowing with reduced food intake (de Goeij and Luttikhuizen 1998). To investigate individual growth rates, either the age of the animals must be determined, or they must be marked. Both are difficult in the very small juvenile stage of bivalves, so it is hard to decide how far the observed size distributions are the result of selective mortality and for what part they are due individual growth rate variation. Individual chemical marking methods are now available (Moran 2000) that can be applied to disentangle these two factors, so that growth can be explicitly included when studying size-selective predation. 12

13 Introduction Predation is influenced by prey density Prey size affects predation rates, among other reasons by influencing the time it takes to find and handle prey. The relative importance of these two components of the predation process depends on prey density. At low prey density, it takes longer to find prey than at high density. At very high prey density, when it is very easy to find prey, the time that it costs to consume a prey will limit predation rates. Accordingly, the effect of body size or of predation avoiding features on consumption rates cannot be considered independently of prey density (Aljetjawi et al. 2004, McCoy and Bolker 2008). The functional response expresses how predation rates change with density (Holling 1966). For a foraging predator, the functional response can in principle have two shapes. A hyperbolic form means high per capita mortality risk at low prey densities and decreasing risk with higher densities (Fig. 1.4). This has a destabilizing effect on the prey population. Or the functional response can have a sigmoid form, for which per capita mortality is highest at an intermediate density and becomes lower also at lower densities (Hassel 1979). Fig. 1.4 The functional response describes how the predation rate depends on prey density. For a predator foraging by searching, it can in principle have two shapes. Both reach an asymptote at high densities, when predation is limited by handling time. Prey find a refuge at low density when a predator is unmotivated to search at a low reward rate (sigmoid shape). 13
.")
14 Chapter 1 As explained earlier, the lack of a stock-recruitment relationship implies that mortality must be density-dependent somewhere in the period from spawning until recruitment. Although the sigmoid functional response provides a low density refuge, it is unlikely that it alone is responsible for the uncoupling of recruit ment from reproductive stock size, as this would mean that the reversal point would have to be at a very high density. A predation behavior that equalizes prey density in space would be the aggregative response, which means that predators move to places with high prey density (Charnov 1976, Cummings 1997). Of course, there are also potential sources of density-dependent mortality other than predation, such as competition or diseases. Aims, approach and overview of thesis Size dependence of predation on young bivalves and its interplay with seasonal timing, early growth and density is the central theme of this thesis. The overall question is: can predation by shrimp explain the mortality patterns of young bivalves in the Wadden Sea? The main aims were to detect size and density dependence of mortality in the field, to find out how variable predator and prey size ratios are with varying conditions, to obtain early growth rates, and to quantify how predation rates change with prey size and density. The focus is on the pre-recruit, but post-settlement period of the bivalve species Macoma balthica and Cerastoderma edule; two chapters deal with M. balthica exclusively, and one also includes Mya arenaria. They are all infaunal intertidal bivalve species with a pelagic larval phase. It is good to tackle a research question with several approaches, from emphasis on investigating the most natural situation to getting the best grip on mechanisms. Field observations will give the most realistic results, but the processes that led to the observed patterns can often not be identified. In field experiments, under mainly natural conditions certain processes are manipulated, but other aspects cannot be controlled. In laboratory experiments, processes can be investigated in isolation, but they may not be relevant or behave the same way in the field. Modeling offers most control and understanding, and makes it possible to study hypothetical scenarios. Unrealistic results help to explore what else is needed to understand the situation outside. All these different approaches together are needed, because every one on its own only tells a part of the story and no one of them is controlled and natural enough at the same time (Underwood et al 2000, Virnstein 1980). 14
.")
15 Introduction In chapter 2 we model M. balthica growth rates and size selection by shrimp on the basis of several years of field observations of pre-recruit bivalve and shrimp size distributions. Different combinations of growth rates with size preferences by shrimp or size-independent mortality are analyzed to see which parameter combination leads to similar bivalve sizes as observed. The main question is whether size selectivity by shrimp is able and necessary to reproduce the observed bivalve size distributions. In chapter 3 we investigate growth and size selectivity of loss of newly settled bivalves with field experiments. Field sites in two distant regions of the Wadden Sea are chosen to get different growth and timing conditions and predator regimes. Exclosure cages are used to manipulate predator access. Bivalves are stained with a fluorescent dye to disentangle growth and size-selective loss. The main aims are to obtain individual growth rates for the fragile early life stage of bivalves, and to detect size-selective loss. In chapter 4 we compile field observations of young bivalves and crustaceans from several years from two Wadden Sea regions. The main aim is to examine how the time lag between predators and prey and their resulting size ratios differ between years, regions and species. In chapter 5 we carry out aquarium experiments on the functional response of shrimp foraging on different densities and sizes of M. balthica. The main aims are to determine the shape of density dependence, to estimate feeding rates, and to find out how much difference a larger body size makes for bivalve prey survival. In chapter 6 we analyze observations of pre-recruit densities concerning density-dependent mortality. Simulations are used to account for measurement and process error. The main aim is to detect if and when density dependence of mortality in the pre-recruit phase occurs. In chapter 7 the conclusions from the previous chapters are brought together, discussed, and compared to other research. The main aims are to establish their relevance to our understanding of bivalve recruitment, and to pinpoint directions for further research. Acknowledgements I thank Rob Dekker for providing the data for figures 1.1 and 1.2, and Jan Drent for preparing figure

16 Chapter 1 References Aljetlawi, A.A., Sparrevik, E., Leonardsson, K., Prey-predator size-dependent functional response: derivation and rescaling to the real world. Journal of Animal Ecology 73, Armbruster, P., Lande, R., A population viability analysis for African Elephant (Loxodonta africana): how big should reserves be? Conservation Biology 7, Armonies, W., Reise, K., On the population development of the introduced razor clam Ensis americanus near the island of Sylt (North Sea). Helgoländer Meeresuntersuchungen 52, Begon, M., Mortimer, M., Thompson, D.J., Population Ecology: A Unified Study of Animals and Plants. Third Ed. Blackwell Science Ltd., Oxford, UK. Beukema, J.J., Biomass and species richness of the macrobenthic animals living on the tidal flats of the Dutch Wadden Sea. Netherlands Journal of Sea Research 10, Beukema, J.J., Annual variation in reproductive success and biomass of the major macrozoobenthic species living in a tidal flat area of the Wadden Sea. Netherlands Journal of Sea Research 16, Beukema, J.J., The abundance of shore crabs Carcinus maenas (L) on a tidal flat in the Wadden Sea after cold and mild winters. Journal of Experimental Marine Biology and Ecology 153, Beukema, J.J., 1992a. Expected changes in the Wadden Sea benthos in a warmer world: lessons from periods with mild winters. Netherlands Journal of Sea Research 30, Beukema, J.J., 1992b. Dynamics of juvenile shrimp Crangon crangon in a tidal-flat nursery of the Wadden Sea after mild and cold winters. Marine Ecology- Progress Series 83, Beukema, J.J., Increased mortality in alternative bivalve prey during a period when the tidal flats of the Dutch Wadden Sea were devoid of mussels. Netherlands Journal of Sea Research 31, Charnov, E.L., Optimal Foraging, Marginal Value Theorem. Theoretical Population Biology 9, Cummings, V.J., Schneider, D.C., Wilkinson, M.R., Multiscale experimental analysis of aggregative responses of mobile predators to infaunal prey. Journal of Experimental Marine Biology and Ecology 216, Cushing, D.H., Towards a Science of Recruitment in Fish Populations. Excellence in Ecology 7, Ed. O. Kinne Ecolgy Institute, Oldendorf/Luhe De Goeij, P., Luttikhuizen, P.C., Deep-burying reduces growth in intertidal bivalves: field and mesocosm experiments with Macoma balthica. Journal of Experimental Marine Biology and Ecology 288, Diederich, S., Nehls, G., van Beusekom, J.E.E., Reise, K., Introduced Pacific oysters (Crassostrea gigas) in the northern Wadden Sea: invasion accelerated by warm summers? Helgoland Marine Research 59, Drent, J., Life history variation of a marine bivalve (Macoma balthica) in a changing world. Ph.D. thesis Rijksuniversiteit Groningen, pp Ebenman, B., Persson, L., Size-Structured Populations: Ecology and Evolution. Springer, Berlin Heidelberg New York. 16

17 Introduction Fryxell, J.M., Lundberg, P., Individual Behavior and Community Dynamics. Chapman and Hall, New York. Fuiman, L.A., Werner, R.G., Fishery Science - The unique contribution of early life stages. Blackwell Publishing, Oxford. Gibson, R.N., Robb, L., The relationship between body size, sediment grain size and the burying ability of juvenile plaice, Pleuronectes platessa L. Journal of Fish Biology 40, Hassel, M.P., Lawton, J.H., Beddington, J., Sigmoid functional responses by invertebrate predators and parasitoids. Journal of Animal Ecology 46, Hiddink, J.G., Marijnissen, S.A.E., Troost, K., Wolff, W.J., Predation on 0-group and older year classes of the bivalve Macoma balthica: interaction of size selection and intertidal distribution of epibenthic predators. Journal of Experimental Marine Biology and Ecology 269, Holling, C.S., The functional response of invertebrate predators to prey density. Memoirs of the Entomological Society of Canada 48, Hummel, C., Honkoop, P., van der Meer, J., Small is profitable: No support for the optimal foraging theory in sea stars Asterias rubens foraging on the blue edible mussel Mytilus edulis. Estuarine, Coastal and Shelf Science 94, Jensen, K.T., Jensen, J.N., The importance of some epibenthic predators on the density of juvenile benthic macrofauna in the Danish Wadden Sea. Journal of Experimental Marine Biology and Ecology 89, Kerfoot, W.C., Sih, A., Predation: Direct and Indirect Impacts on Aquatic Communities. University Press of New England, Hanover and London. Kooi, B.W., van der Meer, J., Bifurcation theory, adaptive dynamics and dynamic energy budget-structured populations of iteroparous species. Philosophical Transactions of the Royal Society B-Biological Sciences 365, Kooijman, S.A.L.M., Dynamic Energy and Mass Budgets in Biological Systems. Cambridge University Press, Cambridge. Kozlowski, J., Optimal allocation of resources explains interspecific life-history patterns in animals with indeterminate growth. Proceedings of The Royal Society of London Series B-Biological Sciences 263, Kraan, C., Piersma, T., Dekinga, A., Koolhaas, A., van der Meer, J., Dredging for edible cockles (Cerastoderma edule) on intertidal flats: short-term consequences of fisher patch-choice decisions for target and non-target benthic fauna. ICES Journal of Marine Science 64, Krebs, J.R., Davies, N.B., An introduction to behavioural ecology. Blackwell Scientific Publications, Oxford. McCoy, M.W., Bolker, B.M., Trait-mediated interactions: influence of prey size, density and experience. Journal of Animal Ecology 77, Moran, A.L., Calcein as a marker in experimental studies newly-hatched gastropods. Marine Biology 137, Munch, S.B., Conover, D.O., Rapid growth results in increased susceptibility to predation in Menidia menidia. Evolution 57, Nilsson, P.A., Bronmark, C., Prey vulnerability to a gape-size limited predator: behavioural and morphological impacts on northern pike piscivory. Oikos 88, Nussle, S., Brechon, A., Wedekind, C., Change in individual growth rate and its link to gill-net fishing in two sympatric whitefish species. Evolutionary Ecology 25,

18 Chapter 1 Ólafsson, E.B., Peterson, C.H., Ambrose, W.G., Does recruitment limitation structure populations and communities of macroinvertebrates in marine soft sediments - the relative significance of presettlement and postsettlement processes. Oceanography and Marine Biology, 32, Osman, R.W., Whitlatch, R.B., The control of the development of a marine benthic community by predation on recruits. Journal of Experimental Marine Biology and Ecology 311, Ravera, O., Terrestrial and Aquatic Ecosystems: Perturbation and Recovery. Ellis Horwood Schmidt, M., Philipp, E.E.R., Abele, D., Size and age-dependent changes of escape response to predator attack in the Queen scallop Aequipecten opercularis. Marine Biology Research 4, Seed, R., Brown, R.A., Growth as a strategy for survival in 2 marine bivalves, Cerastoderma edule and Modiolus modiolus. Journal of Animal Ecology 47, Shepherd, J. G., D. H. Cushing A mechanism for density dependent survival of larval fish as the basis of stock-recruitment relationship. ICES Journal of Marine Science 39: Smallegange, I.M., van der Meer, J., Why do shore crabs not prefer the most profitable mussels? Journal of Animal Ecology 72, Stearns, S.C., The Evolution of Life Histories. Oxford University Press, New York, 249 pp. Strasser, M., Reduced epibenthic predation on intertidal bivalves after a severe winter in the European Wadden Sea. Marine Ecology-Progress Series 241, Strasser, M., Dekker, R., Essink, K., Günther, C.P., Jaklin, S., Kröncke, I., Madsen, P.B., Michaelis, H., Vedel, G., How predictable is high bivalve recruitment in the Wadden Sea after a severe winter? Journal of Sea Research 49, Strasser, M., Günther, C.P., Larval supply of predator and prey: temporal mismatch between crabs and bivalves after a severe winter in the Wadden Sea. Journal of Sea Research 46, Takasuka, A., Aoki, I., Mitani, I., Evidence of growth-selective predation on larval Japanese anchovy Engraulis japonicus in Sagami Bay. Marine Ecology-Progress Series 252, Tollrian, R., Chaborus chrystallinus predation on Daphnia pulex can induced morphological changes balance effects of body size on vulnerability. Oecologia 101, Underwood, A. J., Chapman, M. G., Connell, S. D Observations in ecology: you can't make progress on processes without understanding the patterns. Journal of Experimental Marine Biology and Ecology 250: van de Kam, J., Ens, B., Piersma, T., Zwarts, L., Shorebirds: An Illustrated Behavioural Ecology. KNNV Publishers, Utrecht, The Netherlands. van der Meer, J., Beukema, J.J., Dekker, R., Long-term variability in secondary production of an intertidal bivalve population is primarily a matter of recruitment variability. Journal of Animal Ecology 70, van der Veer, H.W., Bergman, M.J.N., Predation by crustaceans on a newly settled 0-group Plaice Pleuronectes platessa population in the Western Wadden Sea. Marine Ecology-Progress Series 35,

19 Introduction van der Veer, H.W., Dapper, R., Witte, J.I.J., The nursery function of the intertidal areas in the western Wadden Sea for 0-group sole Solea solea (L.). Journal of Sea Research 45, Virnstein, R.W., Measuring effects of predation on benthic communities in soft sediments. In: Estuarine Perspectives, ed. M. L. Wiley, pp New York: Academic. 563 pp. Visser, M.E., Holleman, L.J.M., Gienapp, P., Shifts in caterpillar biomass phenology due to climate change and its impact on the breeding biology of an insectivorous bird. Oecologia 147, Yang, L.H., Rudolf, V.H.W., Phenology, ontogeny and the effects of climate change on the timing of species interactions. Ecology Letters 13,

20 20

21 Chapter 2 Size-selective predation mortality and growth rates of 0-group bivalves Macoma balthica modeled from size distributions Henrike Andresen, Rob Dekker, Jaap van der Meer Abstract We simulated growth and size-selective predation mortality of juvenile Wadden Sea bivalves, predicted size distributions of prey Macoma balthica shaped by their predators Crangon crangon (Brown shrimp), and compared these predictions with observations in the field. Under the assumption that all mortality is caused by shrimp, size-selective predation could explain bivalve size structure in several cases with quite realistic and consistent prey choice functions. In about half of the 14 studied time periods, bivalve size structures could not be reproduced by selective shrimp predation, but unselective mortality never led to a reliable fit of the field data. We conclude that size-dependent abundance changes are the rule in the early life of these bivalves. Though other size-dependent processes such as migrations can affect local abundances, the support for shrimp predation being a major determinant of young M. balthica abundance and size distribution of the survivors is strong. 21
22 Chapter 2 Introduction Body size is crucial to predator prey interactions (Brooks and Dodson 1965). Prey capture and handling success depend on the sizes of both predator and prey (Claessen et al. 2002). As predation mortality depends on body size, predators can affect the size structure of their prey population (Rice et al. 1993, Sparevik and Leonardson 1999). Predation by crustaceans is considered to play an important role in the recruitment success of bivalves in the Wadden Sea (Beukema et al. 2005, Hiddink et al. 2002, Strasser 2002). Relative timing of peak crustacean and bivalve settler abundances varies between years (Philippart et al. 2003, Strasser and Günther 2001), so that different predator and prey body sizes may encounter over time each year. Differences in bivalve size distributions between years at the time of recruitment in August have been observed (Strasser et al. 2001), and are possibly due to selective predation. Yet, up till now predator and prey size structures have not been brought together analytically. We investigate the predator-prey relationship of young infaunal bivalves Macoma balthica (Baltic tellin) and their most abundant epifaunal predators Crangon crangon (Brown shrimp). Field observations of their size distributions over time in the Wadden Sea were the starting point of a simulation study. We analyzed what combinations of bivalve growth rates and size selection by the predators would be able to bring about the observed changes in bivalve size distributions. The outcomes of a model version assuming that all mortality was caused by size-selective predation by shrimp are compared to a version that assumes unselective mortality. Size-related mortality can also occur through processes other than predation (Green et al. 2004). If the estimated prey preference by shrimp turns out to be very variable between study periods or has to be unrealistic to achieve a good fit, then other processes must dominate over predation in determining bivalve size distribution and mortality. Individual-based models are useful to evaluate whether effects of individual variability need to be considered in understanding year class variation, or whether an approach based on averages is already sufficient (Rice et al. 1993). Studies conducted in relation to fisheries research (e.g. Paradis and Pepin 2001) and also in systems with invertebrate prey (e.g. Sparevik and Leonardson 1999) show the necessity of including size structure in studies of early mortality. The aim of the present study is to determine how dominant size-selective predation by shrimp is in shaping the size distribution of the surviving young M. balthica. 22
23 Modeling size distributions Material and Methods Data Study site and temporal sampling design: Bivalves and crustaceans were sampled during low tide at the Balgzand tidal flats in the westernmost part of the Dutch Wadden Sea, at a site about 10 cm above mean sea level. Sampling took place in the years 1994 to 1998, at several occasions between May and November, the crucial phase determining Macoma balthica recruitment. See Tables 2.1 and 2.2 for the exact sampling dates each year for crustaceans and bivalves, respectively. Within these five years of field data, 14 periods occurred in which bivalve density decreased and shrimp observations were available. Bivalve sampling: Bivalve samples were taken haphazardly within a plot of 100 m 2. Sampling area was adapted to decreasing bivalve densities by changing the number of samples taken at a sampling event (three to ten), as well as the number of cores pooled per sample (two to ten), and corer area (27 or 90 cm 2 ). Table 2.1 gives details of the total sampling area per date, and the number of M. balthica individuals found. Sampling depth was 8 cm in 1994 and 5 cm in later years. Samples were sieved in the lab over 300 µm mesh screen, only in 1998 a 150 µm sieve was used. At some occasions additional larger samples were taken, to a depth of 15 cm and sieved over larger mesh (1 mm), to get a better chance of catching the largest of the young bivalves, which occur in lower densities. The abundance estimates of the bivalves that are retained on a 1 mm sieve come from both the standard and the large samples; this gave smoother size-frequency distributions. The abundance they would have had in the area of the standard samples was calculated, because scaling the number of individuals up to a larger area would lead to a seemingly high accuracy of the subsequent statistical test. Bivalves were sorted live or preserved in 4% formalin in buffered seawater. Shell lengths were measured with 100 µm accuracy. Crustacean sampling: Shrimp were sampled in four 10 m long transects just outside the 10x10 m 2 bivalve plot. Each time, 40 cores of each 90 cm 2 area were taken, adding up to a total sampling area of 0.36 m 2. Sampling depth was ca. 5 cm, and samples were sieved in the field over 1 mm mesh screen. Crangon crangon were sorted out live in the lab and their length measured from telson to scaphocerite to the nearest mm. 23
24 Chapter 2 Table 2.1 Bivalve sampling dates, number of individuals and total sampling area per date May Date n Area (cm 2 ) 22 nd st th th Jun Date n Area (cm 2 ) 23 rd th th th Jul Date n Area (cm 2 ) 19 th th rd th th (1) th Aug Date n Area (cm 2 ) 22 nd th Sep Date n Area (cm 2 ) 19 th st th th Oct Date n Area (cm 2 ) 9 th * Nov Date n Area (cm 2 ) 26 th (1) No density decrease towards this sampling event. Model Simulations were carried out to find out which combination of bivalve growth rate and prey choice by shrimp could best predict the observed change in M. balthica size distribution. Random encounters between the observed predators and the observed initial bivalve prey were simulated, and a preference curve by the predator decided on the outcome of the encounter - consumption by the shrimp or survival of the bivalve. Mortality events and growth periods were alternated, so they were spread evenly over the time period, until the prey numbers were reduced to the abundance observed at the end of a time period. The resulting size distributions were compared to the field distributions by Kolmogorov- Smirnov tests (Zar 1999). The steps of the procedure are explained in more detail below and are illustrated in Fig
25 Modeling size distributions Exponential growth was assumed for the bivalve, with a single mean instantaneous growth rate parameter. On top of this average rate, for each period and for each individual a small randomly chosen and normally distributed growth variation was added with a standard deviation of 0.15 times the mean growth rate. Prior analyses showed that such growth variation gives a natural looking size distribution and that the results are quite robust to the amount of growth rate variation. Growth created much smaller size increments in the simulations than the measurement accuracy in the observed data had been. For this reason, bivalve lengths were drawn from a uniform distribution within 0.1 mm of the measurements. The predator-prey encounter rate was scaled to predator body size. The searching rate as well as the width of the searched area scales with predator length, thus the encounter rate scales with squared predator length (Kooijman 2000). The body size of the small bivalve prey was considered negligible for scaling the probability of predator-prey encounters. For all predator sizes, selection takes place on the basis of predator/prey length ratio. For a given predator size, it has been suggested that the chance that a prey encounter results in a kill should be a dome-shaped function of prey body size. (Lundvall et al. 1999). We used the normal curve as the shape of the preference curve. The preference curve Table 2.2 Shrimp sampling dates and density. Total sampling area per date was always 0.36 m May Date Density/m 2 13 th 54 Jun Date Density/m 2 30 th th th 72 5 th 51 Jul Date Density/m 2 12 th th 78 2 nd and 31 st 111 and 38 Aug Date Density/m 2 23 rd 36 9 th nd 3 25 th 77 Sep Date Density/m 2 5 th 59 Oct Date Density/m 2 9 th 36 Nov Date Density/m 2 25
26 Chapter 2 26
27 Modeling size distributions gives the probability that an encounter results in prey death as a function of relative prey length. The maximum value is obtained at the preferred relative prey length. The standard deviation was chosen to be 1/3 of the preferred relative prey length. If the predators were not able to reduce the prey to the target abundance through their prey choice after 5000 encounters, the simulation was terminated. For the case of unselective mortality, the bivalves to be removed from the cohort were drawn randomly. After a bivalve was removed from the cohort, the remaining bivalves grow. When the bivalves were reduced to the final abundance, the simulated size distribution resulting from the respective parameter combination of growth rate and preferred relative prey length was compared with the observed field size distribution by a Kolmogorov-Smirnov test (KS-test). The aim was to find the combination of the two parameters that do not lead to a significant difference in size distribution between observed and simulated. For every parameter combination, the simulation with alternating mortality and growth and the KS-test in the end was repeated 500 times. The parameter combinations for which the 97.5%- quantile of the D-values remained under the critical D-value for the particular n are concluded to be able to explain the observed bivalve size distribution. Recall that the bivalve sampling area in the field was adjusted to bivalve density. This implies that the difference in the counts of individuals sampled between dates does not directly resemble the change in density. Therefore, the Fig. 2.1 Illustration of the modeling procedure. a) Observed size distribution of shrimp, example from July b) Example of a prey selection curve, for a 14 mm long shrimp that chooses prey 1/15 of the predator length. c) Observed size distribution of Macoma balthica in July d) Observed size distribution of M. balthica the next month. e) Example of a simulated size distribution of M. balthica, using the July data as a starting point for growing and random mortality. f) Example of a simulated size distribution of M. balthica, using the July data as a starting point for growing and selective predation. g) Resulting D-statistic of the Kolmogorov-Smirnov tests comparing simulated with observed data, set out against the tested growth rates. As examples, the black dots are the averages of each 500 D-values obtained using a prey preference for 1/11 of the predator length, the white dots were obtained with size-independent mortality. The error bars represent 95% confidence intervals. The horizontal dashed line marks the critical D-value. Values below it indicate that the compared size distributions are not significantly different. h) Contour plot of the best parameter combinations for the example period. The black dot represents the combination of growth rate and prey preference that leads to the lowest average D-value when simulated and observed data are compared. For all parameter combinations within the contour, at least 95% of the resulting D-values are below the critical D-value. The vertical dashed line marks the best fitting growth rate for the case of unselective mortality; however, no growth rate led to sufficiently low D-values in combination with random mortality. 27
28 Chapter 2 number of animals at the beginning of a time period was changed, while keeping the body size composition, such that the decrease in n until the end of the time period corresponds to the density decrease. The n at the end must not be changed, as this changes the apparent power of the KS-test. Further, when the smallest individuals in the end of a time period were smaller than the smallest in the beginning, they were removed, as this is probably due to later settlement into the area. Results In seven out of the 14 investigated periods, simulations with size-selective predation by the observed shrimp were able to reproduce the observed size distributions of Macoma balthica (Fig. 2.2). In the other cases, neither selective predation by the present shrimp nor random mortality led to a resemblance with the observed bivalve size distributions. That means size-dependent abundance changes must have taken place, but not, or not only, caused by shrimp predation. These periods were mainly early in the season, and in the whole year of In the cases where size-selective shrimp predation produced bivalve size distributions similar to the field observations, the selected prey size was often around a tenth of the predator size. One time, the estimated choice was half of the predator size, and in one case the estimated selected size was much smaller, 1/50 of the predator s size. The corresponding estimates of the bivalves instantaneous growth rates range from d to d between all investigated time periods that got a fit with the data. Turning to the prey point of view, the results also point to which sizes of the bivalves were most affected. In most of the cases where predation could explain the bivalves size distribution, estimated growth rates were lower than those assuming unselective mortality. This means that of the available bivalves, the Fig. 2.2 Estimates of prey selection by shrimp and bivalve daily instantaneous growth rate. A size selection of e.g. 1/10 means that a shrimp selects bivalves of a tenth of its own length. The black dot indicates the best fitting combination of prey preference and growth rate from simulations with size-selective predation. The solid contour contains all parameter combinations that resulted in prey size distributions similar to the observed size distribution in at least 95% of the simulations. When there is no contour drawn, no parameter combination led to a fit with the field data, and the dot is filled white. The dashed vertical line indicates the best fitting growth rate from simulations with size-independent, random mortality. No growth rate value led to a fit with the field data in combination with unselective mortality, so no confidence region is drawn around the dashed line. 28
29 Modeling size distributions 29
30 Chapter 2 smallest ones have been fed on, as ignoring predation gives the illusion of faster growth. Only in the first investigated time period, growth rate estimates were similar with or without size-selective predation. Discussion For many of the investigated periods of the five summers studied, simulations supported size-selective predation by shrimp as the driving force. Usually bivalves at the lower end of the present size spectrum were affected. With about a tenth of the predator s size, these smaller sizes often represented the maximum of what shrimp could take (Hiddink et al. 2002, Keus 1986 cited at van der Veer et al. 1998). This points to the possibility for the bivalves to outgrow this predator. The choice for prey half the predator s size found in one instance (June to July 1995) is unrealistic. Also the preference for extremely small prey, relative to the predator and also compared to the available prey size range (May 1998), is in conflict with feeding on the center of the available size distribution at the maximum of the predator s ability (June to July 1994). Of the estimated values of the resulting growth rates, the higher ones are similar to growth rates obtained by individual marking in situ (Chapter 3). Are there methodological limitations that could have had an effect on the results? The observed size structures of the bivalves can often not be explained by shrimp predation alone, but they can never be explained by simple bivalve growth in combination with unselective mortality, not even when the predator abundance was very low (July to September 1996, Fig. 2.2, Table 2.2). One might question the adequacy of the very simple growth model that has been assumed. Yet, assuming constant instantaneous growth is realistic for the early period, when growth is indeed almost exponential. In individual marking experiments (Chapter 3) we found that the lines of Ford-Walford plots were not converging, and that instantaneous growth rates did not change with bivalve size. It should be mentioned for completeness that out of curiosity simulations for growth with random mortality were also done with von Bertalanffy growth, in which the ultimate length was fixed. Even then, only in one out of 14 cases did unselective mortality lead to a matching size distribution at the end of the period. Thus, size-dependent processes are the rule in the early months of a bivalve cohort. Also in the periods where the estimated preference values deviate strongly from the other estimates (June to July 1995 and within May 1998), size-selective loss probably occurred through another process, but the attempt to link this to the present shrimp sizes led to the exceptional estimates. There could be additional predators, such as in- 30
31 Modeling size distributions faunal polychaetes, but also dissolution mortality (Green et al. 2004), competitive ability and starvation resistance or susceptibility to diseases could depend on size. One well known process in the early benthic life of young Macoma balthica is their secondary migration (Beukema 1993, Hiddink and Wolff 2002), which is also size-specific (Armonies 1992). Sometimes additional settlement was identified in the present data by the appearance of smaller individuals, which were removed from the analysis, but not all additional settlers may have been able to be identified that way, and that could give a distorted image. The estimates of the preferred prey size were often at or just above the limit of the experimentally determined ability of shrimp (Hiddink et al. 2002). An underestimation of the number of big shrimp through sampling during low tide could have led to an overestimation of the preferred prey size by the observed shrimp. At high tide bigger shrimp enter the tidal flats for foraging (Janssen and Kuipers 1980). This could also lead to an underestimation of the bivalve growth rates, because lower growth fits better with the lack of bigger bivalve individuals that may have been consumed by the undocumented bigger shrimp. The simulations were done under the far-reaching assumption that all mortality is due to shrimp predation. Considering that a lot of other processes can potentially affect bivalve size distributions, it is still remarkable that parameter estimates were consistent and realistic in so many cases. Even more so since the investigated time spans were short, while a comparable study in a piscivore system showed that size-selective mortality is more easily predicted in longer periods (Paradis and Pepin 2001). Hence it is plausible that size-selective shrimp predation is an influential process, which not only has a strong impact on size distributions, but also must make a major contribution to total pre-recruit mortality. Selective loss is dominated by the predator type with the greatest impact on the survivors (Paradis and Pepin 2001). Concerning further research, an approach that tackles the problem from the other side would use detailed information on prey choice to quantify predation rates. Prey choice experiments until now (Hiddink et al. 2002, Keus 1986 cited at van der Veer et al. 1998) have established the upper limit of the predation window of shrimp feeding on M. balthica. The required experiments are not simple, because prey choice may depend on relative densities and alternative prey. Further, our results show that estimating growth rates from size distributions alone is inaccurate and individual marking methods (Chapter 3) are needed. Strong selectivity implies that there are important differences among individuals. In the future it will be interesting to not only investigate the consequences of variability among individuals of a bivalve cohort, but also the sources of variability. 31
32 Chapter 2 Acknowledgements This study was financially supported by the Netherlands Organization for Scientific Research (NWO) and Netherlands-Bremen Oceanography II (NEBROC). References Armonies, W., Migratory rhythms of drifting juvenile molluscs in tidal waters of the Wadden Sea. Marine Ecology-Progress Series 83, Beukema, J.J., Successive changes in distribution patterns as an adaptive strategy in the bivalve Macoma balthica (L) in the Wadden Sea. Helgoländer Meeresuntersuchungen 47, Beukema, J.J., Dekker, R., Decline of recruitment success in cockles and other bivalves in the Wadden Sea: possible role of climate change, predation on postlarvae and fisheries. Marine Ecology-Progress Series 287, Brooks, J.L., Dodson, S.I., Predation, body size and composition of plankton. Science 150, Claessen, D., Van Oss, C., de Roos, A.M., Persson, L., The impact of sizedependent predation on population dynamics and individual life history. Ecology 83, Green, M.A., Jones, M.E., Boudreau, C.L., Moore, R.L., Westman, B.A., Dissolution mortality of juvenile bivalves in coastal marine deposits. Limnology and Oceanography 49, Hiddink, J.G., Marijnissen, S.A.E., Troost, K., Wolff, W.J., Predation on 0-group and older year classes of the bivalve Macoma balthica: interaction of size selection and intertidal distribution of epibenthic predators. Journal of Experimental Marine Biology and Ecology 269, Hiddink, J.G., Wolff, W.J., Changes in distribution and decrease in numbers during migration of the bivalve Macoma balthica. Marine Ecology-Progress Series 233, Janssen, G.M., Kuipers, B.R., On tidal migration in the shrimp Crangon crangon. Netherlands Journal of Sea Research 14, Kooijman, S.A.L.M., Dynamic Energy and Mass Budgets in Biological Systems. Cambridge University Press, Cambridge. Lundvall, D., Svanback, R., Persson, L., Bystrom, P., Size-dependent predation in piscivores: interactions between predator foraging and prey avoidance abilities. Canadian Journal of Fisheries and Aquatic Sciences 56, Paradis, A.R., Pepin, P., Modelling changes in the length-frequency distributions of fish larvae using field estimates of predator abundance and size distributions. Fisheries Oceanography 10, Philippart, C.J.M., van Aken, H.M., Beukema, J.J., Bos, O.G., Cadee, G.C., Dekker, R., Climate-related changes in recruitment of the bivalve Macoma balthica. Limnology and Oceanography 48,
33 Modeling size distributions Rice, J.A., Crowder, L.B., Rose, K.A., Interactions between size-structured predator and prey populations - Experimental test and model comparison. Transactions of The American Fisheries Society 122, Sparrevik, E., Leonardsson, K., Direct and indirect effects of predation by Saduria entomon (Isopoda) on the size-structure of Monoporeia affinis (Amphipoda). Oecologia 120, Strasser, M., Reduced epibenthic predation on intertidal bivalves after a severe winter in the European Wadden Sea. Marine Ecology-Progress Series 241, Strasser, M., Günther, C.P., Larval supply of predator and prey: temporal mismatch between crabs and bivalves after a severe winter in the Wadden Sea. Journal of Sea Research 46, Strasser, M., Hertlein, A., Reise, K., Differential recruitment of bivalve species in the northern Wadden Sea after the severe winter of 1995/96 and of subsequent milder winters. Helgoland Marine Research 55, van der Veer, H.W., Feller, R.J., Weber, A., Witte, J.I.J., Importance of predation by crustaceans upon bivalve spat in the intertidal zone of the Dutch Wadden Sea as revealed by immunological assays of gut contents. Journal of Experimental Marine Biology And Ecology 231, Zar, J.H. (1996) Biostatistical Analysis. Prentice Hall International Editions 33
34 34
35 Chapter 3 Growth and size-dependent loss of newly settled bivalves in two distant regions of the Wadden Sea Henrike Andresen, Ine Dorresteijn, Jaap van der Meer Abstract Individual growth and the timing of life history events determine the course of individual body sizes. By that, they can influence size-dependent species interactions such as predation. In the Wadden Sea, predation by crustaceans plays an important role for survival of pre-recruit bivalves. To investigate growth rates and size-dependent loss in two distant regions of the Wadden Sea, in situ marking with the fluorochrome calcein was combined with cage experiments. Through marking, we obtained for the first time size-increment data of the fragile newly settled juveniles in the species Macoma balthica and Cerastoderma edule in the field. By this, growth and size-selective mortality were disentangled, while hitherto both were usually inferred from size distributions at this life stage. Fluorescent marking also revealed that growth rates were very variable between individuals. Growth was temporarily higher at Texel than at Sylt in both species. In combination with the exclosure experiments and sampling of predators and migrating bivalves, selective loss of smaller individuals was detected in both regions and could be related to predation pressure. Climate influences on phenology have potentially strong effects on species interactions, altering survival and thus recruitment and population dynamics. Accepted for publication in Marine Ecology-Progress Series 35
36 Chapter 3 Introduction Life history characteristics such as timing of reproduction and growth patterns determine the course of body size during an organism s life. This has consequences for population dynamics, because many fundamental ecological processes depend on body size. Species interactions, most notably predation, are especially influential, and size-dependent. Predators can only handle a certain range of prey sizes (Fryxell and Lundberg 1998). Within this range, predators have preferences that favor high profitability (Krebs and Davies 1981) or avoid damage (Hummel et al. 2011, Smallegange and van der Meer 2003). In prey organisms the ability to hide (Gibson and Robb 1992), escape (Schmidt et al. 2008) or defend against predation (Tollrian 1995) changes with body size. In the marine environment with taxa that commonly show indeterminate growth, organisms co-occur that span a large range of body sizes during their life. Together with the timing of life history events such as hatching, their growth rates will determine the duration of susceptibility to predation (Ebenman and Persson 1988). Growth rates and the timing of seasonally dependent events are influenced by temperature, and therefore are potentially subject to change through climate warming (Parmesan and Yohe 2003, Root et al. 2003). When reproductive timing and growth are altered in a species-specific way (Yang and Rudolf 2010), then different stages of predators and prey will encounter each other (Visser et al. 2006). Thus, additional to the physiological effects on organisms, size-dependent species interactions such as predation can be altered through shifting temperatures (Walther 2010). One illustration of this phenomenon can be found in our study system in the Wadden Sea. Here, spring temperatures trigger the spawning time of bivalves (Drent 2004), while prevailing winter temperatures influence the timing of the arrival of predatory shrimps and crabs on the tidal flats (Beukema 1991, 1992). Increased predation after persistently warmer winters in the past decade is an anticipated reason for the decline of the bivalve Macoma balthica in the western Wadden Sea (Beukema and Dekker 2005). High recruitment is usually observed after cold winters, because crustacean predators arrive late (Strasser and Günther 2001), after bivalve offspring has already settled and grown in a period of high food availability (Philippart et al. 2003). Field studies confirmed the importance of predation for bivalve recruitment for several systems (e.g. Flach 2003, Strasser 2002, van der Veer et al. 1998), and some studies also pointed to a role of body size (Hiddink et al. 2002, 36
37 Growth and size-dependent loss in the field Hunt and Mullineaux 2002, Strasser 2002, Strasser et al. 2001). Some species perform predator avoiding migrations (Hiddink et al. 2002). However, the interplay of processes makes every one of them hard to investigate. One hurdle used to be that size-dependent mortality as well as growth rates of the newly settled stage in the field had to be inferred from observations of size distributions, because conventional physical tagging or marking techniques (Bachelet 1980, Gilbert 1973) cannot be used on the small breakable bivalves. Growth estimates based on averages are inaccurate if mortality is size-dependent, and size dependence of mortality is difficult to detect if size variability increases through growth variability. Furthermore, secondary settlement can act on size distributions. With the fluorochrome shell marker calcein (Kaehler and McQuaid 1999, Moran 2000, Moran and Marko 2005), a tool is available to obtain size-increment data of bivalves and gastropods, that can also be applied to fragile young animals. It is used in this study to disentangle growth from size-selective processes. To investigate early bivalve growth and size-dependent loss, we combined the more recently established fluorescent staining method with already widely applied caging experiments (Hall et al. 1990). In our approach to study the general importance of body size for the survival of young bivalves that are preyed upon by crustacean predators, for the first time field experiments were conducted simultaneously in two distant regions of the Wadden Sea. The winter seawater temperature (Bundesamt für Seeschiffahrt und Hydrographie 2012) as well as nutrient conditions (Loebl et al. 2009) and therefore algal food influencing growth (Bos et al. 2006) are lower at Sylt in the northern than at Texel in the western Wadden Sea. While the period of bivalve spawning is very similar over a large latitudinal range in Europe (Drent 2004), the reproductive season of Crangon crangon is delayed towards the northern Wadden Sea (Campos and van der Veer 2008). The selected island regions thus provided different conditions affecting body size and were chosen to study how the environment can shape species interactions via body size. As the recruitment phase strongly influences population size for the coming years, research on mortality in the early phase of life will contribute to the understanding of population dynamics (van der Meer et al. 2001). The main objectives were to estimate and compare growth rates, and detect and compare size-dependent loss in the two regions with differing conditions. 37

38 Chapter 3 Material and Methods Field experiments were carried out simultaneously in two distant regions in the Wadden Sea to investigate growth and size-selective abundance changes under different conditions. The experiments started after peak settlement of the most abundant bivalve species Macoma balthica and Cerastoderma edule. Caging experiments to exclude epibenthic predators during tidal submergence were combined with fluorescent shell marking to disentangle size-selective survival from variation in growth. The experiments were accompanied by observations of predators and migrating bivalves. Study sites The study regions in the Dutch Wadden Sea at the island of Texel and the German Wadden Sea at the island of Sylt are about 400 km coastline apart (Fig. 3.1). Near Texel, one site lies in the south of the Balgzand tidal flat area. The site is sheltered and the sediment can be characterized as muddy fine sand. In the northeast of the island lies an open site with fine sand on the sandflats of Vlakte van Kerken. At Sylt, Gröningwatt is very sheltered with sand to muddy fine sand, and Oddewatt with medium to coarse sand is more open. Thus, in the two regions, two sites each were selected. They are not meant to represent the area, but were chosen for their contrasting conditions. The tidal flats at Texel stretch about 2 km from the high intertidal zone to the low water line, at the sites at Sylt this was about 800 m. The tidal ranges are 1.5 m and 2 m respectively. Experiments were carried out in the middle intertidal zone, because there the highest number of predator-prey encounters is expected. Fig. 3.1 Study sites in the middle intertidal zone near the islands of Texel and Sylt in the Wadden Sea, which constitutes the coastal transition zone to the North Sea. Vlakte van Kerken and Oddewatt are open, Balgzand and Gröningwatt sheltered sites. 38
39 Growth and size-dependent loss in the field Experimental design, spatial arrangement and time course Two experiments were conducted, one at the end of May and one at the beginning of June The experiments had three factors: site, exclosure and fluorescent marking with calcein. The factor site had four levels. The three levels of the exclosure treatments were uncaged, simple cage, and control cage. In half of the units calcein solution was applied (i.e. two levels, calcein and no calcein), so that a potential effect of marking on growth or survival could be tested for. Each site exclosure calcein combination was replicated four times, but two cages each got lost in May and June. The experiments took place within square plots of 1600 m 2, marked with 25 poles. At one site the plot was made rectangular (30 m by 53 m) to fit between megaripples. The plots were divided into 400 squares of 2 2 m 2. For each cage or sample, one of them was picked from a random list without resampling. A short duration of each 10 days was chosen because the mortality is high in this early phase of life. Following Strasser s (2002) example we conducted the experiment between spring tides, to circumvent the period of strongest currents and because C. edule migratory activity is highest during spring tides (Armonies 1992). There were maximally two days between the initiations of the experiments at all the four sites. At the end of the 10-day experiments, samples were taken in the experimental units to measure abundance, body size and size of the fluorescent growth ring, to compare abundance, growth and size-selective survival of the two bivalve species C. edule and M. balthica. Exclosure treatments Predator-exclosure cages were cylindrical, 30 cm high with 30.5 cm diameter. The construction was similar to Strasser s (2002) with a frame of two PVC rings and three PVC straps. Sides and top were covered with 1 mm Nylon mesh gauze (Kabel Zaandam) to exclude the smallest shrimp. During low tide the cages were pushed 10 cm deep into the sediment and protruded 20 cm. They were anchored with iron hooks of 50 cm length. To control for cage artifacts, double-walled cages were used. A second, larger cage with 39 cm diameter and 35 cm high was placed around the cage, leaving a space of about 4 cm between the two cage walls. In earlier experiments we had found that the more commonly used incomplete control cage attracted predators, so that potential caging artifacts and predation pressure are confounded (Andresen, in prep.). This problem is not easy to solve (Peterson and Black 1994). The aim of the double control cage is to increase the intensity of potential artifacts such as hydrodynamic modification or shading, and then test for interaction between artifact and treatment (Reusch and Williams 1999). The reasoning is that, if a difference in the response variable 39
40 Chapter 3 between single and double walled cages has the same direction and magnitude at the different sites, the effect can be assumed to be additive and it is still possible to compare exclosure effects between sites (Reusch and Williams 1999). It was a priority not to disturb the sediment at setup of the cages, even though this may have led to accidental enclosure of small shrimp that stayed buried in the sediment during low tide. However, the animals are inactive without water, while with high tide more and bigger shrimp enter the tidal flats to forage, so predation pressure was higher outside the exclosures. Cages were cleaned from algae twice during each experimental period. Dyeing with calcein Size-increment data of juvenile bivalves were obtained by dyeing with calcein blue. Calcein functions as a fluorescent label that binds to calcium and is incorporated into growing calcium carbonate structures (Moran and Marko 2005). It has been used in several studies to determine growth of mollusks (e.g. Clarke et al. 2004, Hermann et al. 2009). Calcein is suitable because it needs only short immersion times and causes little harm (Mahe et al. 2010, Riascos et al. 2007). It can be applied in situ without disturbing the bivalves (van der Geest et al. 2011). PVC rings of 30.5 cm diameter and 10 cm high were pushed halfway into the sediment and 0.5 l solution of 250 mg l -1 calcein in seawater carefully poured into the cylinder. The ring was removed after 1.5 h. When it was not replaced with a cage, tent pegs were used to mark the spot for sampling. Predator sampling and sample processing For quantifying epibenthic predators, once per experiment at high tide four samples were taken with a drop trap (Pihl and Rosenberg 1984) just outside the plot at each site. The trap was made of aluminum, had 0.5 m 2 sampling area and was 70 cm high. To avoid scaring the predators away, it was operated hanging from a 8 m long pole (made of two windsurf masts) by two persons. Sampling took place as soon as the water had receded enough that it would not swash over the sides after dropping the trap (i.e. below 70 cm). The content of the trap was intensively fished with a net with a stable rectangular frame and 1 mm mesh, following Polte et al. (2005). Drop trap sampling was not possible at Balgzand in June, through a combination of weather conditions and logistic constraints. Crustacean samples were stored frozen and Crangon crangon length from scaphocerite to telson measured with 1 mm accuracy. 40
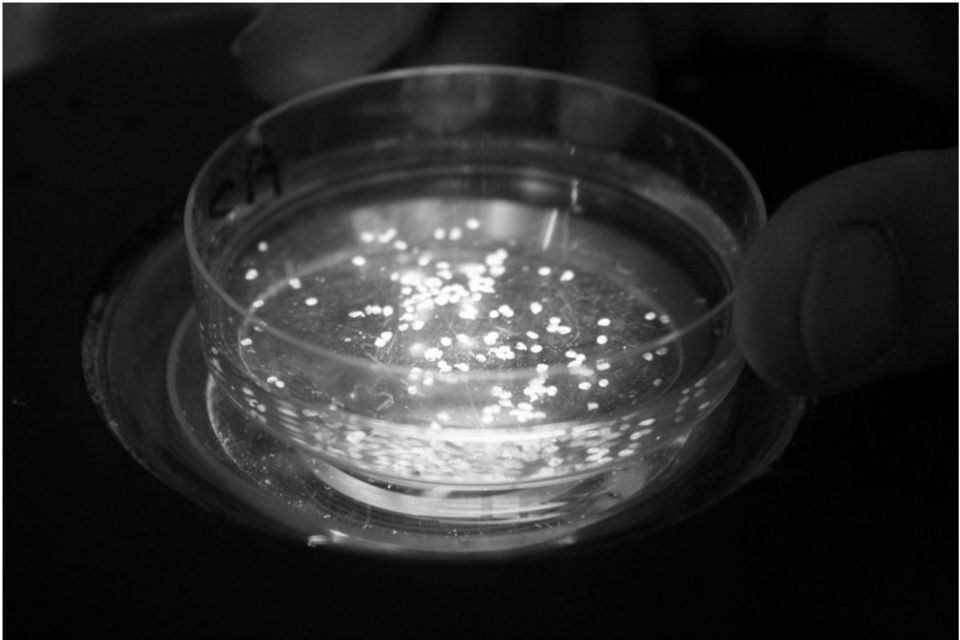
41 Growth and size-dependent loss in the field Bivalve sampling and sample processing At the end of the exclosure experiment, bivalves were sampled with a sharpened Perspex tube of 20 cm 2 area to a depth of 3 cm. Because of high abundances of M. balthica, in May at Oddewatt a corer of 12.5 cm 2 area was used. Nine cores were pooled per experimental unit. Samples were sieved through a 500 µm mesh. Bivalve samples were frozen at -20 C, or (bivalve samples without calcein at Sylt) stored in 4% formalin in seawater, buffered with borax to prevent decalcification (Sturm et al. 2006). The material of the bivalve samples was sorted in portions systematically from Petri dishes. Samples from Sylt were first repeatedly brought in suspension and decanted from the coarse sediment into a 250 µm sieve. Calcein-treated bivalves were measured under a stereomicroscope equipped with a Mercury UV-lamp and appropriate emission and excication filters. The length of the fluorescent growth ring was measured as the longest span from front to back, and ring height was measured perpendicular to that through the umbo (top of the shells at the hinge). The calcein ring measurements were up to 10 µm accurate at the highest usable magnification. For larger measurement values, which had to be done at lower magnifications, accuracy was about 2%. The ring was often not complete and the height was more frequently measurable than the length. Height and length of the complete growth rings were highly correlated (R 2 = 0.99). When ring length was not measurable but height was, the missing length was filled in using the correlation. The daily instantaneous growth rate µ was calculated per individual as µ = log ( L 10 / L 0 ) / t (3.1) where L 10 is the shell length at the end of the 10-day experiment, L 0 is the initial length measured by fluorescent ring, and t = 10 days is the duration of the experiment. To be retained by a 500 μm mesh C. edule have to be 0.7 mm long and M. balthica 0.75 mm. Especially for M. balthica at Sylt in May, we missed the smallest individuals (Fig 3.2 c). When growth rates differed between exclosure treatments, individual counts were corrected for the sieve selection, using the measured growth rates. For the data involving growth ring size, we also corrected for a sieve artifact. Individuals with a small initial size were caught on the sieve only when they had a high growth rate (missing lower left corner in Fig. 3.3). That means average growth rates would be overestimated where the initial size is small. Average growth ring size would be overestimated where growth is slow, because slow growing individuals with a small initial size are missed by the 41
42 Chapter 3 sieve. Individuals with growth rings smaller than 0.7 mm were excluded from the analysis of growth rates and growth ring sizes. On average the mean growth rate and median growth ring size are based on about ten individuals per sample, sometimes only one or two; the maximum was 68 marked individuals in one sample. A low n within a sample will lead to higher variation between samples. Fig. 3.2 Macoma balthica and Cerastoderma edule. Size-frequency distributions of shells in calcein treated experimental units with (black) and without (white, stacked) fluorescent mark, and in migration nets (grey). For the migrants, which had been caught at two occasions during the 10-day experiment, the theoretical final length at the end of the ten days was estimated using growth rates obtained from the marking experiment. Note the varying scales for frequencies and for sizes. 42
43 Growth and size-dependent loss in the field Assessment of immigration In the early benthic phase, M. balthica and C. edule can perform secondary migrations. A difference in bivalve size or abundance between exclosures and uncaged samples could be caused by (size-specific) migration. In the samples treated with calcein, not all individuals had a fluorescent mark. These could have settled into the plots after initiation of the experiments. To evaluate this, migrating bivalves were sampled over two 24 h periods during each experiment. A migration net consisted of a nylon bag of 500 µm mesh size, glued to a PVC ring of 20 cm diameter, which was mounted on a pole 10 cm above the sediment (similar to plankton net in Armonies 1994). The opening could rotate freely pointing towards water current directions. Four migration nets were installed at each site just outside the sampling plot. The aim was to compare the sizes of the bivalves caught in the water column with the ones from the benthic samples of the experiments. As the sampling of migrating bivalves took place at two times during the experimental periods, for comparison their hypothetical size at the end of experiments was calculated using the obtained growth rates from the marked animals. The size distributions of the animals caught in the nets mostly resemble the size distributions of the animals without a fluorescent mark in the calceintreated samples (Fig. 3.2). It was concluded that individuals without a mark had entered the sampling units later. For the subsequent analyses of abundances, they were excluded from the data. As immigrants could not be identified in undyed samples, analyses of exclosure effects used dyed samples only. Data analysis The experimental results were analyzed separately per species and per experimental period with Generalized Linear Models (GLM) in R (R Development Core Team, 2008). Factors were site, exclosure and marking with calcein solution. M. balthica counts were overdispersed (dispersion parameter between 4.3 and 6.7), and the quasipoisson family was used, for C. edule counts, the poissonfamily was suitable (dispersion parameter around 1). In a few cases the counts in all the four replicates of one treatment were zero, and the function would try to predict infinitely small log values. In that case, 1 was added to one of the four replicates to aid the estimation. Sampling area was incorporated in the model as a so-called offset variable (McCullagh and Nelder 1998). For size data, the median shell length per sample was calculated and the Gamma family gave the best looking residual distribution plot. For growth, the mean per sample and the Normal family could be used. As there was no significant relationship of instantaneous growth rate with initial size within the presented range, it was not 43
44 Chapter 3 Fig. 3.3 Macoma balthica and Cerastoderma edule. Individual growth from size-increment data in dependence of initial size. Further calculations were done omitting growth rings <0.7 mm in length to avoid bias through sieve selection. Then the slopes were not significant for both species (p > 0.05), and instantaneous growth rates could be averaged over sizes within a sample. necessary to include initial size as a covariable in the analysis of growth rates (Fig. 3.3). Models including different combinations of main and interactive effects (Table 3.1) were compared simultaneously with Akaikes information criterion, corrected for small sample size (Anderson 2008), using the R package MuMIn (Bartoń 2012): AIC c = -2(log-likelihood) + 2p(n/(n-p-1)) (3.2) where p is the number of estimated parameters of the respective model including the intercept, and n is the number of observations. For M. balthica counts, the QAIC c for overdispersed count data was used. QAIC c = -2(log-likelihood)/ĉ +2p(n/(n-p-1)) (3.3) where ĉ is the dispersion parameter estimated from the full model, calculated by dividing the deviance by the residual degrees of freedom. The number of model parameters is increased by 1 to account for estimating the dispersion parameter. 44
45 Growth and size-dependent loss in the field The log-likelihood was obtained from the poisson fitted model. Every model that contains exclosure was estimated in two versions, once double cages and single cages were regarded as separate levels, and once these two exclosure types were not distinguished (lowercase letters in Tables ), to assess caging artifacts. Table 3.1 Description of models of different complexity that were estimated separately for each combination of period (May and June) with species (Cerastoderma edule and Macoma balthica) and response variable (abundance and size). s = site, e = exclosure, m = marking with calcein solution. The response variables growth, abundance of marked animals and initial size were estimated from the calcein-treated samples only, so models including marking do not apply and J functions as the full model. Each model including the factor exclosure was tested in two versions, once with the three levels separately (capital letters) and once not differentiating between single cage and double control cage (lower case letters). Models were compared simultaneously with Akaikes information criterion (Tables 3.2 and 3.3). Model Model complexity Model description No. Full model A, a s + e + m + s:e + s:m + e:m + s:e:m 3 two-way interactions B, b s + e + m + s:e + s:m + e:m 2 two-way interactions C, c s + e + m + s:e + s:m D, d s + e + m + s:e + e:m E, e s + e + m + s:m + e:m 1 two-way interaction and 3 main effects F, f s + e + m + s:e G, g s + e + m + s:m H, h s + e + m + e:m two-way interaction and 2 main effects J, j s + e + s:e K s + m + s:m L, l e + m + e:m 3 main effects M, m s + e + m 2 main effects N, n s + e O s + m P, p e + m 1 main effect Q s R, r e Null model T Intercept S m 45
46 Chapter 3 Results Effect of calcein marking on abundance and size A side-question but prerequisite in the combined caging and staining experiment was whether the method of fluorescent marking affects survival and growth of first year bivalves. For Macoma balthica in June and Cerastoderma edule in May, calcein did not need to be included in the models (model j for abundances, models Q and j for size, respectively, Table 3.1 and 3.2). The application of the marking solution seems to have lowered M. balthica abundances in May (Fig. 3.4 a and b, only significant factors plotted). The effect was small but significant and showed in the exclosures. The m(marking):e(exclosure) interaction (model h, Table 3.1 and 3.2) did not affect the direction but only the strength of the exclosure effect, and was similar at all sites (Fig. 3.4 a and b). Also C. edule abundances in June differed between calcein treatments (model C ), at Oddewatt they were higher in the calcein treated units (Fig. 3.4 c and d). Still, there was no interaction with exclosure, and the calcein effects were weak compared to the exclosure effects. Concerning size, M. balthica median length in May was lower in the calcein samples at Sylt, while at Vlakte van Kerken the individuals were smaller in the experimental units that had not been treated with calcein, independent of exclosure treatment (model K, Fig. 3.5 a). There was no significant influence of calcein on body size of C. edule in June after one influential value was removed (model n, Fig. 3.5 d). Overall, in some cases calcein may change the effect sizes in the following analyses, but not the qualitative conclusions. Growth Under natural (uncaged) conditions, growth of M. balthica was similar at all sites in May (Fig. 3.6 a), but in June growth got lower at Sylt (Fig 3.6 b), whereas in C. edule, growth appeared to be lower at Sylt in May (Fig 3.6 c), and the same everywhere by June (Null model, Fig 3.6 d). C. edule had the fastest growth observed, their average daily instantaneous growth rate of 0.06 d -1 in June amounts to 60 µm in one day for a 1 mm long individual. The instantaneous growth rate of around 0.02 d -1 for M. balthica in May corresponds to 20 µm length increase in one day for a 1 mm long individual. However, it is remarkable how variable the individual growth rates were (Fig. 3.3). M. balthica grew at up to 0.06 d -1, but some had hardly grown at all, the maximum individual growth rate observed was 0.08 d -1 in C. edule. Except for C. edule in June, caging had an influence on bivalve growth (Fig. 3.6). In most of the observable cases, growth 46
47 Growth and size-dependent loss in the field Fig. 3.4 Macoma balthica and Cerastoderma edule. Model predictions and standard errors of the models that assess the effect of calcein marking on bivalve abundance. Only significant factors are plotted. The factor marking was not significant for M. balthica in June and for C. edule in May (not shown). = Gröningwatt (at Sylt), = Oddewatt (at Sylt), = Balgzand (at Texel), = Vlakte van Kerken (at Texel). 47
48 Chapter 3 Fig. 3.5 Macoma balthica and Cerastoderma edule. Model predictions and standard errors of the models that assess the effect of calcein marking on bivalve size. Only significant factors are plotted. Note the compressed scale. = Gröningwatt (at Sylt), = Oddewatt (at Sylt), = Balgzand (at Texel), = Vlakte van Kerken (at Texel). 48
49 Growth and size-dependent loss in the field Table 3.2 Akaikes information criterion values (bias corrected for small sample size: AIC c ) for General Linear Models that include all experimental treatments to assess a possible effect of calcein marking on the response variables bivalve abundance and size. For Macoma balthica counts, QAIC c for overdispersed count data was used. The lowest values are highlighted in bold. For the description of each model number see Table 3.1. C. e: Cerastoderma edule, M. b.: Macoma balthica. Fit: 1 deviance best fitting model / deviance Null model is given as a measure of fit. Model Counts Size number M. b. May M. b. June C. e. May C. e. June M. b. May M. b. June C. e. May C. e. June A B C D E F G H J K L M N O P Q R S T a b c d e f g h j l m n p r Fit
50 Chapter 3 Fig. 3.6 Macoma balthica and Cerastoderma edule. Model predictions and standard errors of models on mean daily instantaneous growth rates in exclosure experiment, obtained from size-increment data. Only significant factors are plotted. = Gröningwatt (at Sylt), = Oddewatt (at Sylt), = Balgzand (at Texel), = Vlakte van Kerken (at Texel), = all sites together. was higher in the cages (model n, Table 3.3), but in M. balthica in May the influence of caging differed between sites (model j ). Growth was decreased in the cages at Sylt, hinting to habitat-dependent modification of growth conditions (Fig. 3.6 a). If growth had been calculated only from observations of size (from the end of the May experiment to the end of the experiment in June) and the small immigrants had been included, the estimates would be up to 70% lower than the measured growth rates. 50
51 Model No. J N Q R T j Table 3.3 Akaikes information criterion values (bias corrected for small sample size: AICc) for General Linear Models that include only bivalves with a fluorescent mark to investigate growth, exclosure effects on abundance, and size selectivity of loss. For Macoma balthica counts, QAICc for overdispersed count data was used. The lowest values are highlighted in bold. For the description of each model number see Table 3.1. C. e: Cerastoderma edule, M. b.: Macoma balthica. Fit: 1 deviancebest fitting model / deviancenull model is given as a measure of fit. n r Fit Growth M. b. May M. b. June C. e. May C. e. June Count marked individuals M. b. May M. b. June C. e. May C. e. June Initial size (size of growth ring) M. b. May M. b. June C. e. May C. e. June Growth and size-dependent loss in the field 51
52 Chapter 3 Fig. 3.7 Macoma balthica and Cerastoderma edule. Model predictions and standard errors of models on abundance of marked bivalves in the exclosure experiment. Only significant factors are plotted. = Gröningwatt (at Sylt), = Oddewatt (at Sylt), = Balgzand (at Texel), = Vlakte van Kerken (at Texel). Exclosure effect on abundance and size-selectivity of loss In M. balthica as well as in C. edule, in May abundances were always lower in the uncaged sampling units where predators had access (Fig. 3.7 a and c). The loss, presumably mainly predation mortality, was similar between sites (model n ). In June, in both species abundances differed between the single cages and the double control cages in different ways between sites (model J, Fig. 3.7 b and d). Although sometimes the abundances were clearly higher in the cages, it 52
53 Growth and size-dependent loss in the field Fig. 3.8 Macoma balthica and Cerastoderma edule. Model predictions and standard errors of models on initial bivalve size in exclosure experiments to investigate size-selectivity of loss. The initial size of the survivors is the size of their artificial growth rings produced with calcein at the beginning of the experiment. Only significant factors are plotted. For C. edule in May, only at Balgzand unbiased growth ring observations were available. = Gröningwatt (at Sylt), = Oddewatt (at Sylt), = Balgzand (at Texel), = Vlakte van Kerken (at Texel), = all sites together. cannot be safely concluded that this is due to protection from predation. The varying differences between cage types are a hint that caging could have had an influence on local survival other than through the exclosure of predators alone. 53
54 Chapter 3 Concerning size-selectivity of the observed loss, individuals that survived under predator access in May had on average bigger fluorescent growth rings than the protected survivors, both in M. balthica and C. edule (model r and j, Fig. 3.8 a and c). This hints to selective loss of individuals with a smaller initial size (smaller than the respective median). The mere observation of the final shell size had given no indication of that in M. balthica (Fig. 3.5 a). The fluorescent record in the shells of the size at the initiation of the experiment avoids bias by subsequent growth differences and immigration. In June, the average of the initial body size of the survivors was not influenced by exclosure treatments in both species (model Q, Fig, 3.8 b and d). Note that the observation of final body size would have suggested a better survival of smaller C. edule under predation risk in June (Fig. 3.7 d), but through marking, it becomes evident that smaller individuals had immigrated (Fig. 3.2 k). Unfortunately, for C. edule in May, there are no unbiased growth ring observations (truncation at 0.7 mm) from uncaged sampling units at three sites. Inspection of the final shell sizes would suggest selective loss of bigger individuals (Fig. 3.7 c) but the above contradictions show that final shell size can be misleading. Fig. 3.9 Crangon crangon. Length-frequency distributions during the experiments, sampled at high tide (not possible at Balgzand in June). Gröningwatt and Oddewatt are at Sylt, Balgzand and Vlakte van Kerken are at Texel. Frequencies are given per m 2, total sampling area each time was 2 m 2. 54
55 Growth and size-dependent loss in the field Crangon crangon have to be about ten times longer than M. balthica to be able to consume them (Hiddink et al. 2002), for eating C. edule they probably have to be even bigger because of the harder shell and globose shape. In May there were plenty shrimp present that would feed on small bivalves (Fig. 3.9). In June, more small shrimp had entered the study sites, and also the numbers of larger individuals had increased. Although the bivalves had grown, there was still prey in the size range of the shrimp present. Discussion Body size is central to species interactions that influence survival, and individual growth determines the body sizes of species that encounter. With a combined fluorescent staining and caging experiment, we disentangled growth from sizedependent abundance changes of juvenile bivalves Macoma balthica and Cerastoderma edule. We obtained individual growth rates and compared average growth in two distant regions in the Wadden Sea, detected size-dependent loss and identified the affected sizes. In both species individual growth was faster at Texel than at Sylt in one of the two study periods, resulting in bigger individuals at Texel at the end of the study. If only the change in average size had been used to estimate average growth rates, growth would have been strongly underestimated due to immigration of smaller individuals. The possibility to identify immigrants from size distributions is limited. Individual marking also showed that growth is highly variable between individuals. The other objective of using individual staining was to identify sizedependent loss, which has population ecological consequences. In combination with a caging experiment, we found evidence of selective loss of small bivalves in both regions in the first study period. The caging experiment was intended to manipulate predation mortality, but additionally to predator access, emigration is another possible process that could cause an abundance decrease and could be affected by the cages. We think that the main cause of the size-dependent loss outside the exclosures was predation, for several reasons: (1) The missing bivalve sizes were theoretically small enough to pass through the cage mesh. Immigration into similar cages had also been observed by Strasser (2002). Admittedly, emigration would require some water current, but then we would expect a difference between single and double cages, which we did not find. (2) There is strong support that during the study, the middle intertidal zone experienced net immigration. In June, when no size-selective loss was found, still many small C. edule and M. 55
56 Chapter 3 balthica were caught with drift nets during migration. If these had been mainly emigrants, then why did we not get size selective loss? Thus we conclude that migrants were mainly immigrants, which is further supported by the size similarity of the unmarked individuals in the sediment and the migrating bivalves. Armonies and Hellwig-Armonies (1992) also found that the middle intertidal zone at Oddewatt was subject to net immigration until July in 1991, when M. balthica gradually moved up higher in the intertidal. (3) The predators present were able to consume the missing bivalves, both concerning their size (Hiddink et al. 2002) and their intake rates (Andresen and van der Meer 2010). While it is possible that some of the loss is due to movements of bivalves, mortality is plausible as the main reason. There were no systematic differences in predation patterns between the islands of Sylt and Texel. Size-selective predation on C. edule as well as M. balthica occurred in the first experiment in May. Although young shrimp had arrived earlier at Texel than at Sylt (own observations), there was no systematic difference in predator regimes between regions. The size composition of shrimp on tidal flats is primarily determined by size-dependent habitat use rather than by local growth conditions (Beukema 1992). The two sites at Sylt were similar in predator composition, but in May, Vlakte van Kerken had the highest number of large predators and Balgzand the lowest number of the four sites. The topology of the Balgzand mudflats may have delayed immigration of larger shrimps. Hence, no simple general one-line conclusion can be drawn, and here one of the limitations of the study becomes obvious. Field experiments and the measurements under UV-light are very laborious, which restricted the temporal and spatial replication and scope of the study. Given the inherent variability of the phenomena, such replication is apparently needed. The results suggest that similar processes are taking place at both islands, albeit at different speed. At Texel the potential for the bivalves to outgrowth their predators soon was better than at Sylt. Caging and calcein marking each come with their own problems. While other studies found no harmful influence of calcein (Moran and Marko 2005), our findings show that this should be assessed each time when applied in a new system. Even if the methods do not give absolute quantitative results, it is still possible to compare between levels of each factor as long as there are no interactions of the two factors. This was the case for the effect of calcein on M. balthica growth in May and on C. edule abundance in June, which did not interact with exclosure treatments. There was an interactive effect on M. balthica abundances in May. Abundances were lowered in the exclosures but not in the uncaged units treated with calcein. As this reduced the effects of exclosure treatments, qualitative conclusions that were drawn from calcein samples are merely more con- 56
57 Growth and size-dependent loss in the field servative. Further, cage artifacts cannot be excluded if the effects of single and double cage walls are all-or-nothing. Artifacts are always created by an experimental procedure (Fernandes et al. 1999), but combining an interpretation of the results with natural history observations, caging experiments can contribute to the solution of important ecological questions (Reise 1985). The combination of caging and marking provides valuable information on processes which are otherwise obscured. If we had not combined them, we could have drawn wrong conclusions, or would have missed an interesting process (compare e.g. Fig. 3.6 with Fig. 3.8). Sometimes we noticed that scouring led to puddles in the cage area at low tide, which may prolong submersion and explain the increased growth in some cases (Freudendahl et al. 2010). We cannot exclude the possibility that this also had an influence on survival, but this effect would probably be small compared to that of predation. It must be emphasized that other caging studies probably have the same issues, which only become visible here through the combination of methods. The most important advantage of individual marking is that we know the size of the local survivors since the beginning. When in past exclosure studies size differences between cages had been observed, it was not known for sure whether that was just the influence of the cage on growth or size-dependent loss. Here growth could be quantified and the recorded initial size of the survivors compared irrespective of subsequent growth. Predation on the early post-settlement stages largely determines recruitment and population dynamics of bivalves in the Wadden Sea (van der Meer et al. 2001). Much insight on size-structured populations and recruitment originates from fisheries science. While keeping potential harmful effects in mind, for the early life stage of bivalves, calcein marking can function as surrogate for the examination of otolith microstructures in fish. Concerning the consequences for population dynamics, size-selective mortality in the early life phase has in the first instance an effect on the population density. Size-selective mortality will affect recruitment variability if the factors governing size-based processes vary between years (Sogard 1997). For example Nakaya et al. (2007) found annual variation in shrimp predation on flatfish through an influence of variation in bottom water temperature on fish size but not on shrimp size. Annual variation in size-selective mortality of salmon fry was flood and drought related (Good et al. 2001). Additionally to abundance, size-selective mortality will also affect the size structure of a cohort. In our study the smallest individuals were most vulnerable, but after a warm winter in 1997, it was the smallest C. edule that survived until recruitment (Strasser et al. 2001). When predation is directed towards small individuals, fast growth would increase survival, but slow growth can be advanta- 57
58 Chapter 3 geous if relatively big gape limited predators are present only temporarily (Urban 2007). Under constant unidirectional selection pressure through persistently warmer winters and consequently earlier arriving shrimps, the possibility for the young bivalves to adapt by increased growth rates is limited by food availability (Freitas et al. 2007, Philippart et al. 2003). Texel cannot be used to forecast the situation at Sylt under climate warming. The novel experimental evidence of size-selective predation in the field brings us one step closer to understanding observed recruitment patterns. From here, it would be interesting to look further into the sources and consequences of growth variability. For prognoses on a mechanistic basis, we would still need more detailed knowledge of shrimp behavior, also in the presence of alternative food. Yet, our new data on individual growth rates should, together with information on seasonality and prey choice, help to further investigate recruitment success under various scenarios. Acknowledgements This research was funded by the Netherlands Organization for Scientific Research (NWO) and Netherlands-Bremen Oceanography II (NEBROC). Many colleagues, students and volunteers helped with fieldwork, here special thanks go to Jannik Schultner. We thank the AWI Wadden Sea Station Sylt for the hospitality. Milou van Voorst and Maarten Buteyn helped with sample processing in the lab. Karsten Reise and three anonymous referees gave valuable comments on an earlier version of the manuscript. References Ambrose, W.G., Are infaunal predators important in structuring marine soft-bottom communities. American Zoologist 31, Anderson, D.R., Model based inference in the life sciences: a primer on evidence. Springer, Berlin Andresen, H., van der Meer, J., Brown shrimp (Crangon crangon, L.) functional response to density of different sized juvenile bivalves Macoma balthica (L.). Journal of Experimental Marine Biology and Ecology 390, Armonies, W., Migratory rhythms of drifting juvenile molluscs in tidal waters of the Wadden Sea. Marine Ecology-Progress Series 83, Armonies, W., Drifting meio- and macrobenthic invertebrates on tidal flats in Königshafen: a review. Helgoländer Meeresuntersuchungen 48, Armonies, W., Hellwig-Armonies, M., Passive settlement of Macoma balthica spat on tidal flats of the Wadden Sea and subsequent migration of juveniles. Netherlands Journal of Sea Research 29,
59 Growth and size-dependent loss in the field Bachelet, G., Growth and recruitment of the Tellinid bivalve Macoma balthica at the Southern limit of its geographical distribution, the Gironde Estuary (SW France). Marine Biology 59, Bartoń, K., MuMIn: Multi-Model Inference. R package version Forge.R-project.org/projects/mumin/ Beukema, J.J., The abundance of shore crabs Carcinus maenas (L) on a tidal flat in the Wadden Sea after cold and mild winters. Journal of Experimental Marine Biology and Ecology 153, Beukema, J.J., Dynamics of juvenile shrimp Crangon crangon in a tidal-flat nursery of the Wadden Sea after mild and cold winters. Marine Ecology- Progress Series 83, Beukema, J.J., Dekker, R., Decline of recruitment success in cockles and other bivalves in the Wadden Sea: possible role of climate change, predation on postlarvae and fisheries. Marine Ecology-Progress Series 287, Bos, O., G., Hendriks, I.E., Strasser, M., Dolmer, P., Kamermans, P., Estimation of food limitation of bivalve larvae in coastal waters of north-western Europe. Journal of Sea Research 55, Bundesamt für Seeschifffahrt und Hydrographie, data/observations/sea_surface_temperatures/index.jsp Campos, J., van der Veer, H.W., Autecology of Crangon crangon (L.) with an emphasis on latitudinal trends. Oceanography and Marine Biology: an Annual Review 46, Clarke, A., Prothero-Thomas, E., Beaumont, J.C., Chapman, A.L., Brey, T., Growth in the limpet Nacella concinna from contrasting sites in Antarctica. Polar Biology 28, Drent, J., Life history variation of a marine bivalve (Macoma balthica) in a changing world. Ph.D. thesis Rijksuniversiteit Groningen Ebenman, B., Persson, L., Size-Structured Populations: Ecology and Evolution. Springer, Berlin Heidelberg New York Fernandes, T.F., Huxham, M., Piper, S.R., Predator caging experiments: a test of the importance of scale. Journal of Experimental Marine Biology and Ecology 241, Flach, E.C., The separate and combined effects of epibenthic predation and presence of macro-infauna on the recruitment success of bivalves in shallow soft-bottom areas on the Swedish west coast. Journal of Sea Research 49, Freitas, V., Campos, J., Fonds, M., Van der Veer, H. W., Potential impact of temperature change on epibenthic predator-bivalve prey interactions in temperate estuaries. Journal of Thermal Biology 32, Freudendahl, A.S. L., Nielsen, M.M., Jensen, T., Jensen, K.T., The introduced clam Ensis americanus in the Wadden Sea: field experiment on impact of bird predation and tidal level on survival and growth. Helgoland Marine Research 64, Fryxell, J.M., Lundberg, P., Individual Behavior and Community Dynamics, Chapman and Hall, New York. Gibson, R.N., Robb, L., The relationship between body size, sediment grain size and the burying ability of juvenile plaice, Pleuronectes platessa L. Journal of Fish Biology 40, Gilbert, M.A., Growth rate, longevity and maximum size of Macoma balthica (L.). Biological Bulletin 145,
60 Chapter 3 Good, S.P., Dodson, J.J., Meekan, M.G., Ryan, D.A. J., Annual variation in sizeselective mortality of Atlantic salmon (Salmo salar) fry. Canadian Journal of Fisheries and Aquatic Sciences 58, Hall, S.J., Raffaelli, D., Turrell, W.R., Predator-caging experiments in marine systems - a reexamination of their value. American Naturalist 136, Herrmann, M., Lepore, M.L., Laudien, J., Arntz, W.E., Penchaszadeh, P.E., Growth estimations of the Argentinian wedge clam Donax hanleyanus: A comparison between length-frequency distribution and size-increment analysis. Journal of Experimental Marine Biology and Ecology 379, Hiddink, J.G., Marijnissen, S.A.E., Troost, K., Wolff, W.J., Predation on 0-group and older year classes of the bivalve Macoma balthica: interaction of size selection and intertidal distribution of epibenthic predators. Journal of Experimental Marine Biology and Ecology 269, Hummel, C., Honkoop, P., van der Meer, J., Small is profitable: No support for the optimal foraging theory in sea stars Asterias rubens foraging on the blue edible mussel Mytilus edulis. Estuarine, Coastal and Shelf Science 94, Hunt, H.L., Mullineaux, L.S., The roles of predation and postlarval transport in recruitment of the soft shell clam (Mya arenaria). Limnology and Oceanography 47: Kaehler, S., McQuaid, C.D., Use of the fluorochrome calcein as an in situ growth marker in the brown mussel Perna perna. Marine Biology 133, Krebs, J.R., Davies, N.B., An introduction to behavioural ecology. Blackwell Scientific Publications, Oxford Loebl, M., Colijn, F., van Beusekom, J.E.E., Baretta-Bekker, J.G., Lancelot, C., Philippart, C.J. M., Rousseau, V., Wiltshire, K.H., Recent patterns in potential phytoplankton limitation along the Northwest European continental coast. Journal of Sea Research 61, Mahe, K., Bellamy, E., Lartaud, F., de Rafelis, M., Calcein and manganese experiments for marking the shell of the common cockle (Cerastoderma edule): tidal rhythm validation of increments formation. Aquatic Living Resources 23, McCullagh, P., Nelder, J.A., Generalized Linear Models, Chapman and Hall, London Moran, A.L., Calcein as a marker in experimental studies newly-hatched gastropods. Marine Biology 137, Moran, A.L., Marko, P.B., A simple technique for physical marking of larvae of marine bivalves. Journal of Shellfish Research 24, Nakaya, M., Takatsu, T., Joh, M., Nakagami, M., Takahashi, T., Annual variation of potential predation impacts on larval and juvenile marbled sole Pseudopleuronectes yokohamae by sand shrimp Crangon uritai in Hakodate Bay, Hokkaido. Fisheries Science 73, Parmesan, C., Yohe, G., A globally coherent fingerprint of climate change impacts across natural systems. Nature 421, Peterson, C.H., Black, R., An experimentalists challenge - when artifacts of intervention interact with treatments. Marine Ecology-Progress Series 111, Philippart, C.J.M., van Aken, H.M., Beukema, J.J., Bos, O.G., Cadee, G.C., Dekker, R., Climate-related changes in recruitment of the bivalve Macoma balthica. Limnology and Oceanography 48,
61 Growth and size-dependent loss in the field Pihl, L., Rosenberg, R., Food selection and consumption of the shrimp Crangon crangon in some shallow marine areas in western Sweden. Marine Ecology- Progress Series 15, Polte, P., Schanz, A., Asmus, H., Effects of current exposure on habitat preference of mobile 0-group epibenthos for intertidal seagrass beds (Zostera noltii) in the northern Wadden Sea. Estuarine Coastal and Shelf Science 62, R Development Core Team, R: A Language and Environment for Statistical Computing. R Foundation for Statistical Computing, Vienna, Austria. Reise, K.,1985. Tidal flat ecology. Springer, Berlin Reusch, T.B.H., Williams, S. L., Macrophyte canopy structure and the success of an invasive marine bivalve. Oikos 84, Riascos, J., Guzman, N., Laudien, J., Heilmayer, O., Oliva, M., Suitability of three stains to mark shells of Concholepas concholepas (Gastropoda) and Mesodesma donacium (Bivalvia). Journal of Shellfish Research 26, Root, T.L., Price, J.T., Hall, K.R., Schneider, S.H., Rosenzweig, C., Pounds, J.A., Fingerprints of global warming on wild animals and plants. Nature 421, Schmidt, M., Philipp, E.E.R., Abele, D., Size and age-dependent changes of escape response to predator attack in the Queen scallop Aequipecten opercularis. Marine Biology Research 4, Smallegange, I.M., van der Meer, J., Why do shore crabs not prefer the most profitable mussels? Journal of Animal Ecology 72, Sogard, S.M., Size-selective mortality in the juvenile stage of teleost fishes: A review. Bulletin of Marine Science 60, Sturm, C.F., Pearce, T.A., Valdés, Á., The Mollusks: A Guide to Their Study, Collection, And Preservation. American Malocological Society, Pittsburgh, PA, U.S.A. Strasser, M., Reduced epibenthic predation on intertidal bivalves after a severe winter in the European Wadden Sea. Marine Ecology-Progress Series 241, Strasser, M., Günther, C.P., Larval supply of predator and prey: temporal mismatch between crabs and bivalves after a severe winter in the Wadden Sea. Journal of Sea Research 46, Strasser, M., Hertlein, A., Reise, K., Differential recruitment of bivalve species in the northern Wadden Sea after the severe winter of 1995/96 and of subsequent milder winters. Helgoland Marine Research 55, Tollrian, R., Chaoborus crystallinus predation on Daphnia pulex can induced morphological changes balance effects of body-size on vulnerability. Oecologia 101, Urban, M.C., Predator size and phenology shape prey survival in temporary ponds. Oecologia 154, van der Geest, M., van Gils, J.A., van der Meer, J., Olff, H., Piersma, T., Suitability of calcein as an in situ growth marker in burrowing bivalves. Journal of Experimental Marine Biology and Ecology 399, 1-7. van der Meer, J., Beukema, J.J., Dekker, R., Long-term variability in secondary production of an intertidal bivalve population is primarily a matter of recruitment variability. Journal of Animal Ecology 70, van der Veer, H.W., Feller, R.J., Weber, A., Witte, J.I.J., Importance of predation by crustaceans upon bivalve spat in the intertidal zone of the Dutch Wadden Sea 61
62 Chapter 3 as revealed by immunological assays of gut contents. Journal of Experimental Marine Biology and Ecology 231, Visser, M.E., Holleman, L.J. M., Gienapp, P., Shifts in caterpillar biomass phenology due to climate change and its impact on the breeding biology of an insectivorous bird. Oecologia 147, Walther, G.R., Community and ecosystem responses to recent climate change. Philosophical Transactions of the Royal Society B: Biological Sciences 365, Yang, L.H., Rudolf, V.H.W., Phenology, ontogeny and the effects of climate change on the timing of species interactions. Ecology Letters 13,
63 Chapter 4 Seasonal timing of bivalve settlement and arrival of crustaceans in the Wadden Sea, and resulting predator-prey body size ratios Henrike Andresen, Rob Dekker, Ine Dorresteijn, Matthias Strasser, Jaap van der Meer Abstract Phenology is the timing of life history events in dependence of climate variations within and between years. Species specificity in phenological responses can influence interspecific interactions. Correlated climate effects on early predation mortality are a proposed cause of corresponding bivalve recruitment successes throughout the Wadden Sea. Bivalve recruitment is usually high after cold winters through delayed predator arrival. We compared four years of bivalve settlement timing between two distant regions of the Wadden Sea that generally differ in winter temperatures. In one year, also their epibenthic crustacean predators were measured and the prey-predator size ratio frequencies were compared. At one site, size ratios were compared between five years. Timing of settlement of the studied bivalves Macoma balthica, Cerastoderma edule and Mya arenaria was quite similar between the two regions. While their shrimp predators (Crangon crangon) were delayed at the colder region, the resulting prey-predator size ratios were similar between regions as well. Timing of bivalves differed between years, and a stronger phenological response in crustaceans than in bivalves caused diverse size ratio distributions of predators and prey. The results support that climate driven conditions for predation can be an influential factor for annual fluctuations of recruitment success as well as spatial population synchrony. 63
. In our study system, the Wadden Sea, bivalves typically have good recruitment after cold winters (Beukema 1982).")
64 Chapter 4 Introduction Phenology, the timing of life history events depending on seasonal and interannual climate variations, can influence species interactions and by that population dynamics (Yang and Rudolf 2010). In our study system, the Wadden Sea, bivalves typically have good recruitment after cold winters (Beukema 1982). Recruitment is the subjectively defined stage at which juvenile survivors are regarded to be added to a population and year class strength is determined, in the case of Wadden Sea bivalves usually at the end of the summer (Strasser et al. 2003), but sometimes the definition includes the first winter (van der Meer et al. 2001). With the issue of climate change emerging, several studies in the 1990s investigated processes determining bivalve recruitment in the Wadden Sea (Hiddink 2002, Honkoop 1998, Strasser 2000). Variations in reproductive output through winter temperature differences had little influence on bivalve population dynamics (Honkoop et al. 1998). Predation by crustaceans on small settlers appears to play an important role for the survival until recruitment (Hiddink et al. 2002, Strasser 2002). After cold winters crustacean arrival on the tidal flats is delayed (Beukema 1991, 1992, Strasser and Günther 2001), giving their bivalve prey a head start. This is regarded a major process behind synchronized popula- Fig. 4.1 Map of the Wadden Sea at the south-eastern edge of the North Sea (middle). Details of the study regions at Texel (left) and Sylt (right), with tidal flats shaded grey. Boxes indicate the sampling sites for bivalves and crustaceans in 2007 at both islands. Site I at Texel was sampled 1994 to 1998 for bivalves and crustaceans. Site II was sampled 1994 to 1998 for crustaceans. Site III at Texel was sampled from 1995 to 1998 for bivalves and in 1998 additionally for crustaceans. X marks the sampling sites in the Sylt region for bivalves in 1996 to
65 Phenology and predator-prey size ratios tion dynamics over a large geographic area of the Wadden Sea (Beukema et al. 1996). Spatial synchrony of population dynamics is a general phenomenon in many taxa and usually induced by correlated climatic factors (Hudson and Cattadori 1999). Some questions still remain unanswered. Why does one bivalve species profit from cold winters over the whole Wadden Sea and others only in certain regions (Strasser et al. 2003)? Winter temperatures differ between the ends of the Wadden Sea, does this lead to differences in timing between regions? If so, does this alter the size ratio of predators and prey that encounter? This has not been compared yet. We observed the time course of bivalve and crustacean abundances and body sizes in the year 2007 simultaneously in two distant regions of the Wadden Sea, namely at the island of Texel in the southwest and at the island of Sylt in the northeast. We also got a data set out of the drawer of bivalve settler observations at Texel 1994 to 1998, which includes the same three years that were studied by Strasser et al. (2001) at Sylt. This gave us the opportunity to compare bivalve timing between regions in three recruitment periods that followed winters of contrasting conditions. Crustacean predators had been sampled as well in all the years at Texel, so predator-prey size ratios could be compared between years in one region. The main aim of comparing timing and resulting size ratios was to assess whether they can explain differences or similarities in recruitment between years, sites and species. Fig. 4.2 Sea water surface temperatures at Texel (dashed line) and Sylt (solid line) in the study years (van Aken 2008, van Beusekom, pers. comm.). 65
66 Chapter 4 Material and Methods Study area The Wadden Sea at the south-eastern edge of the North Sea is a system of intertidal flats between barrier islands and the mainland. The two sampling regions, at the island of Texel in the westernmost part of the Dutch Wadden Sea, and at the island of Sylt in the northernmost part of the German Wadden Sea, are approximately 400 km coastline apart (Fig. 4.1). The tidal range at Texel is about 1.5 m, at Sylt about 2 m. All data used in this study are from the middle intertidal zone. Seawater temperatures range from around 0 C in winter up to around 20 C in summer, but in winter are usually lower at Sylt than at Texel (Fig. 4.2). Sampling Sampling focused on spring and summer, to cover the period from bivalve settlement to recruitment. In 2007 two sampling sites were chosen in each of the two study regions (Fig. 4.1). Bivalve and crustacean samples were taken within a plot of 40 x 40 m 2, in one to two week intervals. Bivalve sample area, number of samples, sampling depth and sieve mesh size were adjusted over time to their abundance and size, see Tables 4.1 and 4.2 for details per date. Samples were taken with corers, sieved in the lab and preserved in buffered formalin. They were sorted and bivalve lengths measured under stereo microscopes to the nearest 10 µm for the smallest animals or with 2% accuracy when lower magnifications were used for bigger individuals. Crustaceans were sampled by scooping out the sediment and sieving in the field over 1 mm punch plate. Usually four crustacean samples of 0.5 m 2 each were taken. Only three samples were taken at Texel at the first sampling event at each site. At one site at Texel the area was reduced to m 2 in April, June and July because of high shrimp abundance. Crustacean samples were sorted life or stored frozen; Crangon crangon length from telson to scaphocerit and Carcinus maenas caparax width were measured to the nearest millimeter. The Sylt bivalve data from 1996 to 1998 origin from ten sites (Fig. 4.1), sampled about every six weeks within roughly 9 m 2 at each site. Sampling of the ten sites was usually completed with a week. See Table 4.1 for number of samples, sample areas and sieve mesh sizes per sampling event. No epibenthic crustaceans were sampled 1996 to 1998 at Sylt. At Texel, in 1994 bivalves were sampled at one site, from 1995 to 1998 at two sites (Fig. 4.1), within plots of 10 x 10 m 2. Sampling took place one to 66
67 Phenology and predator-prey size ratios Table 4.1 Sylt bivalve sampling details. If sampling differed within one event, sites are separated by slashes (/). Year Date No. of samples per site Area per sample (cm 2 ) Sampling depth (cm) Sieve mesh size (µm) 1996 end of May end of Jun middle of Aug beginning of Oct beginning of Apr middle of May end of Jun beginning of Aug middle of Sep end of May beginning of Jul middle of Aug beginning of Oct /12 Apr /19 Apr /26 Apr /5 May /15 May 4 180/ /20 May /30 May /6 Jun 8 50/ /15 Jun 4 80/ three times per month, see Table 4.2 for details. Bivalve lengths were measured to the nearest 100 µm. Crustaceans were sampled at two sites from 1994 to 1997, one of them was identical with one of the bivalve sites. In 1998 crustaceans were additionally sampled at the second bivalve site (Fig. 4.1). For crustaceans, total sampling area per date was 0.36 m 2, taken in 40 cores in four 10 m long transects just outside the 10 x 10 m 2 plot. They were sieved in the field over 1 mm screen mesh, sorted in the lab and measured to the nearest millimeter. 67
68 Chapter 4 Table 4.2 Texel bivalve sampling details. If sampling differed within one event, sites are separated by slashes (/) and different samples within a site by plus-symbols (+). Year Date No. of samples per site Area per sample (cm 2 ) Sampling depth (cm) Sieve mesh size (µm) May Jun Jul Sep /22 May /27 Jun /25 Jul /23 Aug /15 May 20/ /31 May 5+5/ / /13 Jun 10 28/ /3 Jul / /16 Jul /30 Jul /9 Oct /22 May 5 134/ /19 Jun / /17 Jul / /25 Aug 5+5/ / /13 May /28 May /10 Jun /24 Jun / /12 Apr /28 Apr /7 May /16 May /21 May /31 May /4 Jun 7 180/ /14 Jun

69 Phenology and predator-prey size ratios Data interpretation The periods of steepest abundance increase of juveniles before the maximum abundance were considered peak settlement for comparing timing between species, regions and years. In crustaceans, cohorts are not as distinct as in the bivalves. To make sure to include all juveniles in spite of growth between sampling events, C. crangon individuals 10 mm and Carcinus maenas individuals 6 mm were considered, while they are 5 mm and 1 mm big at settlement, respectively. For the assessment of body size relationships of the bivalves with C. crangon, all ages of C. crangon were included. From the data obtained at the sampling event closest to the middle of each month, for all possible bivalveshrimp encounters the body size ratios were calculated for a representation in size ratio frequency histograms. Bivalve size frequencies were weighed according to sampling area if different areas were used within one event. Fig. 4.3 Bivalve settlement time at Sylt versus Texel. Boxes mark periods of steepest abundance increase in the years 1996, 1997 and 1998 and Mb = Macoma balthica, Ce = Cerastoderma edule, Ma = Mya arenaria. 69
70 Chapter 4 Results Settlement timing The timing of bivalve settlement was quite similar between the sampling regions at the islands of Sylt and Texel (Fig. 4.3). Only in 1996, that is after the coldest winter (Fig. 4.2), the spatfall was later at Sylt than at Texel. Accordingly, variation in timing between the four studied years was higher at Sylt than at Texel. Macoma balthica was generally the first or among the first to arrive. The biggest difference in settlement time between the two islands was in Mya arenaria. The arrival of crustaceans was monitored in 2007 at both islands to compare the relation of predator and prey timing between study regions (Fig. 4.4). A striking difference was found in the arrival of Crangon crangon: it peaked two months earlier at Texel, in April, and by that before the main period of bivalve settlement. Predator arrival versus prey settlement timing was also compared between years within the Texel region (Fig. 4.5). Annual variation in seasonal timing was higher in crustaceans than in the bivalve species. Carcinus maenas generally arrived later. Fig. 4.4 Predator arrival versus bivalve settlement time in Boxes mark periods of steepest abundance increase before maximum abundance, at Sylt and at Texel. Mb: Macoma balthica, Ce: Cerastoderma edule, Ma: Mya arenaria, S: Sylt, T: Texel. White boxes: predator Crangon crangon, grey boxes: predator Carcinus maenas. 70

71 Phenology and predator-prey size ratios Fig. 4.5 Predator arrival versus bivalve settlement time at Texel. Boxes mark periods of steepest abundance increase before maximum abundance, for the years 1994 to 1998 and 2007, per bivalve species. White boxes: predator Crangon crangon, grey boxes: predator Carcinus maenas. 71
72 Chapter 4 Prey-predator body size relationships The reason that timing is thought to be so important is because it influences with what body sizes crustaceans and bivalves predator and prey encounter. Shrimp have to be about at least ten times bigger than M. balthica to be able to eat them (Beukema et al. 1998, Hiddink et al. 2002). We calculated body size ratios for all possible bivalve-shrimp encounters at a given time and place (Fig. 4.6 and 4.7). A grey bar indicates that a bivalve is a tenth or less of the predator length and thus vulnerable to predation. To consume the harder shelled and more globose Cerastoderma edule, shrimp probably have to be even more than ten times bigger, but as no experimental evidence is available, the same sizeratio as for M. balthica was used for illustration purposes. The distribution of size ratios of bivalves and their predators each month was comparable between Sylt and Texel in the observation year 2007 (Fig. 4.6). In April, nearly every encounter between a shrimp and a M. balthica could potentially have led to predation; the bivalves that were already present at that time were almost all in the predators size range. In May it became possible that a M. balthica was too big to be eaten by a predator it was encountered by. In June, at both islands M. balthica at the larger end of the size distribution were outgrowing the shrimp predators. In M. arenaria, quick growth made up for later arrival and resulted in similar susceptibility to predation as the early arriving M. balthica. C. edule under the same predator regime reached safe body sizes most rapidly by fast growth. The similarity of the cockle-to-shrimp size ratios between Texel and Sylt is remarkable, although they are the result of different absolute sizes. At Texel cockles had grown faster, but at Sylt small shrimp were more abundant (chapter 3). At Texel, between the study years 1994 to 1998 a variety of size ratio frequencies was found for the three bivalve species (Fig. 4.7). There was the case of continuously outgrowing the predators (e.g. M. balthica 1997), yet sometimes there was no apparent progress at all (e.g. C. edule 1995), or some of the individuals attained a safe body size while a vulnerable group remained (e.g. M. arenaria 1996). M. balthica showed some consistency among the seasons following mild winters (1994, 1995 and 1998, Fig. 4.2 and 4.7), whereas C. edule size ratios with shrimp were most variable and extreme between years. Furthermore, within a year, usually each species had unique size ratio distributions through their specific settlement and growth patterns under the same predator regime. A high frequency of large prey-predator size ratios did not only and not necessarily occur in connection with a delayed predator arrival (Fig. 4.8). 72

73 Phenology and predator-prey size ratios Fig. 4.6 Prey-predator sizeratio frequencies per month and bivalve species at Sylt and Texel in Grey bars stand for shrimp-bivalve encounters that can potentially lead to consumption of the bivalve. White bars stand for encounters with relatively larger bivalves that are safe from predation. The heights of the frequency distributions are not of informative value due to varying sample sizes and predator and prey numbers. 73

74 Chapter 4 74
75 Phenology and predator-prey size ratios Discussion Climatic effects on timing of annual reproduction of bivalves and the arrival of their crustacean predators are thought to affect bivalve recruitment Wadden Sea wide via an influence on size-dependent predation mortality (Beukema et al. 1996). We found indeed quite similar timing in bivalve settlement between distant regions but differing between years. Crustacean arrival showed more regional and annual variation in seasonal timing than bivalve settlement. There were strong differences in the resulting prey-predator size ratios between years, but a remarkable similarity between study regions. This fits together with spatially synchronized strong annual fluctuations in bivalve recruitment success (Strasser et al. 2003). A head start for bivalve settlers did not necessarily result in a beneficial size ratio with the predators (Fig. 4.8). We used the steepest abundance increase before the maximum abundance of juveniles to compare arrival times, but size distributions are also shaped by additional settlement, growth and selective mortality. During summer 1996, a year with late predator arrival that is known for good Macoma balthica recruitment in the rest of the southern Wadden Sea (Strasser et al. 2003), M. balthica remained in the predator s size range at Texel. Yet, a simulation study (chapter 2) did not support selective predation as the main determinant of M. balthica size structure and low abundance in that year at Texel. Unfortunately, no temporal size observations are available for successful sites. A local exception from population synchrony may be a hint to man-made disturbance (Beukema et al. 1996). Sensitivity to other meteorological conditions is discussed as a possible reason that M. balthica and Mya arenaria did not profit from the predator delay through the severe winter in the eastern part of the Wadden Sea (Strasser et al. 2003). A size ratio distribution that appeared truncated was also observed in 1997 in Cerastoderma edule at Texel (Fig. 4.7), and C. edule recruit sizes of 1997 were truncated in the Sylt region as well (Strasser et al. 2001). This is probably due to continuing larval settlement in combination with predation on growing individuals as soon as they reach a certain body size. The Fig. 4.7 Prey-predator size-ratio frequencies at Texel per month from 1994 to Grey bars stand for shrimp-bivalve encounters that can potentially lead to consumption of the bivalve. White bars stand for encounters with relatively larger bivalves that are safe from predation. The heights of the frequency distributions are not of informative value due to varying sample sizes and predator and prey numbers. Grey boxes mark years with recruitment higher than the average of the years 1988 to 2000 (Strasser et al. 2003). Macoma balthica had the last exceptionally good recruitment in
76 Chapter 4 very coarse sand at Sylt is a conceivable explanation for foraging above a detection threshold (Strasser et al. 2001), but as a similar pattern developed at Texel with finer sediment, it should be considered that the predators have energetic prey choice criteria. While the sampling frequencies were very high, the possibilities to make generalizations from this study are limited by the number of years and sites studied. Further, the sampling design was not the same everywhere all the time, but as long as the obtained individual numbers are high enough, they can be used to compare timing and sizes between years and regions. Only data from the middle intertidal were included in this study, which does not represent the entire intertidal populations, but the time course of bivalve abundances is similar to the time course from all tidal levels (comp. Fig. 4.A1 in the Appendix of this chapter with Strasser et al. 2001). Crustaceans were sampled at low tide, although with high tide bigger shrimp enter the tidal flats (Janssen and Kuipers 1980). Thus, the predation risk is probably even underestimated in this study. In spite of differing sampling designs, it is valuable that these data sets, that include the key year 1996 after the cold winter, have been brought together now. Processes that can synchronize recruitment over large spatial scales are undoubtedly so dominant that they will also have a major influence on temporal population changes. The results substantiate that similar processes take place in the two distant regions, just at different absolute sizes and moments in time. They also show that subtle changes can tip the scales. Strong differences in year class strength caused by changes in predation mortality through annual climate variations have been found also for example in flatfish, in this case through temperature induced differences in prey growth (Nakaya et al. 2007). In our system, comparing the size ratios with recruitment success (Strasser et al. 2003), an advantageous size ratio distribution seems to be a prerequisite but not a warranty for good bivalve recruitment (Fig. 4.7 and 4.8). The intent of the present study was to compare the conditions for predation related to body sizes. Future research needs to include individual numbers and feeding rates for a quantitative perspective on pre-recruit predation mortality. A phenomenon that has received little attention yet in this system is selection for prey above a minimum size. Experiments could establish the lower end of the predation window and its behavioral basis. Staying small through extended or late spawning or slow growth, until the predation risk decreases towards the end of the year, could be an alternative life history strategy. 76

77 Phenology and predator-prey size ratios Fig. 4.8 Link between relative timing, prey-predator size ratios over the season, and final recruitment, at Texel in 1994 to For the relative timing, the periods of steepest increase of juveniles before the maximum abundance observed are compared. In an encounter with a shrimp, bivalves are considered safe from predation if they are larger than a tenth of the predator size. Grey boxes mark years with final recruitment above the average of the years 1988 to 2000 (Strasser et al. 2003). Macoma balthica had the last exceptionally good recruitment in
78 Chapter 4 Acknowledgements This research was funded by the Netherlands Organization for Scientific Research (NWO) and Netherlands-Bremen Oceanography II (NEBROC). We thank Raffaella Bouwe for help with sample processing in the lab. References Beukema, J.J., Annual variation in reproductive success and biomass of the major macrozoobenthic species living in a tidal flat area of the Wadden Sea. Netherlands Journal of Sea Research 16, Beukema, J.J., The abundance of shore crabs Carcinus maenas (L) on a tidal flat in the Wadden Sea after cold and mild winters. Journal of Experimental Marine Biology and Ecology 153, Beukema, J.J., Dynamics of juvenile shrimp Crangon crangon in a tidal-flat nursery of the Wadden Sea after mild and cold winters. Marine Ecology- Progress Series 83, Beukema, J.J., Dekker, R., Essink, K., Michaelis, H., Synchronized reproductive success of the main bivalve species in the Wadden Sea: causes and consequences. Marine Ecology-Progress Series 211, Beukema, J.J., Essink, K., Michaelis, H., The geographic scale of synchronized fluctuation patterns in zoobenthos populations as a key to underlying factors: Climatic or man-induced. ICES Journal of Marine Science 53, Beukema, J.J., Honkoop, P.J.C., Dekker, R., Recruitment in Macoma balthica after mild and cold winters and its possible control by egg production and shrimp predation. Hydrobiologia 376, Hiddink, J.G., The adaptive value of migrations for the bivalve Macoma balthica. Ph.D. thesis, University of Groningen. Hiddink, J.G., Marijnissen, S.A.E., Troost, K., Wolff, W.J., Predation on 0-group and older year classes of the bivalve Macoma balthica: interaction of size selection and intertidal distribution of epibenthic predators. Journal of Experimental Marine Biology and Ecology 269, Honkoop, P.J.C., Bivalve reproduction in the Wadden Sea: effects of winter conditions on reproductive effort and recruitment. Ph.D. thesis, University of Groningen. Honkoop, P.J.C., van der Meer, J., Beukema, J.J., Kwast, D., Does temperatureinfluenced egg production predict the recruitment in the bivalve Macoma balthica? Marine Ecology-Progress Series 164, Hudson, P.J., Cattadori, I.M., The Moran effect: a cause of population synchrony. Trends in Ecology & Evolution 14, 1-2. Janssen, G.M., Kuipers, B.R., On tidal migration in the shrimp Crangon crangon. Netherlands Journal of Sea Research 14, Nakaya, M., Takatsu, T., Joh, M., Nakagami, M., Takahashi, T., Annual variation of potential predation impacts on larval and juvenile marbled sole Pseudopleuronectes yokohamae by sand shrimp Crangon uritai in Hakodate Bay, Hokkaido. Fisheries Science 73,
79 Phenology and predator-prey size ratios Strasser, M., Recruitment patterns of selected Wadden Sea fauna after winters of differing severity. Berichte zur Polar- und Meeresforschung Strasser, M., Reduced epibenthic predation on intertidal bivalves after a severe winter in the European Wadden Sea. Marine Ecology-Progress Series 241, Strasser, M., Dekker, R., Essink, K., Günther, C.P., Jaklin, S., Kröncke, I., Madsen, P.B., Michaelis, H., Vedel, G., How predictable is high bivalve recruitment in the Wadden Sea after a severe winter? Journal of Sea Research 49, Strasser, M., Günther, C.P., Larval supply of predator and prey: temporal mismatch between crabs and bivalves after a severe winter in the Wadden Sea. Journal of Sea Research 46, Strasser, M., Hertlein, A., Reise, K., Differential recruitment of bivalve species in the northern Wadden Sea after the severe winter of 1995/96 and of subsequent milder winters. Helgoland Marine Research 55, van Aken, H.M., Variability of the water temperature in the western Wadden Sea on tidal to centennial time scales. Journal of Sea Research 60, van der Meer, J., Beukema, J.J., Dekker, R., Long-term variability in secondary production of an intertidal bivalve population is primarily a matter of recruitment variability. Journal of Animal Ecology 70, Yang, L.H., Rudolf, V.H.W., Phenology, ontogeny and the effects of climate change on the timing of species interactions. Ecology Letters 13,

80 Chapter 4 Appendix 80
ESSAYS ON MONTE CARLO METHODS FOR STATE SPACE MODELS
 VRIJE UNIVERSITEIT ESSAYS ON MONTE CARLO METHODS FOR STATE SPACE MODELS ACADEMISCH PROEFSCHRIFT ter verkrijging van de graad Doctor aan de Vrije Universiteit Amsterdam, op gezag van de rector magnificus
Several aspects of the natural history of the rocky intertidal barnacle can explain
 Chapter 1 General introduction Several aspects of the natural history of the rocky intertidal barnacle can explain why it has long been exploited as an example of marine animal recruitment. The adult barnacle
POPULATION DYNAMICS. Zoo 511 Ecology of Fishes
 POPULATION DYNAMICS Zoo 511 Ecology of Fishes Today s goals Understand why and how population dynamics are important in fisheries ecology Gain experience in a variety of mark-recapture methods What are
8.3.18 Advice May 2014
 8.3.18 Advice May 2014 ECOREGION STOCK Baltic Sea Sprat in Subdivisions 22 32 (Baltic Sea) Advice for 2015 ICES advises on the basis of the MSY approach that catches in 2015 should be no more than 222
9.3.7 Advice December 2014
 9.3.7 Advice December 2014 ECOREGION STOCK Widely distributed and migratory stocks European eel Advice for 2015 The status of eel remains critical and ICES advises that all anthropogenic mortality (e.g.
BIOE 370 1. Lotka-Volterra Model L-V model with density-dependent prey population growth
 BIOE 370 1 Populus Simulations of Predator-Prey Population Dynamics. Lotka-Volterra Model L-V model with density-dependent prey population growth Theta-Logistic Model Effects on dynamics of different functional
3.13.5.b Gear selectivity in the directed cod fishery (BACOMA project)
") 3.13.5.b Gear selectivity in the directed cod fishery (BACOMA project) IBSFC has asked ICES to: i) evaluate the potential improvement in the gear selectivity in the directed cod fisheries as concluded
3.13.5.b Gear selectivity in the directed cod fishery (BACOMA project) IBSFC has asked ICES to: i) evaluate the potential improvement in the gear selectivity in the directed cod fisheries as concluded
Understanding Crowd Behaviour Simulating Situated Individuals
 Understanding Crowd Behaviour Simulating Situated Individuals Nanda Wijermans The research reported in this thesis was funded by the Netherlands Ministry of Defence ("DO-AIO" fund contract no TM-12). The
Clam Aquaculture. Josh Reitsma Cape Cod Cooperative Extension and Woods Hole Sea Grant
 Clam Aquaculture Josh Reitsma Cape Cod Cooperative Extension and Woods Hole Sea Grant What are clams? Bivalve molluscs which live within the substrate of a waterbody infaunal animals many species Lifecycle
RECALLING Paragraph b of Article 13 of the Convention on the Protection of the Marine Environment of the Baltic Sea Area, 1974 (Helsinki Convention),
,") CONVENTION ON THE PROTECTION OF THE MARINE ENVIRONMENT OF THE BALTIC SEA AREA HELSINKI COMMISSION - Baltic Marine HELCOM 19/98 Environment Protection Commission 15/1 Annex 3 19th Meeting Helsinki, 23-27
CONVENTION ON THE PROTECTION OF THE MARINE ENVIRONMENT OF THE BALTIC SEA AREA HELSINKI COMMISSION - Baltic Marine HELCOM 19/98 Environment Protection Commission 15/1 Annex 3 19th Meeting Helsinki, 23-27
6.3.27 (update) Advice November 2014
 Advice November 2014") 6.3.27 (update) Advice November 2014 ECOREGION STOCK North Sea Sole in Subarea IV (North Sea) (updated) Please note: The present advice replaces the advice given for this stock in June 2014. Advice for
6.3.27 (update) Advice November 2014 ECOREGION STOCK North Sea Sole in Subarea IV (North Sea) (updated) Please note: The present advice replaces the advice given for this stock in June 2014. Advice for
Growth and Reproduction in Bivalves. An energy budget approach
 Growth and Reproduction in Bivalves An energy budget approach The research reported in this thesis was carried out at the Department of Marine Ecology and Evolution (MEE) of the Royal Netherlands Institute
ECONOMIC INJURY LEVEL (EIL) AND ECONOMIC THRESHOLD (ET) CONCEPTS IN PEST MANAGEMENT. David G. Riley University of Georgia Tifton, Georgia, USA
 AND ECONOMIC THRESHOLD (ET) CONCEPTS IN PEST MANAGEMENT. David G. Riley University of Georgia Tifton, Georgia, USA") ECONOMIC INJURY LEVEL (EIL) AND ECONOMIC THRESHOLD (ET) CONCEPTS IN PEST MANAGEMENT David G. Riley University of Georgia Tifton, Georgia, USA One of the fundamental concepts of integrated pest management
ECONOMIC INJURY LEVEL (EIL) AND ECONOMIC THRESHOLD (ET) CONCEPTS IN PEST MANAGEMENT David G. Riley University of Georgia Tifton, Georgia, USA One of the fundamental concepts of integrated pest management
Natural selection by pulsed predation: survival of the thickest
 Ecology, 96(7), 2015, pp. 1943 1956 Ó 2015 by the Ecological Society of America Natural selection by pulsed predation: survival of the thickest ALLERT I. BIJLEVELD, 1,4 SO NKE TWIETMEYER, 1,2 JULIA PIECHOCKI,
Introduction to Natural Resource Damage Assessment
 Introduction to Natural Resource Damage Assessment Topics Overview Legal: Laws and Regulations NRDA Process Scaling Injuries and Restoration Restoration in the Arctic Summary 2 1 Top Three Things to Know
REVIEW UNIT 10: ECOLOGY SAMPLE QUESTIONS
 Period Date REVIEW UNIT 10: ECOLOGY SAMPLE QUESTIONS A. Sample Multiple Choice Questions Complete the multiple choice questions to review this unit. 1. All of the following are density-dependent factors
Lesson 3: Fish Life Cycle
 Lesson 3: Fish Life Cycle Activity: Diagram fish life cycle. Grade level: 4-8 Subjects: Science, social studies Setting: Classroom Duration: 50 minutes Key Terms: Fry, life cycle, life history, spawn,
Introduction to protection goals, ecosystem services and roles of risk management and risk assessment. Lorraine Maltby
 Introduction to protection goals, ecosystem services and roles of risk management and risk assessment. Lorraine Maltby Problem formulation Risk assessment Risk management Robust and efficient environmental
From a host to the other: the critical role of the short cercariae stage
 Programmes : PNEC TAIPAMOR, Carlsberg Fundation From a to the other: the critical role of the short cercariae stage de MONTAUDOUIN 1 X., DESCLAUX 1 C., JENSEN 2 K.T. 1 Laboratoire d'océanographie Biologique,
Ecological Roulette: The Global Transport of Nonindigenous Marine Organisms
 Ecological Roulette: The Global Transport of Nonindigenous Marine Organisms James T. Carlton 1 and Jonathan B. Geller 2 1 Maritime Studies Program, Williams College, Mystic Seaport, Mystic, CT 06355, and
Evolution (18%) 11 Items Sample Test Prep Questions
 11 Items Sample Test Prep Questions") Evolution (18%) 11 Items Sample Test Prep Questions Grade 7 (Evolution) 3.a Students know both genetic variation and environmental factors are causes of evolution and diversity of organisms. (pg. 109 Science
Evolution (18%) 11 Items Sample Test Prep Questions Grade 7 (Evolution) 3.a Students know both genetic variation and environmental factors are causes of evolution and diversity of organisms. (pg. 109 Science
SYNOPTIC INTERTIDAL BENTHIC SURVEY ACROSS THE DUTCH WADDEN SE
 SYNOPTIC INTERT TIDAL BENTHIC SURVEY ACROSSS THE DUTCH WADDEN SEA Report on data collected from 2008 to 2010 www.nioz.nl SYNOPTIC INTERT TIDAL BENTHIC SURVEY ACROSSS THE DUTCH WADDEN SEA Report on data
A Functional Classification System for Marine Protected Areas in the United States
 A Functional Classification System for Marine Protected Areas in the United States The U.S. Classification System: An Objective Approach for Understanding the Purpose and Effects of MPAs as an Ecosystem
Responsible stock enhancement, restocking and sea ranching: rational and terminology
 Responsible stock enhancement, restocking and sea ranching: rational and terminology Devin M. Bartley FAO Rome Ecosystem-based Stock Enhancement Workshop: development of a road map to evaluate the potential
Opening the psychological black box in genetic counseling
 Opening the psychological black box in genetic counseling A counselee-oriented, integrative approach on the impact of DNA-testing for breast and ovarian cancer on the lives of counselees Joël Vos 1 2 Opening
GREAT BARRIER REEF. Climate Change Action Plan
 GREAT BARRIER REEF Climate Change Action Plan 2007 2011 Climate change is now recognised as the greatest long-term threat to the Great Barrier Reef. The Great Barrier Reef is internationally renowned as
Implementations of tests on the exogeneity of selected. variables and their Performance in practice ACADEMISCH PROEFSCHRIFT
 Implementations of tests on the exogeneity of selected variables and their Performance in practice ACADEMISCH PROEFSCHRIFT ter verkrijging van de graad van doctor aan de Universiteit van Amsterdam op gezag
Behavioral Corporate Governance: Four Empirical Studies. Gerwin van der Laan
 Behavioral Corporate Governance: Four Empirical Studies Gerwin van der Laan RIJKSUNIVERSITEIT GRONINGEN BEHAVIORAL CORPORATE GOVERNACE: Four Empirical Studies Proefschrift ter verkrijging van het doctoraat
Style Characterization of Machine Printed Texts
 Style Characterization of Machine Printed Texts Andrew D. Bagdanov This book is typeset by the author using L A TEX2 ε. The main body of the text is set using the Computer Modern family of fonts. The images
Composite performance measures in the public sector Rowena Jacobs, Maria Goddard and Peter C. Smith
 Policy Discussion Briefing January 27 Composite performance measures in the public sector Rowena Jacobs, Maria Goddard and Peter C. Smith Introduction It is rare to open a newspaper or read a government
VECTORS of change in the Dutch southwestern Delta Waters: the occurrence of invading, nonindigenous
 Royal Netherlands Institute for Sea Research VECTORS of change in the Dutch southwestern Delta Waters: the occurrence of invading, nonindigenous and outbreak forming species Pim van Avesaath, Sander Wijnhoven,
RECOVERY POTENTIAL ASSESSMENT FOR THE LAURENTIAN SOUTH DESIGNATABLE UNIT OF ATLANTIC COD (GADUS MORHUA)
") Canadian Science Advisory Secretariat Science Advisory Report 211/28 RECOVERY POTENTIAL ASSESSMENT FOR THE LAURENTIAN SOUTH DESIGNATABLE UNIT OF ATLANTIC COD (GADUS MORHUA) 68 66 64 62 6 58 5 5 49 49 48
Canadian Science Advisory Secretariat Science Advisory Report 211/28 RECOVERY POTENTIAL ASSESSMENT FOR THE LAURENTIAN SOUTH DESIGNATABLE UNIT OF ATLANTIC COD (GADUS MORHUA) 68 66 64 62 6 58 5 5 49 49 48
Hake Benchmark Assessment Meeting Schedule
 Hake Benchmark Assessment Meeting Schedule Meeting Date Location Data I Aug. 23 Aquarium Conference Room Ecosystem Consumption (1) 9:00 AM 166 Water St. Data II Sep. 7 10 am 5:30 pm Sep. 8-10 9 am 5:30
STUDENT VERSION INSECT COLONY SURVIVAL OPTIMIZATION
 STUDENT VERSION INSECT COLONY SURVIVAL OPTIMIZATION STATEMENT We model insect colony propagation or survival from nature using differential equations. We ask you to analyze and report on what is going
Vulnerability Assessment of New England Streams: Developing a Monitoring Network to Detect Climate Change Effects
 Vulnerability Assessment of New England Streams: Developing a Monitoring Network to Detect Climate Change Effects National Water Quality Monitoring Council 2012 Meeting Britta Bierwagen, National Center
The Economics of Ecosystem Based Management: The Fishery Case
 The Economics of Ecosystem Based Management: The Fishery Case Fisheries impact on marine ecosystem and policy implications Peder Andersen Co-authors: Lars Ravensbeck Hans S. Frost Department of Food and
Research Advice on the Proposed Shark Mitigation Strategy using drum lines for January to April 2014. Research Division - January 2014
 Research Advice on the Proposed Shark Mitigation Strategy using drum lines for January to April 2014 File No 2475/13 Background Research Division - January 2014 In direct response to the unprecedented
Economics of Insurance against Climate Change. W.J. Wouter Botzen
 Economics of Insurance against Climate Change W.J. Wouter Botzen Promotor: prof. dr. J.C.J.M. van den Bergh Thesis committee: prof. dr. J.C.J.H. Aerts prof. dr. H. Kunreuther prof. dr. P. Rietveld prof.
MEPC 56/23 ANNEX 2 Page 1 ANNEX 2 RESOLUTION MEPC.162(56) Adopted on 13 July 2007
 Adopted on 13 July 2007") Page 1 RESOLUTION MEPC.162(56) Adopted on 13 July 2007 GUIDELINES FOR RISK ASSESSMENT UNDER REGULATION A-4 OF THE BWM CONVENTION (G7) THE MARINE ENVIRONMENT PROTECTION COMMITTEE, RECALLING Article 38(a)
Page 1 RESOLUTION MEPC.162(56) Adopted on 13 July 2007 GUIDELINES FOR RISK ASSESSMENT UNDER REGULATION A-4 OF THE BWM CONVENTION (G7) THE MARINE ENVIRONMENT PROTECTION COMMITTEE, RECALLING Article 38(a)
Update of a projection software to represent a stock-recruitment relationship using flexible assumptions
 Update of a projection software to represent a stock-recruitment relationship using flexible assumptions Tetsuya Akita, Isana Tsuruoka, and Hiromu Fukuda National Research Institute of Far Seas Fisheries
Appendix B: Cost Estimates
 Appendix B: Estimates This appendix presents the estimated costs of the monitoring and supplemental research components presented in Section 3 of this document. A 20% quality assurance and quality control
Graphical tasks to aid in diagnosing and monitoring Parkinson s disease
 Graphical tasks to aid in diagnosing and monitoring Parkinson s disease Esther J. Smits The studies described in this thesis were part of the DiPAR project for which funding was received from the EC in
AP Biology Unit I: Ecological Interactions
 AP Biology Unit I: Ecological Interactions Essential knowledge 1.C.1: Speciation and extinction have occurred throughout the Earth s history. Species extinction rates are rapid at times of ecological stress.
How To Determine The Effects Of Hurricane Ivon On Seagrass Meadows In Alabama
 Post Hurricane Ivan Damage Assessment of Seagrass Resources of Coastal Alabama Table of Contents: K.L. Heck, Jr. and D. Byron Dauphin Island Sea Lab 101 Bienville Boulevard Dauphin Island, AL 36528 (251/861-2141;
Restoration of mussel beds in the Wadden Sea
 Restoration of mussel beds in the Wadden Sea Johan van de Koppel A concern for Waddensea management! Area of semi-permanent mussel beds is limited! Habitat and food reserve for many species! Most marked
Why participation works
 Why participation works Full title Why participation works: the role of employee involvement in the implementation of the customer relationship management type of organizational change. Key words Participation,
Shellfish Dredging Pushes a Flexible Avian Top Predator out of a Marine Protected Area
 Shellfish Dredging Pushes a Flexible Avian Top Predator out of a Marine Protected Area Jan A. van Gils 1,2*, Theunis Piersma 1,2, Anne Dekinga 1, Bernard Spaans 1, Casper Kraan 1 PLoS BIOLOGY 1 Department
The Effect of a Changing Climate on Trophic Interactions
 The Effect of a Changing Climate on Trophic Interactions 1 A Brief Overview impacts of climate change components of an ecosystem food webs and trophic levels changes in phenology range shifts ecosystem
Therefore, this is a very important question, which encourages consideration of the current management of the resource.
 Aalisarnermut, Piniarnermut Nunalerinermullu Naalakkersuisoqarfik Department of Fisheries, Hunting and Agriculture Finn's speech to NAFMC Climate change in the North Atlantic has become a reality which
SEMESTER AT SEA COURSE SYLLABUS University of Virginia, Academic Sponsor
 Voyage: Fall 2015 Discipline: Biology Course Title: Introduction to Marine Biology Division: Lower Division Faculty Name: Dr Christine Dudgeon Credit Hours: 3; Contact Hours: 38 Pre-requisites: SEMESTER
Introduction to Natural Resource Damage Assessment NRDA
 Introduction to Natural Resource Damage Assessment NRDA Topics Overview Legal: Laws and Regulations NRDA Process Restoration in the Arctic Summary 2 Top Three Things to Know Three liabilities from oil
Environmental Compliance Questionnaire for National Oceanic and Atmospheric Administration Federal Financial Assistance Applicants
 OMB Approval No.: 0648-0538 Environmental Compliance Questionnaire for National Oceanic and Atmospheric Administration Federal Financial Assistance Applicants Instructions The National Environmental Policy
Efficient Food Requirements of the Whooping Cranes
 Evaluation of factors affecting food abundance and time-activity budgets of whooping cranes at Aransas National Wildlife Refuge R. Douglas Slack, William E. Grant, Todd M. Swannack, and Jeffery R. Wozniak
Enhancing the wellbeing of older people in Mauritius
 Enhancing the wellbeing of older people in Mauritius Proefschrift ter verkrijging van de graad van doctor aan Tilburg University op gezag van de rector magnificus, prof. dr. Ph. Eijlander, in het openbaar
STUDY PERFORMANCE REPORT
 STUDY PERFORMANCE REPORT State: Michigan Study No.: 468 Project No.: F-80-R-1 Title: Natural reproduction by walleye in Saginaw Bay Period Covered: October 1, 1999 to September 30, 2000 Study Objective:
"49 39' 49 38.7' E 49 39.0' E 37 46.7' S 37 47.1' S.
 Appendix Template for Submission of Scientific Information to Describe Ecologically or Biologically Significant Marine Areas Note: Please DO NOT embed tables, graphs, figures, photos, or other artwork
Practice Questions 1: Evolution
 Practice Questions 1: Evolution 1. Which concept is best illustrated in the flowchart below? A. natural selection B. genetic manipulation C. dynamic equilibrium D. material cycles 2. The diagram below
MPA NETWORKS MODULE 2 2.1 INTRODUCTION TO MPA NETWORKS. Advantages of Networks 2.2 TYPES OF MPA NETWORKS. Social Networks. Ecological Networks
 2.1 INTRODUCTION TO MPA NETWORKS Advantages of Networks 2.2 TYPES OF MPA NETWORKS Social Networks Ecological Networks Management-based Networks Case Study: A Regional Approach to MPA Development in West
EFFECTS OF TEMPERATURE ON THE DEVELOPMENT OF THE WOOD FROG, RANA SYLVATICA
 20 Journal of Ecological Research, 6, 20-24 (2004) EFFECTS OF TEMPERATURE ON THE DEVELOPMENT OF THE WOOD FROG, RANA SYLVATICA Jessica Darrow, Andrea Nulton and Danielle Pompili ABSTRACT Eggs of the wood
Establishing large-scale trans-boundaries MPA networks: the OSPAR example in North-East Atlantic
 Establishing large-scale trans-boundaries MPA networks: the OSPAR example in North-East Atlantic Introduction A pledge to establish a representative network of marine and coastal protected areas by 2012
Gray Whales on the Move
 Gray Whales on the Move Students trace the migration route of a gray whale and discover the gray whale s natural history. Subjects Science GRADE LEVEL Grades 6 8 TIME 60 minutes OBJECTIVES Students will
A Hands-On Exercise To Demonstrate Evolution
 HOW-TO-DO-IT A Hands-On Exercise To Demonstrate Evolution by Natural Selection & Genetic Drift H ELEN J. YOUNG T RUMAN P. Y OUNG Although students learn (i.e., hear about) the components of evolution by
Biodiversity and Ecosystem Services: Arguments for our Future Environment
 Biodiversity and Ecosystem Services: Arguments for our Future Environment How have we advanced our understanding of the links between biodiversity, ecosystem functions and ecosystem services? The issue
U.S. Environmental Protection Agency, Region IX Response to Comments on the Goleta Sanitary District Draft NPDES Permit and 301(h) TDD
 TDD") U.S. Environmental Protection Agency, Region IX Response to Comments on the Goleta Sanitary District Draft NPDES Permit and 301(h) TDD A. Kamil S. Azoury of Goleta Sanitary District provided comments on
U.S. Environmental Protection Agency, Region IX Response to Comments on the Goleta Sanitary District Draft NPDES Permit and 301(h) TDD A. Kamil S. Azoury of Goleta Sanitary District provided comments on
IEAGHG Information Paper 2015-10; The Earth s Getting Hotter and So Does the Scientific Debate
 IEAGHG Information Paper 2015-10; The Earth s Getting Hotter and So Does the Scientific Debate A recent study published in Nature Climate Change 1 suggests that the rate of climate change we're experiencing
Columbia River Project Water Use Plan. Monitoring Program Terms of Reference LOWER COLUMBIA RIVER FISH MANAGEMENT PLAN
 Columbia River Project Water Use Plan LOWER COLUMBIA RIVER FISH MANAGEMENT PLAN CLBMON-45 Lower Columbia River Fish Indexing Surveys 31 August 2007 1.0 OVERVIEW LOWER COLUMBIA RIVER FISH MANAGEMENT PLAN
NORTH PACIFIC RESEARCH BOARD SEMIANNUAL PROGRESS REPORT
 1. PROJECT INFORMATION NPRB Project Number: 1303 Title: Assessing benthic meiofaunal community structure in the Alaskan Arctic: A high-throughput DNA sequencing approach Subaward period July 1, 2013 Jun
Marine Pest Inspection of HMAS Canberra. Inspection 2. March 2010
 Marine Pest Inspection of HMAS Canberra Inspection 2 March 2010 Interim report March 2010 Marine Pest Inspection of HMAS Canberra. Inspection 2, March 2010 2 Report to: Mr Lachlan Jackson Ranger Team Leader
Measuring The Costs Of Chapter 11 Cases
 Measuring The Costs Of Chapter 11 Cases Professional Fees in American Corporate Bankruptcy Cases Proefschrift ter verkrijging van het doctoraat in de Rechtsgeleerdheid aan de Rijksuniversiteit Groningen
Position Statement regarding Offshore Wind Proposals on Lake Huron. Lake Huron Centre for Coastal Conservation
 Position Statement regarding Offshore Wind Proposals on Lake Huron Lake Huron Centre for Coastal Conservation June 2010 Lake Huron Centre for Coastal Conservation (LHCCC) Corporate Position related to:
Hydroacoustic surveys of Otsego Lake, 2007
 Hydroacoustic surveys of Otsego Lake, 2007 Thomas E. Brooking 1 and Mark D. Cornwell 2 INTRODUCTION In 2007, we sampled Otsego Lake (Otsego County, NY) with acoustics to estimate abundance of pelagic fishes
A. GULF OF MAINE HADDOCK ASSESSMENT SUMMARY FOR 2014
 A. GULF OF MAINE HADDOCK ASSESSMENT SUMMARY FOR 2014 State of Stock: The Gulf of Maine haddock (Melanogrammus aeglefinus) stock is not overfished and overfishing is not occurring in 2013 (Figure A1). Spawning
AP ENVIRONMENTAL SCIENCE 2010 SCORING GUIDELINES
 AP ENVIRONMENTAL SCIENCE 2010 SCORING GUIDELINES Question 3 (a) Why are zebra mussels located primarily in areas in the eastern United States rather than in the western United States? One point can be
EXPERIMENTAL ERROR AND DATA ANALYSIS
 EXPERIMENTAL ERROR AND DATA ANALYSIS 1. INTRODUCTION: Laboratory experiments involve taking measurements of physical quantities. No measurement of any physical quantity is ever perfectly accurate, except
Will climate changedisturbance. interactions perturb northern Rocky Mountain ecosystems past the point of no return?
 Photo: Craig Allen, USGS Will climate changedisturbance interactions perturb northern Rocky Mountain ecosystems past the point of no return? Rachel Loehman Research Landscape Ecologist USGS Alaska Science
Ecology - scientific study of how individuals interact with their environment 34.1
 Biology 1407 Exam 4 Notes - Ecology Ch.35-36 Ecology - scientific study of how individuals interact with their environment 34.1 - organisms have adapted to - evolved in - a particular set of conditions;
Preparing for Success: Waterfowl Habitat Management Annual Planning by Houston Havens
 Preparing for Success: Waterfowl Habitat Management Annual Planning by Houston Havens While working with private landowners and wetland managers over the past several years, I ve noticed a common theme
Assessing the Value of Flexibility in the Dutch Office Sector using Real Option Analysis
 Assessing the Value of Flexibility in the Dutch Office Sector using Real Option Analysis Joost P. Poort, Jun Hoo Abstract Flexibility is one of the key aspects of the Zuidas project, a major construction
FORESTED VEGETATION. forests by restoring forests at lower. Prevent invasive plants from establishing after disturbances
 FORESTED VEGETATION Type of strategy Protect General cold adaptation upland and approach subalpine forests by restoring forests at lower Specific adaptation action Thin dry forests to densities low enough
Southern IFCA Volunteer Internships 2016
 Volunteer Internships 2016 The (IFCA) are tasked with the sustainable management of inshore sea fisheries resources in the Dorset, Hampshire and Isle of Wight areas. Southern IFCA is offering an exciting
High Performance Human Resource Management in Ireland and the Netherlands: Adoption and Effectiveness
 High Performance Human Resource Management in Ireland and the Netherlands: Adoption and Effectiveness RIJKSUNIVERSITEIT GRONINGEN High Performance Human Resource Management in Ireland and the Netherlands:
BUCK LAKE WALLEYE MANAGEMENT. Fisheries Management Update - Prairies Area July 2011
 BUCK LAKE WALLEYE MANAGEMENT Fisheries Management Update - Prairies Area July 2011 Background Buck Lake has native fish populations of Walleye, Lake Whitefish, Northern Pike, Yellow Perch, Burbot, White
4-H Marine Biology and Oceanography Proficiency Program A Member s Guide
 4-H Marine Biology and Oceanography Proficiency Program A Member s Guide OVERVIEW The 4 H Marine Biology and Oceanography Proficiency program helps you learn what you need to know about your 4 H project.
M.A.Lips. Copyright 2014, M.A.Lips, Amsterdam, the Netherlands
 Roux-en-Y Gastric Bypass and Calorie Restriction: Differences and Similarities of Endocrine and Metabolic Effects in Obesity and Type 2 Diabetes Mellitus Mirjam Anne Lips Roux-en-Y Gastric Bypass and Calorie
Small artery tone under control of the endothelium
 Small artery tone under control of the endothelium On the importance of EDHF and myogenic tone in organ (dys)function Simone K. Gschwend Publication of this thesis was supported by generous contributions
Industry Environment and Concepts for Forecasting 1
 Table of Contents Industry Environment and Concepts for Forecasting 1 Forecasting Methods Overview...2 Multilevel Forecasting...3 Demand Forecasting...4 Integrating Information...5 Simplifying the Forecast...6
Maintenance of Diversity
 Maintenance of Diversity 1. Succession 2. Loss of Diversity 3. General Mechanisms that Maintain Diversity 4. Specific Mechanisms that Maintain Diversity Maintenance of species diversity 1. Ecological succession
Policy & Management Applications of Blue Carbon. fact SHEET
 Policy & Management Applications of Blue Carbon fact SHEET Policy & Management Applications of Blue Carbon Coastal Blue Carbon - An Important Wetland Ecosystem Service Coastal Blue Carbon refers to the
Changes in Pilot Control Behaviour across Stewart Platform Motion Systems
 Changes in Pilot Control Behaviour across Stewart Platform Motion Systems PROEFSCHRIFT ter verkrijging van de graad van doctor aan de Technische Universiteit Delft, op gezag van de Rector Magnificus prof.
Fisheries Management: Arctic principles
 Fisheries Management: Arctic principles Spatial issues in the Arctic Marine Resource Management Stockholm 4-6 September 2014 Niels Vestergaard Department of Environmental and Business Economics Centre
MODELLING THE SPATIAL AND TEMPORAL STRUCTURE OF SURVIVORSHIP TO SETTLEMENT IN NORTH SEA AND WEST OF SCOTLAND HADDOCK. M. Heath 1 and A.
 Not to be cited without prior reference to the authors International Council for the Exploration of the Sea CM 2000/N:11 Paper Spatial and Temporal Patterns in Recruitment Processes MODELLING THE SPATIAL
Great Crested Newt Habitat Suitability Index
 Great Crested Newt Habitat Suitability Index Background The Habitat Suitability Index (H) for the great crested newt was developed by Oldham et al. (2000). H scoring systems were originally developed by
Kakapo Recovery Plan 1996-2005
 Kakapo Recovery Plan 1996-2005 Threatened Species Recovery Plan No.21 Kakapo Management Group Department of Conservation P.O. Box 10-420 Wellington New Zealand CONTENTS 1. Background 5 2. Distribution
Using Probabilistic MCB Analysis to Determine Uncertainty in a Stock Assessment
 Using the probabilistic MCB runs to set management parameters and determine stock status The existence of uncertainty is a well-accepted and thoroughly documented part of the stock assessment process in
BMP Guidelines. Environmental Impact Assessment (EIA) report for activities related to hydrocarbon exploration and exploitation offshore Greenland
 report for activities related to hydrocarbon exploration and exploitation offshore Greenland") BMP Guidelines for preparing an Environmental Impact Assessment (EIA) report for activities related to hydrocarbon exploration and exploitation offshore Greenland Danish National Environmental Research
BMP Guidelines for preparing an Environmental Impact Assessment (EIA) report for activities related to hydrocarbon exploration and exploitation offshore Greenland Danish National Environmental Research
Energy Flow in a Tidal Flat Ecosystem
 Vol. 5: 215-221, 1981 MARINE ECOLOGY - PROGRESS SERIES Mar. Ecol. Prog. Ser. Published May 31 REVIEW Energy Flow in a Tidal Flat Ecosystem B. R. Kuipers, P. A. W. J. de Wilde and F. Creutzberg Netherlands
Aquatic Biomes, Continued
 Aquatic Biomes, Continued Introduction Extent of Marine biomes Issues & challenges Factors influencing distribution Dynamics in time & space Depth Tour of marine biomes Issues (by biome) Freshwater biomes
Logistic Paradigm. Logistic Paradigm. Paradigms. How should we consider them?
 Harvesting Paradigms Sustained Yield Harvesting Paradigms Net-Annual Increment Paradigm The Myth of MSY How should we consider them? The logistic paradigm obviously arises from logistic model. Says that
Parasite spill-over, spill-back and dilution effects of invasive oysters
 Royal Netherlands Institute for Sea Research Parasite spill-over, spill-back and dilution effects of invasive oysters M. Anouk Goedknegt R.W. Nauta, A. Schuster, M. Markovic, S.L. Bedolfe, D. Shoesmith,
RIJKSUNIVERSITEIT GRONINGEN BOTTOM-UP REHABILITATION IN SCHIZOPHRENIA
 RIJKSUNIVERSITEIT GRONINGEN BOTTOM-UP REHABILITATION IN SCHIZOPHRENIA Proefschrift ter verkrijging van het doctoraat in de Geneeskunde aan de Rijksuniversiteit Groningen op gezag van de Rector Magnificus