Computational Diagnostics: A Novel Approach to Viewing Medical Data
|
|
|
- Rosalyn Harrison
- 8 years ago
- Views:
Transcription
1 July 2 nd, th International Conference on Coordinated & Multiple Views in Exploratory Visualization Computational Diagnostics: A Novel Approach to Viewing Medical Data Dr. Ketan K. Mane Los Alamos National Laboratory, Los Alamos, New Mexico kmane@lanl.gov Dr. Katy Börner School of Library and Information Science, Indiana University, Bloomington katy@indiana.edu Presented by: Bruce Herr Outline Motivation Dataset Acute Lymphoblastic Leukemia Computational Diagnostic Tool Conclusion 1

2 Motivation Electronic Health Record (EHR) Initiative digitally store patient medical records Challenge 1) Combine data from different sources 2) Make sense of data for analysis 3) Acquire implicit knowledge Existing EHR include - Reproduce electronic view of a paper record for data entry Display patient medical history in graphical time-series format Add 2D/3D images to patient profile, link images for interaction LifeLines showing time-series information 2D / 3D linked images Computational Diagnostics - Dataset Details Diagnostic data variables from medical records for Acute Lymphoblastic Leukemia (ALL) patients are categorized into: a. Outcome Patient Variables: relapse, relapse site, alive/death status, and LDKA b. Biology Patient Variables: immunophenotype, genetic condition, WBC, Hgb, platelets, and CNS c. Host Patient Variables: diagnostic age (agedx), gender, and race d. Treatment Patient Variables: BM 7 and BM 14 e. Social Factors Patient Variables: MFI-class, education level, %single family members, and % family employment All data was provided by Dr. Susanne Ragg, Julie Haydon and Jada Pane at IUPUI 2
 patients are categorized into: a. Outcome Patient Variables: relapse, relapse site, alive/death status, and LDKA b.")
3 Computational Diagnostics Tool Coupling of different interactive visualizations such as Matrix visualization phenotype, prognosis and combined view. Parallel Coordinate Visualization Coupled Windows Computational Diagnostics Interactive Visualization System Architecture 3

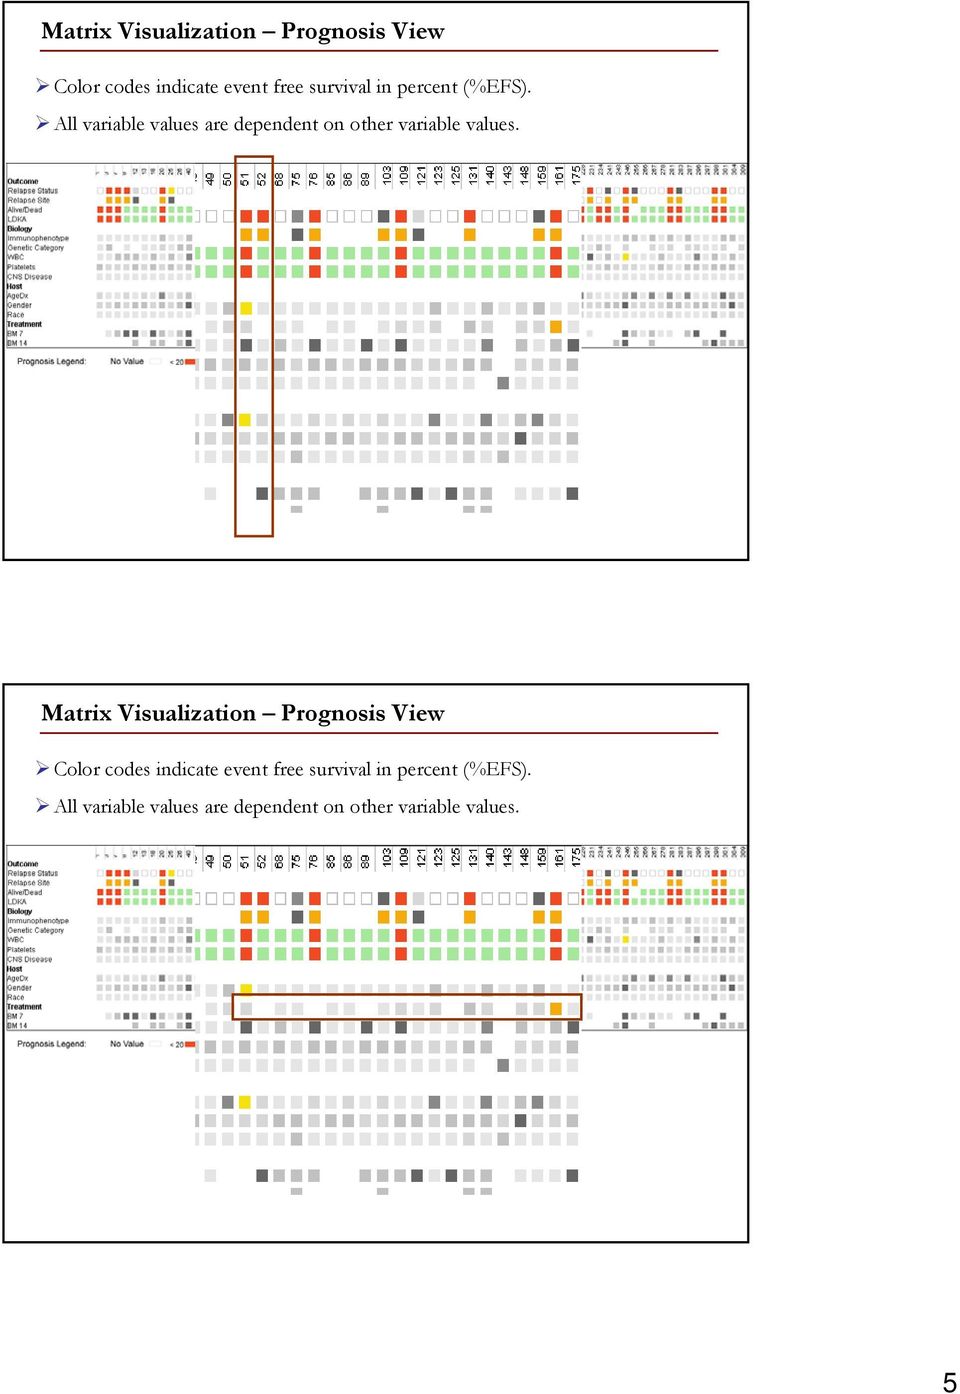
4 Matrix Visualization Phenotype View Data is shown independent of other variables. Color codes help to provide a quick insight into patient medical condition. Matrix Visualization Prognosis View Color codes indicate event free survival in percent (%EFS). All variable values are dependent on other variable values. 4

5 Matrix Visualization Prognosis View Color codes indicate event free survival in percent (%EFS). All variable values are dependent on other variable values. Matrix Visualization Prognosis View Color codes indicate event free survival in percent (%EFS). All variable values are dependent on other variable values. 5
6 Matrix Visualization Combined View Facilitates selection of phenotype/prognosis view for individual diagnostic variables. Parallel Coordinates Visualization Uses one axis for each data variable. For each patient, all data values on different parallel axis are connected. All patient graphs are shown here. Single or multiple patients can be selected and studied in detail. 6

7 Parallel Coordinates Visualization Tool-tip display to show diagnostic values of selected patient Parallel Coordinates Visualization User Interactions Display axes-labels to mark different regions/values along axes Numerical landmarks along axes showing values for quantitative variables. Category labels used along axes show values for nominal variables. 7

8 Parallel Coordinates Visualization User Interactions Display zones to show severity values for different variables Triangular zones indicate variables with quantitative values. Rectangular zones are used for variables with nominal values. Parallel Coordinates Visualization User Interactions Axis selection to study global variations in patient values Single axis can be selected to study the trend in patient values. Red-to-green gradient used to indicate values along the selected axis. [Red = High value, Green = Low value] 8

9 Parallel Coordinates Visualization A subset of patents can be selected and examined as a group Parallel Coordinates Visualization Simultaneous display of patient groups to study differences Patient Group 1 Patient Group 2 Patient Group 1 & 2 9

10 Parallel Coordinates Visualization Multiple Coordinated Views Patient can be selected and color coded in matrix view. Corresponding patient lines are highlighted in parallel coordinate view. Conclusion Computational Diagnostic Tool provides Quick overview of patients medical condition Color visual cues (in matrix view) provide global dataset overview and help to - o Identify patients with worst values for different variables o Compare patients to identify overlaps and differences in values Line patterns (in parallel coordinates view ) show data trends and help to o Reveal patient profile o Compare patients profile within a group or among groups Multiple coordinated view both view complement each other o Matrix view helps identify patterns and worse case conditions o Parallel coordinates helps identify patient groups and compare trends 10

11 Acknowledgements All the work was done when at Indiana University, Bloomington Thanks to Dr. Susan Ragg for her insights on the Acute Lymphoblastic Leukemia dataset and also to Julie Hayden and Jada Pane for making the ALL dataset available. This work was supported by National Science Foundation under DUE st Century Grant for the Center of Excellence for Computational Diagnostics Thank You!!! For additional details Ketan K. Mane 11

Computational Diagnostics: A Novel Approach to Viewing Medical Data
 Computational Diagnostics: A Novel Approach to Viewing Medical Data Ketan K. Mane Research Library, Los Alamos National Lab Los Alamos, NM 87545 kmane@lanl.gov Katy Börner School of Library and Information
Representing, Analyzing, and Visualizing Scholarly Data in Support of Research Management
 Representing, Analyzing, and Visualizing Scholarly Data in Support of Research Management Dr. Katy Börner Cyberinfrastructure for Network Science Center, Director Information Visualization Laboratory,
Comparison of Non-linear Dimensionality Reduction Techniques for Classification with Gene Expression Microarray Data
 CMPE 59H Comparison of Non-linear Dimensionality Reduction Techniques for Classification with Gene Expression Microarray Data Term Project Report Fatma Güney, Kübra Kalkan 1/15/2013 Keywords: Non-linear
Tutorial 3: Graphics and Exploratory Data Analysis in R Jason Pienaar and Tom Miller
 Tutorial 3: Graphics and Exploratory Data Analysis in R Jason Pienaar and Tom Miller Getting to know the data An important first step before performing any kind of statistical analysis is to familiarize
Submission to 2003 National Conference on Digital Government Research
 Submission to 2003 National Conference on Digital Government Research Title: Data Exploration with Paired Hierarchical Visualizations: Initial Designs of PairTrees Authors: Bill Kules, Ben Shneiderman
Introduction to Flow Cytometry
 Introduction to Flow Cytometry presented by: Flow Cytometry y Core Facility Biomedical Instrumentation Center Uniformed Services University Topics Covered in this Lecture What is flow cytometry? Flow cytometer
InfoVis Cyberinfrastructure
 InfoVis Cyberinfrastructure Katy Börner School of Library and Information Science katy@indiana.edu SLIS Colloquium, November 19 th, 2004 http://iv.slis.indiana.edu/sw http://iv.slis.indiana.edu/db http://iv.slis.indiana.edu/cr
GGobi : Interactive and dynamic
 GGobi : Interactive and dynamic data visualization system Bioinformatics and Biostatistics Lab., Seoul National Univ. Seoul, Korea Eun-Kyung Lee 1 Outline interactive and dynamic graphics Exploratory data
HOW WILL BIG DATA AFFECT RADIOLOGY (RESEARCH / ANALYTICS)? Ronald Arenson, MD
? Ronald Arenson, MD") HOW WILL BIG DATA AFFECT RADIOLOGY (RESEARCH / ANALYTICS)? Ronald Arenson, MD DEFINITION OF BIG DATA Big data is a broad term for data sets so large or complex that traditional data processing applications
HOW WILL BIG DATA AFFECT RADIOLOGY (RESEARCH / ANALYTICS)? Ronald Arenson, MD DEFINITION OF BIG DATA Big data is a broad term for data sets so large or complex that traditional data processing applications
Why Taking This Course? Course Introduction, Descriptive Statistics and Data Visualization. Learning Goals. GENOME 560, Spring 2012
 Why Taking This Course? Course Introduction, Descriptive Statistics and Data Visualization GENOME 560, Spring 2012 Data are interesting because they help us understand the world Genomics: Massive Amounts
Introduction to Dashboards in Excel 2007. Craig W. Abbey Director of Institutional Analysis Academic Planning and Budget University at Buffalo
 Introduction to Dashboards in Excel 2007 Craig W. Abbey Director of Institutional Analysis Academic Planning and Budget University at Buffalo Course Objectives 1. Learn how to layout various types of dashboards
The Value of Visualization 2
 The Value of Visualization 2 G Janacek -0.69 1.11-3.1 4.0 GJJ () Visualization 1 / 21 Parallel coordinates Parallel coordinates is a common way of visualising high-dimensional geometry and analysing multivariate
Multivariate data visualization using shadow
 Proceedings of the IIEEJ Ima and Visual Computing Wor Kuching, Malaysia, Novembe Multivariate data visualization using shadow Zhongxiang ZHENG Suguru SAITO Tokyo Institute of Technology ABSTRACT When visualizing
The Forgotten JMP Visualizations (Plus Some New Views in JMP 9) Sam Gardner, SAS Institute, Lafayette, IN, USA
 Sam Gardner, SAS Institute, Lafayette, IN, USA") Paper 156-2010 The Forgotten JMP Visualizations (Plus Some New Views in JMP 9) Sam Gardner, SAS Institute, Lafayette, IN, USA Abstract JMP has a rich set of visual displays that can help you see the information
Paper 156-2010 The Forgotten JMP Visualizations (Plus Some New Views in JMP 9) Sam Gardner, SAS Institute, Lafayette, IN, USA Abstract JMP has a rich set of visual displays that can help you see the information
Exploratory data analysis (Chapter 2) Fall 2011
 Fall 2011") Exploratory data analysis (Chapter 2) Fall 2011 Data Examples Example 1: Survey Data 1 Data collected from a Stat 371 class in Fall 2005 2 They answered questions about their: gender, major, year in school,
Exploratory data analysis (Chapter 2) Fall 2011 Data Examples Example 1: Survey Data 1 Data collected from a Stat 371 class in Fall 2005 2 They answered questions about their: gender, major, year in school,
Visualization methods for patent data
 Visualization methods for patent data Treparel 2013 Dr. Anton Heijs (CTO & Founder) Delft, The Netherlands Introduction Treparel can provide advanced visualizations for patent data. This document describes
Advanced Outlook Tutorials
 Advanced Outlook Tutorials Filtering: Create a filter to send email directly to a specific folder from a certain sender: 1. Right click on the sender s email. 2. Choose Rules. 3. Click on Create Rule.
Employee Survey Analysis
 Employee Survey Analysis Josh Froelich, Megaputer Intelligence Sergei Ananyan, Megaputer Intelligence www.megaputer.com Megaputer Intelligence, Inc. 120 West Seventh Street, Suite 310 Bloomington, IN 47404
ABSTRACT INTRODUCTION EXERCISE 1: EXPLORING THE USER INTERFACE GRAPH GALLERY
 Statistical Graphics for Clinical Research Using ODS Graphics Designer Wei Cheng, Isis Pharmaceuticals, Inc., Carlsbad, CA Sanjay Matange, SAS Institute, Cary, NC ABSTRACT Statistical graphics play an
Scatter Plots with Error Bars
 Chapter 165 Scatter Plots with Error Bars Introduction The procedure extends the capability of the basic scatter plot by allowing you to plot the variability in Y and X corresponding to each point. Each
Iris Sample Data Set. Basic Visualization Techniques: Charts, Graphs and Maps. Summary Statistics. Frequency and Mode
 Iris Sample Data Set Basic Visualization Techniques: Charts, Graphs and Maps CS598 Information Visualization Spring 2010 Many of the exploratory data techniques are illustrated with the Iris Plant data

Assignment 5: Visualization
 Assignment 5: Visualization Arash Vahdat March 17, 2015 Readings Depending on how familiar you are with web programming, you are recommended to study concepts related to CSS, HTML, and JavaScript. The
Graphing Equations. with Color Activity
 Graphing Equations with Color Activity Students must re-write equations into slope intercept form and then graph them on a coordinate plane. 2011 Lindsay Perro Name Date Between The Lines Re-write each
Guide for Data Visualization and Analysis using ACSN
 Guide for Data Visualization and Analysis using ACSN ACSN contains the NaviCell tool box, the intuitive and user- friendly environment for data visualization and analysis. The tool is accessible from the
Nuclear Science and Technology Division (94) Multigroup Cross Section and Cross Section Covariance Data Visualization with Javapeño
 Multigroup Cross Section and Cross Section Covariance Data Visualization with Javapeño") June 21, 2006 Summary Nuclear Science and Technology Division (94) Multigroup Cross Section and Cross Section Covariance Data Visualization with Javapeño Aaron M. Fleckenstein Oak Ridge Institute for Science
June 21, 2006 Summary Nuclear Science and Technology Division (94) Multigroup Cross Section and Cross Section Covariance Data Visualization with Javapeño Aaron M. Fleckenstein Oak Ridge Institute for Science
Delivering the power of the world s most successful genomics platform
 Delivering the power of the world s most successful genomics platform NextCODE Health is bringing the full power of the world s largest and most successful genomics platform to everyday clinical care NextCODE
Data exploration with Microsoft Excel: analysing more than one variable
 Data exploration with Microsoft Excel: analysing more than one variable Contents 1 Introduction... 1 2 Comparing different groups or different variables... 2 3 Exploring the association between categorical
CLUSTER ANALYSIS WITH R
 CLUSTER ANALYSIS WITH R [cluster analysis divides data into groups that are meaningful, useful, or both] LEARNING STAGE ADVANCED DURATION 3 DAY WHAT IS CLUSTER ANALYSIS? Cluster Analysis or Clustering
Hierarchical Clustering Analysis
 Hierarchical Clustering Analysis What is Hierarchical Clustering? Hierarchical clustering is used to group similar objects into clusters. In the beginning, each row and/or column is considered a cluster.
MetroBoston DataCommon Training
 MetroBoston DataCommon Training Whether you are a data novice or an expert researcher, the MetroBoston DataCommon can help you get the information you need to learn more about your community, understand
Quantitative Displays for Combining Time-Series and Part-to-Whole Relationships
 Quantitative Displays for Combining Time-Series and Part-to-Whole Relationships Stephen Few, Perceptual Edge Visual Business Intelligence Newsletter January, February, and March 211 Graphical displays
Big Data: Rethinking Text Visualization
 Big Data: Rethinking Text Visualization Dr. Anton Heijs anton.heijs@treparel.com Treparel April 8, 2013 Abstract In this white paper we discuss text visualization approaches and how these are important
Now we begin our discussion of exploratory data analysis.
 Now we begin our discussion of exploratory data analysis. 1 Remember to keep in mind where we are in the big picture. For now, we will assume that the data we are given is a representative sample from
Principles of Data Visualization
 Principles of Data Visualization by James Bernhard Spring 2012 We begin with some basic ideas about data visualization from Edward Tufte (The Visual Display of Quantitative Information (2nd ed.)) He gives
Choosing Colors for Data Visualization Maureen Stone January 17, 2006
 Choosing Colors for Data Visualization Maureen Stone January 17, 2006 The problem of choosing colors for data visualization is expressed by this quote from information visualization guru Edward Tufte:
Spatio-Temporal Mapping -A Technique for Overview Visualization of Time-Series Datasets-
 Progress in NUCLEAR SCIENCE and TECHNOLOGY, Vol. 2, pp.603-608 (2011) ARTICLE Spatio-Temporal Mapping -A Technique for Overview Visualization of Time-Series Datasets- Hiroko Nakamura MIYAMURA 1,*, Sachiko
Data Exploration Data Visualization
 Data Exploration Data Visualization What is data exploration? A preliminary exploration of the data to better understand its characteristics. Key motivations of data exploration include Helping to select
Principles of Data Visualization for Exploratory Data Analysis. Renee M. P. Teate. SYS 6023 Cognitive Systems Engineering April 28, 2015
 Principles of Data Visualization for Exploratory Data Analysis Renee M. P. Teate SYS 6023 Cognitive Systems Engineering April 28, 2015 Introduction Exploratory Data Analysis (EDA) is the phase of analysis
Collaborative Data Analysis on Wall Displays
 Collaborative Data Analysis on Wall Displays Challenges for Visualization Petra Isenberg (petra.isenberg@inria.fr) Anastasia Bezerianos (anastasia.bezerianos@lri.fr) 2 [source: The Diverse and Exploding
March 19, 2014. Dear Dr. Duvall, Dr. Hambrick, and Ms. Smith,
 Dr. Daniel Duvall, Medical Officer Center for Medicare, Hospital and Ambulatory Policy Group Centers for Medicare and Medicaid Services 7500 Security Boulevard Baltimore, Maryland 21244 Dr. Edith Hambrick,
How To Check For Differences In The One Way Anova
 MINITAB ASSISTANT WHITE PAPER This paper explains the research conducted by Minitab statisticians to develop the methods and data checks used in the Assistant in Minitab 17 Statistical Software. One-Way
Tutorial for proteome data analysis using the Perseus software platform
 Tutorial for proteome data analysis using the Perseus software platform Laboratory of Mass Spectrometry, LNBio, CNPEM Tutorial version 1.0, January 2014. Note: This tutorial was written based on the information
Innovative Information Visualization of Electronic Health Record Data: a Systematic Review
 Innovative Information Visualization of Electronic Health Record Data: a Systematic Review Vivian West, David Borland, W. Ed Hammond February 5, 2015 Outline Background Objective Methods & Criteria Analysis
Lasse Cronqvist. Email: lasse@staff.uni-marburg.de. Tosmana. TOol for SMAll-N Analysis. version 1.2. User Manual
 Lasse Cronqvist Email: lasse@staff.uni-marburg.de Tosmana TOol for SMAll-N Analysis version 1.2 User Manual Release: 24 th of January 2005 Content 1. Introduction... 3 2. Installing Tosmana... 4 Installing
Statistical Analysis and Visualization for Cyber Security
 Statistical Analysis and Visualization for Cyber Security Joanne Wendelberger, Scott Vander Wiel Statistical Sciences Group, CCS-6 Los Alamos National Laboratory Quality and Productivity Research Conference
Statistical Data Mining. Practical Assignment 3 Discriminant Analysis and Decision Trees
 Statistical Data Mining Practical Assignment 3 Discriminant Analysis and Decision Trees In this practical we discuss linear and quadratic discriminant analysis and tree-based classification techniques.
Part 2: Data Visualization How to communicate complex ideas with simple, efficient and accurate data graphics
 Part 2: Data Visualization How to communicate complex ideas with simple, efficient and accurate data graphics Why visualize data? The human eye is extremely sensitive to differences in: Pattern Colors
TIBCO Spotfire Network Analytics 1.1. User s Manual
 TIBCO Spotfire Network Analytics 1.1 User s Manual Revision date: 26 January 2009 Important Information SOME TIBCO SOFTWARE EMBEDS OR BUNDLES OTHER TIBCO SOFTWARE. USE OF SUCH EMBEDDED OR BUNDLED TIBCO
Get the most value from your surveys with text analysis
 PASW Text Analytics for Surveys 3.0 Specifications Get the most value from your surveys with text analysis The words people use to answer a question tell you a lot about what they think and feel. That
Choosing a successful structure for your visualization
 IBM Software Business Analytics Visualization Choosing a successful structure for your visualization By Noah Iliinsky, IBM Visualization Expert 2 Choosing a successful structure for your visualization
Abstract. Bone marrow-level oxygen tension enables enhanced and sustained growth of 3 new pediatric acute lymphoblastic leukemia cell lines
 Abstract Bone marrow-level oxygen tension enables enhanced and sustained growth of 3 new pediatric acute lymphoblastic leukemia cell lines Michael A. Sheard, Min Kang, Daniel Cabral, Joanne Lee, Lilia
Data mining as a tool of revealing the hidden connection of the plant
 Data mining as a tool of revealing the hidden connection of the plant Honeywell AIDA Advanced Interactive Data Analysis Introduction What is AIDA? AIDA: Advanced Interactive Data Analysis Developped in
Quantitative vs. Categorical Data: A Difference Worth Knowing Stephen Few April 2005
 Quantitative vs. Categorical Data: A Difference Worth Knowing Stephen Few April 2005 When you create a graph, you step through a series of choices, including which type of graph you should use and several
Lecture 2: Descriptive Statistics and Exploratory Data Analysis
 Lecture 2: Descriptive Statistics and Exploratory Data Analysis Further Thoughts on Experimental Design 16 Individuals (8 each from two populations) with replicates Pop 1 Pop 2 Randomly sample 4 individuals
Best Practices in Data Visualizations. Vihao Pham January 29, 2014
 Best Practices in Data Visualizations Vihao Pham January 29, 2014 Agenda Best Practices in Data Visualizations Why We Visualize Understanding Data Visualizations Enhancing Visualizations Visualization
Best Practices in Data Visualizations. Vihao Pham 2014
 Best Practices in Data Visualizations Vihao Pham 2014 Agenda Best Practices in Data Visualizations Why We Visualize Understanding Data Visualizations Enhancing Visualizations Visualization Considerations
Representing, Analyzing, and Visualizing Scholarly Data in Support of. Research Management
 Representing, Analyzing, and Visualizing Scholarly Data in Support of Research Management Thomas Neirynck & Katy Börner School of Library and Information Science, Indiana University 10th Street & Jordan
Statistical Databases and Registers with some datamining
 Unsupervised learning - Statistical Databases and Registers with some datamining a course in Survey Methodology and O cial Statistics Pages in the book: 501-528 Department of Statistics Stockholm University
South East of Process Main Building / 1F. North East of Process Main Building / 1F. At 14:05 April 16, 2011. Sample not collected
 At 14:05 April 16, 2011 At 13:55 April 16, 2011 At 14:20 April 16, 2011 ND ND 3.6E-01 ND ND 3.6E-01 1.3E-01 9.1E-02 5.0E-01 ND 3.7E-02 4.5E-01 ND ND 2.2E-02 ND 3.3E-02 4.5E-01 At 11:37 April 17, 2011 At
Modifying Colors and Symbols in ArcMap
 Modifying Colors and Symbols in ArcMap Contents Introduction... 1 Displaying Categorical Data... 3 Creating New Categories... 5 Displaying Numeric Data... 6 Graduated Colors... 6 Graduated Symbols... 9
THE RISK DISTRIBUTION CURVE AND ITS DERIVATIVES. Ralph Stern Cardiovascular Medicine University of Michigan Ann Arbor, Michigan. stern@umich.
 THE RISK DISTRIBUTION CURVE AND ITS DERIVATIVES Ralph Stern Cardiovascular Medicine University of Michigan Ann Arbor, Michigan stern@umich.edu ABSTRACT Risk stratification is most directly and informatively
ALLEN Mouse Brain Atlas
 TECHNICAL WHITE PAPER: QUALITY CONTROL STANDARDS FOR HIGH-THROUGHPUT RNA IN SITU HYBRIDIZATION DATA GENERATION Consistent data quality and internal reproducibility are critical concerns for high-throughput
Graphing Made Easy for Project Management
 Paper 7300-2016 Graphing Made Easy for Project Management Zhouming (Victor) Sun, AZ/Medimmune Corp., Gaithersburg, MD ABSTRACT Project management is a hot topic across many industries, and there are multiple
Logo Use Policy. Using Great River Road National Scenic Byway and Mississippi River Parkway Commission Logos
 Logo Use Policy Using Great River Road National Scenic Byway and Mississippi River Parkway Commission Logos Style Guidelines The Great River Road pilot s wheel logo and the Experience Mississippi River
SPSS Manual for Introductory Applied Statistics: A Variable Approach
 SPSS Manual for Introductory Applied Statistics: A Variable Approach John Gabrosek Department of Statistics Grand Valley State University Allendale, MI USA August 2013 2 Copyright 2013 John Gabrosek. All
Leukemias and Lymphomas: A primer
 Leukemias and Lymphomas: A primer Normal blood contains circulating white blood cells, red blood cells and platelets 700 red cells (oxygen) 1 white cell Neutrophils (60%) bacterial infection Lymphocytes
TIBCO Spotfire Business Author Essentials Quick Reference Guide. Table of contents:
 Table of contents: Access Data for Analysis Data file types Format assumptions Data from Excel Information links Add multiple data tables Create & Interpret Visualizations Table Pie Chart Cross Table Treemap
Using Big Data to Advance Healthcare Gregory J. Moore MD, PhD February 4, 2014
 Using Big Data to Advance Healthcare Gregory J. Moore MD, PhD February 4, 2014 Sequencing Technology - Hype Cycle (Gartner) Gartner - Hype Cycle for Healthcare Provider Applications, Analytics and Systems,
CUSTOMER Presentation of SAP Predictive Analytics
 SAP Predictive Analytics 2.0 2015-02-09 CUSTOMER Presentation of SAP Predictive Analytics Content 1 SAP Predictive Analytics Overview....3 2 Deployment Configurations....4 3 SAP Predictive Analytics Desktop
Visual Mining of Multimedia Data for Social and Behavioral Studies
 Visual Mining of Multimedia Data for Social and Behavioral Studies Chen Yu* Yiwen Zhong Thomas Smith Ikhyun Park Weixia Huang Fujian Agriculture and Forestry University ABSTRACT With advances in computing
What is a Data Lake, anyway? Alec Gardner, GM Advanced Analytics, Teradata ANZ Wednesday 10 th June 2015
 What is a Data Lake, anyway? Alec Gardner, GM Advanced Analytics, Teradata ANZ Wednesday 10 th June 2015 A large objectbased repository that holds data in its native format store all data present and future
Data Visualization Techniques
 Data Visualization Techniques From Basics to Big Data with SAS Visual Analytics WHITE PAPER SAS White Paper Table of Contents Introduction.... 1 Generating the Best Visualizations for Your Data... 2 The
An Oracle White Paper. December 2011. Cloud Computing Maturity Model Guiding Success with Cloud Capabilities
 An Oracle White Paper December 2011 Cloud Computing Maturity Model Guiding Success with Cloud Capabilities Executive Overview... 3 Introduction... 4 Cloud Maturity Model... 4 Capabilities and Domains...
Google s Enhanced. Campaigns - 5 things you need to know. Excel PPC Heat Mapping 101. What the AdWords Update Means for Your Paid Search Strategy
 Excel PPC Heat Mapping 101 Google s Enhanced Campaigns - 5 things you need to know Written by Eric Couch previous Senior Account Manager What the AdWords Update Means for Your Paid Search Strategy Why
Introduction to Exploratory Data Analysis
 Introduction to Exploratory Data Analysis A SpaceStat Software Tutorial Copyright 2013, BioMedware, Inc. (www.biomedware.com). All rights reserved. SpaceStat and BioMedware are trademarks of BioMedware,
MARS STUDENT IMAGING PROJECT
 MARS STUDENT IMAGING PROJECT Data Analysis Practice Guide Mars Education Program Arizona State University Data Analysis Practice Guide This set of activities is designed to help you organize data you collect
Big Data Text Mining and Visualization. Anton Heijs
 Copyright 2007 by Treparel Information Solutions BV. This report nor any part of it may be copied, circulated, quoted without prior written approval from Treparel7 Treparel Information Solutions BV Delftechpark
Data Visualization. BUS 230: Business and Economic Research and Communication
 Data Visualization BUS 230: Business and Economic Research and Communication Data Visualization 1/ 16 Purpose of graphs and charts is to show a picture that can enhance a message, or quickly communicate
The National Institute of Genomic Medicine (INMEGEN) was
 was") Genome is...... the complete set of genetic information contained within all of the chromosomes of an organism. It defines the particular phenotype of an individual. What is Genomics? The study of the
Genome is...... the complete set of genetic information contained within all of the chromosomes of an organism. It defines the particular phenotype of an individual. What is Genomics? The study of the
A Tutorial on dynamic networks. By Clement Levallois, Erasmus University Rotterdam
 A Tutorial on dynamic networks By, Erasmus University Rotterdam V 1.0-2013 Bio notes Education in economics, management, history of science (Ph.D.) Since 2008, turned to digital methods for research. data
Break-even analysis. On page 256 of It s the Business textbook, the authors refer to an alternative approach to drawing a break-even chart.
 Break-even analysis On page 256 of It s the Business textbook, the authors refer to an alternative approach to drawing a break-even chart. In order to survive businesses must at least break even, which
Exploratory Spatial Data Analysis
 Exploratory Spatial Data Analysis Part II Dynamically Linked Views 1 Contents Introduction: why to use non-cartographic data displays Display linking by object highlighting Dynamic Query Object classification
Visualization of Multivariate Data. Dr. Yan Liu Department of Biomedical, Industrial and Human Factors Engineering Wright State University
 Visualization of Multivariate Data Dr. Yan Liu Department of Biomedical, Industrial and Human Factors Engineering Wright State University Introduction Multivariate (Multidimensional) Visualization Visualization
Gephi Tutorial Visualization
 Gephi Tutorial Welcome to this Gephi tutorial. It will guide you to the basic and advanced visualization settings in Gephi. The selection and interaction with tools will also be introduced. Follow the
Analyzing Experimental Data
 Analyzing Experimental Data The information in this chapter is a short summary of some topics that are covered in depth in the book Students and Research written by Cothron, Giese, and Rezba. See the end
BIOINFORMATICS Supporting competencies for the pharma industry
 BIOINFORMATICS Supporting competencies for the pharma industry ABOUT QFAB QFAB is a bioinformatics service provider based in Brisbane, Australia operating nationwide and internationally. QFAB was established
Expert Color Choices for Presenting Data
 Expert Color Choices for Presenting Data Maureen Stone, StoneSoup Consulting The problem of choosing colors for data visualization is expressed by this quote from information visualization guru Edward
CSU, Fresno - Institutional Research, Assessment and Planning - Dmitri Rogulkin
 My presentation is about data visualization. How to use visual graphs and charts in order to explore data, discover meaning and report findings. The goal is to show that visual displays can be very effective
ProteinQuest user guide
 ProteinQuest user guide 1. Introduction... 3 1.1 With ProteinQuest you can... 3 1.2 ProteinQuest basic version 4 1.3 ProteinQuest extended version... 5 2. ProteinQuest dictionaries... 6 3. Directions for
Data Mining: Exploring Data. Lecture Notes for Chapter 3. Slides by Tan, Steinbach, Kumar adapted by Michael Hahsler
 Data Mining: Exploring Data Lecture Notes for Chapter 3 Slides by Tan, Steinbach, Kumar adapted by Michael Hahsler Topics Exploratory Data Analysis Summary Statistics Visualization What is data exploration?
Visualization Quick Guide
 Visualization Quick Guide A best practice guide to help you find the right visualization for your data WHAT IS DOMO? Domo is a new form of business intelligence (BI) unlike anything before an executive
Data Visualization Handbook
 SAP Lumira Data Visualization Handbook www.saplumira.com 1 Table of Content 3 Introduction 20 Ranking 4 Know Your Purpose 23 Part-to-Whole 5 Know Your Data 25 Distribution 9 Crafting Your Message 29 Correlation
Malignant Lymphomas and Plasma Cell Myeloma
 Malignant Lymphomas and Plasma Cell Myeloma Dr. Bruce F. Burns Dept. of Pathology and Lab Medicine Overview definitions - lymphoma lymphoproliferative disorder plasma cell myeloma pathogenesis - translocations
Visual Sample Plan (VSP): A Tool for Balancing Sampling Requirements Against Decision Error Risk
: A Tool for Balancing Sampling Requirements Against Decision Error Risk") Visual Sample Plan (VSP): A Tool for Balancing Sampling Requirements Against Decision Error Risk B.A. Pulsipher, R.O. Gilbert, and J.E. Wilson Pacific Northwest National Laboratory, Richland, Washington,
Visual Sample Plan (VSP): A Tool for Balancing Sampling Requirements Against Decision Error Risk B.A. Pulsipher, R.O. Gilbert, and J.E. Wilson Pacific Northwest National Laboratory, Richland, Washington,
International Journal of Computer Science Trends and Technology (IJCST) Volume 2 Issue 3, May-Jun 2014
 Volume 2 Issue 3, May-Jun 2014") RESEARCH ARTICLE OPEN ACCESS A Survey of Data Mining: Concepts with Applications and its Future Scope Dr. Zubair Khan 1, Ashish Kumar 2, Sunny Kumar 3 M.Tech Research Scholar 2. Department of Computer
RESEARCH ARTICLE OPEN ACCESS A Survey of Data Mining: Concepts with Applications and its Future Scope Dr. Zubair Khan 1, Ashish Kumar 2, Sunny Kumar 3 M.Tech Research Scholar 2. Department of Computer
Create a Data Visualization Cookbook Using Excel. Yueyue Fan, Ethan Pan, Cheryl M. Ackerman
 Create a Data Visualization Cookbook Using Excel Yueyue Fan, Ethan Pan, Cheryl M. Ackerman Why learn about Data Visualization? Agenda Introduce simple steps for effective visualization Hands-on practice
What is Visualization? Information Visualization An Overview. Information Visualization. Definitions
 What is Visualization? Information Visualization An Overview Jonathan I. Maletic, Ph.D. Computer Science Kent State University Visualize/Visualization: To form a mental image or vision of [some
20 A Visualization Framework For Discovering Prepaid Mobile Subscriber Usage Patterns
 20 A Visualization Framework For Discovering Prepaid Mobile Subscriber Usage Patterns John Aogon and Patrick J. Ogao Telecommunications operators in developing countries are faced with a problem of knowing