PROC TABULATE: Doin It in Style!
|
|
|
- Rudolf Flowers
- 8 years ago
- Views:
Transcription
1 Paper PROC TABULATE: Doin It in Style! Ray Pass, Ray Pass Consulting, Hartsdale, NY Sandy McNeill, SAS, Cary, NC Abstract The advent of the SAS Output Delivery System (ODS to its friends) has turned SAS reports from machine-generated, black & white monospace bores into people-produced, productive and reader-friendly information displays. One of the main principles underlying ODS is the use of Table and Style definitions (also known as Table and Style templates). Most procedures have a standard output layout structure and rely on their Table and Style definitions to govern the cosmetic or stylistic appearance of their tables. Certain procedures (REPORT, TABULATE, etc), however, by the very nature of their complete structural customizability, do not rely on fixed external table definitions. For these procedures, stylistic customizations are performed through the use of the STYLE option, an ODS concept which is integrated into the heart of the procedures' syntax. This presentation will demonstrate the use of STYLEs in the TABULATE procedure. Introduction Prior to Version 8 (actually Version 7) of the SAS System, the only form of output available from PROC TABULATE was the listing file in the Output Window. The output was produced in SAS Monospace font with form characters (usually dashes) used for overlining and underlining. This was the acceptable (and in fact the only) way to bring attention to summary or total lines. There was no way to highlight any of the rows, columns or cells of the output. As Version 8 was released, HTML output was gaining huge popularity as the choice of medium for sharing information reports, documents, charts. In the HTML world, monospace, fixed fonts were no longer preferred and it was now possible to use proportional fonts, colors, different font sizes, bolding and italics to bring attention to areas of reports that needed more attention from the reader. Version 8 contained the first production release of the Output Delivery System (ODS). One of the main features of ODS is the ability to produce output from all BASE procedures in alternate formats (known in ODS as destinations). One of the original ODS destinations, in addition to the default LISTING destination, was HTML. Output sent to this destination was rendered as HTML-tagged output suitable for viewing in HTML browsers. Most BASE procedures follow certain fairly rigid structural guidelines in terms of the overall layout of the results, and the design of the layout is fairly consistent from run to run. All UNIVARIATE output for example follows a basic blueprint. This was not, however, possible with certain reporting procedures (REPORT, TABULATE, PRINT, etc) because of the infinite amounts of final data layouts that could be created depending on many data factors including variables used and reporting statistics chosen, as well as other design considerations. Therefore, while standard codified aspects of most procedure output could be individually customized via ODS and its accompanying TEMPLATE procedure, this was not possible for the reporting procedures because of the lack of standard replicable design features. To compensate for this lack of individual customizability, a system of STYLE formatting was made available for use in REPORT and TABULATE coding (now available in PRINT as well) which provided the ability to individually customize almost all design aspects of the procedure output. This presentation will illustrate some of the many different features of ODS STYLEs as implemented in PROC TABULATE. This will be done through a series of examples, each using the same source data set. This data set, a subset of SASHELP.PRDSAL3, contains fictitious actual and predicted sales for the years 1997 and 1998 for the states or provinces of three countries Mexico, U.S.A., and Canada. The examples will start off very simply and then build upon each other by adding or changing features until the final example, which will be a culmination of these features. Let s get started with the code needed to create the data set used throughout. data tabhow; set sashelp.prdsal3(keep=country state quarter year month actual predict); where ( country='u.s.a.' and ( state='north Carolina' or state='new York' or state='california')) or country='canada' or country='mexico'; MakeData Code
.")
2 Example 1 Plain old HTML This first example creates the basic table that we will be working with throughout the rest of the paper. The code for the report is as follows, with comments after the code. The output for all examples can be found at the end of the paper. title1 'Example 1 - Simple Tabulate HTML'; ods html file = "tabhow1.htm"; proc tabulate data=tabhow; class country state year; var actual predict; all ='** Whole Country **'), predict='predicted') * sum=' ' * f=comma9.0 / box='country by State by Year' ; Example 1 Code In addition to the actual and predicted sales values for each of the years for the countries, we also have an ALL row which captures the total actual and predicted sales values. The output is sent to the ODS HTML destination via two simple ODS statements: 1) ODS HTML FILE = 'tabhow1.htm'; this statement defines the HTML output file to which the output will be written, 2) ODS HTML CLOSE; - this statement closes the output file and is necessary before the output is available for browsing. The ODS LISTING CLOSE; and ODS LISTING; statements, while not necessary for the functionality of the ODS HTML destination routing, are usually an excellent addition to all ODS coding. They simply turn off, and then turn back on, the default ODS LISTING destination to conserve resources. A few things should be noticed as you look at the report output: 1) the report is rather plain, 2) it is difficult to discern the ALL rows from the rest of the rows, 3) it is easy to confuse one country's values with another. These concerns will be addressed in the following examples. Example 2 STYLE on the HTML statement In this example we start working on the appearance of the report. The only thing we will do here is to change the overall style that is used for the output. title 'Example 2 - Add Style to ODS HTML Statement'; ods html file = "tabhow2.htm" proc tabulate data=tabhow; class country state year; var actual predict; all ='** Whole Country **'), predict='predicted') * sum=' ' * f=comma9.0 / box ='Country by State by Year'; Example 2 Code 2

3 The only difference between this example and Example 1 is the STYLE option on the HTML statement. When a STYLE option is used on a global ODS statement which opens a destination, the style specified (and its elements) are used until the destination is closed. In the first example, we were actually using the DEFAULT style even though we did not explicitly code it. When using the HTML destination, this is the STYLE which is used by default. In Example 2, we use the SASWEB style. This style corresponds to the SASWEB style template which is located in the STYLES directory of the first readable itemstore that contains this style template. As long as the style resides in the STYLES directory, you can omit specifying "STYLES." before the style name, since that is the default. It s just like specifying/not specifying WORK as the default libref when referring to temporary SAS data sets. If this is unclear at the moment, don t worry. It s a base concept in ODS and TEMPLATES, but is not critical to where we are going. Notice when comparing the output from Example 1 to that for Example 2 that the SASWEB style not only affects the color of different areas of the report, but also changes the font and font size that is used throughout the report. If you want stylistic changes to be in effect for many reports, the best place to put those changes is in a style template which you can then simply call from report to report. But once again, this is a bit peripheral to the topic at hand. Example 3 STYLE on the TABULATE statement Now that we have seen how to apply a style to an entire report (and one that could be used for many reports), the next task is to see how we can make changes to colors, fonts, or other stylistic attributes for just one report. The method to use is the STYLE option, but not the same STYLE option as we saw on the ODS global statement in Example 2. The goal of the rest of this paper is to examine different ways that the STYLE option can be used within a specific PROC TABULATE. Let's take a look at the code for Example 3 and then we'll discuss the first use of the STYLE option, namely on the TABULATE statement. title 'Example 3 - Add Style to TABULATE Statement'; ods html file = "tabhow3.htm" proc tabulate data=tabhow style=[background=beige]; class country state year; var actual predict; all ='** Whole Country **'), predict='predicted') * sum=' ' * f=comma9.0 / box ='Country by State by Year'; Example 3 Code The STYLE= option has the following general syntax: STYLE<(location(s)>=<style-element-name> <[attribute1 = attribute-value-1 attribute2 = attribute-value-2... attribute3 = attribute-value-3]> Note: You can use either square brackets ([ and ]) or braces ({ and }). The optional LOCATION identifier tells where in the report the style should be applied. Since PROC TABULATE does not use LOCATION in the STYLE option, we won't discuss it here. PROC REPORT and PROC PRINT however do use this feature and this is discussed in their documentation chapters. The STYLE-ELEMENT-NAME refers to the name of a style element from the current style template in use. This is beyond 3

4 the scope of this paper, but if you want to learn more about style elements, the place to go is the SAS Procedures Guide, Version 8 (online or hardcopy.) The last part(s) of the STYLE option are pairings of attribute names for those style attributes that you want to set, and the values that you want to assign to them. The PROC TEMPLATE documentation (in The Complete Guide to the SAS Output Delivery System, Version 8), as well as the aforementioned V8 SAS Procedures Guide, contain lists of attributes and their possible values. When a FORMAT option is used on the TABULATE statement, the format specified is applied to the data cells, as opposed to row or column headers. This same rule also applies when a STYLE option resides on the TABULATE statement the named style is applied to the data cells of the report. On the TABULATE statement, we see the code STYLE=[BACKGROUND=BEIGE]. There is no style element name specified and only one style attribute and value. Since the STYLE option on the TABULATE statement affects data cells, the background color of data cells will be the color beige. Example 4 STYLE on CLASS and CLASSLEV statements Now that we are familiar with the basic syntax and operation of the STYLE option, let's use this option with other PROC TABULATE statements. In this example, we will use the STYLE option on both the CLASS and CLASSLEV statements. Let's take a look at the code first. title 'Example 4 - Add Style to CLASS and CLASSLEV Statements'; ods html file = "tabhow4.htm" proc tabulate data=tabhow style=[background=beige]; class country state; class year / style=[ classlev year / style=[ var actual predict; all='** Whole Country **'), predict='predicted') * sum=' ' *f=comma9.0 / box ='Country by State by Year'; Example 4 Code In this example we chose to have the column spanning header for the YEAR variable ('Sales Per Year') and the actual values of the YEAR variable (1997, 1998) displayed in black instead of the default white (this default comes from the style element HEADER in the style template that we are using which is STYLES.SASWEB). The first thing to understand is that we need to use the FOREGROUND attribute since we want to change the color of the text (we would use the BACKGROUND attribute to change the background color of the cell.) The second thing to figure out is where to place the STYLE options. Since we want to change the label of the YEAR variable, we place a STYLE option on the CLASS statement for YEAR. Notice that by using PROC TABULATE s support of multiple CLASS statements for different categorizing variables, we can apply different styles (or none at all) to different class variables. In this example, COUNTRY and STATE are not given styles, and the text color for the YEAR variable label is set to black. OK, so we ve changed the style on the CLASS statement for the YEAR variable, but that only affects the label for the variable itself ('Sales Per Year'), and not the actual values of the variable, 1997 and To do this, we need to use the STYLE option on the CLASSLEV statement for YEAR. This CLASSLEV statement was created for just this purpose to access the class level values for a particular class variable. Just as we can have multiple CLASS statements, we can also have multiple CLASSLEV statements to allow different class variables to be styled differently. In this example, however, we are only stylizing the class levels for the variable YEAR, so we have one CLASSLEV statement for that variable, with the same style option as we had on the CLASS statement for YEAR. Unlike CLASS statements which must be present for 4

5 every categorizing variable in the run, CLASSLEV statements are only needed for those variables for which you wish to make variable-level style changes. Example 5 - STYLE on the BOX option One area that is slightly removed from the variables and their statistics in the output is the BOX area. This area can nevertheless be stylized. Here is the code: title 'Example 5 - Add Style to BOX option on TABLE Statement'; ods html file = "tabhow5.htm" proc tabulate data=tabhow style=[background=beige]; class country state; class year / style=[ classlev year / style=[ var actual predict; all ='** Whole Country **'), predict='predicted') * sum=' ' * f=comma9.0 / box=[label='country by State by Year' style=[background=beige foreground=black font_size=3]]; Example 5 Code Setting a style for the BOX area only slightly complicates the process of just setting a string to appear there. Instead of just specifying the string, as in BOX= string, you have to enclose the string (LABEL=) in brackets as well as the style. Remember that the STYLE= is enclosed in brackets, within the outer BOX brackets. In our example, we set a label as well as a style with three attributes: BACKGROUND, FOREGROUND and FONT_SIZE. Example 6 - STYLE on VAR statements OK, we ve colored CLASS variable column headers with STYLE on CLASS and CLASSLEV statements (the same can obviously be done with row CLASS variables) and we ve done the BOX area. Now we come to the rest of the table, the guts, the data cells. The task at hand in this example and the next is to differentially color the ACTUAL and PREDICT columns so that they can be more readily separated by eye when viewing the table. We ll do just the headers ( Actual, Predicted ) in Example 6 and get to the data cells for these columns in Example 7. Here is the code for Example 6: title 'Example 6 - Add Style to VAR Statement'; ods html file = "tabhow6.htm" proc tabulate data=tabhow style=[background=beige]; class country state; class year / style=[ classlev year / style=[ var var actual / style=[background=lightgreen predict / style=[background=lightcyan all='** Whole Country **'), predict='predicted') * sum=' ' * f=comma9.0 5
, predict='predicted') *")
6 / box=[label='country by State by Year' style=[background=beige foreground=black font_size=3]]; Example 6 Code Just as we can have separate CLASS and CLASSLEV statements for separate CLASS variables or sets of variables, we can also have separate VAR statements. The structure of the STYLE syntax on the VAR statement is just like that of the CLASS or CLASSLEV statement. In our example, we are giving a black foreground to both ACTUAL and PREDICT, but we are giving them different background colors, lightgreen for ACTUAL and lightcyan for PREDICT. This is the first step towards color-coding these columns. Let s go on to Example 7 and see the next step. Example 7 STYLE on TABLE statements In Example 1, we saw that placing a STYLE option on the PROC TABULATE statement affects the style of all of the data cells. The task is now to style the cells differentially, depending on the VARs that are being displayed. But first, the code: title 'Example 7 - Add Style to the TABLE Statement'; ods html file = "tabhow7.htm" proc tabulate data=tabhow style=[background=beige]; class country state; class year / style=[ classlev year / style=[ var actual / style=[background=lightgreen var predict / style=[background=lightcyan all ='** Whole Country **'), sum=' ' * f=comma9.0 / box=[label='country by State by Year' style=[background=beige foreground=black font_size=3]]; * [style=[background=lightgreen]] predict='predicted' * [style=[background=lightcyan]]) * Example 7 Code You add styles to individual variables by inserting STYLE code in the crossings for the individual variables. In the code above, the variable YEAR in the column dimension is crossed with the variables ACTUAL and PREDICT. Then the variable ACTUAL is crossed with [STYLE=[BACKGROUND=LIGHTGREEN]] and the variable PREDICT is crossed with [STYLE=[BACKGROUND=LIGHTCYAN]]. Then, both are crossed with SUM= *FORMAT=COMMA9.0. We now have the entire columns color-coded, not only the headings. You can see how much easier it is to compare the ACTUAL or PREDICT values between the two years, 1997 and Example 8 User-defined formats as STYLE attribute values & PARENTing We ve seen that we can style column headers and data cells under the headers now let s switch gears a bit and see what we can do with the rows. In these next two examples, we are going to first apply color bands to the row headers, and then carry these colors across the entire rows. Let s take a look at the code for Example 8: 6

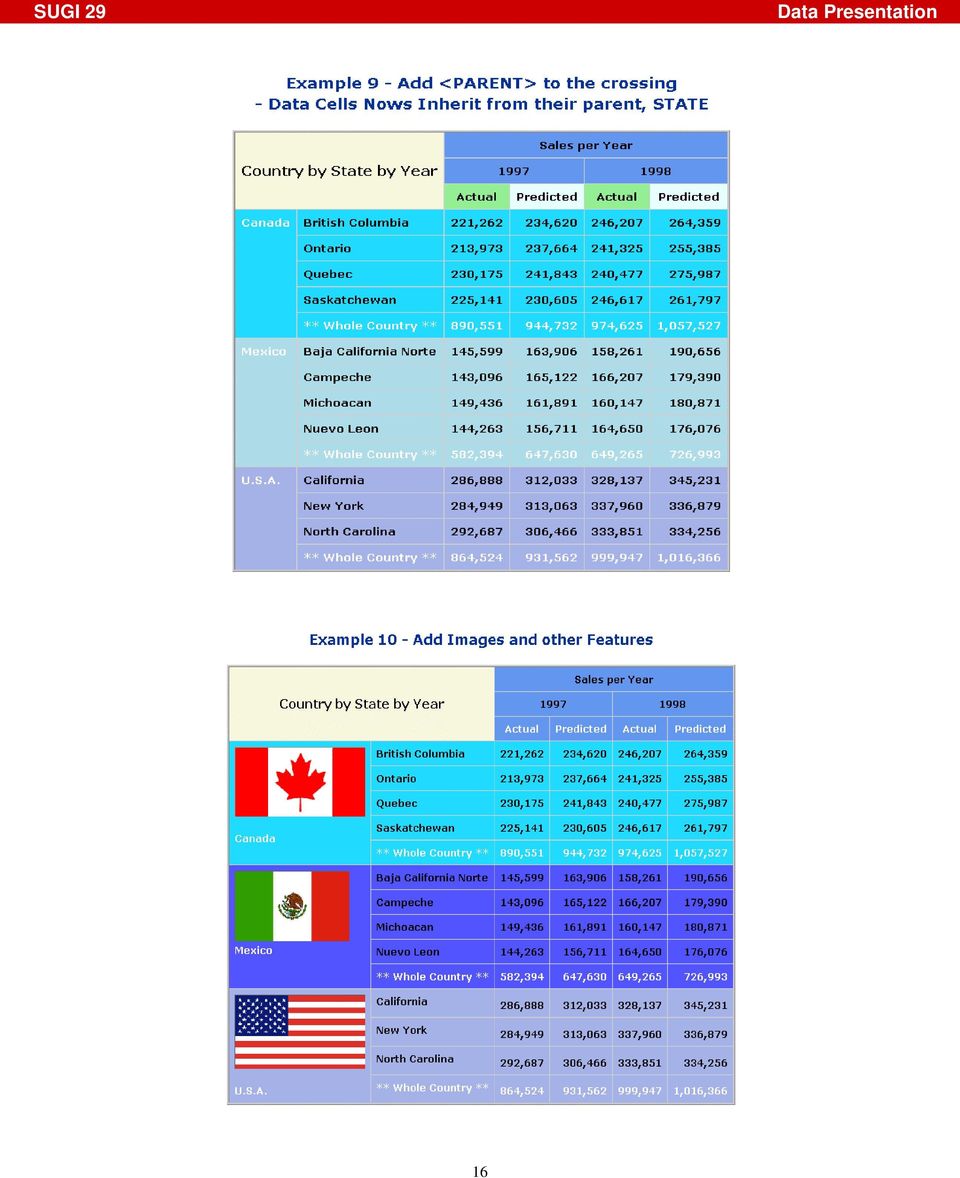
7 title1 'Example 8'; title2 '- Add Color Bands to the Major Row Variable (COUNTRY) Using Format'; title3 '- Add Color Bands to the Other Row Variable (STATE) Using <PARENT>'; title4 '- Add Style to ALL Keyword Using <PARENT>'; proc format; value $ctryfmt 'U.S.A.' = 'navyblue' 'Canada' = 'CX23d8FF' 'Mexico' = 'lightblue'; ods html file = "tabhow8.htm" proc tabulate data=tabhow style=[background=beige]; class country state; class year / style=[ classlev country / style=[background=$ctryfmt.]; classlev state / style=<parent>[ classlev year / style=[ var actual / style=[background=lightgreen var predict / style=[background=lightcyan all ='** Whole Country **'), year='sales per Year' * (actual='actual' * [style=[background=lightgreen]] predict='predicted' * [style=[background=lightcyan]]) * sum=' ' * f=comma9.0 / box=[label='country by State by Year' style=[background=beige foreground=black font_size=3]]; keyword all / style=<parent>; Example 8 Code There are two new features of importance that we have introduced in this example. First of all, we are using a user-defined format as an attribute value in a STYLE attribute pairing. We defined the format $CTRYFMT. and then used it as the background color in the STYLE option on the CLASSLEV statement for COUNTRY. This is an efficient and flexible method which creates the potential for powerful data-dependent processing which can eliminate rigid hard-coding, but let s not go too far astray. The other new feature introduced here is that of parenting. We now have the colors that we want set up for the different countries, and we would like to have the rest of each row be the same color as that of its country. Moving along to the right, the classlevel cell for each state is the next part of each row to be colorized. The question is, How do we assign a color to the classlevel cell for each state when we want it to be the same color as its parent country, but the country is obtaining its value from a user-defined format? The answer is the new <PARENT> syntax. Let's examine the STYLE option on the CLASSLEV statement for STATE in the code above, STYLE=<PARENT>[FOREGROUND=BLACK]. This STYLE option first sets the style for the classlevel cells of STATE to be the same as that of its parent, COUNTRY. It is said to inherit the style. There are a set of rules for TABULATE as to exactly where inheritance comes from, and these are outlined in the documentation. Once the base style attributes are in place through inheritance, they can be over-ridden, as is the case here with FOREGROUND. This attribute is set to BLACK here. Notice that we also used <PARENT> for the keyword ALL. But we are not done with rows yet. Example 9 <PARENT> on the TABLE statement All that is left to do to our rows is to have them display with the same color as their countries and states. First the code: 7
![htm" proc tabulate data=tabhow style=[background=beige]; class country state; class year / style=[ classlev country / style=[background=$ctryfmt.](/docs-images/44/17406691/images/page_7.jpg "]; classlev state / style=<parent>[ classlev year / style=[ var actual / style=[background=lightgreen var predict / style=[background=lightcyan all ='** Whole Country **'), year='sales per Year' *")
8 title1 'Example 9 - Add <PARENT> to the crossing'; title2 ' - Data Cells Nows Inherit from their parent, STATE'; proc format; value $ctryfmt 'U.S.A.' = 'navyblue' 'Canada' = 'CX23d8FF' 'Mexico' = 'lightblue'; ods html file = "tabhow9.htm" proc tabulate data=tabhow style=[background=beige]; class country state; class year / style=[ classlev country / style=[background=$ctryfmt.]; classlev state / style=<parent>[ classlev year / style=[ var actual / style=[background=lightgreen var predict / style=[background=lightcyan table country=''*(state='' all ='** Whole Country **') * [style=<parent>], predict='predicted') * sum=' ' * f=comma9.0 / box=[label='country by State by Year' style=[background=beige foreground=black font_size=3]]; keyword all / style=<parent>; Example 9 Code In order to get the rows to display with the same styles as their parents, which in this case are those of STATE, we had to change the inheritance of the data cells. First we added a STYLE to the crossing of the row dimension variables (COUNTRY * STATE), and used <PARENT> in that style. We also had to remove the styles in the table crossing for our column dimension variables (YEAR * (ACTUAL PREDICT)). Had we not done this, these column dimension styles would have taken precedence over the row dimension styles in the line of inheritance. As mentioned earlier, there are inheritance rules which do apply and which must be accounted for in creating the desired display. For good measure, we also blanked out the labels for COUNTRY and STATE, although this was not all necessary. Example 10 adding images and other features In this next example, we add an image to each COUNTRY cell. We also make use of another powerful style attribute. Here is the code: title1 'Example 10 - Add Images and other Features'; proc format; value $ctryfmt 'U.S.A.' = 'navyblue' 'Canada' = 'CX23d8FF' 'Mexico' = 'light blue'; value $ctrybr 'U.S.A.' = '<BR>U.S.A.' 'Canada' = '<BR>Canada' 'Mexico' = '<BR>Mexico'; value $ctryflg 'U.S.A.' = "USFlag2.gif" 'Canada' = "CanadaFlag2.gif" 8
![]; classlev state / style=<parent>[ classlev year / style=[ var actual / style=[background=lightgreen var predict / style=[background=lightcyan table country=''*(state='' all ='** Whole Country **')](/docs-images/44/17406691/images/page_8.jpg "* [style=<parent>], predict='predicted') * sum=' ' * f=comma9.")
9 'Mexico' = "MexicoFlag2.gif"; ods html file = "tabhow10.htm" proc tabulate data=tabhow style=[background=beige]; class country state; class year / style=[ classlev country / style=[preimage=$ctryflg. protectspecialchars=off background=$ctryfmt.]; classlev state / style=<parent>[preimage='' classlev year / style=[ var actual predict ; table country=''*(state='' all='** Whole Country **') * [style=<parent>], predict='predicted') * sum=' ' * f=comma9.0 / box=[label='country by State by Year' style=[background=beige foreground=black font_size=3]]; keyword all / style=<parent>[preimage='']; format country $ctrybr.; Example 10 Code Up to now, we have used the style attributes FOREGROUND, BACKGROUND, and FONT_SIZE, but there are many more. The two new ones used here are PREIMAGE and PROTECTSPECIALCHARS. The PREIMAGE attribute allows you to insert an image (we are using gifs in this example) before the text in any cell. There is a matching POSTIMAGE attribute and the syntax/usage is the same. In this example, we are adding an image of the flag of each country into the cell preceding the country s name. The method we are using is the same as we did with the country background colors we are using a user-defined format. This time, however, we are specifying images in a format ($CTRYFLG.), instead of colors. The resulting attribute on the CLASSLEV statement for the COUNTRY variable, PREIMAGE=$CTRYFLG. accomplishes the task. If we left the attributes as above, we would have the flag image preceding the country name, all on one line in each cell. In order to get the name to wrap under the image, we use another technique, and another style attribute. We create another format ($CTRYBR.) which concatenates the HTML line break tag <BR> to the country name value. The name for Canada for example, will now be output as <BR>Canada. We then use the attribute pairing PROTECTSPECIALCHARS=OFF on the CLASSLEV statement for COUNTRY to tell SAS not to protect the characters < and > (& is also not protected with this pairing) and to treat them as HTML tags. The syntax is perhaps a little counterintuitive, but you ll get used to it. So far, so good, but we re not through here yet. Remember that we are parenting the styles for COUNTRY into STATE via a CLASSLEV statement for STATE, and those for STATE into the data cells in the TABLE statement. If we stopped here, the preimages for COUNTRY would flow into all the STATE and data cells. In order to avoid this, we have to provide a null PREIMAGE attribute (PREIMAGE= ) for STATE. We do not have to do the same in the TABLE statement because the null value for the data cells will flow through from their parent, STATE. The last piece of work to be done here is to add the same null preimage value to the style for the ALL keyword, as this also inherits from COUNTRY. Example 11 Traffic Lighting One very powerful method in creating information displays is the technique of automatically calling visual attention to values in a report if those values exceed or fall below certain established maximum or minimum values, or fall within prespecified ranges. The values and ranges can either be pre-determined and hard-coded, or can be created in data-driven 9
![]; classlev state / style=<parent>[preimage='' classlev year / style=[ var actual predict ; table country=''*(state='' all='** Whole Country **') * [style=<parent>], predict='predicted') * sum=' ' *](/docs-images/44/17406691/images/page_9.jpg "f=comma9.0 / box=[label='country by State by Year' style=[background=beige foreground=black font_size=3]]; keyword all / style=<parent>[preimage='']; format country $ctrybr.")
10 manners. This criteria-dependent highlighting is usually referred to as traffic lighting. This last example will demonstrate simple hard-coded traffic lighting with our data. We are going to first enhance the original data set to create a new variable to which we will then apply the technique. As is usual, first the code: data tabhow2; set sashelp.prdsal3(keep=country state quarter year month actual predict); where( country='u.s.a.' and ( state='north Carolina' or state='new York' or state='california')) or country='canada' or country='mexico'; diffpc = (actual-predict); title 'Example 11 - Add Traffic Lighting'; proc format; value $ctryfmt 'U.S.A.' = 'navyblue' 'Canada' = 'CX23d8FF' 'Mexico' = 'light blue'; value difffmt low - <-10 = 'red' = 'lightpink' other = 'beige'; ods html file = "tabhow11.htm" proc tabulate data=tabhow2 style=[background=beige]; class country state; class year / style=[ classlev year / style=[ var actual / style=[background=lightgreen var predict / style=[background=lightcyan var diffpc / style=[background=lightyellow all='** Whole Country **') * [style=<parent>], year='sales per Year' * (actual='actual' * sum='' * f=comma9.0 * [style=[background=lightgreen]] predict='predicted' * sum='' * f=comma9.0 * [style=[background=lightcyan]] diffpc ='% Difference' * pctsum<predict>='' * f=7.2 * [style=[background=difffmt.]]) / box=[label='country by State by Year' style=[background=beige foreground=black font_size=3]]; * ; Example 11 Code Traffic lighting is easily achieved in PROC TABULATE by creating user-defined formats and then by using these formats as attribute values in STYLE attribute pairings. This is the exact same method that we used for applying different color backgrounds to the different countries. This time, however, instead of the formats having individual values (such as the country names), we use ranges of values and then associate a color name with each range. We can then use the formats as BACKGROUND attributes. 10

11 Before we run the TABULATE, we will create an alternate to the original TABHOW dataset. This time, we create a new variable DIFF, which is simply the difference between predicted and actual values. This will be the basis for the variable to which we will apply the traffic lighting in the output. In the TABULATE code, we are actually going to display the percentage of this calculated value DIFF to the PREDICT value by using a PCTSUM statistic. We want to be able to visually recognize major and minor negative percent differences. In order to highlight these values, we create a new format, DIFFFMT.. This equates the range of LOW (the lowest number found in the data) to LESS THAN 10 with the color RED, and the range of -10 to 0 with the color LIGHTPINK. All other numbers are equated with the color BEIGE. This is the format that we will use in the output table with the statistic based on DIFF. Since we will be displaying three different variables, ACTUAL, PREDICT and DIFF, with different output formats and with different STYLES, the TABLE statement has to deal with each of them separately. ACTUAL and PREDICT are not changed from previous examples they will be displayed using a SUM statistic, a COMMA9.0 format and a fixed background color (LIGHTGREEN for ACTUAL and LIGHTCYAN for PREDICT.) The new variable DIFF, however, will be displayed using a PCTSUM statistic with PREDICT as the denominator, an output format of 7.2 and the newly created output format DIFFFMT. as the attribute value for the BACKGROUND attribute. Since the combinations of label, output format and STYLE is different for each variable, each one gets its own fully displayed crossing. One warning with using formats and traffic lighting: you must make sure that the entire range of values is covered in your format statement. If some values are not covered, you may see unpredictable results with the style attribute for which you are using the format. In this example, we cover all possible values by using the OTHER parameter in building our output format. Conclusion PROC TABULATE has been around since the mid eighties and has proven to be a powerhouse in the field of summary data reporting. The advent of the Output Delivery System with Version 8 has greatly enhanced the ability to create data reports from most procedures that are visually compelling as well as data-rich. However, the marriage between ODS and TABULATE has not been as automatic as it has been with other, fixed-layout procedures. This is fully understandable because of the ability of TABULATE to produce an infinite amount of output data layouts. However, by using the STYLE option and its myriad of formatting features in your PROC TABULATE code, you can achieve the same amount of power and elegance as the other procedures, if not more so. Acknowledgements SAS is a registered trademark of the SAS Institute Inc., Cary, NC, USA. Author Contact Information The authors of this paper can be contacted as follows: Ray Pass Ray Pass Consulting 5 Sinclair Place Hartsdale, NY Voice: (914) efax: (914) raypass@att.net Sandy McNeill SAS Institute SAS Campus Drive Cary, NC Voice: (919) Fax: (919) sandy.mcneill@sas.com 11

12 12

13 13

14 14

15 15

16 16
17 17

Let There Be Highlights: Data-driven Cell, Row and Column Highlights in %TAB2HTM and %DS2HTM Output. Matthew Flynn and Ray Pass
 Let There Be Highlights: Data-driven Cell, Row and Column Highlights in %TAB2HTM and %DS2HTM Output Matthew Flynn and Ray Pass Introduction Version 6.12 of the SAS System Technical Support supplied macros
ODS for PRINT, REPORT and TABULATE
 Paper 3-26 ODS for PRINT, REPORT and TABULATE Lauren Haworth, Genentech, Inc., San Francisco ABSTRACT For most procedures in the SAS system, the only way to change the appearance of the output is to change
Tips and Tricks for Creating Multi-Sheet Microsoft Excel Workbooks the Easy Way with SAS. Vincent DelGobbo, SAS Institute Inc.
 Paper HOW-071 Tips and Tricks for Creating Multi-Sheet Microsoft Excel Workbooks the Easy Way with SAS Vincent DelGobbo, SAS Institute Inc., Cary, NC ABSTRACT Transferring SAS data and analytical results
Report Customization Using PROC REPORT Procedure Shruthi Amruthnath, EPITEC, INC., Southfield, MI
 Paper SA12-2014 Report Customization Using PROC REPORT Procedure Shruthi Amruthnath, EPITEC, INC., Southfield, MI ABSTRACT SAS offers powerful report writing tools to generate customized reports. PROC
Microsoft Dynamics GP. Advanced Financial Analysis
 Microsoft Dynamics GP Advanced Financial Analysis Copyright Copyright 2010 Microsoft. All rights reserved. Limitation of liability This document is provided as-is. Information and views expressed in this
VISUAL GUIDE to. RX Scripting. for Roulette Xtreme - System Designer 2.0
 VISUAL GUIDE to RX Scripting for Roulette Xtreme - System Designer 2.0 UX Software - 2009 TABLE OF CONTENTS INTRODUCTION... ii What is this book about?... iii How to use this book... iii Time to start...
Sample Table. Columns. Column 1 Column 2 Column 3 Row 1 Cell 1 Cell 2 Cell 3 Row 2 Cell 4 Cell 5 Cell 6 Row 3 Cell 7 Cell 8 Cell 9.
 Working with Tables in Microsoft Word The purpose of this document is to lead you through the steps of creating, editing and deleting tables and parts of tables. This document follows a tutorial format
Creating a Resume Webpage with
 Creating a Resume Webpage with 6 Cascading Style Sheet Code In this chapter, we will learn the following to World Class CAD standards: Using a Storyboard to Create a Resume Webpage Starting a HTML Resume
Salary. Cumulative Frequency
 HW01 Answering the Right Question with the Right PROC Carrie Mariner, Afton-Royal Training & Consulting, Richmond, VA ABSTRACT When your boss comes to you and says "I need this report by tomorrow!" do
Excel Intermediate Session 2: Charts and Tables
 Excel Intermediate Session 2: Charts and Tables Agenda 1. Introduction (10 minutes) 2. Tables and Ranges (5 minutes) 3. The Report Part 1: Creating and Manipulating Tables (45 min) 4. Charts and other
Using the COMPUTE Block in PROC REPORT Jack Hamilton, Kaiser Foundation Health Plan, Oakland, California
 Using the COMPUTE Block in PROC REPORT Jack Hamilton, Kaiser Foundation Health Plan, Oakland, California ABSTRACT COMPUTE blocks add a great deal of power to PROC REPORT by allowing programmatic changes
Recreate your Newsletter Content and Layout within Informz (Workshop) Monica Capogna and Dan Reade. Exercise: Creating two types of Story Layouts
 Monica Capogna and Dan Reade. Exercise: Creating two types of Story Layouts") Recreate your Newsletter Content and Layout within Informz (Workshop) Monica Capogna and Dan Reade Exercise: Creating two types of Story Layouts 1. Creating a basic story layout (with title and content)
Recreate your Newsletter Content and Layout within Informz (Workshop) Monica Capogna and Dan Reade Exercise: Creating two types of Story Layouts 1. Creating a basic story layout (with title and content)
Anyone Can Learn PROC TABULATE
 Paper 60-27 Anyone Can Learn PROC TABULATE Lauren Haworth, Genentech, Inc., South San Francisco, CA ABSTRACT SAS Software provides hundreds of ways you can analyze your data. You can use the DATA step
Using SAS Output Delivery System (ODS) Markup to Generate Custom PivotTable and PivotChart Reports Chevell Parker, SAS Institute
 Markup to Generate Custom PivotTable and PivotChart Reports Chevell Parker, SAS Institute") Using SAS Output Delivery System (ODS) Markup to Generate Custom PivotTable and PivotChart Reports Chevell Parker, SAS Institute ABSTRACT This paper illustrates how to use ODS markup to create PivotTable
Using SAS Output Delivery System (ODS) Markup to Generate Custom PivotTable and PivotChart Reports Chevell Parker, SAS Institute ABSTRACT This paper illustrates how to use ODS markup to create PivotTable
Web Portal User Guide. Version 6.0
 Web Portal User Guide Version 6.0 2013 Pitney Bowes Software Inc. All rights reserved. This document may contain confidential and proprietary information belonging to Pitney Bowes Inc. and/or its subsidiaries
MICROSOFT ACCESS STEP BY STEP GUIDE
 IGCSE ICT SECTION 11 DATA MANIPULATION MICROSOFT ACCESS STEP BY STEP GUIDE Mark Nicholls ICT Lounge P a g e 1 Contents Task 35 details Page 3 Opening a new Database. Page 4 Importing.csv file into the
TECHNIQUES FOR BUILDING A SUCCESSFUL WEB ENABLED APPLICATION USING SAS/INTRNET SOFTWARE
 TECHNIQUES FOR BUILDING A SUCCESSFUL WEB ENABLED APPLICATION USING SAS/INTRNET SOFTWARE Mary Singelais, Bell Atlantic, Merrimack, NH ABSTRACT (This paper is based on a presentation given in March 1998
Creating HTML Output with Output Delivery System
 Paper CC07 Creating HTML Output with Output Delivery System Kirk Paul Lafler, Software Intelligence Corporation, Spring Valley, CA ABSTRACT Are you looking for ways to improve the way your SAS output appears?
Release 2.1 of SAS Add-In for Microsoft Office Bringing Microsoft PowerPoint into the Mix ABSTRACT INTRODUCTION Data Access
 Release 2.1 of SAS Add-In for Microsoft Office Bringing Microsoft PowerPoint into the Mix Jennifer Clegg, SAS Institute Inc., Cary, NC Eric Hill, SAS Institute Inc., Cary, NC ABSTRACT Release 2.1 of SAS
GUIDE: How to fill out the Excel spreadsheet Introduction There is a total of 31 fields Purpose of this guide General Notes: Very important:
 Complete E Commerce Solutions GUIDE: How to fill out the Excel spreadsheet Please make sure to read this entire document, otherwise you will not fill out the spreadsheet correctly. Introduction The most
RIT Message Center Compose and Send Messages
 RIT Message Center Compose and Send Messages Table of Contents Table of Contents... 2 Logging into Message Center... 3 Category Display... 3 Message Center: Create a Message... 4 Create a New Message without
So you want to create an Email a Friend action
 So you want to create an Email a Friend action This help file will take you through all the steps on how to create a simple and effective email a friend action. It doesn t cover the advanced features;
Access Queries (Office 2003)
") Access Queries (Office 2003) Technical Support Services Office of Information Technology, West Virginia University OIT Help Desk 293-4444 x 1 oit.wvu.edu/support/training/classmat/db/ Instructor: Kathy
Access Queries (Office 2003) Technical Support Services Office of Information Technology, West Virginia University OIT Help Desk 293-4444 x 1 oit.wvu.edu/support/training/classmat/db/ Instructor: Kathy
Utilizing Microsoft Access Forms and Reports
 Utilizing Microsoft Access Forms and Reports The 2014 SAIR Conference Workshop #3 October 4 th, 2014 Presented by: Nathan Pitts (Sr. Research Analyst The University of North Alabama) Molly Vaughn (Associate
Intellect Platform - The Workflow Engine Basic HelpDesk Troubleticket System - A102
 Intellect Platform - The Workflow Engine Basic HelpDesk Troubleticket System - A102 Interneer, Inc. Updated on 2/22/2012 Created by Erika Keresztyen Fahey 2 Workflow - A102 - Basic HelpDesk Ticketing System
Creating Web Pages with Microsoft FrontPage
 Creating Web Pages with Microsoft FrontPage 1. Page Properties 1.1 Basic page information Choose File Properties. Type the name of the Title of the page, for example Template. And then click OK. Short
HOUR 3 Creating Our First ASP.NET Web Page
 HOUR 3 Creating Our First ASP.NET Web Page In the last two hours, we ve spent quite a bit of time talking in very highlevel terms about ASP.NET Web pages and the ASP.NET programming model. We ve looked
Excel Reporting with 1010data
 Excel Reporting with 1010data (212) 405.1010 info@1010data.com Follow: @1010data www.1010data.com Excel Reporting with 1010data Contents 2 Contents Overview... 3 Start with a 1010data query... 5 Running
SUGI 29 Data Presentation
 Paper 088-29 Perfecting Report Output to RTF Steven Feder, Federal Reserve Board, Washington, D.C. ABSTRACT Output Delivery System (ODS) output to RTF presents possibilities for creating publication-ready
New Perspectives on Creating Web Pages with HTML. Considerations for Text and Graphical Tables. A Graphical Table. Using Fixed-Width Fonts
 A Text Table New Perspectives on Creating Web Pages with HTML This figure shows a text table. Tutorial 4: Designing a Web Page with Tables 1 2 A Graphical Table Considerations for Text and Graphical Tables
Web Development. Owen Sacco. ICS2205/ICS2230 Web Intelligence
 Web Development Owen Sacco ICS2205/ICS2230 Web Intelligence Introduction Client-Side scripting involves using programming technologies to build web pages and applications that are run on the client (i.e.
This document will describe how you can create your own, fully responsive. drag and drop email template to use in the email creator.
 1 Introduction This document will describe how you can create your own, fully responsive drag and drop email template to use in the email creator. It includes ready-made HTML code that will allow you to
JavaScript: Introduction to Scripting. 2008 Pearson Education, Inc. All rights reserved.
 1 6 JavaScript: Introduction to Scripting 2 Comment is free, but facts are sacred. C. P. Scott The creditor hath a better memory than the debtor. James Howell When faced with a decision, I always ask,
Google Sites: Creating, editing, and sharing a site
 Google Sites: Creating, editing, and sharing a site Google Sites is an application that makes building a website for your organization as easy as editing a document. With Google Sites, teams can quickly
Beyond the Basics: Advanced REPORT Procedure Tips and Tricks Updated for SAS 9.2 Allison McMahill Booth, SAS Institute Inc.
 ABSTRACT PharmaSUG 2011 - Paper SAS-AD02 Beyond the Basics: Advanced REPORT Procedure Tips and Tricks Updated for SAS 9.2 Allison McMahill Booth, SAS Institute Inc., Cary, NC, USA This paper is an update
Website Development Komodo Editor and HTML Intro
 Website Development Komodo Editor and HTML Intro Introduction In this Assignment we will cover: o Use of the editor that will be used for the Website Development and Javascript Programming sections of
SAS ODS HTML + PROC Report = Fantastic Output Girish K. Narayandas, OptumInsight, Eden Prairie, MN
 SA118-2014 SAS ODS HTML + PROC Report = Fantastic Output Girish K. Narayandas, OptumInsight, Eden Prairie, MN ABSTRACT ODS (Output Delivery System) is a wonderful feature in SAS to create consistent, presentable
PharmaSUG 2015 - Paper QT26
 PharmaSUG 2015 - Paper QT26 Keyboard Macros - The most magical tool you may have never heard of - You will never program the same again (It's that amazing!) Steven Black, Agility-Clinical Inc., Carlsbad,
Perfecting Report Output to RTF Steven Feder, Federal Reserve Board, Washington, D.C.
 Perfecting Report Output to RTF Steven Feder, Federal Reserve Board, Washington, D.C. ABSTRACT Output Delivery System (ODS) output to RTF presents possibilities for creating publication-ready final documents
SmallBiz Dynamic Theme User Guide
 SmallBiz Dynamic Theme User Guide Table of Contents Introduction... 3 Create Your Website in Just 5 Minutes... 3 Before Your Installation Begins... 4 Installing the Small Biz Theme... 4 Customizing the
Using Mail Merge in Microsoft Word 2003
 Using Mail Merge in Microsoft Word 2003 Mail Merge Created: 12 April 2005 Note: You should be competent in Microsoft Word before you attempt this Tutorial. Open Microsoft Word 2003 Beginning the Merge
USER GUIDE. Unit 2: Synergy. Chapter 2: Using Schoolwires Synergy
 USER GUIDE Unit 2: Synergy Chapter 2: Using Schoolwires Synergy Schoolwires Synergy & Assist Version 2.0 TABLE OF CONTENTS Introductions... 1 Audience... 1 Objectives... 1 Before You Begin... 1 Getting
Choosing the Best Method to Create an Excel Report Romain Miralles, Clinovo, Sunnyvale, CA
 Choosing the Best Method to Create an Excel Report Romain Miralles, Clinovo, Sunnyvale, CA ABSTRACT PROC EXPORT, LIBNAME, DDE or excelxp tagset? Many techniques exist to create an excel file using SAS.
CMS Training Manual. A brief overview of your website s content management system (CMS) with screenshots. CMS Manual
 with screenshots. CMS Manual") Training A brief overview of your website s content management system () with screenshots. 1 Contents Logging In:...3 Dashboard:...4 Page List / Search Filter:...5 Common Icons:...6 Adding a New Page:...7
Training A brief overview of your website s content management system () with screenshots. 1 Contents Logging In:...3 Dashboard:...4 Page List / Search Filter:...5 Common Icons:...6 Adding a New Page:...7
DKAN. Data Warehousing, Visualization, and Mapping
 DKAN Data Warehousing, Visualization, and Mapping Acknowledgements We d like to acknowledge the NuCivic team, led by Andrew Hoppin, which has done amazing work creating open source tools to make data available
paragraph(s). The bottom mark is for all following lines in that paragraph. The rectangle below the marks moves both marks at the same time.
. The bottom mark is for all following lines in that paragraph. The rectangle below the marks moves both marks at the same time.") MS Word, Part 3 & 4 Office 2007 Line Numbering Sometimes it can be helpful to have every line numbered. That way, if someone else is reviewing your document they can tell you exactly which lines they have
MS Word, Part 3 & 4 Office 2007 Line Numbering Sometimes it can be helpful to have every line numbered. That way, if someone else is reviewing your document they can tell you exactly which lines they have
Catalog Creator by On-site Custom Software
 Catalog Creator by On-site Custom Software Thank you for purchasing or evaluating this software. If you are only evaluating Catalog Creator, the Free Trial you downloaded is fully-functional and all the
Introduction to Web Design Curriculum Sample
 Introduction to Web Design Curriculum Sample Thank you for evaluating our curriculum pack for your school! We have assembled what we believe to be the finest collection of materials anywhere to teach basic
COGNOS 8 Business Intelligence
 COGNOS 8 Business Intelligence QUERY STUDIO USER GUIDE Query Studio is the reporting tool for creating simple queries and reports in Cognos 8, the Web-based reporting solution. In Query Studio, you can
Time Matters and Billing Matters 11.1. User Guide
 Time Matters and Billing Matters 11.1 User Guide About this guide This guide provides steps to achieve basic, commonly performed tasks. For additional details, including interface elements and advanced
Do-It-Yourself Templates
 Whitepaper Do-It-Yourself Templates Using Your Own Content to Create Message Templates August 4, 2010 Copyright 2010 L-Soft international, Inc. Information in this document is subject to change without
9.2 User s Guide SAS/STAT. Introduction. (Book Excerpt) SAS Documentation
 SAS Documentation") SAS/STAT Introduction (Book Excerpt) 9.2 User s Guide SAS Documentation This document is an individual chapter from SAS/STAT 9.2 User s Guide. The correct bibliographic citation for the complete manual
SAS/STAT Introduction (Book Excerpt) 9.2 User s Guide SAS Documentation This document is an individual chapter from SAS/STAT 9.2 User s Guide. The correct bibliographic citation for the complete manual
Sage Accountants Business Cloud EasyEditor Quick Start Guide
 Sage Accountants Business Cloud EasyEditor Quick Start Guide VERSION 1.0 September 2013 Contents Introduction 3 Overview of the interface 4 Working with elements 6 Adding and moving elements 7 Resizing
PROC PRINT - the Granddaddy of all Procedures, Enhanced and Still Going Strong! David Franklin, TheProgrammersCabin.com, Litchfield, NH
 PROC PRINT - the Granddaddy of all Procedures, Enhanced and Still Going Strong! David Franklin, TheProgrammersCabin.com, Litchfield, NH ABSTRACT The PRINT procedure, or PROC PRINT, has been around since
Access II 2007 Workshop
 Access II 2007 Workshop Query & Report I. Review Tables/Forms Ways to create tables: tables, templates & design Edit tables: new fields & table properties Import option Link tables: Relationship Forms
SAS BI Dashboard 3.1. User s Guide
 SAS BI Dashboard 3.1 User s Guide The correct bibliographic citation for this manual is as follows: SAS Institute Inc. 2007. SAS BI Dashboard 3.1: User s Guide. Cary, NC: SAS Institute Inc. SAS BI Dashboard
Eloqua Insight: Advanced Analyzer User Guide
 Eloqua Insight: Advanced Analyzer User Guide Table of Contents About this User Guide... 5 Introduction to Analyzer User... 6 Beyond Basic Grids and Graphs... 6 The Benefits of Eloqua Insight... 6 Reporting
Microsoft Expression Web
 Microsoft Expression Web Microsoft Expression Web is the new program from Microsoft to replace Frontpage as a website editing program. While the layout has changed, it still functions much the same as
How to Edit Your Website
 How to Edit Your Website A guide to using your Content Management System Overview 2 Accessing the CMS 2 Choosing Your Language 2 Resetting Your Password 3 Sites 4 Favorites 4 Pages 5 Creating Pages 5 Managing
Switching from PC SAS to SAS Enterprise Guide Zhengxin (Cindy) Yang, inventiv Health Clinical, Princeton, NJ
 Yang, inventiv Health Clinical, Princeton, NJ") PharmaSUG 2014 PO10 Switching from PC SAS to SAS Enterprise Guide Zhengxin (Cindy) Yang, inventiv Health Clinical, Princeton, NJ ABSTRACT As more and more organizations adapt to the SAS Enterprise Guide,
PharmaSUG 2014 PO10 Switching from PC SAS to SAS Enterprise Guide Zhengxin (Cindy) Yang, inventiv Health Clinical, Princeton, NJ ABSTRACT As more and more organizations adapt to the SAS Enterprise Guide,
Making the Output Delivery System (ODS) Work for You William Fehlner, SAS Institute (Canada) Inc., Toronto, Ontario
 Work for You William Fehlner, SAS Institute (Canada) Inc., Toronto, Ontario") Making the Output Delivery System (ODS) Work for You William Fehlner, SAS Institute (Canada) Inc, Toronto, Ontario ABSTRACT Over the years, a variety of options have been offered in order to give a SAS
Making the Output Delivery System (ODS) Work for You William Fehlner, SAS Institute (Canada) Inc, Toronto, Ontario ABSTRACT Over the years, a variety of options have been offered in order to give a SAS
Paper 23-28. Hot Links: Creating Embedded URLs using ODS Jonathan Squire, C 2 RA (Cambridge Clinical Research Associates), Andover, MA
, Andover, MA") Paper 23-28 Hot Links: Creating Embedded URLs using ODS Jonathan Squire, C 2 RA (Cambridge Clinical Research Associates), Andover, MA ABSTRACT With SAS/BASE version 8, one can create embedded HTML links
Paper 23-28 Hot Links: Creating Embedded URLs using ODS Jonathan Squire, C 2 RA (Cambridge Clinical Research Associates), Andover, MA ABSTRACT With SAS/BASE version 8, one can create embedded HTML links
Creating A Grade Sheet With Microsoft Excel
 Creating A Grade Sheet With Microsoft Excel Microsoft Excel serves as an excellent tool for tracking grades in your course. But its power is not limited to its ability to organize information in rows and
One of the fundamental kinds of Web sites that SharePoint 2010 allows
 Chapter 1 Getting to Know Your Team Site In This Chapter Requesting a new team site and opening it in the browser Participating in a team site Changing your team site s home page One of the fundamental
Excel 2003: Ringtones Task
 Excel 2003: Ringtones Task 1. Open up a blank spreadsheet 2. Save the spreadsheet to your area and call it Ringtones.xls 3. Add the data as shown here, making sure you keep to the cells as shown Make sure
Access 2010: Creating Queries Table of Contents INTRODUCTION TO QUERIES... 2 QUERY JOINS... 2 INNER JOINS... 3 OUTER JOINS...
 Access 2010: Creating Queries Table of Contents INTRODUCTION TO QUERIES... 2 QUERY JOINS... 2 INNER JOINS... 3 OUTER JOINS... 3 CHANGE A JOIN PROPERTY... 4 REMOVING A JOIN... 4 CREATE QUERIES... 4 THE
Advanced Drupal Features and Techniques
 Advanced Drupal Features and Techniques Mount Holyoke College Office of Communications and Marketing 04/2/15 This MHC Drupal Manual contains proprietary information. It is the express property of Mount
Knowledge Base for Electronic Editing Tools
 2014 Knowledge Base for Electronic Editing Tools JOSHUA BLOUNT CAMMY HERMAN JOHN DRISCOLL TEXAS TECH UNIVERSITY 1 This document collects a series of tutorials designed to help editors get the most out
RADFORD UNIVERSITY. Radford.edu. Content Administrator s Guide
 RADFORD UNIVERSITY Radford.edu Content Administrator s Guide Contents Getting Started... 2 Accessing Content Administration Tools... 2 Logging In... 2... 2 Getting Around... 2 Logging Out... 3 Adding and
Intro to Excel spreadsheets
 Intro to Excel spreadsheets What are the objectives of this document? The objectives of document are: 1. Familiarize you with what a spreadsheet is, how it works, and what its capabilities are; 2. Using
Module One: Getting Started... 6. Opening Outlook... 6. Setting Up Outlook for the First Time... 7. Understanding the Interface...
 2 CONTENTS Module One: Getting Started... 6 Opening Outlook... 6 Setting Up Outlook for the First Time... 7 Understanding the Interface...12 Using Backstage View...14 Viewing Your Inbox...15 Closing Outlook...17
EXST SAS Lab Lab #4: Data input and dataset modifications
 EXST SAS Lab Lab #4: Data input and dataset modifications Objectives 1. Import an EXCEL dataset. 2. Infile an external dataset (CSV file) 3. Concatenate two datasets into one 4. The PLOT statement will
Using Adobe Dreamweaver CS4 (10.0)
") Getting Started Before you begin create a folder on your desktop called DreamweaverTraining This is where you will save your pages. Inside of the DreamweaverTraining folder, create another folder called
Getting Started Before you begin create a folder on your desktop called DreamweaverTraining This is where you will save your pages. Inside of the DreamweaverTraining folder, create another folder called
Search help. More on Office.com: images templates
 Page 1 of 7 PowerPoint 2010 Home > PowerPoint 2010 Help and How-to > Getting started with PowerPoint Search help More on Office.com: images templates Basic tasks in PowerPoint 2010 Here are some basic
HOW TO CREATE AN HTML5 JEOPARDY- STYLE GAME IN CAPTIVATE
 HOW TO CREATE AN HTML5 JEOPARDY- STYLE GAME IN CAPTIVATE This document describes the steps required to create an HTML5 Jeopardy- style game using an Adobe Captivate 7 template. The document is split into
CSS 101. CSS CODE The code in a style sheet is made up of rules of the following types
 CSS 101 WHY CSS? A consistent system was needed to apply stylistic values to HTML elements. What CSS does is provide a way to attach styling like color:red to HTML elements like . It does this by defining
About webpage creation
 About webpage creation Introduction HTML stands for HyperText Markup Language. It is the predominant markup language for Web=ages. > markup language is a modern system for annota?ng a text in a way that
SAS BI Dashboard 4.3. User's Guide. SAS Documentation
 SAS BI Dashboard 4.3 User's Guide SAS Documentation The correct bibliographic citation for this manual is as follows: SAS Institute Inc. 2010. SAS BI Dashboard 4.3: User s Guide. Cary, NC: SAS Institute
We automatically generate the HTML for this as seen below. Provide the above components for the teaser.txt file.
 Creative Specs Gmail Sponsored Promotions Overview The GSP creative asset will be a ZIP folder, containing four components: 1. Teaser text file 2. Teaser logo image 3. HTML file with the fully expanded
Working with the Ektron Content Management System
 Working with the Ektron Content Management System Table of Contents Creating Folders Creating Content 3 Entering Text 3 Adding Headings 4 Creating Bullets and numbered lists 4 External Hyperlinks and e
Ohio University Computer Services Center August, 2002 Crystal Reports Introduction Quick Reference Guide
 Open Crystal Reports From the Windows Start menu choose Programs and then Crystal Reports. Creating a Blank Report Ohio University Computer Services Center August, 2002 Crystal Reports Introduction Quick
Hello. What s inside? Ready to build a website?
 Beginner s guide Hello Ready to build a website? Our easy-to-use software allows to create and customise the style and layout of your site without you having to understand any coding or HTML. In this guide
SPSS: Getting Started. For Windows
 For Windows Updated: August 2012 Table of Contents Section 1: Overview... 3 1.1 Introduction to SPSS Tutorials... 3 1.2 Introduction to SPSS... 3 1.3 Overview of SPSS for Windows... 3 Section 2: Entering
Using Excel as a Management Reporting Tool with your Minotaur Data. Exercise 1 Customer Item Profitability Reporting Tool for Management
 Using Excel as a Management Reporting Tool with your Minotaur Data with Judith Kirkness These instruction sheets will help you learn: 1. How to export reports from Minotaur to Excel (these instructions
Guido s Guide to PROC FREQ A Tutorial for Beginners Using the SAS System Joseph J. Guido, University of Rochester Medical Center, Rochester, NY
 Guido s Guide to PROC FREQ A Tutorial for Beginners Using the SAS System Joseph J. Guido, University of Rochester Medical Center, Rochester, NY ABSTRACT PROC FREQ is an essential procedure within BASE
The presentation will include a code review and presentation of reports that appear in both English and Italian.
 SAS Reporting in English, ed anche in italiano: A Methodology for Creating Reports in Two Languages Deborah Testa, Seven of Nine Systems, Inc. Studio City, CA ABSTRACT Project Leonardo was a disease management
Data representation and analysis in Excel
 Page 1 Data representation and analysis in Excel Let s Get Started! This course will teach you how to analyze data and make charts in Excel so that the data may be represented in a visual way that reflects
Advanced Excel 10/20/2011 1
 Advanced Excel Data Validation Excel has a feature called Data Validation, which will allow you to control what kind of information is typed into cells. 1. Select the cell(s) you wish to control. 2. Click
Building A Very Simple Web Site
 Sitecore CMS 6.2 Building A Very Simple Web Site Rev 100601 Sitecore CMS 6. 2 Building A Very Simple Web Site A Self-Study Guide for Developers Table of Contents Chapter 1 Introduction... 3 Chapter 2 Building
ADOBE DREAMWEAVER CS3 TUTORIAL
 ADOBE DREAMWEAVER CS3 TUTORIAL 1 TABLE OF CONTENTS I. GETTING S TARTED... 2 II. CREATING A WEBPAGE... 2 III. DESIGN AND LAYOUT... 3 IV. INSERTING AND USING TABLES... 4 A. WHY USE TABLES... 4 B. HOW TO
4 Other useful features on the course web page. 5 Accessing SAS
 1 Using SAS outside of ITCs Statistical Methods and Computing, 22S:30/105 Instructor: Cowles Lab 1 Jan 31, 2014 You can access SAS from off campus by using the ITC Virtual Desktop Go to https://virtualdesktopuiowaedu
Creative Guidelines for Emails
 Version 2.1 Contents 1 Introduction... 3 1.1 Document Aim and Target Audience... 3 1.2 WYSIWYG editors... 3 1.3 Outlook Overview... 3 2 Quick Reference... 4 3 CSS and Styling... 5 3.1 Positioning... 5
HRS 750: UDW+ Ad Hoc Reports Training 2015 Version 1.1
 HRS 750: UDW+ Ad Hoc Reports Training 2015 Version 1.1 Program Services Office & Decision Support Group Table of Contents Create New Analysis... 4 Criteria Tab... 5 Key Fact (Measurement) and Dimension
Data Tool Platform SQL Development Tools
 Data Tool Platform SQL Development Tools ekapner Contents Setting SQL Development Preferences...5 Execution Plan View Options Preferences...5 General Preferences...5 Label Decorations Preferences...6
New Tricks for an Old Tool: Using Custom Formats for Data Validation and Program Efficiency
 New Tricks for an Old Tool: Using Custom Formats for Data Validation and Program Efficiency S. David Riba, JADE Tech, Inc., Clearwater, FL ABSTRACT PROC FORMAT is one of the old standards among SAS Procedures,
User Guide for TASKE Desktop
 User Guide for TASKE Desktop For Avaya Aura Communication Manager with Aura Application Enablement Services Version: 8.9 Date: 2013-03 This document is provided to you for informational purposes only.
The Center for Teaching, Learning, & Technology
 The Center for Teaching, Learning, & Technology Instructional Technology Workshops Microsoft Excel 2010 Formulas and Charts Albert Robinson / Delwar Sayeed Faculty and Staff Development Programs Colston
Microsoft Excel 2010 Part 3: Advanced Excel
 CALIFORNIA STATE UNIVERSITY, LOS ANGELES INFORMATION TECHNOLOGY SERVICES Microsoft Excel 2010 Part 3: Advanced Excel Winter 2015, Version 1.0 Table of Contents Introduction...2 Sorting Data...2 Sorting
Microsoft Dynamics GP. Manufacturing Management Functions
 Microsoft Dynamics GP Manufacturing Management Functions Copyright Copyright 2010 Microsoft. All rights reserved. Limitation of liability This document is provided as-is. Information and views expressed
Practical Example: Building Reports for Bugzilla
 Practical Example: Building Reports for Bugzilla We have seen all the components of building reports with BIRT. By this time, we are now familiar with how to navigate the Eclipse BIRT Report Designer perspective,