Virginia Western Community College Strategic Plan: Data and Trend Analysis
|
|
|
- Tyrone Campbell
- 8 years ago
- Views:
Transcription
1 2013 Virginia Western Community College Strategic Plan: Data and Trend Analysis An initial investigation into data and trends impacting the college s service area. John M. Hull 2/13/2013

2 TABLE OF CONTENTS Page A Note on Geographies, Data Collection, and the Virginia Western Community College Service Area... 1 Summary.. 1 Demographic Trends... 3 Current Service Area Population and Population Trends 4 Age 4 Race and Ethnicity.. 6 Limited English Proficiency Household Demographics 13 Educational Attainment 13 Poverty and Income. 15 Technology and Usage 17 Commuting Patterns 18 Economic Data and Trends Gross Metropolitan Product. 19 Cost of Living.. 20 Taxable Sales Annual Building Permits. 21 Annual Home Sales. 21 Unemployment. 22 Employment. 23 Underemployment 24 Number of Employers by Size of Establishment. 25 Top 50 Employers 26 Employment and Average Wage by Industry.. 27 Occupational Projections and Annual Average Openings New Startup Firms 29 Nonemployer Statistics. 30 New Hires and Turnover by Industry 31 Age of Workers by Industry. 32 Science Technology Engineering Math and Health (STEM-H) Occupations. 33 Clusters and Industry Change Institutional Data 39 Trends in Enrollment. 39 Distance Learning Headcount and FTES.. 39 High School Dual Enrollment Career and Technical Enrollment. 40 Developmental Course Enrollment 41 Retention and Graduation Rates. 41 Financial Aid 42 STEM Degree Production Completions Data.. 45 Transfers to 4-Year Institutions. 46 Licensure and Certification Pass Rates.. 47 Student Demography.. 48

3 Student Survey Data Other Educational Data 51 Regional Enrollment and Dropouts 51 Continuing Education Plans.. 52 Enrollment Projections (Public School) 53 Appendix 55 Occupational Employment Projections 56 Virginia Western Community College Survey of Student Engagement 65 Alumni Survey Trends.. 72 SDV Survey Trends Graduation Survey Trends 84 Campus Employee Survey Trends. 88

4 A Note in Regards to Data Sources and Geography Virginia Western Community College (VWCC) serves an area including Craig and Roanoke Counties, the Cities of Roanoke and Salem as well as southern Botetourt and northern Franklin Counties. The service area very closely approximates the boundaries of the Roanoke Metropolitan Statistical Area (MSA). Given the large amount of data available for Metropolitan Statistical Areas in the federal statistical agencies, this definition has been used throughout the report. Particularly since VWCC serves the most densely populated portions of Franklin and Botetourt Counties, adopting the Roanoke MSA geography for purposes of this report should lend accurate and descriptive results. Summary A great deal has changed since the last strategic planning process was undertaken for Virginia Western Community College. A largely unforeseen national economic downturn, termed by many the Great Recession, drastically changed the national economic landscape. While Roanoke remained largely unscathed early in the downturn due to the lack of a pronounced housing boom and relatively strong consumer credit conditions, effects eventually trickled down. Large employers serving distressed markets all over the nation were impacted and were forced to cut positions. State institutions including Virginia Western Community College were impacted by statewide budgetary problems. The region s economic recovery has begun to speed up in the latest data available. Population growth has again begun to trend strongly positive. Sales and home building activity are beginning to recover while unemployment has begun to trend in a downwards direction. Virginia Western Community College meanwhile has seen enrollments begin to decline slightly (down only 0.6 percent from 2007 when the last strategic plan was developed and down 4.7 percent from 2010 when headcounts peaked). Growth in the Community College Access Program and increased funding for STEM H tuition grants will hopefully support enrollment moving ahead. Projected flat to slightly negative change in traditional young adult populations increasingly suggests that VWCC will have to find ways of increasing demand for enrollment among nontraditional populations. Exploration of concepts related to support of elderly entrepreneurship and other courses of interest to the elderly population may be a timely exercise. Trends in entrepreneurial business creation and earnings show weaker than normal growth in earnings and overall decline in the number of businesses who lack employees since the onset of the recession. The college should consider studying gaps that exist in the regional entrepreneurship support environment. Many community colleges across the country have identified ways of developing facilities and programs that simultaneously encourage development of a regional economic sector and drive growth in demand for enrollment in noncredit and credit opportunities related to that sector. Jobs incubators and accelerator concepts based in food production appear to be an emerging trend across the country allowing tenants use of specialized equipment and providing needed training opportunities. Evidence can be found in the performance of nonemployer businesses suggesting that entrepreneurs are struggling in the Roanoke market. This may pose an opportunity for the college, particularly if a niche can be found in a particular industry. There is a growing trend that incoming students require additional educational support as indicated by an increase in developmental enrollment and a concern voiced among faculty in the faculty survey. VWCC Data and Trends Investigation 1

5 Partnerships with regional public school systems continue to be important. Data from the Virginia Department of Education indicate more graduating students intend to pursue two year degrees in recent years than 5 years ago. Meanwhile, partnerships like the one involving Mechatronics between Virginia Western Community College and the secondary schools in the region emphasize the importance of math education among participants, which hopefully leads to stronger math students and less of a demand for developmental enrollment among future enrollees. Regional employment has been slow to recover. Occupational employment projections support further growth in the employment engines that have continued to support economic growth in the region in recent history advanced technical manufacturing, health care, business and financial employment, and distribution. Occupations in the following areas are expected to see high levels of annual openings as a result of sector growth and pending retirements office and administrative occupations, sales and related occupations, food preparation and serving occupations, transportation and material moving occupations, healthcare practitioners and technical occupations, and production occupations. STEM H occupations, and particularly health occupations, are expected to see strong growth in the region. VWCC Data and Trends Investigation 2

6 Demographic Trends To better understand the direction of a region, it is helpful to examine recent trends in population, household demographics, and income. Regions are in a constant state of change. Recent economic upheaval has wrought significant change upon Virginia Western Community College s service area as have demographic changes that are reflective of national trends. The following section is an interesting study into the changing nature of the service area and the population served. Population The latest figures from the Weldon Cooper Center for Public Service suggest that population growth is returning to the region after a period of stagnant growth surrounding the Great Recession and the slow economic recovery period that resulted. Census Count Cooper Center Estimates Locality April 1, 2010 July 1, 2010 July 1, 2011 July 1, 2012 % Change % Change Census Estimate Estimate Estimate 2010 to to 2012 Virginia 8,001,024 8,025,514 8,096,604 8,185, % 1.1% Alleghany County 16,250 16,222 16,180 15, % -1.5% Botetourt County 33,148 33,209 33,399 33, % -0.3% Craig County 5,190 5,191 5,241 5, % 0.3% Franklin County 56,159 56,387 56,300 56, % 0.6% Roanoke County 92,376 92,524 92,687 93, % 0.6% Roanoke City 97,032 97,061 97,206 98, % 1.5% Salem City 24,802 24,797 24,970 25, % 1.2% Roanoke MSA 308, , , , % 0.8% Source: Weldon Cooper Center for Public Service, In recent years, growth had slowed across the entire region and migration statistics show that the recession caused a significant decline in the amount of net in migration into the region. In spite of a slowing in demographic growth and a cessation of migration in the time immediately following the Great Recession, the City of Roanoke began to see positive population growth once again. Newest figures suggest growth is returning to pre recessionary levels, likely due to the national housing correction coming to a close and continued household deleveraging of debt. These two trends have loosened migration activity nationally. Unlike the previous decade, growth is concentrated in the urban core of the region. Only time will tell if this is a long term trend reversal, but this growth pattern is in stark contrast to the previous decade when exurban and suburban growth was the norm. VWCC Data and Trends Investigation 3

7 Metropolitan Areas April 1, 2010 Census July 1, 2010 Estimate July 1, 2011 Estimate July 1, 2012 Estimate % Change 2010 to 2011 % Change 2011 to 2012 Blacksburg 162, , , , % 0.6% Bristol combined 95,888 95,968 96,233 96, % 0.4% Charlottesville 201, , , , % 0.6% Danville 106, , , , % 0.2% Harrisonburg 125, , , , % 0.8% Lynchburg 252, , , , % 0.6% NoVa 2,623,079 2,637,471 2,679,985 2,727, % 1.8% Richmond 1,258,251 1,262,355 1,271,099 1,282, % 0.9% Roanoke 308, , , , % 0.8% Virginia Beach 1,648,136 1,650,209 1,661,279 1,679, % 1.1% Winchester 104, , , , % 1.9% Source: Weldon Cooper Center for Public Service. The Roanoke metro area is seeing growth rebound more quickly than several surrounding areas. Roanoke grew faster than Blacksburg, Lynchburg, and Charlottesville in Source: IRS, Migration Data, Migration figures above are the latest available from the Internal Revenue Service but lag significantly behind the most recent population estimates and illustrate the trend in migration heading into the recession and early recovery period. The newest population estimates data showing a recovery in population growth are encouraging. Hopefully, this growth will hopefully benefit Virginia Western Community College and serve to lift enrollments. Age The Roanoke Region (42.0) has a median age well above those of the state (37.5) and nation (37.2) indicating an older population base. The population pyramid figures below illustrate the differences in the age composition of the Roanoke MSA when compared to the Commonwealth of Virginia. Blue bars represent males and red bars represent female population percentages. VWCC Data and Trends Investigation 4

8 The Roanoke MSA has comparatively fewer residents between the ages of 20 and 39 and a significantly higher proportion of residents 60 years and older. While younger cohorts 19 and below appear roughly on par with state percentages, Roanoke has proportionally fewer young adults aged 20 to 34. Growth by Age Cohort, 2000 to 2010 Roanoke's fastest growing age groups are the ages 55 to 69, the cohorts nearing retirement and the cohort immediately following retirement age. Roanoke is experiencing slower population growth than the state and this translates to lower growth across the board for all age groups, though Roanoke is nearly meeting the state rate of growth of those between 60 and 64. The continued aging of Roanoke's population can be clearly seen in these data. Virginia Western Community College may consider expanding entrepreneurship and lifelong learning opportunities to appeal to newly retired or to individuals who will find re entering the workforce after a layoff or other work disruption more VWCC Data and Trends Investigation 5

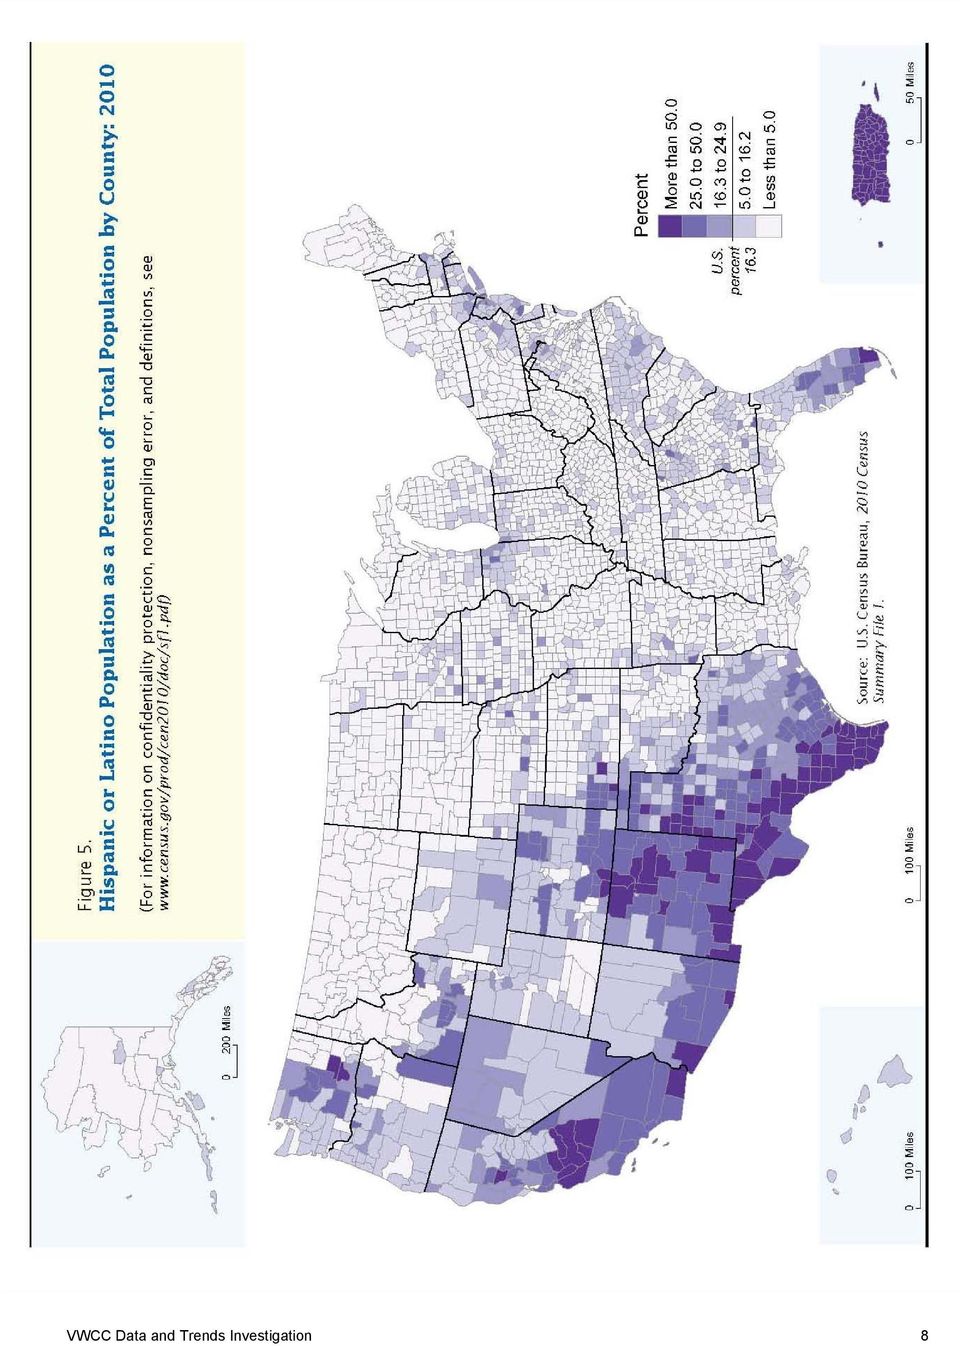
9 difficult due to advanced age. There is some thought that elderly entrepreneurship could be a new emerging trend as older, skilled individuals take up running their own businesses. Ting Zhang's book Elderly Entrepreneurship in An Aging US Economy goes into great detail as to the potential trend of elderly entrepreneurship and its potential impacts. Age Cohort Projections, 2010 to CAGR % Chg 2010 to 2040 Total Population 308, , , , % 16.6% 0 to 4 17,784 17,151 18,160 18, % 6.1% 5 to 9 17,940 17,690 18,847 19, % 10.6% 10 to 14 18,690 20,527 20,137 21, % 16.3% 15 to 19 20,045 19,846 19,715 21, % 6.7% 20 to 24 17,677 17,408 19,484 19, % 8.9% 25 to 29 17,574 19,514 19,210 19, % 10.7% 30 to 34 17,137 19,424 19,390 21, % 27.9% 35 to 39 19,222 19,297 21,844 22, % 14.7% 40 to 44 20,960 18,647 21,494 21, % 4.8% 45 to 49 23,487 20,295 20,534 23, % 0.7% 50 to 54 24,255 21,929 19,644 22, % 5.2% 55 to 59 22,834 23,984 20,895 21, % 6.3% 60 to 64 20,926 24,097 22,092 19, % 4.5% 65 to 69 15,345 21,696 23,153 20, % 33.1% 70 to 74 11,420 18,344 21,334 19, % 74.0% 75 to 79 9,334 11,825 16,862 18, % 95.2% 80 to 84 7,296 7,386 12,000 14, % 93.2% 85 and Over 6,781 7,700 8,982 12, % 89.0% Source: 2010 figures are from 2010 Census. All others, Weldon Cooper Center for Public Service, The figures above illustrate that the population over 65 is expected to grow by over 70 percent between 2010 and The number of young adults is expected to remain largely stable growing by between seven and nine percent over a 30 year period. Adults between 25 to 39 are expected to see modest growth while cohorts representing today's Baby Boom generation are expected to see declines as smaller following generations age into their 50's. These projections suggest that there will be an increasingly large cohort of elderly in the region. Present trends suggest that this generation will likely have been conditioned for lifelong learning and career switching. It is important for the college to consider ways it can serve this population which is considered by many to be an untapped resource of skills, knowledge, and potential entrepreneurialism in many communities. Race and Ethnicity In terms of racial and major ethnic group characteristics, the study area has seen significant change since Most notably, the Hispanic population has grown significantly nearly 200 percent in a ten year period. Projections show that Asian, Hispanic, and the Other Race which is made up mostly of individuals belonging to multiple races are expected to see significant growth in the region. VWCC Data and Trends Investigation 6

10 Racial and Ethnic Projections, 2010 to 2040 % Change % Change to to 2040 Total Population 288, , , , , % 16.6% White 244, , , , , % 4.5% Black 35,214 39,101 41,620 42,747 42, % 9.2% Asian 3,035 4,962 8,237 12,482 17, % 260.3% Other 5,108 5,963 16,698 26,493 39, % 558.8% # Hispanic 3,269 9,713 17,027 28,108 43, % 348.2% White 85.0% 80.6% 79.6% 76.2% 72.3% Black 12.2% 12.7% 12.7% 12.4% 11.9% Asian 1.1% 1.6% 2.5% 3.6% 5.0% Other 1.8% 1.9% 5.1% 7.7% 10.9% % Hispanic 1.1% 3.1% 5.2% 8.2% 12.1% The region s Hispanic population is still somewhat small but growing at an incredible pace according to the latest data available. The following two maps show that overall Hispanic concentration in the region is not strong but that the growth in the study area is some of the fastest in the United States from 2000 to VWCC Data and Trends Investigation 7

11 VWCC Data and Trends Investigation 8
12 VWCC Data and Trends Investigation 9

13 The table below shows data available on the foreign born population within the Roanoke MSA. Unfortunately, data are not directly comparable to Census 2000 data included in the previous report due to a change in the methodology. However, it can be said that the data suggests an increasing amount of diversity throughout the region. In 2000, only 2.42% of the Roanoke MSA population was foreign born. These most recent data suggest that the percentage has increased to 4.6 percent of the regional population. Regional growth in the foreign born population appears to be faster than the growth of this cohort at the state and national level. Most of the region s growth in foreign born populations appears to be coming from growth in Asian and Latin American immigration. Immigrants from Africa have grown considerably and represent one of the fastest growing foreign born populations in the metro on a percentage basis, though total numbers remain small. Foreign Born Population by Major Region of the World, Decenial Census and Estimates Census 2000 Estimate Margin of Error Total: 7,002 14,218 +/ 901 Europe: 2,261 2,774 +/ 429 Northern Europe: / 254 Western Europe: / 171 Southern Europe: / 106 Eastern Europe: 886 1,141 +/ 388 Asia: 2,395 4,289 +/ 436 South Central Asia: 463 1,191 +/ 306 South Eastern Asia: 1,004 1,551 +/ 367 Western Asia: / 212 Africa: 382 1,092 +/ 382 Eastern Africa: / 273 Middle Africa: / 48 Northern Africa: / 224 Southern Africa: / 100 Western Africa: / 130 Oceania: / 107 Australia and New Zealand / 105 Fiji 0 0 +/ 95 Americas: 1,948 5,918 +/ 520 Latin America: 1,647 5,542 +/ 509 Northern America: / 157 US Census Bureau, Census 2000 and ACS, Estimates Limited English Proficiency Estimates Another topic worthy of consideration is the size of the area s Limited English Proficiency population. The most recent data available on this topic is from the American Community Survey, Estimates. The following table shows that proportion of the region s population that speaks English less than well is nearly half the proportion of the same population at the state level and significantly smaller than the national VWCC Data and Trends Investigation 10

14 proportion. However, one should consider that that population appears to be growing rapidly. The Limited English Proficiency population has increased by 88.5 percent since 2000 in the Roanoke MSA. Approximately 48 percent of the Roanoke Limited English Proficiency population is made up of primarily Spanish speakers. The Spanish speaking Limited English Proficiency community has increased 122 percent since There are significant concentrations of Chinese, Vietnamese, Hindi, Serbo Croatian, among other languages represented in the study area. If this trend continues there may be a need for outreach through various regional partners that have regular contact with the Limited English Proficiency Community like Refugee and Immigration Services to market English as a Second Language Courses. VWCC Data and Trends Investigation 11

15 Limited English Proficiency Data: Population Over 5 Years of Age, Estimates Total: Speaks English less than 'very well' % Speaks English less than 'very well' Spanish or Spanish Creole: Speak English less than "very well" French (incl. Patois, Cajun): Speak English less than "very well" French Creole: Speak English less than "very well" Italian: Speak English less than "very well" Portuguese or Portuguese Creole: Speak English less than "very well" German: Speak English less than "very well" Yiddish: Speak English less than "very well" Other West Germanic languages: Speak English less than "very well" Scandinavian languages: Speak English less than "very well" Greek: Speak English less than "very well" Russian: Speak English less than "very well" Polish: Speak English less than "very well" Serbo Croatian: Speak English less than "very well" Other Slavic languages: Speak English less than "very well" Armenian: Speak English less than "very well" Persian: Speak English less than "very well" Gujarati: Speak English less than "very well" Hindi: Speak English less than "very well" Urdu: Speak English less than "very well" Other Indic languages: Speak English less than "very well" Other Indo European languages: Speak English less than "very well" Chinese: Speak English less than "very well" Japanese: Speak English less than "very well" Korean: Speak English less than "very well" Mon Khmer, Cambodian: Speak English less than "very well" Hmong: Speak English less than "very well" Thai: Speak English less than "very well" Laotian: Speak English less than "very well" Vietnamese: Speak English less than "very well" Other Asian languages: Speak English less than "very well" Tagalog: Speak English less than "very well" Other Pacific Island languages: Speak English less than "very well" Navajo: Speak English less than "very well" Other Native North American languages: Speak English less than "very well" Hungarian: Speak English less than "very well" Arabic: Speak English less than "very well" Hebrew: Speak English less than "very well" African languages: Speak English less than "very well" Other and unspecified languages: Speak English less than "very well" Botetourt County, Craig County, Franklin County, Roanoke County, Roanoke city, Salem city, Virginia Roanoke MSA Virginia United States Estimate Estimate Estimate Estimate Estimate Estimate Estimate Estimate Estimate 31,346 4,791 52,695 87,287 89,606 23, ,146 7,419, ,433, ,166 3, , ,124 24,950, % 0.2% 1.7% 2.5% 4.1% 3.0% 2.7% 5.6% 8.7% ,164 2,122 3, , ,452 36,170, , , ,794 16,433, ,752 1,320, , , , , , , , , , , , , , , ,787 1,102, , , , , , , , , , , , , ,628 79, , , , , , , , , , , , , , , , , , , , , , , , , , , , , , , , , , , , , , , , , , , ,491 2,723, ,165 1,502, , , , , ,821 1,122, , , , , , , , , , , ,018 81, , , ,425 76, ,221 1,330, , , , , , , ,544 1,566, , , , , , , , , , , , ,942 90, , , , , , , , , , , , , , , ,557 Source: US Census Bureau, American Community Survey, Estimates. VWCC Data and Trends Investigation 12

16 Household Demographics Much has been written regarding the changing nature of the household. This has great potential to impact the nature of society and of the economy in the future. Institutions will likely need to consider how they approach education and workforce development to ensure that the maximum number of individuals is impacted and to help ensure a strong, healthy workforce. In spite of data that suggests that the number of single parent households is decreasing in the study area, there remain significant numbers of single parent households. Students with parenting responsibilities will likely need specialized support services that are not typically required by students without such responsibilities. This population may be better served through distance learning and other hybrid offerings that allow a more flexible schedule to completing assignments. The table below illustrates the trend in household demographics from 2000 to When reading the table below please keep in mind that a family household consists of a householder and at least one other person related to the householder by birth, marriage, or adoption and a nonfamily household may contain only one person or additional people who are not of any relation to the householder. By Census definition, a householder must be at least 15 years of age. Roanoke MSA: Household Demographics % Change: 2000 to 2005 % Change: 2005 to 2011 Total Households 119, , , % 3.0% Family Households 80,041 77,115 83, % 7.9% With Own Children Under 18 Years of Age 34,076 31,964 30, % 5.6% Married Couple Family 62,022 59,050 63, % 7.6% With Own Children Under 18 Years of Age 24,230 21,600 21, % 2.1% Female Householder, No Husband Present 13,772 12,629 15, % 20.2% With Own Children Under 18 Years of Age 7,707 7,455 7, % 5.5% Male Householder, No Wife Present 4,247 5,436 4, % 16.7% With Own Children Under 18 Years of Age 2,139 2,909 1, % 32.1% Nonfamily Households 39,325 43,847 41, % 5.6% Householder Living Alone 33,716 38,151 34, % 9.8% Householder 65 Years and Over 12,887 14,114 13, % 2.9% Households with Individuals Under 18 Years 37,513 36,088 35, % 2.3% Households with Individuals 65 Years and Over 31,087 32,339 35, % 9.0% Average Household Size Average Family Size Source: US Census Bureau, Census 2000 and American Community Survey, 2005 and Educational Attainment The educational attainment of the overall service area population as well as how the service area population compares to other communities are important variables to consider. The following table includes educational attainment data for the Roanoke MSA from the US Census Bureau. VWCC Data and Trends Investigation 13

17 Roanoke MSA: Educational Attainment for Population 25 Years and Over Percent Change Number Percent Number Percent Number Percent High School Diploma or Higher 159, % 163, % 188, % 17.7% Associate's Degree or Higher 55, % 61, % 75, % 34.3% Bachelor's Degree or Higher 42, % 45, % 55, % 32.1% Source: US Census Bureau, 2000 Census, American Community Survey, 2005 and The table shows there have been continual improvements in the number of adults over 25 with diplomas, Associate s Degrees and Bachelor s Degrees over the past 11 years. The most impressive increase over the long term has been the number high school graduates. More than 86 percent of the area s residents over 25 now have at least a diploma and more than a third have earned as Associate s Degree. The large increase in the number of those over 25 who have earned a diploma but have not pursued higher educational opportunities suggests there may be a growing market for training since most jobs paying a living increasingly require some training/education above a high school diploma. Please consult the following chart to see how the Roanoke MSA compares to several comparison regions. These regions were picked because they are often cited in benchmarking studies. The Roanoke MSA is comparable to most of the communities in the analysis but is still slightly lower than nearly all of the communities. The following table illustrates educational attainment by locality in , the most recent data available for every locality in the study area. VWCC Data and Trends Investigation 14

18 Educational Attainment by Locality for Population Over 25 in % High School Diploma or Higher % Associate's Degree or Higher % Bachelor's Degree or Higher Botetourt County 89.5% 33.4% 22.9% Craig County 89.2% 23.8% 15.0% Franklin County 81.1% 24.6% 17.6% Roanoke County 90.4% 41.7% 32.8% City of Roanoke 81.5% 29.6% 22.4% City of Salem 87.9% 38.4% 30.1% Source: US Census Bureau, American Community Survey, Poverty and Income Statistics available on poverty show that the regional poverty rate is slightly higher than the state rate but below the national rate. The number of individuals in poverty has increased approximately 28 percent over estimates available when the strategic plan was last updated. This is an effect of the economic downturn and ongoing levels of elevated unemployment experienced since Study Area Poverty Statistics in 2011 All Ages in Poverty Under 18 in Poverty Number Percent Number Percent Botetourt County 2, Craig County Franklin County 7, , Roanoke County 7, , Roanoke city 18, , Salem city 2, Roanoke MSA 38, Virginia 912, , United States 48,452, ,386, Source: US Census Bureau, Small Area Income and Poverty Estimates, The following statistics show that Botetourt and Roanoke Counties have the highest household and family incomes in the region and that the incomes in those counties approach the level of incomes in the Commonwealth. The study area s overall household and family incomes lag behind the state and national incomes. It is important to note however that the cost of living does help raise the relative levels of overall regional income to a level much closer to parity with state and national numbers. VWCC Data and Trends Investigation 15

19 Income Statistics for the Study Area, 2011 Median Household Income, 2011 Percent of US MHI Median Family Income, 2011 Percent of US MFI Botetourt County 65, % 75, % Craig County 54, % 66, % Franklin County 47, % 55, % Roanoke County 62, % 77, % City of Roanoke 37, % 47, % City of Salem 48, % 61, % Roanoke MSA 49, % 62, % Virginia 63, % 75, % United States 52, % 64, % Source: US Census Bureau, American Community Survey, Estimates. As noted previously, once price differences are taken into account, regional incomes are much closer to state and national averages. Per capita personal income statistics show that per capita income is surpasses the national average when the region s lower cost of living is considered. The region s income growth rate is higher than that of the overall nation. The region has not kept pace with the state however both in terms of income level and growth rate. BEA Per Capita Personal Income and Regional Price Parities Per Capita Personal Income (Thousands of Dollars) Adj. Per Capita Personal Income (Thousands of Dollars) % Change Roanoke MSA % Virginia % United States % Source: Aten, Figueroa, Martin, Regional Price Parities for States and Metro Areas, , Bureau of Economic Analysis. No one can deny the importance of educational attainment in increasing the earnings of a population. Consider the following chart from the Bureau of Labor Statistics describing unemployment rates and earnings by educational attainment. Increasing educational attainment appears to be the most direct way of increasing prosperity and incomes. And, particularly if a region is able to capture these trained individuals and provide them with meaningful work opportunities, education and training is a direct support of wage growth. VWCC Data and Trends Investigation 16

20 Technology Usage With technological changes increasingly impacting society, workforce, employers, and higher education, it is important to consider the level of technology usage in the Roanoke MSA as it compares to the nation and to the Commonwealth. The table below includes data produced for a regional study on broadband technology deployment and was developed from a statistically valid survey instrument covering the urban core of the Roanoke Region. The percentage of households in Roanoke with computer access is lower than in the state and nation. The percentage of households having access to internet in the home lacks significantly behind the state and is slightly lower than the national average. This may be at least partially a reflection of the older population in the Roanoke Region. Computer and Broadband Usage in the Study Area Region % Households without Computer Access % Households without Internet Access % Households with Computer Access % Households with Internet Access Roanoke Region 68.0% 32.0% 64.0% 36.0% Virginia 79.8% 20.2% 73.0% 27.0% United States 76.7% 23.3% 67.0% 33.0% Source: Design Nine, Inc., Broadband Survey for the Roanoke Valley Region, 2012; Current Population Survey, US Census Bureau, Information from the Pew Internet and American Life Project suggests that internet adoption increased steadily from 2000 at about 37 percent nationally until early 2009 when the rate of internet users approached 70%. The rate has remained at a similar level over the past three years. Data sources are woefully inadequate in describing the most current trends which include among other things the proliferation of smart phones. Households with desktop computer access may not be expected to increase over the next few years as the popularity of tablets, smart phones, and other mobile data viewing devices increases. Data quoted across several publications online note that sales of smart phones outnumber VWCC Data and Trends Investigation 17

21 sales of more basic cell phones. As consumers rapidly adopt this technology, it can be assured that demand for web sites and web content maximized for smart phones will rise as well. Commuting Patterns Virginia Western Community College serves a region consisting of the Counties of Botetourt, Craig, Franklin and Roanoke as well as the Cities of Roanoke and Salem. Located, however, in the City of Roanoke in the core of the metropolitan statistical area, it is worthwhile to note that the college attracts students from other counties near the Roanoke metro area. The Roanoke area has strong economic and employment relationships with several adjacent counties that are outside of the typical metro definition and of the VCCS defined community college service area. Commuting data helps reveal some of these spatial relationships. The development of additional unique programming as well as further shifts in the commuting relationships with outlying areas may mean that Virginia Western Community College could expect to gain additional enrollment from outside of its service area. Commuting Data, Roanoke MSA, 2010 Top 10 Places Residents are Commuting To Area Workers Montgomery County, VA 3,101 Lynchburg City, VA 1,681 Henrico County, VA 1,663 Fairfax County, VA 1,340 Henry County, VA 1,069 Richmond City, VA 1,044 Martinsville City, VA 984 Chesterfield County, VA 954 Bedford County, VA 870 Danville City, VA 806 Top 10 Places Workers are Commuting From Area Workers Bedford County, VA 8,315 Montgomery County, VA 5,117 Henry County, VA 2,253 Lynchburg City, VA 1,670 Pulaski County, VA 1,469 Fairfax County, VA 1,385 Campbell County, VA 1,365 Floyd County, VA 1,270 Henrico County, VA 1,223 Augusta County, VA 1,189 Source: US Census Bureau, LEHD, VWCC Data and Trends Investigation 18
22 Economic Data and Trends Gross Metropolitan Product Data on the economies of the metropolitan areas in Virginia suggest that the Roanoke area is growing at a slower pace than the state overall and most of the metros in the Commonwealth with the exception of Blacksburg Christiansburg Radford, Danville, and Winchester. Roanoke remains the fourth largest metro economy in Virginia, ranking only behind Northern Virginia, Hampton Roads, and Richmond. Of small to midsize metros in the Commonwealth, Roanoke remains the economic leader. GDP by Metropolitan Area (millions of current dollars) Area % Change Blacksburg Christiansburg Radford, VA (MSA) 4,834 5,174 5,090 5,141 5, % Charlottesville, VA (MSA) 8,418 8,772 9,114 9,246 9, % Danville, VA (MSA) 2,833 2,844 2,809 2,882 2, % Harrisonburg, VA (MSA) 5,077 5,440 5,516 5,921 6, % Kingsport Bristol Bristol, TN VA (MSA) 8,937 9,197 9,328 9,395 9, % Lynchburg, VA (MSA) 7,838 8,045 8,326 8,443 8, % Richmond, VA (MSA) 58,099 60,348 62,223 62,676 64, % Roanoke, VA (MSA) 12,141 12,674 13,060 13,206 13, % Virginia Beach Norfolk Newport News, VA NC (MSA) 72,813 76,564 78,644 79,396 80, % Washington Arlington Alexandria, DC VA MD WV (MSA) 366, , , , , % Winchester, VA WV (MSA) 4,689 4,694 4,644 4,832 5, % Virginia 374, , , , , % United States 13,289,235 13,936,199 14,193,120 13,834,700 14,416, % Source: Bureau of Economic Analysis VWCC Data and Trends Investigation 19
23 Cost of Living The Roanoke MSA maintains a lower cost of living when compared to many other metropolitan areas. Its cost of living when compared to other metropolitan areas in the south does fluctuate periodically, but usually Roanoke has a lower cost of living than a large number of southeast US metros. The most recent data indicated that only 29 metros had a lower cost of living in the entire United States. The area s cost of doing business was recently lowered by Moody s as well, which is now at roughly 83 percent the national average. Cost of Living Index Region Index Washington, D.C Boston, MA Newark, NJ Chicago, IL Richmond, VA National Average 100 Asheville, NC 99.4 Chattanooga, TN 93.7 Roanoke Region 88.7 Source: ACCRA, Third Quarter, Taxable Sales Growth in taxable sales appears to be fairly stagnant across the region in more recent years, having come out of a precipitous decline in the years including and immediately following the Great Recession. Most of the commercial development appears to be occurring in Roanoke County and the City of Salem. Franklin County and Botetourt, which had seen stronger levels of growth leading up to the recession have yet to recover from the recession s impacts as is true for most of the region and for the Commonwealth as a whole, though the state has outperformed the region in the most recent data. Taxable Sales during the Year Ending December 31 % Change % Change Alleghany County $60,889,587 $71,814,959 $63,184,416 $63,621,550 $64,618,043 $68,464, % 6.0% Botetourt County $188,191,922 $184,202,641 $181,654,656 $166,563,450 $168,568,628 $178,813, % 6.1% Craig County $11,643,044 $12,251,839 $13,283,296 $12,886,883 $12,473,955 $12,414, % -0.5% Franklin County $398,807,407 $397,420,312 $379,937,250 $340,399,968 $355,992,663 $353,790, % -0.6% Roanoke County $868,219,813 $930,227,142 $912,912,931 $890,021,337 $883,346,323 $956,706, % 8.3% City of Covington $107,214,692 $109,441,565 $113,538,910 $107,984,326 $107,724,643 $111,363, % 3.4% City of Roanoke $1,876,508,609 $1,900,930,872 $1,925,487,309 $1,692,267,903 $1,676,331,018 $1,649,614, % -1.6% City of Salem $494,023,931 $492,277,031 $497,506,054 $460,591,278 $470,303,708 $512,984, % 9.1% Roanoke MSA $3,837,394,726 $3,917,309,837 $3,910,781,496 $3,562,730,818 $3,567,016,295 $3,664,323, % 2.7% Virginia $89,478,625,283 $92,043,248,947 $90,106,122,080 $85,869,132,300 $86,420,963,843 $89,070,341, % 3.1% Source: Virginia Department of Taxation, Weldon Cooper Center of Public Service VWCC Data and Trends Investigation 20
24 Annual Building Permits Residential construction activity is returning in the Roanoke MSA. Roanoke s residential sector appears to be improving more rapidly than the state and nation in recent years. The decline, however, was so severe that the marginal improvements seen in recent years will not be a tremendous help to the construction sector which saw severe employment declines in the region following the Great Recession. Several analysts have noted that credit conditions remain strong in the Roanoke metro and so continued improvements in the national and regional economy may translate to more home building in future years. The region is extremely unlikely to see activity return to pre recessionary levels in the near future. Single Family Building Permits % Change % Change % Change Year Botetourt % 12.7% 16.7% Craig % 255.6% 236.8% Franklin % 4.2% 0.9% Roanoke City % 42.5% 2.1% Roanoke % 27.5% 28.5% Salem City % 41.4% 15.0% Roanoke MSA 1,244 1, % 5.6% 16.8% Virginia 38,977 30,944 19,939 21,452 16,149 15, % 27.2% 3.2% United States 1,378, , , , , , % 5.1% 6.4% Annual Home Sales Home sales remain well below levels seen prior to the Great Recession. Median sales prices are also down significantly. The region saw marginal year over year improvements in 2011 in the number of houses sold. This improvement has not yet translated in improvement in median sales prices. Further improvement and a reduction in the inventory of foreclosures and distressed properties will likely be required before upward pressure is exerted upon housing prices in the region. Selected Home Sales Statistics, Roanoke VA MLS % % % Change Change Change Median Sales Price Roanoke Region 126, , , , , , , , , , , Number Sold Roanoke Region 4,859 4,896 5,259 5,393 5,831 5,556 4,964 3,732 3,707 3,269 3, Median Sales Price VA NA NA NA NA NA NA 247, , , , ,569 NA Number Sold VA MLS Total 103, , , , , ,699 94,662 85,275 83,409 82,809 83, Source: Virginia Association of Realtors and US Statistical Abstract. VWCC Data and Trends Investigation 21
25 Unemployment The study area experienced a large increase in unemployment associated with the Great Recession. Unemployment has decreased since its peak in 2009 but there remains significant numbers of unemployed in the region. Since the last strategic plan was produced for Virginia Western Community College, the unemployment rate in the study area surpassed the state rate and has remained higher than the overall Commonwealth rate of unemployment since. The unemployment rate remains below the national rate but there remain significant numbers of unemployed individuals in the study area. Job growth has been anemic in the Roanoke Region in more recent years and layoffs returned, impacting several large employers in late 2011 and throughout Marginal improvements in the unemployment rate continue and should be expected throughout the near term. As the nation approaches a faster economic growth rate, lower unemployment should once again impact the Roanoke Region. Unemployment Trends, Roanoke MSA Year Civilian Labor Force Employment Unemployment Unemployment Rate (%) , ,808 4, , ,433 4, , ,840 6, , ,309 11, , ,968 11, , ,970 10, Virginia Year Civilian Labor Force Employment Unemployment Unemployment Rate (%) ,983,717 3,862, , ,017,176 3,894, , ,111,322 3,947, , ,203,839 3,915, , ,255,162 3,960, , ,306,174 4,037, , United States Year Civilian Labor Force Employment Unemployment Unemployment Rate (%) ,428, ,427,000 7,001, ,124, ,047,000 7,078, ,287, ,362,000 8,924, ,142, ,877,000 14,265, ,889, ,064,000 14,825, ,617, ,869,000 13,747, Source: Virginia Employment Commission, VWCC Data and Trends Investigation 22
26 Employment That statistics immediately preceding this discussion were from the Local Area Unemployment Statistics program and based off of a survey of households. The following statistics are based off of a survey of employers located in the study area. There are surprising differences including a decline in employment of 1.3 percent within the last year. It is possible the other table reflects an increase in entrepreneurial employment as well as an increase in out commuting to surrounding localities to find employment. Of course, since both sources are produced used statistically sampled data, it is possible that errors have been introduced. Regardless, both sources paint a picture of weaker than normal employment growth stemming from the recession and continuing into the recovery period. Manufacturing employment has been surprisingly stable over the past five years plotting only a minor decline during the Great Recession. The intervening years since 2009 have been years marked by growth in the sector with the most growth in manufacturing seen in at least the last decade at least. Manufacturing had stable employment from 2011 to 2012 in spite of layoffs from ITT Exelis. Increase in demand for goods used in construction (steel, doors/windows) and other goods manufacturing in Roanoke has been cited as a reason for strong performance in the sector. Employment Trends, Roanoke MSA Nov 12 Nov 11 Nov 07 % Change 2011 to 2012 Total nonfarm 156, , , % 5.1% Total private 133, , , % 6.0% Manufacturing 16,700 16,700 16, % 1.2% Trade, transportation, and utilities 35,900 36,500 37, % 3.2% Information 1,700 1,800 2, % 32.0% Financial activities 7,800 7,800 8, % 10.3% Professional and business services 19,600 19,900 22, % 12.9% Education and health services 24,600 24,700 23, % 5.6% Leisure and hospitality 12,600 13,000 13, % 8.0% Other services 7,000 7,100 7, % 0.0% Government 22,400 22,500 22, % 0.9% % Change 2007 to 2012 Source: Virginia Employment Commission, Current Employment Statistics, VWCC Data and Trends Investigation 23
27 Underemployment The Virginia Economic Development Partnership produces underemployment estimates for local areas based off results from the Current Population Survey. Several economic studies produced for the region have found that there was a significant problem within the region in terms of underemployment. Because of a lack of statistics on the matter at the state and federal levels it is unknown how the region compares but it is thought that regional underemployment is generally higher than at the state level particularly. An individual is considered underemployed they are not actively seeking employment currently and are not included in unemployment numbers due to this reason but have sought work in the last 12 months; when he or she is not currently looking for work due to lack of child care, transportation, or some other similar reason; when someone is working part time but desires full time work and cannot find it; when he or she holds multiple jobs; and when he or she is employed in a position that does not sufficiently use their skillsets or when a job underpays the worker given his/her contribution to output. Roanoke MSA: Underemployment Statistics Locality Labor Force Employed Unemployed Underemployment Rate Underemployed Botetourt County, VA Craig County, VA Franklin County, VA Roanoke County, VA Roanoke city, VA Salem city, VA Roanoke MSA 160, ,304 9, % 15,757 Source: Virginia Economic Development Partnership, 2012 VWCC Data and Trends Investigation 24
28 Number of Employers by Size of Establishment The bulk of employers within the region are smaller establishments employing fewer than 20 employers. Establishments employing fewer than 20 represent 84.2 percent of employers in the study area. Roanoke MSA: Employers by Size of Establishment Roanoke MSA Virginia Number % Number % 0 to 4 employees 4, % 138, % 5 to 9 employees 1, % 37, % 10 to 19 employees 1, % 26, % 20 to 49 employees % 19, % 50 to 99 employees % 6, % 100 to 249 employees % 3, % 250 to 499 employees % % 500 to 999 employees % % 1,000 and over employees 8 0.1% % Total 8, % 234, % Source: VEC, QCEW, 2nd Quarter VWCC Data and Trends Investigation 25
The goal is to transform data into information, and information into insight. Carly Fiorina
 DEMOGRAPHICS & DATA The goal is to transform data into information, and information into insight. Carly Fiorina 11 MILWAUKEE CITYWIDE POLICY PLAN This chapter presents data and trends in the city s population
Lloyd Potter is the Texas State Demographer and the Director of the Texas State Data Center based at the University of Texas at San Antonio.
 Lloyd Potter is the Texas State Demographer and the Director of the Texas State Data Center based at the University of Texas at San Antonio. 1 2 Texas population in 2014 was just under 27 million and was
Race and Ethnicity. Racial and Ethnic Characteristics for Bellevue
 The Census contains a great deal of information that outlines the increasing level of diversity in our community. Among the demographic trends outlined in this section of the report will be race, ethnicity,
San Diego County Demographics Profile North Central Region 2011 Population Estimates
 County of San Diego Community Profiles by Region and Subregional Area San Diego County Demographics Profile North Central Region 2011 Population Estimates Published March 2013 County of San Diego, Health
Demographic Analysis of the Salt River Pima-Maricopa Indian Community Using 2010 Census and 2010 American Community Survey Estimates
 Demographic Analysis of the Salt River Pima-Maricopa Indian Community Using 2010 Census and 2010 American Community Survey Estimates Completed for: Grants & Contract Office The Salt River Pima-Maricopa
Rural America At A Glance
 United States Department of Agriculture Rural America At A Glance 2014 Edition Overview While the U.S. economy is now in its sixth year of recovery from the Great Recession of 2007-09, its performance
Undergraduate Degree Completion by Age 25 to 29 for Those Who Enter College 1947 to 2002
 Undergraduate Degree Completion by Age 25 to 29 for Those Who Enter College 1947 to 2002 About half of those who start higher education have completed a bachelor's degree by the ages of 25 to 29 years.
Projections of the Size and Composition of the U.S. Population: 2014 to 2060 Population Estimates and Projections
 Projections of the Size and Composition of the U.S. Population: to Population Estimates and Projections Current Population Reports By Sandra L. Colby and Jennifer M. Ortman Issued March 15 P25-1143 INTRODUCTION
County Demographics, Economy & Housing Market
 County Demographics, Economy & Housing Market County Demographics Palm Beach County is Florida's third most populous county with 7% of Florida's population. The county's total estimated population for
Indiana s Latino Population: Demographic and Economic Perspectives
 Prepared by the Jerry Conover Carol Rogers Matt Kinghorn www.ibrc.indiana.edu/briefs/latinos-apr07.pdf National & Click to edit Master title style Local Population Trends Share of Total U.S. Latino Population
Summary. Abbas P. Grammy 1 Professor of Economics California State University, Bakersfield
 The State of the Economy: Kern County, California Summary Abbas P. Grammy 1 Professor of Economics California State University, Bakersfield Kern County households follow national trends. They turned less
A Portrait of Seattle s Low-Income Working Population
 A Portrait of Seattle s Low-Income Working Population December 2011 Support provided by the City of Seattle Office of Economic Development 1 INTRODUCTION The Great Recession, now over two years gone, has
Who lives in New Orleans and the metro area now? Based on 2012 U.S. Census Bureau data
 Who lives in New Orleans and the metro area now? Based on 2012 U.S. Census Bureau data Vicki Mack and Elaine Ortiz, Greater New Orleans Community Data Center September 26, 2013 This brief examines 2012
SELECTED POPULATION PROFILE IN THE UNITED STATES. 2013 American Community Survey 1-Year Estimates
 S0201 SELECTED POPULATION PROFILE IN THE UNITED STATES 2013 American Community Survey 1-Year Estimates Supporting documentation on code lists, subject definitions, data accuracy, and statistical testing
SELECTED SOCIAL CHARACTERISTICS IN THE UNITED STATES. 2012 American Community Survey 1-Year Estimates
 DP02 SELECTED SOCIAL CHARACTERISTICS IN THE UNITED STATES 2012 American Community Survey 1-Year Estimates Supporting documentation on code lists, subject definitions, data accuracy, and statistical testing
The recession of 2007 2009, a
 Employment outlook: Labor force projections to : a more slowly growing workforce The projected labor force growth over the next 10 years will be affected by the aging of the baby-boom generation; as a
The Recession of 2007 2009
 The Recession of 2007 2009 February 2012 A general slowdown in economic activity, a downturn in the business cycle, a reduction in the amount of goods and services produced and sold these are all characteristics
Demographic Profile of Wichita Unemployment Insurance Beneficiaries Q2 2014
 Demographic Profile of Wichita Unemployment Insurance Beneficiaries Q2 2014 The Bureau of Labor Statistics defines an unemployed person as one 16 years and older having no employment and having made specific
The translated materials listed in Table 1 are available on the CMS website at the following locations:
 DEPARTMENT OF HEALTH & HUMAN SERVICES Centers for Medicare & Medicaid Services 7500 Security Boulevard Baltimore, Maryland 21244-1850 CENTER FOR MEDICARE DATE: September 9, 2014 TO: FROM: Medicare Advantage
A Geographic Profile of. Chicago Lawn, Gage Park, West Elsdon and West Lawn. Neighborhoods Served by. The Southwest Organizing Project
 A Geographic Profile of Chicago Lawn, Gage Park, West Elsdon and West Lawn Neighborhoods Served by The Southwest Organizing Project The Southwest Organizing Project (SWOP) is a broad based community organization
Barnstable County, MA: Populations of The Fifteen Towns of Cape Cod
 Cape Cod Bay Barnstable County, MA (Cape Cod) Barnstable County, MA: Populations of The Fifteen Towns of Cape Cod Town Census 2000 Population 1990 Census Population Recent Growth (1990 2000) Bourne 18,721
SalarieS of chemists fall
 ACS news SalarieS of chemists fall Unemployment reaches new heights in 2009 as recession hits profession hard The economic recession has taken its toll on chemists. Despite holding up fairly well in previous
King County s Changing Demographics
 King County s Changing Demographics A View of Our Increasing Diversity Chandler Felt, Demographer King County Office of Performance, Strategy and Budget King County Council, June 5, 2013 A note on sources
Pew Study: American Middle Class is Steadily Shrinking
 Pew Study: American Middle Class is Steadily Shrinking December 23, 2015 by Gary D. Halbert of ProFutures Investments IN THIS ISSUE: 1. Pew Research: American Middle Class is Steadily Shrinking 2. Pew
Welcome to Radford University 2013 Education Career Fair
 Welcome to Radford University 2013 Education Career Fair Amherst County Schools, Amherst, VA : Positions Available: Elementary, Secondary English, Secondary Math, Secondary Social Studies and History,
Investment Company Institute and the Securities Industry Association. Equity Ownership
 Investment Company Institute and the Securities Industry Association Equity Ownership in America, 2005 Investment Company Institute and the Securities Industry Association Equity Ownership in America,
2007 Denver Regional Workforce Gap Analysis. New Picture Here (this is a placeholder)
") 2007 Denver Regional Workforce Gap Analysis New Picture Here (this is a placeholder) September 14, 2007 ABOUT DEVELOPMENT RESEARCH PARTNERS Development Research Partners specializes in economic research
2007 Denver Regional Workforce Gap Analysis New Picture Here (this is a placeholder) September 14, 2007 ABOUT DEVELOPMENT RESEARCH PARTNERS Development Research Partners specializes in economic research
Ohio Hispanic Americans
 Ohio Hispanic Americans Ohio s Hispanic community is comprised of more than 383,000 people, accounting for 3.3 percent of the state s total population. According to the 2013 American Community Survey by
Women, Wages and Work A report prepared by the UNC Charlotte Urban Institute for the Women s Summit April 11, 2011
 A report prepared by the UNC Charlotte Urban Institute for the Women s Summit April 11, 2011 A report prepared for the Women s Summit by the UNC Charlotte Urban Institute 1 Table of Contents Table of Contents...
COMMONWEALTH OF VIRGINIA VIRGINIA COMMUNITY COLLEGE SYSTEM WORKFORCE INNOVATION AND OPPORTUNITY ACT
 COMMONWEALTH OF VIRGINIA VIRGINIA COMMUNITY COLLEGE SYSTEM WORKFORCE INNOVATION AND OPPORTUNITY ACT The Virginia Community College System VIRGINIA WORKFORCE LETTER (VWL) #15-03 TO: LOCAL WORKFORCE DEVELOPMENT
Demographic and Economic Profile. Mississippi. Updated May 2006
 Demographic and Economic Profile Mississippi Updated May 2006 Metro and Nonmetro Counties in Mississippi Based on the most recent listing of core based statistical areas by the Office of Management and
Demographic Profile of Wichita Unemployment Insurance Beneficiaries Q3 2015
 Demographic Profile of Wichita Unemployment Insurance Beneficiaries Q3 2015 The Bureau of Labor Statistics defines an unemployed person as one 16 years and older having no employment and having made specific
During the past century,
 Academic preparation is still a core function of community colleges. But today their mission is more comprehensive, thanks to a gradual shift toward vocational education, job training, and programs catering
An Equity Profile of the Kansas City Region. Summary. Overview. The Equity Indicators Framework. central to the region s economic success now and
 An Equity Profile of the Kansas City Region PolicyLink and PERE An Equity Profile of the Kansas City Region Summary Overview Across the country, regional planning organizations, community organizations
Demographic Report. Prepared On: 5/19/2014 1:29:35 PM Page 1 of 10. Bloomington
 2014 Estimated Population 83,148 2019 Projected Population 85,984 2010 Census Population 80,466 2000 Census Population 70,657 Growth 2010-2014 3.33% Growth 2014-2019 3.41% 2014 Estimated Median Age 24.44
Employment Recovery in Urban Areas following the Great Recession
 Employment Recovery in Urban Areas following the Great Recession Ryan Howley Economist Bureau of Labor Statistics, Washington, DC Toby Paterson Economist Employment Security Department, Washington State
COMMONWEALTH OF VIRGINIA VIRGINIA COMMUNITY COLLEGE SYSTEM WORKFORCE INNOVATION AND OPPORTUNITY ACT
 COMMONWEALTH OF VIRGINIA VIRGINIA COMMUNITY COLLEGE SYSTEM WORKFORCE INNOVATION AND OPPORTUNITY ACT The Virginia Community College System VIRGINIA WORKFORCE LETTER (VWL) #14-18 TO: LOCAL WORKFORCE DEVELOPMENT
Employment in the United States is recovering slowly from the
 Employment Patterns During the Recovery: Who Are Getting the Jobs and Why? By Ayşegül Şahin and Jonathan L. Willis Employment in the United States is recovering slowly from the Great Recession. After declining
Trends In Long-term Unemployment
 MARCH 2015 Trends In Long-term Unemployment Karen Kosanovich and Eleni Theodossiou Sherman Long-term unemployment reached historically high levels following the Great Recession of 2007 2009. Both the number
Language Projections: 2010 to 2020
 Language Projections: 2010 to 2020 Jennifer M. Ortman 1 Population Division U.S. Census Bureau Hyon B. Shin 2 Social, Economic, and Housing Statistics Division U.S. Census Bureau Presented at the Annual
College Enrollment Hits All-Time High, Fueled by Community College Surge
 Enrollment Hits All-Time High, Fueled by Community Surge FOR RELEASE: OCTOBER 29, 2009 Paul Taylor, Project Director Richard Fry, Senior Researcher Wendy Wang, Research Associate Daniel Dockterman, Research
Women s Participation in Education and the Workforce. Council of Economic Advisers
 Women s Participation in Education and the Workforce Council of Economic Advisers Updated October 14, 214 Executive Summary Over the past forty years, women have made substantial gains in the workforce
THE PROFESSIONAL AND TECHNICAL WORKFORCE
 Fact Sheet 2013 THE PROFESSIONAL AND TECHNICAL WORKFORCE Introduction The professional and technical workforce is defined to include all workers in the U.S. Bureau of Labor Statistics (BLS) category management,
The Bay Area in 2040
 Chapter 2 The Bay Area in 2040 The Association of Bay Area Governments (ABAG) and the Metropolitan Transportation Commission (MTC) track and forecast the region s demographics and economic trends to inform
When Will the U.S. Job Market Recover?
 March 2012 In this newsletter, we focus on the U.S. job market. The economic recovery post-2008 is often referred to as a "jobless recovery" given the persistently high unemployment rate. In this paper
LEE BUSI N ESS SCHOOL SOUTHERN NEVADA QUARTERLY ECONOMIC FORECAST. Southern Nevada Economy to Continue Growth in 2014 and 2015
 CENTER FOR BUSINESS & ECONOMIC RESEARCH LEE BUSI N ESS SCHOOL SOUTHERN NEVADA QUARTERLY ECONOMIC FORECAST Quarter 2 2014 Southern Nevada Economy to Continue Growth in 2014 and 2015 S ince the end of the
Educational Attainment of Veterans: 2000 to 2009
 Educational Attainment of Veterans: to 9 January 11 NCVAS National Center for Veterans Analysis and Statistics Data Source and Methods Data for this analysis come from years of the Current Population Survey
1. Community Colleges: Definition and National Trends
 1. Community Colleges: Definition and National Trends Community Colleges: Nationally 1200 community colleges 46 % of all U.S. undergraduates are enrolled in community colleges Community Colleges: Nationally
What if York Region were a village of just
 What if York Region were a village of just 00 PEOPLE? York Region is a diverse global village, made up of many different types of people of various backgrounds and languages. York Region is also fast-growing.
Chapter 1 Background. Purpose of the RSCCD Comprehensive Master Plan. Description of RSCCD Santa Ana College Santiago Canyon College
 Rancho Santiago Community College District Comprehensive Master Plan Chapter 1 Background Purpose of the RSCCD Comprehensive Master Plan The Rancho Santiago Community College District Description of RSCCD
Census Profile: New Jersey s Asian American Population
 Census Profile: New Jersey s Asian American Population Asian American Federation of New York Census Information Center Introduction Using data from the 1990 and 2000 U.S. censuses, this profile outlines
A Gender Reversal On Career Aspirations Young Women Now Top Young Men in Valuing a High-Paying Career
 1 A Gender Reversal On Career Aspirations Young Women Now Top Young Men in Valuing a High-Paying Career By Eileen Patten and Kim Parker Career Importance, by Gender % of 18-34-year-olds saying being successful
Technical Report No. 1
 [TYPE THE COMPANY ADDRESS] [TYPE THE COMPANY ADDRESS] The Washington Metropolitan Area 2030 Economic Outlook: Standard Forecast Technical Report No. 1 By Stephen S. Fuller, Ph.D. Dwight Schar Faculty Chair
HEALTH INSURANCE COVERAGE STATUS. 2009-2013 American Community Survey 5-Year Estimates
 S2701 HEALTH INSURANCE COVERAGE STATUS 2009-2013 American Community Survey 5-Year Estimates Supporting documentation on code lists, subject definitions, data accuracy, and statistical testing can be found
2010 Pulse of Pennsylvania s Physician and Physician Assistant Workforce. Bureau of Health Planning
 2010 Pulse of Pennsylvania s Physician and Physician Assistant Workforce Bureau of Health Planning A Report on the 2010 Surveys of Physicians and Physician Assistants Volume 4, June 2012 TABLE OF CONTENTS
Economic Snapshot for February 2013
 Economic Snapshot for February 2013 Christian E. Weller on the State of the Economy Christian E. Weller, associate professor, Department of Public Policy and Public Affairs, University of Massachusetts
THE STATE OF THE ECONOMY
 THE STATE OF THE ECONOMY CARLY HARRISON Portland State University Following data revisions, the economy continues to grow steadily, but slowly, in line with expectations. Gross domestic product has increased,
2015-2016 Iredell County NC Pre-Kindergarten Application
 PARENTS: Please remove this top sheet and keep for your information! 2015-2016 Iredell County Parents/Families must complete this application to apply for the NC Pre-Kindergarten Program (formerly the
Demographic and Economic Profile. North Carolina. Updated June 2006
 Demographic and Economic Profile North Carolina Updated June 2006 Metro and Nonmetro Counties in North Carolina Based on the most recent listing of core based statistical areas by the Office of Management
UWEP Utah Women and Education Project
 Research and Policy Brief UWEP Utah Women and Education Project May 25, 2010 UWEP 2010-204 Women and Higher Education in Utah: A Glimpse at the Past and Present According to Lumina Foundation researchers,
H U M A N R E S O U R C E S
 Introduction I n a knowledge-based economy, the educational attainment and technology savvy of the workforce are strong contributors to a region s overall economic prosperity. This section benchmarks Ohio
Name. Address. City, State, Zip County Phone Number Home: Work: SSN Email Date of Birth (mm/dd/yyyy) Gender. Employment Status
 Gender. Employment Status") Delaware Association for the Education of Young Children (DAEYC) T.E.A.C.H. Early Childhood Delaware (T.E.A.C.H.) Associate Degree Scholarship Application Name Address City, State, Zip County Phone Number
Delaware Association for the Education of Young Children (DAEYC) T.E.A.C.H. Early Childhood Delaware (T.E.A.C.H.) Associate Degree Scholarship Application Name Address City, State, Zip County Phone Number
Marriage and divorce: patterns by gender, race, and educational attainment
 ARTICLE OCTOBER 2013 Marriage and divorce: patterns by gender, race, and educational attainment Using data from the National Longitudinal Survey of Youth 1979 (NLSY79), this article examines s and divorces
Maryland s Job Growth Continues to Lag in 2014 State behind national growth rates for fourth consecutive year
 Maryland s Job Growth Continues to Lag in 2014 State behind national growth rates for fourth consecutive year Job growth in Maryland continued to lag the U.S. in 2014 for the fourth consecutive year. Moreover,
Left Behind: DC s Economic Recovery Is Not Reaching All Residents By Ed Lazere and Marco Guzman 1
 An Affiliate of the Center on Budget and Policy Priorities 820 First Street NE, Suite 460 Washington, DC 20002 (202) 408-1080 Fax (202) 408-8173 www.dcfpi.org Left Behind: DC s Economic Recovery Is Not
Technical Report 1: Regional Demographic Profile
 Technical Report 1: Regional Demographic Profile Compiled by the Piedmont Triad Regional Council January, 2013 Triad Tomorrow Figure 1. Piedmont Triad Region CONTEXT The Piedmont Triad region consists
Neighborhood Diversity Characteristics in Iowa and their Implications for Home Loans and Business Investment
 Neighborhood Diversity Characteristics in Iowa and their Implications for Home Loans and Business Investment Liesl Eathington Dave Swenson Regional Capacity Analysis Program ReCAP Department of Economics,
LICENSED SOCIAL WORKERS IN THE UNITED STATES, 2004 SUPPLEMENT. Chapter 2 of 5. Who Are Licensed Social Workers?
 LICENSED SOCIAL WORKERS IN THE UNITED STATES, 2004 SUPPLEMENT Chapter 2 of 5 Who Are Licensed Social Workers? Prepared by Center for Health Workforce Studies School of Public Health, University at Albany
METRO ATLANTA STILL AMONG FASTEST-GROWING IN NATION
 October 2012 Despite the dour economic news of the past few years, metro Atlanta remains the key economic driver of the Southeast. But, as with all metro areas, challenges abound. One of those challenges
Brief 1 The State of North Carolina: Jobs, Poverty and Family. Jeannine Sato, Center for Child and Family Policy
 Brief 1 The State of North Carolina: Jobs, Poverty and Family Jeannine Sato, Center for Child and Family Policy The connection among jobs, poverty and family well-being is well established. Research shows
Demography. Focus on the three contributors to population change: Fertility, mortality, and migration
 1 Formal Demography Demography Focus on the three contributors to population change: Fertility, mortality, and migration Social Demography Focus on relationship between social, economic, and demographic
Going Nowhere Workers Wages since the Mid-1970s
 Going Nowhere Workers Wages since the Mid-1970s I n the late 1990s, many observers hoped that we had finally broken free of the slow income growth that had bogged down the American middle class for more
Application Trends Survey 2012
 012 Application Trends Survey Survey Report Application Trends Survey 2012 2012 Graduate Management Admission Council. All rights reserved. c The GMAC Survey Series About This Study The 2012 Application
From Higher Education to Work in West Virginia, 2012
 From Higher Education to Work in West Virginia, 2012 Eric Bowen, Research Associate John Deskins, PhD, Director January 2014 Copyright 2014 WVU Research Corporation Funding for this research was provided
Name. Address. City, State, Zip County Phone Number Home: Work: SSN Email Date of Birth (mm/dd/yyyy) Gender. Employment Status
 Gender. Employment Status") Name Address City, State, Zip County Phone Number Home: Work: SSN Email Date of Birth (mm/dd/yyyy) Gender Date: Employment Status Name of Center, FCC or LFCC Address Center, FCC or LFCC Phone Number Center,
Name Address City, State, Zip County Phone Number Home: Work: SSN Email Date of Birth (mm/dd/yyyy) Gender Date: Employment Status Name of Center, FCC or LFCC Address Center, FCC or LFCC Phone Number Center,
Report on the Status of Nursing Education Programs in Pennsylvania
 Report on the Status of Nursing Education Programs in Pennsylvania DATA FROM NURSING EDUCATION PROGRAM ANNUAL REPORTS, 2009 Nursing Education Programs in Pennsylvania 1 July 2010 VOLUME 8 JULY 2010 TABLE
Hispanic Immigration and US Economic Growth. James Gillula Managing Director
 IHS economics Hispanic Immigration and US Economic Growth February 2015 ihs.com James Gillula Managing Director About IHS Economics IHS Economics is a global leader in economic analysis and forecasting.
Welcome to the 2015 Annual Survey of Entrepreneurs
 Welcome to the 2015 Annual Survey of Entrepreneurs DO NOT use this worksheet to respond to the survey, it is intended to assist you with gathering and preparing your data prior to reporting online. Please
CENTER FOR LABOR MARKET STUDIES
 The Complete Breakdown in the High Schoolto Work Transition of Young, Non College Enrolled High School Graduates in the U.S.; The Need for an Immediate National Policy Response Prepared by: Andrew Sum
1960-61. United States
 61-61 United States By, the U.S. population had surpassed 179 million, a gain of 19.0 percent from. The median age had decreased to 29.5 (28.7 for men and.3 for women), the first decline since 1900. The
A New Measure of Educational Success in Texas. Tracking the Success of 8th Graders into and through College
 A New Measure of Educational Success in Texas Tracking the Success of 8th Graders into and through College National Center for Management Systems (NCHEMS) Contents Introduction 1 The Challenge 2 Purpose
Selected Socio-Economic Data. Baker County, Florida
 Selected Socio-Economic Data African American and White, Not Hispanic www.fairvote2020.org www.fairdata2000.com 5-Feb-12 C03002. HISPANIC OR LATINO ORIGIN BY RACE - Universe: TOTAL POPULATION Population
CONGRESS OF THE UNITED STATES CONGRESSIONAL BUDGET OFFICE CBO. The Distribution of Household Income and Federal Taxes, 2008 and 2009
 CONGRESS OF THE UNITED STATES CONGRESSIONAL BUDGET OFFICE Percent 70 The Distribution of Household Income and Federal Taxes, 2008 and 2009 60 50 Before-Tax Income Federal Taxes Top 1 Percent 40 30 20 81st
Gauging Current Conditions: The Economic Outlook and Its Impact on Workers Compensation
 August 2014 Gauging Current Conditions: The Economic Outlook and Its Impact on Workers Compensation The exhibits below are updated to reflect the current economic outlook for factors that typically impact
City of Lynchburg, VA: Housing Assessment
 City of Lynchburg, VA: Housing Assessment Prepared By: Housing Opportunities Made Equal of Virginia, Inc. for the City of Lynchburg CITY OF LYNCHBURG, VA: HOUSING ASSESSMENT 2011 1 List of Maps Map 1.
CHAPTER ONE: DEMOGRAPHIC ELEMENT
 CHAPTER ONE: DEMOGRAPHIC ELEMENT INTRODUCTION One of the basic elements of this comprehensive plan is an analysis of the City of Beaufort s (the City) current and projected demographic makeup. The purpose
Non Farm Payroll Employment Developments among States during the Great Recession and Jobless Recovery
 Non Farm Payroll Employment Developments among States during the Great Recession and Jobless Recovery Prepared by: Paul E. Harrington and Neeta P. Fogg Center for Labor Markets and Policy, Drexel University
Long Island is rapidly losing its lead in private health care coverage. That distinctive mark of middle class success - private
 RESEARCH REPORT Regional Labor Review Fall 1998 Long Island s Ailing Health Care Benefits by Niev Duffy Long Island is rapidly losing its lead in private health care coverage. That distinctive mark of
Supply and Demand Conditions for Electricians. An Update of Labor Market and Electrician Program Data. November, 2009
 Supply and Demand Conditions for Electricians An Update of Labor Market and Electrician Program Data November, 2009 Prepared by Bruce Steuernagel, Labor Market Analyst Office of the Chancellor Minnesota
Strategic Vision 2015: Gateway to the American Dream
 Strategic Vision 2015: Gateway to the American Dream Office of Institutional Research, Planning, and Assessment Northern Virginia Community College November 2010 College Mission With commitment to the
FIRST-TIME HOMEBUYERS: UPDATE FROM THE 2005 AMERICAN HOUSING SURVEY
 FIRST-TIME HOMEBUYERS: UPDATE FROM THE 2005 AMERICAN HOUSING SURVEY In 2005, there were nearly 75 million homeowning households in the United States, representing nearly 69 percent of all households. During
Latinos and Digital Technology, 2010
 February 9, 2011 Latinos and Digital Technology, 2010 FOR FURTHER INFORMATION CONTACT: Gretchen Livingston, Senior Researcher, 1615 L St, N.W., Suite 700 Washington, D.C. 20036 Tel(202) 419-3600 Fax (202)
Summary of Employment, Demographics, and Commuting Patterns for Marion County, Florida
 FLORIDA DEPARTMENT OF ECONOMIC OPPORTUNITY, BUREAU OF LABOR MARKET STATISTICS Summary of Employment, Demographics, and Commuting Patterns for Marion County, Florida March 2015 Contents Labor Shed Analysis...
2011 research report. Comparative Analysis of Prince George s Nonprofit Sector
 2011 research report Comparative Analysis of Prince George s Nonprofit Sector Nonprofi ts mission is to strengthen, educate, and engage nonprofi t organizations so they can successfully achieve their missions.
A Half-Century of California Poverty
 A Half-Century of California Poverty Robert G. Mogull California State University at Sacramento In this article, poverty statistics are examined over the past 50 years for insights on trends. Data were
Report on Nevada s Housing Market
 June Report on Nevada s Housing Market This is the first of a series of reports on Nevada s Housing Market co-presented by the Lied Institute for Real Estate Studies at the University of Nevada, Las Vegas
Who is making ends meet in the Portland region?
 Who is making ends meet in the Portland region? A profile of poverty and self-sufficiency among greater Portland families CC image courtesy of Holly Hayes on Flickr June 2015 Jamin Kimmell, M.U.R.P. Sheila
The New indicator of Minnesota - A SimpleYet Complex Idea
 J Minnesota will have sustainable, strong economic growth Previous wording: Minnesota will have sustained, above average, strong economic growth that is consistent with environmental protection 1990 1993
Changes in Self-Employment: 2010 to 2011
 Changes in Self-Employment: 2010 to 2011 American Community Survey Briefs By China Layne Issued January 2013 ACSBR/11-21 INTRODUCTION From December 2007 to June 2009, the United States experienced an economic
BizBuySell.com Small Business Buyer & Seller Demographic Study
 BizBuySell.com Small Business Buyer & Seller Demographic Study Table of Contents Report Executive Summary Younger, More Diverse Buyers Look to Acquire Retiring Baby Boomer Businesses Female Business Buyers