Field Comparison of Conventional HVAC Systems with a Residential Gas-Engine-Driven Heat Pump
|
|
|
- Arthur Sutton
- 8 years ago
- Views:
Transcription
1 Field Comparison of Conventional HVAC Systems with a Residential Gas-Engine-Driven Heat Pump James D. Miller, Pacific Northwest Laboratory Through its Office of Federal Energy Management Program (FEMP), the U.S. Department of Energy (DOE) provides technical and administrative support to federal agency programs directed at reducing energy consumption and cost in federal buildings and facilities. One such program is the New Technology Demonstration Program (NTDP). In this context, NTDP is a demonstration of a U.S. energy-related technology at a federal site. Through a partnership with a federal site, the utility serving the site, a manufacturer of an energy-related technology, and other organizations associated with these interests, DOE can evaluate new technologies. The partnership of these interests is secured through a Cooperative Research and Development Agreement (CRADA). The Fort Sam Houston (San Antonio, Texas) NTDP is a field evaluation of a 3-ton gas-engine-driven residential heat pump. Details of the technical approach used in the evaluation, including instrumentation and methodology, are presented. Dynamic performance maps, based on field data, are developed for the existing residential furnaces and air conditioners at Fort Sam Houston. These maps are the basis for comparisons between the candidate and current equipment. The approach offers advantages over pre/post-measure evaluations by decoupling the measured equipment performance from the effects of different envelope characteristics, occupant behavior, and weather. Introduction The New Technology Demonstration Program was established by the U.S. Department of Energy in Under the auspices of DOE s Federal Energy Management Program, the New Technology Demonstration Program works to reduce federal sector energy costs and improve overall energy efficiency; introduce new energy-efficient technologies to the federal sector in a more timely manner, thereby narrowing the gap between private sector and federal deployment rates of new technologies; and create jobs in the manufacturing sector by spurring the use of new, U.S. -manufactured energy-efficient and environmentally beneficial technologies. When first established, the New Technology Demonstration Program provided only for evaluation of new technologies at federal sites. FEMP expanded the Program in early 1994 to widen laboratory involvement and provide information about commercially available energy-efficient technologies to the federal sector. FEMP refers to these two program components as Technology Demonstration Projects and Information Transfer. The New Technology Demonstration Project at Fort Sam Houston features a 3-ton gas-engine-driven heat pump that will be installed in a residence at the military base in Spring The heat pump (Harnish et al. 1991) uses a single-cylinder, four-stroke, 5-hp engine fueled by natural gas. Distinctive features include an inherent load-matching capability. By varying engine speed, the unit can be dynamically controlled to provide capacity balanced with thermal loads. This reduces cycling and the associated thermal losses and equipment wear. The unit also produces added heating capacity through engine heat recovery. The goal of the evaluation is to measure the installed field performance of the candidate unit and compare it to that of the existing HVAC equipment in the residences at the base. The thermal measurements and maintenance records will be primary elements in life cycle cost analysis of potential savings from the candidate unit. This paper describes the methods to be used in the comparison and focuses on the development of performance maps for the existing equipment. The performance maps are derived
. In this context, NTDP is a demonstration of a U.S. energy-related technology at a federal site.")
2 Miller from baseline field measurements on a pulse-combustion furnace and an air conditioner during the period of 8/93 to 2/94. Methodology Ideally, a performance comparison of two HVAC units is done side by side under identical operating conditions. While this can be achieved under steady-state testing in the laboratory, dynamic field conditions in houses with occupants are difficult to control to give equivalent sideby-side conditions. A pre/post assessment approach offers some advantages in that the house and possibly the occupants remain the same during the two phases of the test. However, changes in weather and occupant behavior lead to changes in operating conditions and equipment loading that can be addressed only partially with weather normalization techniques. To address these potential problems, a hybrid approach is taken. The approach includes: (1) weather normalized pre/post comparison of energy usage, (2) a side-by-side comparison of seasonal coefficients of performance (COPS), and (3) performance mapping of the existing units followed by a projection of their maps onto the load records from the installed candidate unit. A performance map is a form of empirical model that is used to predict a system s (unit and thermostat) response to a time series of load and operating conditions. The loads and conditions recorded from monitoring the candidate unit drive the performance maps of the existing unit. The result is a prediction of the existing units energy usage under the conditions and loads of the candidate unit. Performance mapping offers advantages over the pre/post and side-by-side comparisons in that changes in weather, loading, and operating conditions are addressed. The key component of the map is a regression-based characterization of part-load performance. Maps should be capable of projecting to a wide range of operating and loading conditions. With air conditioners, where capacity depends on ambient conditions, this capability can be achieved through mapping relative to manufacturers steady-state performance data. Doing so minimizes the need for a broad range of baseline conditions. Essentially, the ratio of the measured sensible capacity to a fit of the manufacturer s steady-state sensible capacity data is correlated with the duty cycle. Duty cycle is defined as the blower fractional on-time during a cycle relative to the sum of the on-time and the prior off-time. With the furnace, the capacity is not strongly dependent on operating conditions; therefore, the capacity map is absolute and only a function of a duty cycle. Equation (1) shows the functional form of the air-conditioner maps. Equation (2) shows the form for the furnace. (1) part-load sensible capacity [Btu/h] manufacturer s steady-state sensible capacity [Btu/h] air-conditioner part-load factor (function of duty cycle) duty cycle outdoor dry-bulb temperature [ F] indoor dry-bulb temperature [ F] indoor wet-bulb temperature [ F] volumetric flow rate of evaporator fan [cfm] compressor power consumption [kw] manufacturer s steady-state data on compressor power [kw] empirically-based correction factor to P SS part-load furnace capacity [Btu/h] full-load field capacity [Btu/h] furnace part-load factor (function of duty cycle) duty cycle gas consumed by furnace (ft 3 ) supply fan run time (h) The maps are implemented through use of a time-series record of load and conditions in which the candidate unit runs. For each time increment in the series, the capacity equations are solved to determine what run time (duty cycle) is necessary to satisfy the load at the recorded conditions. The equations are solved through iteration because the capacity calculation is dependent on the partload functions, which are nonlinear with respect to duty cycle and make closed form solutions unavailable. If the estimate of run time is smaller than minimum run times seen during periods of low load (from the baseline data), the load is not acted on but added to the next period. This keeps the simulation from artificially low loading. This run-time threshold can be established by comparing the map against its own baseline load record and requiring that the map s estimate of energy consumption equal the energy total in the baseline data. With run time estimated, the compressor s energy consumption is calculated from an empirically-based correction to a fit of the manufacturer s data on compressor power draw [P in Equation (l)]. The energy usage from the condenser fan and supply fan is calculated from average field-measured power draw. For the furnace, gas

3 Field Comparison of Conventional HVAC Systems consumption is determined using an empirical relationship between gas volume usage and run time [G in Equation (2)]. Three test houses at the Fort were chosen to support the hybrid approach. The houses have identical structural design and solar exposure and are occupied by families with one or two children. Energy records were checked to see that the houses are typical of other similar houses at the Fort and that the existing HVAC systems have capacities similar to the 3-ton candidate unit. In each house, the system is installed in the basement. Two of the houses currently have HVAC systems that represent the best available at the Fort. This includes pulse-combustion furnaces and air conditioners with scroll compressors. A third house represents the worst case, with the oldest of the Fort s conventional air conditioners and furnaces. These HVAC systems bracket the range of equipment performance currently at the Fort. Baseline data collection (begun in August 1993) continued in one of the best-case houses until the new gas-engine-driven heat pump was installed in Spring of Data collection then continues for another year on all three houses. This will allow pre/ post comparison between the best case and the candidate in the installation house, mapping from all three base units to the candidate load and conditions record, and side-byside seasonal COP comparisons between the candidate and the two equipment extremes from the base. Sensible capacity (differential temperature) is measured with a 24-gauge type-t thermopile using 6 junction pairs. Six junctions are placed upstream of the furnace filter on a single support rod followed by six junctions downstream of the evaporator coils on two support rods (Figure 1). Volumetric flow rate of the supply air-handler is determined with a heat injection test using a 5-kW heating coil commonly used as a back-up heat source for heat pump systems. Flow rate is determined for the high-speed blower mode associated with air-conditioner operation and also the low-speed blower mode associated with furnace operation. Latent capacity (condensate flow) is recorded by counting contact closures from a calibrated tipping bucket rain gauge. Supply fan speed (in RPM) is recorded with an optical sensor that counts the passes of a piece of reflective tape attached to the far side of the fan rotor. Cycling data is recorded as a count of the times the supply fan turns on during the 15-minute logger period. Instrumentation Baseline monitoring in support of the hybrid assessment approach involved measurements of system outputs (capacity), system inputs (energy consumption), and operating conditions. Data loggers at the site produced a record of measurements at 15-minute intervals. The records were downloaded daily to a computer in Richland, Washington, for storage and analysis. All measurements in the air stream (return-air psychometric and sensible capacity) are conditionally sampled to produce an average over periods of output (supply fan is on). Measurements of conditions outside of the air stream, such as conditioned space, basement, and outdoor condenser temperatures, are based on continuous sampling over the entire 15-minute logger period. All averages are based on 5-second sampling intervals. Operating conditions are characterized by temperature measurements in the return air stream, in the basement, and outside (sun-shielded) near the condenser. Platinum resistance temperature devices (RTDs) are used for the absolute temperature measurements. Humidity in the return air stream is measured with solid-state polymer film sensors calibrated using saturated salt solutions. Figure 1. Instrumentation Used in Measuring Output Capacity Electric energy use is measured with current transformers at the compressor, condenser fan, and supply fan. Contact closures from a reed switch on an inline gas meter are counted to record volumetric flow of natural gas to the furnace. When the gas-engine heat pump was installed in Spring 1994, the monitoring instrumentation was changed to accommodate the variable airflow characteristics of the unit. With changing flow rates, independent averages of

4 Miller over the period the supply fan runs. This requires a realtime multiplication capability in the data logger and also a real-time volumetric flow rate measurement. The new logger is a PC-based system with conditional sampling capabilities and real-time cross-channel math processing. A laboratory-based correlation along with a site calibration is used to determine V from fan power and rpm data. Analysis Sensible and latent capacity are calculated with Equation (3) (ASHRAE 1989). In the sensible calculation, it is assumed that the supply air fan runs at a constant speed and provides approximately constant volumetric flow. In other words, the fan by design provides constant volumetric flow; it is assumed that neither accumulation of dust in the furnace filter nor possible changes in the outlet dampers by the occupants will affect it. The corresponding mass flow was calculated using a psychometric routine for specific volume, which included corrections for barometric pressure, temperature, and moisture. Pressure data was not available from the site sensors but was integrated from an online public database (on the Internet) of hourly San Antonio weather from the National Climatic Data Center (NCDC). These sea-level referenced pressures where then corrected for site elevation. The field-measured latent capacity is not used directly in the mapping process. This is because the maps project sensible capacity onto thermostat-driven sensible load records. However, the latent capacity will be used directly in the side-by-side comparison of seasonal COP. Caution is needed when using condensate flow to estimate latent capacity: the condensate storage capacity in the fin and collection pan causes a fill/drain pattern that delays the condensate flow record from the time that water is actually removed from the air stream. Simple fin/pan storage models can be used to interpret condensate flow data records (Miller 1984). The manufacturer s sensible/total (S/T) ratios are used in developing C SS in Equation (l). To check these steady-state S/T ratios, the seasonal condensate total, as projected from the manufacturer s data for sensible/total ratios, was compared with the field sensible capacity and condensate seasonal total. The manufacturer s S/T ratio data was, on average, 2.4% higher than what would be needed to predict condensate levels equal to the measured total. sensible cooling capacity [Btu/h] supply air flow rate [cfm] temperature differential across evaporator coils [ F] air density [lb air/ ft 3 ] barometric pressure [in. Hg] specific heat of air [Btu/lbm F] latent cooling capacity [Btu/h] condensate flow rate [lb/h] specific enthalpy of saturated water vapor [Btu/lbm water] specific enthalpy of condensate at 50 F [Btu/lbm water] The efficiency of the furnace was calculated using natural gas heating values as shown in Equation (4) where the factor 1000 Btu/ft 3 is the value assumed for standard conditions (ASHRAE 1989). This equation is used with the gas meter s volumetric flow records to account for variations in density from pressure and temperature. The house gas-line temperature was estimated from an air temperature measurement in the unconditioned basement. where H v P site AP P 5t Ts t T line heating value of natural gas [Btu/ft 3 ] barometric pressure at the site [in. Hg] house line pressure above atmospheric [in. Hg] standard pressure, [in. Hg] standard temperature, [ R] temperature of gas in house line [ R] In analyzing field capacity data taken from fixed-interval data loggers, consideration must be given to the relationship between the logging interval and the cycling characteristics of the equipment. Ideally, the field data logger should have the capability of recording a time stamp at the beginning and end of each HVAC event; this clearly supports mapping by duty cycle. If this is not possible, as was our case, fixed-interval logger periods must be chosen carefully so as to collect enough data to resolve the elements of each cycling event. Figure 2 illustrates the overall pattern that results from furnace events being severed by the boundaries of the fixed-interval logger period. Gas use is shown as a function of supply fan duty fraction during 15-minute logger intervals. Duty fraction is defined here as the blower fractional on-time during a 15-minute logger period. The four distinct zones in the plot are a result of how a furnace event sequence (1) burners on, supply fan off; (2) supply fan and burners on; (3) burners off, supply fan on), falls within the boundaries of the 15-minute logger period. Points with zero gas usage are 15-minute periods

5 Field Comparison of Conventional HVAC Systems where there is only a cool down (no burning). Moving clockwise around Figure 2, a few points have no fan time and some gas use (pre-burn). The left side of the parallelogram represents logger periods with varying amounts of pre-burn and burn with the supply fan, but with no cooldown period. The top side has varying fractions of the cool-down period; the points on the right side contain mostly cooldown. The hole in the middle occurs because, in this range of data, the furnace typically ran for 500 seconds before going into cool down mode. Many of the furnace events divided by logger time boundaries can be reassembled and placed in the period where the event terminates. This is done with a logic filter that acts on the record of cycle counts, run time, and gas use. Consumption and run times are totaled; capacities are weighted by run times and then totaled. Figure 3 shows gas use data after aggregation by the digital filters. A similar filter was applied for the air-conditioner data. However, filtering is more difficult in this case because the events have less distinctive features: namely, the fan and compressor run times differ by only an 8-second protection delay in the compressor start time. Pure shutdowns are the only air-conditioner events to get completely caught by filtering; these have a zero cycle count with a non-zero run time. Filters work best when the cycling rate is low; however, when multiple events occur in a period, or when neighboring periods have nonzero cycle counts, it is difficult to determine whether the tail of the last event is contained. In one of the three houses the air conditioner cycled at a low rate. This allowed the filters to isolate nearly all individual cycle events and construct a data record by duty cycle. After field capacity and consumption data is collected, a final step for the mapping of the air-conditioner data is the regression of the manufacturers data for total capacity and sensible/total ratios. Together these produce a relationship for steady-state sensible capacity [C SS in Equation (1)]. Also, the manufacturers data on compressor power was regressed to give a relationship for compressor power draw as a function of conditions [P SS in Equation (l)]. Results A plot of the furnace gas use data is shown in Figure 3 (Figures 3, 4, 5, 7, and 9 are with filtered data). As with Figure 2, a linear fit to the data shows a nearly zero intercept indicating that gas use for the furnace is nearly proportional to the fan run time. This plot illustrates the relationship referred to as G in Equation (2). Because of a logger failure during the coldest part of the winter, data is available during only periods of relatively small heating loads. The capacity data shown in Figure 4 is similar to a plot of H in Equation (2). A key difference here is that Figure 4 is plotted against duty fraction, not duty cycle. The lack of resolution in the baseline data stream prevented event isolation needed to calculate duty cycle. Figure 5 indicates efficiencies ranging from 60% at a 0.6 duty fraction to 85% at a 0.8 duty fraction. Outliers in the plots are generally severed furnace events that are missed by the logic filter. Figure 2. Unfiltered Data Illustrating Sampling Anomaly Figure 3. Furnace Gas Consumption Map (Filtered Data)

6
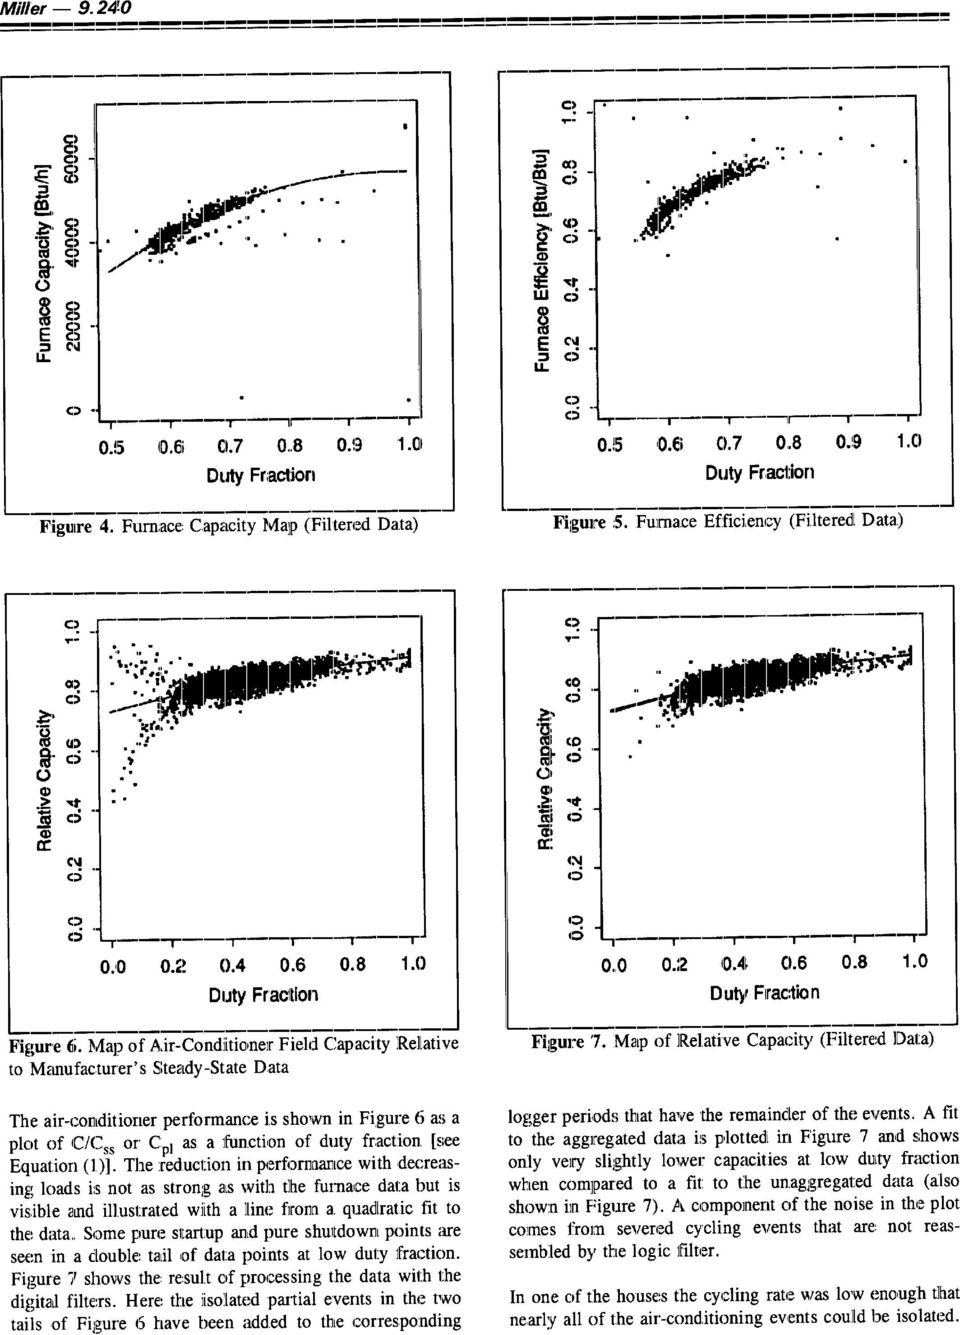
7 Field Comparison of Conventional HVAC Systems Figure 8. Map of Relative Capacity (High Resolution Data) This is seen clearly in Figure 8 where nearly all of the events are severed by logger interval boundaries. The high resolution of this data allowed the duty cycle to be calculated for each event. The results is a much more correlated response of capacity to part-load operation in Figure 9. The stronger correlation results because the duty cycle plot has a point for each cycle event and also distinguishes events with similar run times by the length of the prior off period. The duty cycle data appears to remove an apparent duty-fraction bias of lower performance at lower loading. This can be seen by comparing the fits in Figure 8 and Figure 9. Because of the importance of duty cycle data in the mapping process, the field loggers were adapted for a higher sampling rate and also equipped with an additional digital channel in Spring This channel counts the times the fan turns off during a logger cycle. The additional cycling information and sampling resolution gives the event isolation needed for duty cycle analysis. Conclusions The Fort Sam Houston baseline data has demonstrated how performance mapping techniques can be used to quantify part-load performance in conventional air conditioners and furnaces. These maps serve as simple empirical models and can be used to predict performance of the units under a wide range of loading and operating conditions. Mapping air-conditioner performance relative to correlations of manufacturers steady-state data has proven to be a useful approach in establishing the psychometric dependence in the maps. Figure 9. Map of Relative Capacity by Duty Cycle (Filtered Data) Data sampling is a critical issue in interpreting the field data. Time-stamp characterization of HVAC events clearly has advantages over interpreting cycling events in fixed-interval logger periods. However, logic filters have shown to be successful in reassembling HVAC events and removing sampling anomalies from the performance maps. Acknowledgments Pacific Northwest Laboratory is operated by Battelle Memorial Institute for the U.S. Department of Energy Under Contract DE-AC06-76RLO References Harnish, J. T., D. W. Procknow, F. E. Jakob, T. A. Klausing, C. E. French, G. Nowakowski Residential Gas Heat Pump Design and Development. Paper presented to Cogeneration and Energy Conservation for the 90 s. March 18-19, 1991, Mesa, AZ. Miller, J. D Development and Validation of a Moisture Mass Balance Model for Predicting Residential Cooling Energy Consumption. ASHRAE Transactions, 90(2): American Society of Heating, Refrigerating and Air- Conditioning Engineers, Inc ASHRAE Handbook - Fundamentals. Atlanta.

Impacts of Refrigerant Charge on Air Conditioner and Heat Pump Performance
 Purdue University Purdue e-pubs International Refrigeration and Air Conditioning Conference School of Mechanical Engineering 2010 Impacts of Refrigerant Charge on Air Conditioner and Heat Pump Performance
Glossary of Heating, Ventilation and Air Conditioning Terms
 Glossary of Heating, Ventilation and Air Conditioning Terms Air Change: Unlike re-circulated air, this is the total air required to completely replace the air in a room or building. Air Conditioner: Equipment
HVAC Efficiency Definitions
 HVAC Efficiency Definitions Term page EER - 2 SEER - 3 COP - 4 HSPF - 5 IPLV - 6 John Mix May 2006 Carrier Corporation 1 Energy Efficiency Ratio (EER) The energy efficiency ratio is used to evaluate the
MODELLING AND OPTIMIZATION OF DIRECT EXPANSION AIR CONDITIONING SYSTEM FOR COMMERCIAL BUILDING ENERGY SAVING
 MODELLING AND OPTIMIZATION OF DIRECT EXPANSION AIR CONDITIONING SYSTEM FOR COMMERCIAL BUILDING ENERGY SAVING V. Vakiloroaya*, J.G. Zhu, and Q.P. Ha School of Electrical, Mechanical and Mechatronic Systems,
Strategy Guideline: HVAC Equipment Sizing
 Strategy Guideline: HVAC Equipment Sizing Arlan Burdick IBACOS, Inc. February 2012 This report received minimal editorial review at NREL NOTICE This report was prepared as an account of work sponsored
RESEARCH HIGHLIGHT. Performance Assessment of a Cold-Climate Air Source Heat Pump
 RESEARCH HIGHLIGHT December 2014 Technical Series 14-102 Performance Assessment of a Cold-Climate Air Source Heat Pump INTRODUCTION Most Canadians are familiar with air source heat pump technology in the
Dehumidification Frequently Asked Questions
 Dehumidification Basics Why do you want to keep indoor Rh between 30-60%? ASHRAE recommends keeping the relative humidity in a home between 30-60% to limit the effects of many unwanted conditions and harmful
The ASHRAE HQ Building Can the energy efficiency of the different mechanical systems really be compared? RESIDENTIAL LIGHT COMMERCIAL COMMERCIAL
 The ASHRAE HQ Building Can the energy efficiency of the different mechanical systems really be compared? RESIDENTIAL LIGHT COMMERCIAL COMMERCIAL Technical Article April 2013 The ASHRAE HQ Building Can
International Telecommunication Union SERIES L: CONSTRUCTION, INSTALLATION AND PROTECTION OF TELECOMMUNICATION CABLES IN PUBLIC NETWORKS
 International Telecommunication Union ITU-T TELECOMMUNICATION STANDARDIZATION SECTOR OF ITU Technical Paper (13 December 2013) SERIES L: CONSTRUCTION, INSTALLATION AND PROTECTION OF TELECOMMUNICATION CABLES
HVAC Basic Science - System Capacity
 HVAC Basic Science - System Capacity Btu/hour, btu/h, b/h, btuh. btu?? 1 MBH = 1000 btu/hour 1 KBH = 1000 btu/hour 1 ton of cooling= 12,000 btu/hour 1 watt = 3.414 btu/hour 1 kilowatt = 1000 watts = 3,414
Evaporative Cooling for Residential and Light-Commercial
 EMERGING TECHNOLOGIES This article was published in ASHRAE Journal, October 2011. Copyright 2011 American Society of Heating, Refrigerating and Air-Conditioning Engineers, Inc. Posted at www.ashrae.org.
Two-Stage High Efficiency Air Conditioners: Laboratory Ratings vs. Residential Installation Performance
 Two-Stage High Efficiency Air Conditioners: Laboratory Ratings vs. Residential Installation Performance John Proctor and Gabriel Cohn, Proctor Engineering Group, Ltd. ABSTRACT The increased installation
The Development of a Frost-Less Heat Pump
 The Development of a Frost-Less Heat Pump V. C. Mei, R. E. Domitrovic, and F. C. Chen, Oak Ridge National Laboratory J. K. Kilpatrick, Tennessee Valley Authority ABSTRACT There are two major concerns associated
Creating Efficient HVAC Systems
 Creating Efficient HVAC Systems Heating and Cooling Fundamentals for Commercial Buildings Heating, ventilating, and air conditioning (HVAC) systems account for nearly half of the energy used in a typical
Total Heat Versus Sensible Heat Evaporator Selection Methods & Application
 Total Heat Versus Sensible Heat Evaporator Selection Methods & Application Scope The purpose of this paper is to provide specifying engineers, purchasers and users of evaporators in industrial refrigeration
APPLICATION GUIDE. Comparison of Latent Cooling Performance of Various HVAC systems in a Classroom Application
 APPLICATION GUIDE Comparison of Latent Cooling Performance of Various HVAC systems in a Classroom Application Section Comparison of Latent Cooling Performance of Introduction Most commercial HVAC systems
High Altitude HVAC. Silvertip Integrated Engineering Consultants mhaughey@earthlink.net www.silvertipconsultants.com
 Presentation to: Rocky Mountain ASHRAE 2013 Tech Conference April 19, 2013 High Altitude HVAC Design Considerations by: Michael D. Haughey, PE, HBDP, CEM, LEED TM AP 2013 Silvertip Integrated Engineering
9. ENERGY PERFORMANCE ASSESSMENT OF HVAC SYSTEMS
 9. ENERGY PERFORMANCE ASSESSMENT OF HVAC SYSTEMS 9.1 Introduction Air conditioning and refrigeration consume significant amount of energy in buildings and in process industries. The energy consumed in
Comparing Air Cooler Ratings Part 1: Not All Rating Methods are Created Equal
 Technical Bulletin By Bruce I. Nelson, P.E., President, Colmac Coil Manufacturing, Inc. Comparing Air Cooler Ratings Part 1: Not All Rating Methods are Created Equal SUMMARY Refrigeration air coolers (evaporators)
Green Building Handbook for South Africa Chapter: Heating, Ventilation and Cooling Luke Osburn CSIR Built Environment
 Green Building Handbook for South Africa Chapter: Heating, Ventilation and Cooling Luke Osburn CSIR Built Environment The heating, ventilation and cooling loads of typical commercial office space can range
A Comparison of an R22 and an R410A Air Conditioner Operating at High Ambient Temperatures
 R2-1 A Comparison of an R22 and an R410A Air Conditioner Operating at High Ambient Temperatures W. Vance Payne and Piotr A. Domanski National Institute of Standards and Technology Building Environment
Defining Quality. Building Comfort. Precision. Air Conditioning
 Defining Quality. Building Comfort. Precision Air Conditioning Today s technology rooms require precise, stable environments in order for sensitive electronics to operate optimally. Standard comfort air
Catalyst RTU Controller Study Report
 Catalyst RTU Controller Study Report Sacramento Municipal Utility District December 15, 2014 Prepared by: Daniel J. Chapmand, ADM and Bruce Baccei, SMUD Project # ET13SMUD1037 The information in this report
The Impact of Demand-Controlled and Economizer Ventilation Strategies on Energy Use in Buildings
 4276 The Impact of Demand-Controlled and Economizer Ventilation Strategies on Energy Use in Buildings Michael J. Brandemuehl, Ph.D., P.E. Member ASHRAE James E. Braun, Ph.D., P.E. Member ASHRAE ABSTRACT
Lesson 36 Selection Of Air Conditioning Systems
 Lesson 36 Selection Of Air Conditioning Systems Version 1 ME, IIT Kharagpur 1 The specific objectives of this chapter are to: 1. Introduction to thermal distribution systems and their functions (Section
Makeup Air For Exhaust Systems In Tight Houses. Tony Jellen Engineering Projects
 Makeup Air For Exhaust Systems In Tight Houses Tony Jellen Engineering Projects PA Housing & Land Development Conference February 23, 2012 Effects of Kitchen Ventilation on Residential Dwellings Anthony
Presentation Outline. Common Terms / Concepts HVAC Building Blocks. Links. Plant Level Building Blocks. Air Distribution Building Blocks
 Presentation Outline Common Terms / Concepts HVAC Building Blocks Plant Level Building Blocks Description / Application Data Green opportunities Selection Criteria Air Distribution Building Blocks same
Theoretical Study on Separate Sensible and Latent Cooling Air-Conditioning System
 Purdue University Purdue e-pubs International Refrigeration and Air Conditioning Conference School of Mechanical Engineering 2008 Theoretical Study on Separate Sensible and Latent Cooling Air-Conditioning
Air Side Economizers and Energy Recovery - Improvements and New Regulations. Richard Lord 09-20-2012
 Air Side Economizers and Energy Recovery - Improvements and New Regulations Richard Lord 09-20-2012 Introduction For commercial buildings the use of outside air for cooling and ventilation is an important
Optimization of Water - Cooled Chiller Cooling Tower Combinations
 Optimization of Water - Cooled Chiller Cooling Tower Combinations by: James W. Furlong & Frank T. Morrison Baltimore Aircoil Company The warm water leaving the chilled water coils is pumped to the evaporator
Testing methods applicable to refrigeration components and systems
 Testing methods applicable to refrigeration components and systems Sylvain Quoilin (1)*, Cristian Cuevas (2), Vladut Teodorese (1), Vincent Lemort (1), Jules Hannay (1) and Jean Lebrun (1) (1) University
J O U R N A L. Energy Performance for. Proper Specification of Air Terminal Units Future Climate Impacts on Building Design
 Copyright 24, American Society of Heating, Refrigerating & Air-Conditioning Engineers, Inc., 79 Tullie Circle NE, Atlanta, GA. 3329. Reprinted by permission from the September 24 Issue of ASHRAE Journal
Heating, Ventilation & Air Conditioning Equipment
 FinAnswer Express Utah Incentive Catalog Effective as of May 19, 2012 Heating, Ventilation & Air Conditioning Equipment Rocky Mountain Power provides incentives for many types of energy-efficient technologies.
Whole House Dehumidification for Occupant Comfort and Energy Savings
 Downloaded from www.rsrews.com. Since 1968, RS Andrews has proudly served Atlanta's Heating, Air Conditioning & Plumbing Needs. Whole House Dehumidification for Occupant Comfort Energy Savings June 2009
Dr. Michael K. West, PE 1 Dr. Richard S. Combes, PE 2 Advantek Consulting / Melbourne, Florida
 Optimizing 100% Outside Air Systems with Heat Pipes Dr. Michael K. West, PE 1 Dr. Richard S. Combes, PE 2 Advantek Consulting / Melbourne, Florida Introduction To meet increasingly rigorous building codes
By Tom Brooke PE, CEM
 Air conditioning applications can be broadly categorized as either standard or critical. The former, often called comfort cooling, traditionally just controlled to maintain a zone setpoint dry bulb temperature
Carnegie Mellon University School of Architecture, Department of Mechanical Engineering Center for Building Performance and Diagnostics
 Carnegie Mellon University School of Architecture, Department of Mechanical Engineering Center for Building Performance and Diagnostics A Presentation of Work in Progress 4 October 2006 in the Intelligent
Characteristics of Evaporators
 Characteristics of Evaporators Roger D. Holder, CM, MSME 10-28-2003 Heat or Energy In this paper, we will discuss the characteristics of an evaporator coil. The variance of the operational condenses of
Building Energy Systems. - HVAC: Heating, Distribution -
 * Some of the images used in these slides are taken from the internet for instructional purposes only Building Energy Systems - HVAC: Heating, Distribution - Bryan Eisenhower Associate Director Center
Get the FACTS about SEER and Deliver Better Customer Value
 What is SEER? SEER stands for Seasonal Energy Efficiency Ratio. It s a number that describes how well air-conditioning equipment works. A higher SEER means better efficiency and lower energy bills. SEER
APPLICATION GUIDE. Moisture Management in Waterborne Climate Systems
 APPLICATION GUIDE Moisture Management in Waterborne Climate Systems Contents Introduction 3 WBCS Concept 3 Condensation 4 Moisture Sources in the Space 4 Impact of a High Moisture Load 5 Designing to Manage
Bring the fresh in. Dedicated Outside Air Systems
 Bring the fresh in. Dedicated Outside Air Systems The inside story on outside air. On average, we breathe in 3,400 gallons of air each day. Ambient indoor air pollution is a major problem, affecting health
Using Time-of-Day Scheduling To Save Energy
 The following article was published in ASHRAE Journal, May 29. Copyright 29 American Society of Heating, Refrigerating and Air-Conditioning Engineers, Inc. It is presented for educational purposes only.
Pool Dehumidification Basics
 Copyright 2009 Wescor. All rights reserved. Permission granted to reproduce for personal and educational use only. When energy costs were low, many pool owners considered only first cost when choosing
Energy Efficiency. Energy Efficient Home Cooling:
 Energy Efficiency Energy Efficient Home Cooling: Choosing an air conditioning system is an important decision. A poor choice may be costly to purchase and operate and yet fail to provide the desired cooling
QUESTIONS TO ASK WHEN REPLACING YOUR HVAC TOGETHERWESAVE.COM
 QUESTIONS TO ASK WHEN REPLACING YOUR HVAC TOGETHERWESAVE.COM TOGETHERWESAVE.COM IS IT TIME TO REPLACE YOUR HVAC SYSTEM? If your heating and cooling system is 15 to 20 years old and is experiencing problems,
FLORIDA SOLAR ENERGY CENTER
 FLORIDA SOLAR ENERGY CENTER Creating Energy Independence Since 1975 Impact of Energy-Efficiency Parameters on Home Humidity Rob Vieira Florida Solar Energy Center A Research Institute of the University
EFFECTS OF INDOOR RELATIVE HUMIDITY ON REFRIGERATED DISPLAY CASE PERFORMANCE
 P (5, EFFECTS OF INDOOR RELATIVE HUMIDITY ON REFRIGERATED DISPLAY CASE PERFORMANCE Ronald H. Howell, Professor Luis Rosario, Graduate Student Antonio Bula, Graduate Student Department of Mechanical Engineering
Heating & Cooling Efficiency
 Heating & Cooling Efficiency Advantages of Geothermal HVAC Efficiency Keith Swilley Gulf Power Company Why Gulf Power Promotes Energy Efficiency? Customer Satisfaction Education Help Customers Make Smart
3/29/2012 INTRODUCTION HVAC BASICS
 INTRODUCTION HVAC BASICS AND HVAC SYSTEM EFFICIENCY IMPROVEMENT SECTION O HVAC systems or Heating, Ventilating and Air-Conditioning systems control the environment for people and equipment in our facilities.
Methods for Testing and Rating the Performance of Heating and Air Conditioning Systems
 Methods for Testing and Rating the Performance of Heating and Air Conditioning Systems The U.S. Congress enacted the Energy Policy and Conservation Act (EPCA, Public Law 94-163) in December 1975. It was
Zoned Air Conditioners - A Real Value?
 H114 Prepared by: Proctor Engineering Group, Ltd. San Rafael, CA 94901 (415)451-2480 Zoning Ducted Air Conditioners, Heat Pumps, and Furnaces: Summary of a Case Study prepared for the California Statewide
The formula for finding CFM is: CFM = BTUH OUTPUT_ Temp Rise (ACF)* *Altitude correction factor below 1000ft = 1.08
* *Altitude correction factor below 1000ft = 1.08") Air Volume Requirement Air conditioning systems are engineered with a specific amount of indoor air passing across the surface of the evaporator coil. The amount of air is measured in cubic feet per minute.
Air Volume Requirement Air conditioning systems are engineered with a specific amount of indoor air passing across the surface of the evaporator coil. The amount of air is measured in cubic feet per minute.
SECTION 23 81 03 - PACKAGED ROOFTOP AIR CONDITIONING UNITS NON-CUSTOM
 SECTION 23 81 03 - PACKAGED ROOFTOP AIR CONDITIONING UNITS NON-CUSTOM PART 1 - GENERAL 1.1 SUMMARY A. Section Includes: 1. Packaged rooftop air conditioning unit (5 tons and smaller). 2. Roof curb. 1.2
HVACPowDen.xls An Easy-to-Use Tool for Recognizing Energy Efficient Buildings and HVAC Systems
 HVACPowDen.xls An Easy-to-Use Tool for Recognizing Energy Efficient Buildings and HVAC Systems Fundamental Principles of Environmentally Responsible, Energy Efficient Buildings 1. Energy efficiency is
KINGDOM OF SAUDI ARABIA SAUDI ARABIAN STANDARDS ORGANIZATION SASO. SAUDI STANDARD DRAFT No. 3457/2005
 KINGDOM OF SAUDI ARABIA SAUDI ARABIAN STANDARDS ORGANIZATION SASO SAUDI STANDARD DRAFT No. 3457/2005 NON-DUCTED AIR CONDITIONERS AND HEAT PUMPS TESTING AND RATING PERFORMANCE This standard is developed
HIGH EFFICIENCY RTU. www.reznorhvac.com HIGH EFFICIENCY, PACKAGED SPACE CONDITIONING. DX System IEER> 13.2 Gas Heat Efficiency > 92% Capacities Tons
 Capacities 10-25 Tons 100-400 MBH HIGH EFFICIENCY, PACKAGED SPACE CONDITIONING DX System IEER> 13.2 Gas Heat Efficiency > 92% HIGH EFFICIENCY RTU 30-120 kw 3,000-11,550 CFM Comfort Comfort is determined
Modeling and Simulation of HVAC Faulty Operations and Performance Degradation due to Maintenance Issues
 LBNL-6129E ERNEST ORLANDO LAWRENCE BERKELEY NATIONAL LABORATORY Modeling and Simulation of HVAC Faulty Operations and Performance Degradation due to Maintenance Issues Liping Wang, Tianzhen Hong Environmental
Chapter 3.4: HVAC & Refrigeration System
 Chapter 3.4: HVAC & Refrigeration System Part I: Objective type questions and answers 1. One ton of refrigeration (TR) is equal to. a) Kcal/h b) 3.51 kw c) 120oo BTU/h d) all 2. The driving force for refrigeration
Analysis of data centre cooling energy efficiency
 Analysis of data centre cooling energy efficiency An analysis of the distribution of energy overheads in the data centre and the relationship between economiser hours and chiller efficiency Liam Newcombe
Laboratory Performance Testing of Residential Window Mounted Air Conditioners
 Laboratory Performance Testing of Residential Window Mounted Air Conditioners Jon Winkler Chuck Booten Dane Christensen Jeff Tomerlin April 29, 2012 NREL is a national laboratory of the U.S. Department
Multifamily Central Heat Pump Water Heating
 Multifamily Central Heat Pump Water Heating Elizabeth Weitzel Davis Energy Group Alliance for Residential Building Innovation (ARBI) January, 2015 The work presented in this presentation does not represent
Variable Air Volume - VAV
 Mode Enable Sensor Options Variable Air Volume - VAV The temperature of this sensor will determine if the unit is in heating, cooling or vent mode during occupied operation. The following options are available:
SPECIAL ISSUE: NATIONAL SCIENCE FOUNDATION WORKSHOP
 research journal 2013 / VOL 05.01 www.perkinswill.com SPECIAL ISSUE: NATIONAL SCIENCE FOUNDATION WORKSHOP ARCHITECTURE AND ENGINEERING OF SUSTAINABLE BUILDINGS Current Trends in Low-Energy HVAC Design
Laboratory Test Report for Fujitsu 12RLS and Mitsubishi FE12NA Mini-Split Heat Pumps
 Laboratory Test Report for Fujitsu 12RLS and Mitsubishi FE12NA Mini-Split Heat Pumps Jon Winkler, Ph.D. September 2011 NOTICE This report was prepared as an account of work sponsored by an agency of the
Hot Dry Climate Air Conditioner (HDAC) Combined Field Test Report
 Combined Field Test Report") Hot Dry Climate Air Conditioner (HDAC) Combined Field Test Report Prepared for: Southern California Edison Company Refrigeration and Thermal Test Center (RTTC) Design & Engineering Services 6060b N. Irwindale
Hot Dry Climate Air Conditioner (HDAC) Combined Field Test Report Prepared for: Southern California Edison Company Refrigeration and Thermal Test Center (RTTC) Design & Engineering Services 6060b N. Irwindale
System Interactions in Forced-Air Heating and Cooling Systems, Part II: Continuous Fan Operation
 System Interactions in Forced-Air Heating and Cooling Systems, Part II: Continuous Fan Operation Authors Gu, Lixing Swami, Muthusamy Fairey, Philip Original Publication Lixing Gu, Muthusamy Swami, Philip
Engineering White Paper UTILIZING ECONOMIZERS EFFECTIVELY IN THE DATA CENTER
 Engineering White Paper UTILIZING ECONOMIZERS EFFECTIVELY IN THE DATA CENTER SUMMARY A proper balance of temperature and humidity control is essential for efficient data center operation, and integral
Engineering Study on HVAC Endochipz for Commercial & Residential Properties Conducted by Pacific Gas & Electric Corp.
 Engineering Study on HVAC Endochipz for Commercial & Residential Properties Conducted by Pacific Gas & Electric Corp. Condensed Version: February 2014 The following information pertains to residential
Achieving ENERGY EFFICIENCY with Standard Air-Conditioning Units. Mike West, PhD, PE Advantek Consulting, Inc
 Achieving ENERGY EFFICIENCY with Standard Air-Conditioning Units Mike West, PhD, PE Advantek Consulting, Inc Standard Air Conditioning Unit Packaged Unit Split System DX (not chilled water) Air-cooled
AC System Equipment Specification, Installation and Operational Options for Improved Indoor Humidity Control
 AC System Equipment Specification, Installation and Operational Options for Improved Indoor Humidity Control Authors Don B. Shirey, III Original Publication Shirey III, D., "AC System Equipment Specification,
Flexibility, Efficiency In San Antonio Arena
 2005, American Society of Heating, Refrigerating and Air-Conditioning Engineers, Inc. (www.ashrae.org). Reprinted by permission from ASHRAE Journal, (Vol. 47, No. 9, September 2005). This article may not
HVAC Technologies for Building Energy Efficiency Improvements 2013 National Symposium on Market Transformation. Richard Lord Carrier Fellow
 HVAC Technologies for Building Energy Efficiency Improvements 2013 National Symposium on Market Transformation Richard Lord Carrier Fellow HVAC Industry Challenges and Issues Ozone Deletion Global Warming
Air-Conditioning Buying Guide
 Air-Conditioning Buying Guide Buying a new air-conditioning system is a big decision. This Air-Conditioning Buying Guide can help you make the right choice, save energy and money. Shop with confidence
Heating, Ventilation & Air Conditioning Equipment
 FinAnswer Express Wyoming Incentive Catalog Effective as of October 1, 2011 Heating, Ventilation & Air Conditioning Equipment Rocky Mountain Power provides incentives for many types of energy efficient
How To Design A Building In New Delhi
 ENERGY EFFICIENT HVAC DESIGN FOR COMPOSITE CLIMATE Overview of Design Conditions: Air conditioning system consumes most of the energy that a building needs in its operation. In order to reduce energy consumption
Impacts of Static Pressure Set Level on the HVAC Energy Consumption and Indoor Conditions
 Impacts of Static Pressure Set Level on the HVAC Energy Consumption and Indoor Conditions M. Liu, Y. Zhu, D. E. Claridge Energy Systems Laboratory Texas A&M University Ed. White Energy Management Operation
Residential Duct Systems for New and Retrofit Homes
 Residential Duct Systems for New and Retrofit Homes Why it is important to properly design and install high quality, efficient ducted air systems? The efficiency of air distribution systems has been found
ENERGY EFFICIENT HVAC DESIGN FOR WARM-HUMID CLIMATE CLIMATE
 ENERGY EFFICIENT HVAC DESIGN FOR WARM-HUMID CLIMATE CLIMATE Overview of Design Conditions: Air conditioning system consumes most of the energy that a building needs in its operation. In order to reduce
Introduction. Motor Types
 QwikSEER+ Theory of Operation and Retrofit Potential Mainstream Engineering Corporation Rockledge, FL 32955 http://www.qwik.com/products/qwikseer/index.jsp Prepared by Robert P. Scaringe and R. Paul Roth
Residential HVAC System Sizing
 Residential HVAC System Sizing William P. Goss University of Massachusetts, Amherst, Massachusetts, USA Corresponding email: goss@acad.umass.edu SUMMARY Heating, ventilating and air-conditioning (HVAC)
Moisture Control. It s The Dew Point. Stupid! Its not the humidity.
 Moisture Control Its not the humidity. It s The Dew Point Stupid! Mike Schell EpiphanyTec Inc. Santa Barbara, CA mschell@epiphanytec.com 805 687-3175 Matching great technology to market need! Topics SHR
Rating Water-Source Heat Pumps Using ARI Standard 320 and ISO Standard 13256-1
 Rating Water-Source Heat Pumps Using ARI Standard 320 and ISO Standard 13256-1 W. Vance Payne and Piotr A. Domanski National Institute of Standards and Technology Building and Fire Research Laboratory
Akton Psychrometric Chart Tutorial and Examples
 Akton Psychrometric Chart Tutorial and Examples December 1999 Akton Associates Inc. 3600 Clayton Road, Suite D Concord, California 94521 (925) 688-0333 http://www.aktonassoc.com Copyright 1999 Akton Associates
air conditioners how to choose a cooling system
 air conditioners how to choose a cooling system taking responsibility As an individual, your efficient use of energy brings benefits such as lower bills, improved comfort levels in your home and a reduced
Hybrid (Dual Fuel) - Gas Heat and Air Source Heat Pump
 - Gas Heat and Air Source Heat Pump") s.doty 10-2014 White Paper #30 Hybrid (Dual Fuel) - Gas Heat and Air Source Heat Pump System Switches Fuels Automatically for Economy. What is an Air-Source Heat Pump? A heat pump is a modified air conditioning
s.doty 10-2014 White Paper #30 Hybrid (Dual Fuel) - Gas Heat and Air Source Heat Pump System Switches Fuels Automatically for Economy. What is an Air-Source Heat Pump? A heat pump is a modified air conditioning
Todd M. Rossi, Ph.D. President
 Residential Air Conditioning Fault Detection and Diagnostics (FDD) and Protocols to Support Efficient Operation DOE - Building America Program Residential Buildings Integration Meeting - July 20-22, 2010
Understanding Heating Seasonal Performance Factors for Heat Pumps
 Understanding Heating Seasonal Performance Factors for Heat Pumps Paul W. Francisco, University of Illinois, Building Research Council Larry Palmiter and David Baylon, Ecotope, Inc. ABSTRACT The heating
HOW TO CONDUCT ENERGY SAVINGS ANALYSIS IN A FACILITY VALUE ENGINEERING STUDY
 HOW TO CONDUCT ENERGY SAVINGS ANALYSIS IN A FACILITY VALUE ENGINEERING STUDY Benson Kwong, CVS, PE, CEM, LEED AP, CCE envergie consulting, LLC Biography Benson Kwong is an independent consultant providing
Design Guide. Retrofitting Options For HVAC Systems In Live Performance Venues
 Design Guide Retrofitting Options For HVAC Systems In Live Performance Venues Heating, ventilation and air conditioning (HVAC) systems are major energy consumers in live performance venues. For this reason,
Percent per Degree Rule of Thumb for Refrigeration Cycle Improvement
 7 Percent per Degree Rule of Thumb for Refrigeration Cycle Improvement Steve Doty, PE, CEM sdoty@csu.org ABSTRACT A value of 1-1.5% power reduction per degree Fahrenheit (F) has been used successfully
DX14SA AIR CONDITIONER ENERGY-EFFICIENT UP TO 15 SEER SINGLE SPEED COMFORT FOR LIFE
 DX14SA AIR CONDITIONER ENERGY-EFFICIENT UP TO 15 SEER SINGLE SPEED COMFORT FOR LIFE AIR CONDITIONER ENERGY-EFFICIENT, SINGLE SPEED DX14SA UP TO 15 SEER Comfort for Life Daikin is a global leader for indoor
BCA-IDA Green Mark for Existing Data Centres Version EDC/1.0
 BCA-IDA Green Mark for Existing Data Centres Version EDC/1.0 To achieve GREEN MARK Award Pre-requisite Requirement All relevant pre-requisite requirements for the specific Green Mark Rating are to be complied
Xcel Business Customers: Program and Rebate Summary
 Xcel Business Customers: Program and Rebate Summary Rebates for New Energy-Efficient Equipment Xcel offers prescriptive rebates to its business customers. What s a prescriptive rebate? It simply means
HEATING AND COOLING SYSTEMS THAT FIT COMFORTABLY WITHIN YOUR BUDGET.
 HEATING AND COOLING SYSTEMS THAT FIT COMFORTABLY WITHIN YOUR BUDGET. AFFORDABLE SOLUTIONS FROM AMERISTAR. We know that heating and cooling systems can be a major investment for homeowners. Our goal is
Heat Recovery In Retail Refrigeration
 This article was published in ASHRAE Journal, February 2010. Copyright 2010 American Society of Heating, Refrigerating and Air-Conditioning Engineers, Inc. Posted at www.ashrae.org. This article may not
CHAPTER 4 LOAD CALCULATIONS 4.1 CONTEXT
 CHAPTER 4 LOAD CALCULATIONS 4.1 CONTEXT The accurate calculation of heating and cooling loads is essential to provide a sound bridge between fundamental building design decisions and an operating building.
Without Strip Heat: In-Situ Monitoring of a Multi-Stage Air Source Heat Pump in the Pacific Northwest
 Without Strip Heat: In-Situ Moniring of a Multi-Stage Air Source Heat Pump in the Pacific Northwest Adam Hadley, Jack Callahan, and Richard Stroh Bonneville Power Administration ABSTRACT The electric resistance
Lower Energy Costs with Rooftop Air-Conditioning Package Units
 Lower Energy Costs with Rooftop Air-Conditioning Package Units Sponsored by Mike West, PhD, PE Advantek Consulting, Inc Package Unit Efficiency Factors Sensible and latent performance ratings Unit efficiency
Application of Building Energy Simulation to Air-conditioning Design
 Hui, S. C. M. and K. P. Cheung, 1998. Application of building energy simulation to air-conditioning design, In Proc. of the Mainland-Hong Kong HVAC Seminar '98, 23-25 March 1998, Beijing, pp. 12-20. (in