The Impact of Abortion Legalization on Adult Mortality in the Next Generation
|
|
|
- Hubert Berry
- 8 years ago
- Views:
Transcription
1 The Impact of Abortion Legalization on Adult Mortality in the Next Generation Alexa Lutchen Williams College Senior Honors Thesis Adviser: Prof. Watson

2 Abstract: Abortion legalization was one of the most important changes in social policy of the 20 th century. Previous studies of this consequential legislation examine its impact on the women with the ability to obtain legal abortions, as well as the outcomes of those born in a regime of legal abortion. This is the first paper to examine the effect of abortion legalization on the adult health of the next generation. I examine the link between women s abortion access and the mortality rates of their children when those children reach ages I find that those individuals born at least eighteen months after legalization of abortion in their birth state have mortality rates that are 3% than lower than would otherwise be predicted. Abortion legalization is associated with a statistically significant negative impact on white and black mortality rates, with the largest effects for black males. I find some evidence that the association between legalization and mortality in the next generation is being driven by selection effects, through a change the composition of mothers giving birth and the wantedness of those being born. I also find that deaths caused by risky behaviors are the most affected by legalization. Overall, the results suggest abortion policy has the potential to affect the adult health of the next generation. Acknowledgments: I want to thank my thesis adviser, Prof. Tara Watson, for her guidance and support throughout the entire thesis process, as well as for being so generous with her time. I also want to thank Prof. David Zimmerman, my second reader, for his advice, and Prof. Ken Kuttner, the honors coordinator, for his input. In addition, I would like to express my appreciation for receiving the Carl Van Duyne Prize in Economics, which enabled me to pursue this project in more depth. 1

3 The Impact of Abortion Legalization on Adult Mortality in the Next Generation I. Introduction Abortion legalization was one of the most important changes in social policy of the 20 th century, significantly impacting access to abortion services, the women who utilized these services, and the children born to these women. Studies of this consequential legislation examine its impact on the fertility, educational attainment, and income of women with the ability to obtain legal abortions. There is also an extensive literature examining the impact of abortion legislation on the outcomes of those born in a regime of legal abortion, including childhood disadvantage, adolescent drug use, and crime. However, there has been no research examining the effect of abortion legalization on the adult health of the next generation. This is the first paper to investigate this topic. In this paper, I measure adult health using mortality rates and examine the link between women s abortion access and the mortality rates of their children when those children reach ages The results in this paper will shed light on whether the impact of abortion legalization on childhood health extends into adulthood and whether the effect of abortion legislation on adult education and income also impacts adult health. I hypothesize that those cohorts born after the legalization of abortion would have lower mortality rates overall, a result that would be indicative of an overall improvement in adult health outcomes. If mortality in young adulthood is correlated with morbidity and with health outcomes at older ages, abortion legalization may also have a broader impact on health than what is documented here. These hypotheses are consistent with the notion that abortion legalization led to positive selection in the births following the legislation. 2

4 I find that after abortion legalization, there are statistically significant reductions in the birthrate. Specifically, abortion legalization is associated with a 4% decrease in the birthrate, a 9% decrease in the teen birth rate, a 4% decrease in the white birthrate, and a 6% decrease in the black birth rate eighteen months after legalization within a state. These results indicate that abortion legalization changes the birthrate, and raises the possibility that cohorts born after the legislation had different childhood circumstances than those born before it. Furthermore, the results show that those individuals born at least eighteen months after the legalization of abortion in their birth state have mortality rates that are 3% lower than would otherwise be predicted. Abortion legalization is associated with a statistically significant negative impact on white and black mortality rates, with the largest effects for black males. Abortion legalization is also associated with a larger decrease in mortality rates for males than females. I find some evidence that the association between legalization and mortality in the next generation is being driven by selection effects, through a change in the composition of mothers giving birth and the wantedness of those being born. I also find that deaths caused by risky behaviors are the most affected by legalization. Overall, the results are suggestive of an association between abortion legalization and a decrease in the adult mortality of the next generation. II. Theoretical Underpinnings Why Abortion Is Related to Adult Health and Mortality There are four mechanisms through which abortion access may potentially impact the adult health and mortality of the next generation: 3

5 1. Timing of Pregnancy: Abortion access allows women to abort unwanted children, providing women with the flexibility to carry pregnancies to term only when the timing is optimal given their educational aspirations, labor market considerations, and personal circumstances. Without this ability to time pregnancies, women are forced to have a child when they do not necessarily have the resources to do so. As a result, these unwanted or mistimed children might receive fewer resources during and post-pregnancy, leading to worse outcomes for the cohort. In addition, as Pop-Eleches (2006) explains, a mother who gives birth to an unwanted child prior to marriage might either enter an undesired marriage or face single parenthood, conditions that can negatively impact the health of a child. Consequently, unwanted children would most likely have worse outcomes in adulthood, making them more likely to die at an earlier age. Bitler and Zavodny (2002) find some evidence of a decrease in the number of unwanted children, proxied by the adoption rate. They determine that there was a 34-37% decline in adoption rates for children born to white women in early states, relative to the other states after early legalization, suggesting a reduction in the number of unwanted children born. There was not a significant decrease in adoption rates for non-white women after early legalization. 2. Maternal Selection: Mothers with certain types of quasi-permanent characteristics are more likely to obtain an abortion. These characteristics can include race, age, marriage status, and income and education levels. Mothers with less education and lower income, characteristics correlated with race, age, and marital status, would have fewer available resources to dedicate to their children, resulting in an unhealthier home environment. Consequently, children born into these households are more likely to develop into 4

6 unhealthy adults and can be expected to have higher overall mortality rates. In other words, selection into the cohort could affect health of the cohort. However, it is also possible wealthy and educated women, who would be expected to raise healthier children, may have been able to utilize abortion services sooner after legalization than lower income women. If this was the case, the children born initially after legalization could be expected to have worse outcomes, leading to an increase in the adult mortality. Nevertheless, the evidence suggests that there is positive selection based on maternal characteristics after abortion legalization, which would lead to a decrease in mortality in the next generation. For example, Levine et al. (1996) demonstrate that abortion legalization in early states had a larger impact on births to teens and to nonwhite women, with reductions in birthrates of 13% and 12% respectively. These characteristics tend to be negatively correlated with income and education, so children born to these women would most likely have had worse outcomes than average. 3. In-Utero Health Conditions: Abortion access allows women to abort children who would have been less healthy if born. For example, a pregnant woman may choose to have an abortion if certain detrimental genetic or chromosomal health conditions are observable in-utero. If born, children with these types of disorders are more likely to have reduced life spans, impacting adult mortality rates. At the time abortion was legalized, mothers had access to tests during pregnancy that would reveal information on fetal health. Ultrasound, which can detect fetal malformation and growth defects (Alters and Schiff 2011), has been used since the 1960 s and millions of exams were performed by the 1970 s (Szabo 2004). 5

7 Amniocentesis was widely used by the 1970s and enabled women to determine whether their fetus would be born with genetic abnormalities, such as Down s syndrome and Fragile X Syndrome (Alters and Schiff 2011). Consequently, during the time period in which abortion was legalized, women had access to fetal health information that could have led a mother to seek an abortion. 1 There is some evidence that women utilized abortion services based on this information. Smith et al. (1980) find that abortion legalization accounts for 43 percent of the decrease in Down s Syndrome cases in Hawaii from However, it is important to note that some of this decline is in part due to a decrease in the total number of births because some of the infants born would have had Down s Syndrome. 4. Cohort Size: Abortion access reduces the size of the population cohort. Therefore, there may be smaller classes in school, leading to greater individualized attention, and more available entry level jobs, resulting in lower unemployment levels for the cohort. These outcomes can impact adult health and mortality, most likely by increasing income levels of the cohort. In addition, the standard model of the child quality/quantity tradeoff suggests that an unwanted pregnancy would decrease the quality of care for all children in the household (Becker 1981), also leading to increased mortality rates in adulthood. However, this model suggests that the adult mortality of all siblings should be affected by abortion legalization, not just the mortality of those born after the laws are passed. My empirical strategy is not suited to capture this effect and if this tradeoff is happening, it would be less likely that I would find a statistically significant decrease in the mortality of those born after the legislation. 1 Evidence is lacking on the prevalence of sex-selective abortion. 6
 find that abortion legalization accounts for 43 percent of the decrease in Down s Syndrome cases in Hawaii from 1970-1977.")
8 The first three mechanisms are selection stories, while the last explanation concerns cohort size. It is likely that all these mechanisms are working in conjunction to impact the adult mortality of those born after legalization. I attempt to isolate the mechanisms at work in Section IX by examining evidence related to each of the four possible pathways. Understanding the mechanisms explaining the association between abortion legalization and adult mortality in the next generation is important because it will shed light on ways to improve the health of a cohort. III. Background and Literature Review Brief History of Abortion Legalization Prior to the national legalization of abortion in January of 1973, the date of the Supreme Court s ruling in Roe v. Wade, several states had already enacted legislation that made access to abortion legal. Hawaii legalized abortion in February of 1970, followed by New York in March of 1970, Alaska in April of 1970, and finally, Washington in November of 1970 (Potts 338). The California Supreme Court also legalized abortion prior to Roe v. Wade in its September 1969 decision in People v. Belous (Rosenberg 263). As a result the legalization of abortion can be broken down into two periods: early legalization, the time period prior to 1973 when the early states legalized abortion, and after 1973, when it was made legal nationally through the Supreme Court decision in Roe v. Wade in January of 1973 for the remaining states. Research on the impact of the laws demonstrates that women took advantage of abortion services once they became legal, though there is a slightly lagged effect of abortion legalization and geographical variation in abortion use. In 1970, when abortion became legal in the early states, there were estimated to be about 200,000 legal abortions in the United States. By 1971, this estimate reached nearly 500,000, increasing to 600,000 in 1972 and to over 750,000 in 1973, the year abortion was legalized for the rest of the states. The 1973 estimate represents an increase 7

9 of 27% over the number reported in 1972 while the estimate for 1974, 900,000, represents an increase of 20% over the 1973 estimate, evidence of a slightly lagged effect of abortion legalization (Weinstock et al. 1975). There was considerable geographic variation in the utilization of abortion services. For example, the states with the highest abortion rates in 1973 are New York, with an abortion rate of 53.7 per 1000 women ages 15-44, Washington D.C. with an abortion rate of 234.4, and California, with an abortion rate of The states with the lowest abortion rates are located in the Midwest and South including Mississippi, with an abortion rate of 0.2, Indiana, with an abortion rate of 1.6, Utah with an abortion rate of 0.4 and Oklahoma, with an abortion rate of 1.1. The overall abortion rate for the United States in 1973 was 16.5 (Weinstock et al. 1975). There was also variation in the number of abortions performed in each state, evidence of differential access. Some states, including Mississippi, Louisiana, West Virginia, North Dakota and Utah, had no change in the number of abortions performed after legalization, suggesting that Roe v. Wade did not translate to access. Other states, like Michigan, Illinois and Ohio had large percentage increases after However, these percentage increases are misleading because the number of abortions in these states was so low in the first quarter of 1973 that any small increase produced a high percentage increase. Consequently, abortion legalization through Roe v. Wade may not have the same impact on the adult mortality in the next generation as early legalization because women may still have been unable to utilize abortion services in some states (Weinstock et al. 1975). 2 2 There was variation in state abortion policies prior to Roe v. Wade. Twenty-one states had liberal abortion policies before 1973, allowing abortion if the health of the mother was in danger. It is unclear if the liberal policies translated to more access in these states. The rest of the states did not have similar exceptions. 8

10 There was also substantial variation in the abortion rates based on age and race. The abortion rate among white women from 1972 to 1974 was 14.1, while the abortion rate among non-white women was twice that, Among women under 20 years old, the abortion rate for white women was 20.6, while the abortion rate for non-white women was double, 43.8, suggesting that teens, especially non-white teens, used abortion services much more frequently. A similar pattern continues for women ages Although the abortion rate for non-white women continues to be twice that for white women among those ages 25-29, abortion rates decreased to 35.0 for non-white women and 14.0 for white women. The abortion rates continue to decrease for both white and non-white women as the age of the women increases, with nonwhite women consistently having abortion ratios double that of white women. By the time women are over 40, the abortion rates are much lower, 2.5 for white women and 4.3 for nonwhite women (Tietze 1977). These data suggest that both the age and race of women are significant factors in determining abortion use and begin to hint at possible selection effects occurring as a result of abortion legalization. Births For abortion legalization to have an impact on adult mortality in the next generation, or any other outcome, women had to have utilized their access to abortion. Research on the impact of abortion legalization on the number of births and fertility suggests that women did utilize abortion services once they became legal. Levine et al. (1996) find that abortion legalization prior to Roe v. Wade led to a 5% decline in birthrates in those states with early legalization, with a decline in birthrates in the rest of the states after Roe v. Wade of roughly equal magnitude. Gruber et al. (1999) and Ananat et al. (2009) also find similar declines in birthrates. These results suggest significant effects of abortion access on births, consistent with the hypothesis that 9

11 abortion legalization would change cohort size and composition. It is therefore plausible that abortion legalization would impact mortality for affected cohorts. Impact on Women of Childbearing Age Research has also been conducted on the impact of abortion access on the labor outcomes of women. For example, Kalist (2004) determines that the probability of a woman working increases by almost 2% in states adopting legalized abortion prior to Roe v. Wade. Similarly, Bailey (2006) demonstrates that access to birth control before age 21 increased the level of laborforce participation of women ages 26 to 30 by approximately 8%. Since abortion access increases labor force participation, women will have higher earnings after legislation, and consequently, the children they choose to have will most likely be healthier, leading to reduced adult mortality rates for exposed cohorts. Children A substantial amount of the empirical research on abortion legislation focuses on its impact on childhood outcomes. Gruber, Levine, and Staiger (1999) provide evidence that there is sizable positive selection resulting from abortion legalization. They find that the marginal children, who would have been born if not for abortion legislation, would have been 60% more likely to live in a single parent household, 50% more likely to live in poverty, 45% more likely to reside in a household collecting welfare, and 40% more likely to die during the first year of life. These outcomes would subsequently impact the health of these marginal children, an effect that would extend to adulthood because of the high correlation between childhood and adult health. Bitler and Zavodny (2004) examine the relationship between abortion legislation and child abuse. They determine that the availability of legal abortion decreases child abuse and neglect 10
 demonstrates that access to birth control before age 21 increased the level of laborforce participation of women ages 26 to 30 by approximately 8%.")
12 reports by about 10 percent, an effect that is statistically significant at the 5% level, and would certainly impact the health of those cohorts born after abortion legalization in childhood and adulthood. There is substantial evidence that health in childhood influences health in adulthood. Johnson and Schoeni (2007) find that low birth weight significantly increases the onset of asthma, hypertension, diabetes, coronary heart disease, and stroke or heart attack through middle age, working through the pathway of limited parental resources. Case et al. (2001) demonstrate that the adverse health effects of growing up in a lower income family accumulate over children s lives, so that disadvantaged children enter adulthood with even poorer health than children growing up in wealthier families. They suggest that this effect is working through the association between childhood chronic conditions and household income. Case et al. (2005) find that children who have experienced poorer uterine environments and health in childhood have significantly poorer health in adulthood, in part because they have lower educational attainment and lower socioeconomic status as adults. Since abortion legalization has previously been associated with an improvement in child health and resources and since there is a substantial literature linking childhood disadvantage to adult health, it is plausible to expect that abortion legislation would also lead to an improvement in adult health and a decrease in young adult mortality. This paper is the first to examine this possibility. Adolescents There is also some empirical research on the impact of abortion legislation on adolescent outcomes. For example, Charles and Stephens (2006) determine that for birth cohorts in-utero in 11

13 the five states that legalized abortion prior to Roe v. Wade, there was significantly less use of controlled substances in 12 th grade, compared to cohorts born in states that had not legalized abortion during the same period. This effect was most visible for the use of the most serious drugs, such as illegal narcotics. Consequently, it can be expected that those cohorts born after abortion legislation would be less likely to engage in the risky behavior that leads to death in ages Adults The effects of abortion legislation also extend into adulthood. Ananat, Gruber, Levine, and Staiger (2009) find that the marginal birth is 23% to 63% more likely to be a single parent, 73% to 194% more likely to receive welfare and 12% to 31% less likely to graduate college. Pop-Eleches (2006) finds this same effect in Romania, following a major policy change restricting abortion access. He finds that, when controlling for the composition of women receiving abortions, children born after the abortion ban had substantially worse schooling and labor market outcomes and had inferior socioeconomic outcomes as adults, confirming the impact of abortion legislation on adult outcomes. These results suggest that the increased availability of abortions after legislation would positively impact the education and income of the population cohorts born after legalization, thus decreasing the cohort s mortality rates. In addition, Donohue and Levitt (2001) find that an increase of 100 abortions per 1000 live births is associated with a reduction of 12% in murder, 13% in violent crime, and 9% in property crime (Donohue and Levitt 404). 3 The decreased probability of murder would 3 The results of this paper are highly debated. Joyce (2004) contends that Donohue and Levitt s results are unreliable because of omitted variable bias, specifically the omission of variables accounting for cocaine use and changes in the cocaine market within states over time. Joyce (2004) replicates Donohue and Levitt s study controlling for this omitted variable and his results no longer demonstrate the negative and statistically significant impact of abortion legalization on crime in the next generation. Donohue and Levitt (2004) respond to these concerns by including 12

14 decrease the mortality rate of deaths caused by homicide and the generally lower crime rate would reduce health issues associated with allostatic load, the cumulative impact of episodes of high repeated stress resulting from exposure to a highly stressful environment (Smith 162). Although this existing research reveals the impact of abortion legalization on a variety of childhood and adult outcomes for affected cohorts, no previous work directly examines the effect of abortion access on adult health or mortality. This relationship is important because it would establish whether the positive health impacts of abortion legislation on children extend into young adulthood. In addition, any evidence of an association between abortion legalization and young adult mortality would be suggestive of a continued impact as this cohort ages. IV. Methodology To examine the impact of abortion access, I exploit the differential timing of abortion legalization across states, as described in the previous section. Model The main model I employ is a Fixed Effects model, with a birth state-birth month unit of observation. By including state fixed effects, the model is controlling for any time-invariant factors that could affect mortality. The fixed effects model identifies the effect of legalization from changes within states over time. By including birth month fixed effects, the model is controlling for any factors occurring nationally in each month that impact the health of the particular birth cohorts I am examining. variables taking cocaine use into account, but by extending the time period beyond the one Joyce uses, and find that legalized abortion did lower crime. As a result, they contend that Joyce s failure to obtain similar effects can be attributed to his decision to study too small of a time period. Foote and Goetz (2008) also claim that Donohue and Levitt s results are driven by omitted variable bias. Specifically, they contend that since high abortion states tended to be high crime states before legalization, another factor correlated with abortion use drove the decrease in crime. Donohue and Levitt (2008) attempt to address this concern with new specifications and find a continued association between abortion legalization and crime. 13

15 Though there could be bias stemming from factors that impact births and the mortality of the next generation which happen at the same time as abortion legalization, the fixed effects model has been used in the prior literature on abortion. Bitler and Zavodny (2004) utilize a similar model containing state and year fixed effects and an independent variable indicating the abortion policy during the year of conception to measure the impact of abortion legalization on child abuse frequency and severity. Donohue and Levitt (2001) also employ a fixed effects model with state and time fixed effects to analyze the effect of abortion on crime in the next generation. 45 Births To investigate if abortion legalization affected the mortality rates of those born after legalization, it is informative to first analyze the impact of abortion legalization on the birthrate. The fixed effects model is as follows: birthrate bs = β 0 + β 1 legal18 bs + γ b + δ s + X bs β + µ bs The variable birthrate represents the birthrate per 1000 women in a state and month, calculated by dividing the total number of births by the population of women ages in a certain state and birth month and multiplying by The variable legal18 is a dummy variable indicating whether abortion was legal eighteen months prior to the birth of the cohort. This variable incorporates the possibility of a lagged effect of abortion legalization on births, something I consider in more detail later. I expect to see a negative value for β 1, the coefficient 4 Another specification employed in the literature is a difference-in-differences model, which exploits the fact that some states legalized abortion prior to Roe V. Wade. I also utilize this model to examine the impact of abortion legalization on adult mortality. See Appendix D for more information and results. 5 Some of the literature utilizes the abortion rate, pregnancy rate, or birthrate to indicate abortion access, such as Ananat et al. (2009) and Donohue and Levitt (2001). I choose not to use these measures because, as explained in Joyce (2004), they may be endogenous, while the variation in legalization is arguably exogenous. In addition, it is difficult to find accurate data on the abortion rate prior to legalization. 14

16 on legal18, because if women take advantage of the fact that abortion is legal, the number of births should decline. The model includes state of birth fixed effects, represented by δ s, and birth month fixed effects, represented by γ b. As a result, this model is examining changes in the birthrate within a particular state over time. The controls, represented by X, include other legal developments that could impact women s fertility, such as laws facilitating birth control pill and abortion access for minors, 6 and µ represents the error term. These controls are only used in some specifications. In all of these regressions, I cluster the standard errors by statebth because sequential observations from the same state are not independent. I also weight regressions by the total population of women ages 15-44, to give more emphasis to states with larger underlying populations. Furthermore, I use these models for more detailed regressions, examining the impact of abortion legalization on teen births and births by race. Deaths I then use the fixed effects models examine the impact of abortion legalization on deaths. The model is as follows: deathrate bs = β 0 + β 1 legal18 bs + γ b + δ s + X bs β + µ bs As before, the variable legal18 indicates whether abortion was legal eighteen months prior to birth, and it measures changes in mean mortality rates, stemming from abortion legalization, within states over time. I expect to see a negative value for β 1, the coefficient on legal18, if abortion legalization does, in fact, decrease adult mortality. The variable deathrate represents a mortality rate per 1000 births within a birth state and birth month, calculated by dividing the total number of deaths by the total number of births and multiplying by As 6 See Section X for results. 15

17 with the first model, this model includes state of birth fixed effects, represented by δ s, and birth month fixed effects, represented by γ b. The birth cohort dummies capture national death trends for year olds over time. The controls, the fraction of the birth cohort that is black, other race, and male, represented by X, control for confounding population characteristics that could be related to mortality rates. In addition, I control for other legal developments that could impact women s fertility, as in the first model. Standard errors are clustered by statebth and µ represents the error term. I also weight certain regressions by the total number of births in each birth month and state of birth, birthcount. In addition, I use these models for more detailed regressions, examining the impact of abortion legalization on mortality rates by race, gender, and by cause of death. For the race and gender regressions, rather than weighting by birthcount, I weight by the number of individuals born of that race or gender. If males in their 20 s are more likely to engage in the types of risky behavior that can lead to such early deaths, I would expect to observe larger impacts of abortion legalization on the mortality rates for males than for females. Cobb-Clark et al. (2009) explain that adolescent girls and boys appear to have differential reactions to stressful events leaving boys more likely than girls to engage in a range of risky behaviors (Cobb-Clark et al. 7). Also, previous literature (Kirchengast et al. 2009), demonstrates that males are more vulnerable to stress factors in utero. Consequently, if abortion legalization reduces the frequency of stress factors in utero that disproportionately affect male babies, the health of the male cohort born after legalization may be more positively impacted than the health of the female cohort. 16

18 In addition, Johsnosn and Schoeni (2007) find that racial differences in early life conditions play a dominant role in explaining racial disparities in chronic health conditions through at least age 50 (Johnson and Schoeni, 4). Given this previous literature, I expect to observe larger decreases in mortality rates for blacks given the correlation between race and disadvantage in childhood, especially if black mothers are more likely to utilize abortion services than white mothers. Furthermore, disadvantage in childhood is related to risky behavior in adolescence and adulthood. For example, Katz et al. (2001) find that boys in families receiving randomly assigned housing vouchers, as part of the Moving to Opportunity (MTO) demonstration, had fewer behavior problems than boys in control group families. Cobb-Clark et al. (2009) find that, for 18 year olds in Australia, growing up in a family receiving welfare is associated with a significantly higher propensity to be in trouble with police/attend juvenile court and smoke cigarettes and marijuana, effects primarily stemming from maternal investment and decision making. Similarly, Fergusson et al. (2007) find a positive and statistically significant association between childhood disadvantage and smoking at age 25 in New Zealand. Consequently, since those children born after abortion legalization were less likely to live in poverty and be on welfare (Gruber, Levine, and Staiger, 1999), and utilize drugs in adolescence (Charles and Stephens 2006), they may also be less likely to engage in risky behavior and substance abuse in adulthood. Although smoking and marijuana use would most likely not affect health at ages 20-30, this behavior is a good indicator of whether individuals are likely to engage in other types of risky behavior. Consequently, I expect there will be a significant decrease in mortality rates for deaths caused by risky behavior. Smoking and marijuana use would also have significant 17

19 impacts on health later in life, so I would expect that as this cohort ages past 30, the positive health effects of abortion legalization would continue. Lagged Structure It is also possible that there will be a lagged effect of abortion legalization on mortality. There could be a lagged effect if legalization does not increase access to abortion services right away. Gruber, Levine, and Staiger (1999) provide some justification for a lagged measure of legalization, stating that legalization may not have implied a large increase in de facto access (Gruber 270), due to the time it takes to set up clinics. In addition, the 1973 estimate of reported legal abortions represents an increase of 27% over the number reported in 1972 while the estimate for 1974, 900,000, represents an increase of 20% over the 1973 estimate, evidence of a slightly lagged effect of abortion legalization (Weinstock et al. 1975). In addition, it is also possible that a lagged effect could result from differential selection. If the women who utilize abortion services after abortion has been legal for some time are different than those who do so initially in ways that make them more likely to raise unhealthy children, there will be an evolving impact of abortion legalization on adult mortality. I use legal18, a lagged measure of abortion legalization as my main independent variable to enable the model to account for any time it takes for legislation to translate into access for all women. In other models, I include a further lagged measure of legalization, legal30, representing if abortion has been legal for thirty months. In some models I also utilize a variable that accounts for whether abortion was legal six months prior to birth, legal6. This variable does not account for the time it takes for legislation to translate to access and is lagged six months only to account for the inability of women pregnant for more than three months to obtain an abortion. These variables are substituted for legal18 in the regression model. 18
 provide some justification for a lagged measure of legalization, stating that legalization may not have implied a large increase in de facto access (Gruber 270),")
20 It is important to note that legal30 is capturing almost entirely the impact of the early legalizer states because once abortion legalization is lagged by two years, the Roe v. Wade states will only have abortion as legal for a few months. As a result, the regressions demonstrating the impact of whether abortion is legal for 30 months prior to birth are mainly identifying the impact of early legalization. Similarly, legal18 is mostly driven by the early legalizer states. Since legal18 is the primary independent variable used, this paper is mainly focused on the effects of abortion in the states that legalized prior to Roe v. Wade. Exogeneity of Legalization The exact timing of changes in the law is plausibly exogenous because although demand for abortion may gradually be changing, the laws changed at one point in time (i.e. through a Supreme Court decision or as the result of idiosyncratic political moments). Although there may have been characteristics about early states that influenced legalization, the early states were not necessarily the states that first granted minors access to abortion and birth control 7 and did not have the most liberal policies in these circumstances, making it seem as if there is no sustained approach toward these types of policies that systematically differs across states. Furthermore, many previous studies have examined the impact of abortion legalization utilizing the legal changes as plausible exogenous shocks. Potential Problems There are some potential limitations inherent in these models. First, I use abortion legislation as a proxy for the number of abortions. Many former papers have made this same assumption, supporting it with the fact that the number of documented abortions rose sharply 7 See Section X for more information. 19

21 from under 750,000 in 1973 to over 1.6 million in 1980, suggesting that the number of abortions increased dramatically following legalization (Donohue 385). However, legislation may not have an immediate impact. I attempt to address the first problem by including variables that examine the lagged impact on legislation, such as the legal18 and legal30 variables. Though I attempt to control for confounding state, birth month, and population characteristics, my models exclude other variables relevant to adult mortality. If these variables changed at the same time as abortion policy, the estimated effect of abortion legislation will be biased. However, in Section X, I control for minor s access to birth control and abortion, laws that changed during the same time period. I also control for the racial composition of the births for this cohort. Furthermore, I do not have information indicating the deceased individual s education or income, and although these would most likely be endogenous, they would help determine mechanisms through which abortion legislation impacts mortality. However, in Section IX, I use Census data to control for the educational attainment and income of this cohort. V. Data Natality Data: The natality data are obtained from the National Vital Statistics System of the National Center for Health Statistics and are found on the National Bureau of Economics Research website. The data set is obtained from birth certificates amassed by each state in every year and includes an individual s year of birth, state of birth, month of birth, race and gender. The data I use are from , capturing the births of those during early legalization and immediately after Roe v. Wade. I create dummy variables indicating gender and race and a variable, 20
22 birthcount, to indicate the total number of births in each state in every month and year. I drop all observations for which state of birth was either outside the United States or missing. 8 Mortality Data: The Multiple Cause-of-Death Mortality Data are from the National Vital Statistics System of the National Center for Health Statistics and are found on the National Bureau of Economic Research website. This data set is a 100% sample of death certificates amassed by each state in all years and includes an individual s state of birth, age at death, month of death, cause of death, gender, and race. The data I use are from , which captures the age range of all cohorts born I obtained the most recent years of data, 2005 and 2006, through a special request through the National Center for Health Statistics, in order to receive the state of birth information for each individual who died in these years. I drop all of those observations for which the state of birth (statebth) was outside the United States or missing. I create a variable to indicate the birth month of the individual, using data on the age at death and year of death. 9 I create dummy variables which indicate the gender and race of the individual who died. These variables are used to generate a count of the total number of individuals who died in each state who were born in a certain birth month. Counts are also created by race, gender, and cause of death. 8 See Appendix A for additional information about the natality data 9 See Appendix A for complete methods on creating the birth month variable 21
23 Population Data: In order to create birthrates, I utilize the estimates of the population of states by age, sex, and race from These data are obtained from the Census archives website and contain the population of each state broken down by gender, age, and race. Since the data only contain yearly estimates, I assume that the population remains constant throughout the year. Also, since the data do not include population estimates for years prior to 1970, I assume that the population estimates for 1968 and 1969 are the same as those reported for I create variables that indicate the total number of women ages 15-44, the total number of women ages 15-19, the total number of women ages 20-34, and the total number of women ages 35-44, and create race specific versions of these variables. I divide the number of births to women of each age group by these variables to create the birthrates. Legalization Data: To incorporate the abortion legalization data, I create a data set including the state, the year and the month, and variables indicating whether or not abortion was legal six, eighteen, and thirty months before the individual was born. I create these lagged variables to test whether it took time for abortion legalization to translate in to access to abortions. I also create a variable birthmonth to indicate the year and the month an individual was born, as with both the mortality and natality datasets, and dummy variables legal6, legal18, and legal30, indicating whether abortion was legal six, eighteen, or thirty months prior to birth. Overall: I then combine the mortality data, natality data, population data, and abortion legislation data. I create the overall mortality rate per 1000 births, deathrate, by dividing the total number 22
24 of deaths for the cohort, by the total number of births, and multiplying it by I subsequently generate the mortality rates for each cause of death, gender and race. Also, I create gender and race specific mortality rates. 10 Finally, I create variables to use as controls in my regressions, including the fraction of the population of a certain race and the fraction of the population of a certain gender. 11 It is important to note that the data are constructed to examine state of birthbirth month cohorts as they age into adulthood. Summary Statistics: Table 1 demonstrates the summary statistics for all variables involving births. There are a total of 4896 observations, with each observation representing one state in one month. The summary statistics for the overall birthrate are weighted by the total number of females ages in each state and birth month. For more specific birthrates, the summary statistics are weighted by the population of women in each state and birth month with the relevant characteristics (i.e. the black birthrate is weighted by the total number of black women ages and the teen birthrate is weighted by the total number of women ages 15-19). On average, there are around 7 births per 1000 women in every state in each month from , illustrated by the mean of the birthrate variable. The average white birthrate within each state and birth month is around 6 births per 1000 white women, while the average black birthrate within each state and birth month is larger, reaching 9 births per 1000 black women. The average teen birthrate within a state and birth month is 5 births per 1000 teenage females, a little smaller on average than the overall birthrate. The average white teen birthrate is 4 births per 1000 white 10 In addition, for the gender variables, I create a second mortality rate, using half of the total number of births as an estimate of the number of females and males born because a population usually is half male and half female. Using this variable does not change the results of my regressions. 11 I use additional control variables to explore possible mechanisms through which abortion legalization impacts adult mortality. For more information, see Section IX. 23
25 teen females, while the mean black teen birthrate is more than double that, reaching 11 births per 1000 black teen females in a state and birth month, which is almost double the overall birthrate. Table 2 demonstrates the summary statistics for all variables involving deaths. Again, there are 4896 observations, representing every state in each birth month. These variables represent the mortality information for the birth cohort born from after this cohort has entered adulthood (ages 20-30). The summary statistics for the overall mortality rate and the mortality rates for the causes of death are weighted by the total number of births in each state and birth month. For more specific mortality rates, the summary statistics are weighted by the number of births with the relevant characteristics (i.e. the black mortality rate is weighted by the total number of black births). The average mortality rate within a state and birth month is around 11 deaths per 1000 births. The average white mortality is slightly smaller, reaching 9 deaths per 1000 white births, while the average black mortality rate is double the white mortality rate, reaching 18 deaths per 1000 black births. The average male mortality rate, 15 deaths per 1000 male births, is higher than the average female mortality rate, 6 deaths per 1000 female births. When the mortality rates are broken down by race and gender, the average mortality rate is largest for black males, reaching 26 deaths per 1000 black males born within a state and birth month. The next largest mortality rate is for white males, who have an average mortality rate of 13 deaths per 1000 white males born, followed closely by black females, who have an average mortality rate of nearly 10 deaths per 1000 black females born, followed by white females, who have an average mortality rate of 5 deaths per 1000 white females born. When the mortality rates are broken down by cause of death, the highest mortality rate occurs for deaths caused by all risky behavior (motor vehicle accidents, drug accidents, and homicide), reaching a rate of over 4 deaths per 1000 births within a state and birth month. Deaths caused by motor vehicle accidents 24
26 alone reach a rate of almost 3 deaths per 1000 births within a state and birth month, followed by deaths caused by homicide and suicide, both of which have an average mortality rate of over 1 death per 1000 births. The remaining causes of death, drug accidents, heart disease, and suicide, all have an average mortality rate of less than 1 death per 1000 births. Data Trends: Births: Figure 1 demonstrates the general trend in the birthrate from Each point on the line represents a six month interval, so the figure is illustrating the changes in the averages over six months in the birthrate. The averages are weighted by the total female population ages The vertical access does not start at zero to allow for a closer look at the trend in the birthrate. The line labeled Early represents the early legalizer states and the line labeled Non- Early represents all other states. The birthrates are similar in early and non-early states. There is a general decline in the birthrates for both the early and non-early states after , the time period in which early legalization occurred, with an overall decrease of around two births per month per 1,000 women for both the early and non-early states. The decline in the birthrate for early states is much steeper, consistent with the fact that they legalized first. There is a slight drop in the birthrate for the non-early legalizer states in 1973, when abortion is legalized through Roe v. Wade, but there does not appear to be a general downward trend in the birthrate after 1973, as there is after 1971 for non-early states. One explanation for this could be that women in non-early states were able to travel to early legalizer states to receive an abortion. Specifically, women in states adjacent to California and New York may have been able to take advantage of the increase in abortion access nearby. 12 It is also possible that Roe v. Wade did not lead to the 12 See Section X for more discussion of this issue. 25
27 building of abortion clinics and consequently, did not translate to access. It is necessary to turn to regression analysis to determine the true impact of abortion legalization on the birthrate. Deaths: Figure 2 demonstrates the general trends in the age mortality rate for individuals born in As before, graph shows in averages over six months. The vertical access does not start at zero to allow for a closer look at the trend in the mortality rate. The mortality rate is similar in non-early states and early states. There seems to be a gradual decrease in the mortality rate in early legalizer states for cohorts born after 1971, suggestive of an effect of abortion legalization on deaths. There is a slight dip in the young adult mortality rate in nonearly states for cohorts born after 1973, but this decrease does not seem to be any larger than the normal fluctuations in the mortality rate, suggesting that abortion legalization through Roe v. Wade is not associated with a decrease in deaths. Nevertheless, it is unclear what the effect of abortion legalization is, making it necessary to look at the relationship in more detail through regression analysis. 13 VI. Main Results Overall: The Fixed Effects models illustrate that abortion legalization was associated with a lower birthrate. All of the regressions in Table 3, and in this paper, include fixed effects, which can 13 Figure 2 demonstrates substantial seasonal variation in the mortality rate based on birth month. Mortality rates appear to be larger for those individuals in the winter months than in the summer months, regardless of year of birth. This seasonal variation is not surprising and the health effects of being born in the winter are well documented in the literature. Buckles and Hungerman (2010) explain that on average, those born in the winter have worse outcomes than other individuals, including less schooling and lower wages, results that most likely would impact mortality in adulthood. This result can be attributed to differences in the women giving birth in the winter. Specifically, Buckles and Hungerman (2010) find that women giving birth in the winter tend to be younger, less educated, and less likely to be married, characteristics that impact the outcomes of their children. 26
28 account for the high R-squared values. Regressions 1-3 are weighted by the total female population ages When abortion has been legal for six months, as captured by the legal6 variable, the decrease in the birthrate is statistically significant and substantial. Regression 1 demonstrates that if abortion was legal six months before birth, the birthrate is lower by.27 percentage points (about 4%) within state and birth month, compared with if abortion was not legal six months prior to birth. Regression 2 suggests that when abortion has been legal for 18 months, the birthrate is lower by.24 percentage points (4%) within a state and birth month, compared with abortion was not legal eighteen months prior to birth, a result that is statistically significant at the 1% level. Regression 3 demonstrates that when abortion has been legal for thirty months, abortion legalization is no longer associated with a statistically significant decrease in the birthrate. Consequently, Table 3 illustrates that abortion legislation is associated with the largest decrease in the overall birthrate six and eighteen months after legalization, evidence of a slightly lagged effect of abortion legislation. 14 By Age of Mother: As Table 3 demonstrates, abortion legalization is associated with a larger decrease in the teen birthrate than in the overall birthrate. Regressions 4-6 are weighted by the total female population ages The teen birthrate decreased by about.35 percentage points (a decrease of 6%) within a state and birth month six months after abortion was legalized, as shown by Regression 4. The largest decrease in the teen birthrate,.45 percentage points (8%), occurred when abortion was legal for eighteen months prior to birth. In addition, legal30 has a negative and significant effect on the teen birthrate, demonstrated in Regression 6, suggesting that the 14 I also run these same regressions using the logarithm of births instead of the birthrate and find similar results for these regressions and the more detailed ones to follow. See Appendix B for results. 27
29 impact of abortion legalization on teen births persisted longer than its effect on the aggregate birth rate. By Race: Table 4 contains regressions examining the impact of abortion legalization on birthrates by race and demonstrates that the effects are significant for both white and black births, with larger results for the black birthrate. All of the regressions in this table are weighted, Regressions 1-3 by the total number of white women ages and Regressions 4-6 by the totally number of black women ages Regressions 1 and 4 illustrate that the coefficients on legal6 are negative and significant at the 1% level for both white and black birthrates but the coefficient on legal6 in regression 4 is about twice as large as that in Regression 1, suggesting that abortion legalization is associated with a greater decrease in the black birthrate than the white birthrate. There is also a statistically significant decrease in the white and black birthrates eighteen months after legalization. The birthrates decreased by about.23 percentage points for whites (about 4%) and.54 percentage points (about 6%) for blacks within a state and birth month eighteen months after abortion was legalized, results that are significant at the 1% level. The coefficient on legal30 is negative but insignificant for both white and black births, evidenced by regressions 3 and 6. Age and Race: Table 5 contains regressions demonstrating a statistically significant impact of abortion legalization on the birthrates for white teens and black teens. Regressions 1-3 in this table are weighted by the total population of white women ages and Regressions 4-6 are weighted by the total population of black women ages The white teen birthrate decreased by about 28
30 .27 percentage points (6%) and the black teen birthrate decreased by about.94 percentage points (over 8%) within a state and birth month six months after abortion was legalized, statistically significant results, as shown by Regressions 1 and 4. These effects become larger and remain significant eighteen months after legalization, reaching almost a.4 percentage point (8%) decrease in the birthrate for white teens and a 1.3 percentage point decrease in the birthrate for black teens (over 11%), suggestive of a lagged impact of abortion. A decrease of.3 percentage points (more than 6%) is sustained thirty months after legalization for white teens, as demonstrated in Regression 3, and the decrease in the birthrate for black teens is.86 percentage points (almost 8%). Both results are statistically significant at the 1% level, evidence of a continued lagged effect. These results again highlight that abortion access was associated with a substantial reduction in births to young women. Deaths: Overall: The Fixed Effects models demonstrate that abortion legalization has a statistically significant and negative impact on the young adult mortality in the next generation. Table 6 illustrates the impact of legal6 and legal18 on the mortality rate of adults ages 20-30, calculated by dividing the total number of deaths among members of a birth state-birth month cohort by the total number of births. Abortion legalization is associated with a statistically significant decrease in mortality rates six months after legalization in the weighted regression, demonstrated in Regression 3. The coefficient on legal6 suggests that, if abortion was legal six months before the birth of a cohort, the mean adult mortality rate for that cohort is lower by about.12 percentage points (about 1%) within a state and birth month, compared with if abortion was not legal six 29
31 months before. Although insignificant in the unweighted regressions, the coefficient on legal18 is negative and significant at the 1% level in Regressions 7 and 8 and suggests that, for those born eighteen months after legalization, abortion is associated with a decrease in adult mortality of.29 percentage points (almost 3%). It is important to note that the control variable, fractionblack, indicating the fraction of the population that is black, is negative and significant level in most of the regressions in Table 6. This result is counter-intuitive because blacks tend to have higher mortality rates than whites, but may be explained by the fact that the fraction of the population that is black is not likely to change much within a state over a seven year period. None of the other control variables are significant and including the controls does not change the significance of the results. Table 7 illustrates that abortion legalization continues to be associated with a statistically significant negative impact on the mortality rate for those born thirty months after legalization. The coefficient on legal30 is significant in the unweighted regressions at the 1% level, as well as in the unweighted regressions. Regression 3 demonstrates that, if abortion was legal thirty months before birth, the mean mortality rate is lower by about.51 percentage points within a state and birth month (almost a 5% decrease) compared with if abortion was not legal thirty months before. The coefficient on legal30 is impervious to the inclusion of variables controlling for confounding population characteristics. Consequently, most specifications suggest that abortion legalization is associated with a negative and statistically significant impact on the adult mortality rate in the next generation. 30
32 By Race: Table 8 demonstrates that abortion legalization is associated with a reduction in the mean mortality rates of whites. 15 As shown in Table 8, abortion legalization is associated with a negative impact on the white mortality rate of adults born in the next generation six months after legalization, though this result is not significant. Abortion legalization is associated with a statistically significant decrease in the white mortality rate of.15 percentage points (almost 2%) eighteen months after legalization. The coefficient on legal30 is much larger than that on legal18 and suggests that thirty months after legalization, abortion legislation is associated with a.43 percentage point (almost 5%) decrease in the white mortality rate, a result that is significant at the 1% level. These results do not change when controlling for the fraction of the cohort that is male. Table 9 demonstrates that abortion legalization is associated with larger decreases in the black mortality rate in the next generation than in the white mortality rate. 16 Regression 1 demonstrates that abortion is associated with an early adulthood mortality decline of about.4 percentage points (a 2% decrease) within a state and birth month for blacks born six months after legalization, a result that is statistically significant at the 5% level and is not impacted when controlling for the fraction of males in the population, as shown in Regression 2. Abortion legalization is associated with larger effects for black individuals born eighteen months after the legislation that are significant at the 1% level. As shown in Regression 3, the mean mortality rate for blacks is lower by.85 percentage points (almost a 5% decrease) within a state and birth month, compared with if abortion was not legal eighteen months before birth. This result is three 15 All of the regressions in this table are weighted. 16 All of the regressions in this table are weighted. 31
33 times the size of the effect of abortion legalization on the overall mortality rate and more than five times the size of the effect of abortion legalization on the white mortality rate and is not impacted by controlling for the fraction of the cohort that is male. Abortion legalization is associated with an even larger, statistically significant negative effect on the black mortality rate thirty months after legalization, a result that is not impacted by the control variable. The coefficient on legal30 in Regression 5 suggests that, if abortion was legal thirty months before the birth of a cohort, the mean black mortality rate for that cohort is lower by about 1.2 percentage points (almost 7%) within a state and birth month, compared with if abortion was not legal thirty months before. Consequently, there is a very large impact of abortion legalization on the mortality rate for blacks, one that is larger than that for whites. By Gender: Table 10 demonstrates that abortion legalization is associated with significant decreases in the female mortality rate eighteen months after legalization. For those females born six months after legalization, abortion legislation is not associated with a decrease in the mortality rate. However, as Regressions 3 and 4 demonstrate, abortion legalization is associated with a decline in the female mortality rate of around.14 percentage points (a 2% decrease) within a state and birth month for those females born six months after legalization, a result that is significant at the 5% level and impervious to controls for confounding population characteristics. Abortion legalization continues to be associated with a reduction in the female mortality rate thirty months after legalization, though this result is not significant. Table 11 demonstrates that abortion legalization is associated with a larger reduction in male mortality rates than female mortality rates. The impact of abortion legalization on the male 32
34 mortality rate six months after legalization is negative but insignificant. As Regressions 3 and 4 demonstrate, abortion legalization is associated with a decline in the male mortality rate of more than.42 percentage points (almost a 3% decrease) within a state and birth month for those males born six months after legalization, a result that is significant at the 1% level and impervious to controls for confounding population characteristics. This effect is almost three times that seen on the female mortality rate eighteen months after legalization, demonstrating a much larger impact of abortion legalization on the male mortality rate than the female mortality rate. The coefficient on legal30 is larger than that on legal18 for males. Abortion legalization is associated with a decline in the male mortality rate of around.9 percentage points (a 6% decrease) in Regression 5 within a state and birth month for those males born thirty months after legalization, a result that is significant at the 1% level. The result continues to be significant at the 1% level after including controls and is much larger in magnitude than the analogous result for females. Therefore, the evidence is suggestive of is a much larger impact of abortion legalization on male mortality rates than on female mortality rates. By Race and Gender: Table 12 demonstrates that abortion legalization is not associated with a reduction in white male and white female mortality rates. Although for white males, abortion legalization does not have a significant impact six or eighteen months after legalization, thirty months after legalization, abortion legalization is associated with a.7 percentage point (5%) decrease in the white male young adult mortality rate. This result is significant at the 1% level and of a much larger magnitude that the analogous impact for white females. Abortion legalization is not associated with a statistically significant decrease six and thirty months after legalization for white females. However, abortion legalization is associated with a statistically significant 33
35 decrease in the white female mortality rate eighteen months after legalization. Regression 5 demonstrates that those white females born eighteen months after legalization have mortality rates that are lower by.15 percentage points (around 3%). Table 13 illustrates that abortion legalization is associated with a statistically significant decrease in the mortality rates of black males, an effect larger in magnitude than that of abortion legalization on the overall mortality rate, the black mortality rate, and the male mortality rate. As Regressions 1 demonstrates, abortion legalization is associated with a decline in the black male mortality rate of more than.8 percentage points (a 3% change) within a state and birth month for those black males born six months after legalization, a result that is significant at the 10% level. The effect is even larger for those black males born eighteen months after legalization. Abortion legalization is associated with a decline in the black male mortality rate of almost 1.8 percentage points (a 7% decrease) in Regression 2 within a state and birth month for those black males born eighteen months after legalization, a result that is significant at the 1% level. This result is more than four times the effect of legalization on males, two times the effect of legalization on blacks, and six times the effect of legalization on the overall mortality rate, suggesting a large part of the impact of abortion legalization on mortality is being driven by black males. The coefficient on legal30 in Regression 3 is still negative and significant at the 1% level and is suggestive of a 2.3 percentage point (9%) decrease in the black male mortality, demonstrating that the impact of abortion legalization continues for those born thirty months after legalization. There is not a significant decrease in the black female mortality rates, for those black females born six, eighteen, or thirty months after legalization, suggesting the effects of abortion legalization on the overall mortality rate are not being driven by black females. Therefore, abortion legalization is associated with the largest decline in mortality rates for black males born after the legislation. 34
36 VII. Instrumental Variables Analysis In addition to the fixed effects model, I use an Instrumental Variables analysis to examine the impact of abortion legalization on adult mortality, instrumenting the birthrate by the legal changes. Gruber, Levine, and Staiger (1999) utilize a similar two-stage least squares model, using the variation in abortion legalization across states and years to instrument for the birthrate. Ananat et al. (2009) also utilize this empirical strategy. This model has the benefit of only examining changes in the mortality rate working through the birthrate, as impacted by abortion legalization, and helps identify the relationship between the birthrate and the death rate. As a result, this model is demonstrating how abortion legalization impacts the birthrate when states legalized and then, in turn, how this change in the birthrate affects the mortality rate in the next generation. An IV model can also help gage the magnitude of the effect of each birth averted because of abortion legalization. The abortion laws are good instruments, fulfilling the requirements for valid instruments used in IV regressions. First, it is necessary for an instrument to be strongly correlated with the explanatory variable. The legalization variables fulfill this condition, as demonstrated in Table 14, which contains the first stage regression and provides evidence that there are statistically significant correlations between the law changes and the birthrate. It is also required that an instrument is uncorrelated with the error term, which implies that it is not caused by the outcome variable, is not correlated with omitted variables that influence the outcome variable, and only influences the outcome variable through its effect on the explanatory variable. If the changes in the law are exogenous, this requirement for an instrument would be fulfilled. As I noted in Section IV, the abortion law changes are plausibly exogenous, making them valid instruments. 35
37 Methods: The Instrumental Variables model is as follows: First stage: birthrate bs = π 0 + π 1 legal6 bs + π 2 legal18 bs + π 2 legal30 bs + γ b + δ s + ε bs The variable birthrate represents the birthrate per 1000 women in a state and month, calculated by dividing the total number of births by the population of women ages in a certain state and birth month and multiplying by As before, the variable legal6 indicates whether abortion was legal six months prior to birth, legal18 indicates whether abortion was legal eighteen months prior to birth, and legal30 indicates whether abortion was legal thirty months prior to birth. These variables are the instruments. I expect to see negative values for π 1, π 2, and π 3 because abortion legalization should decrease the birthrate. This model includes state of birth fixed effects, represented by δ s, and birth month fixed effects, represented by γ b. I also weight certain regressions by the total number of births in each birth month and state of birth, birthcount. Standard errors are clustered by statebth and ε represents the error term. Second stage: ^ deathrate bs = β 0 + β 1 birthrate bs + γ b + δ s + µ bs The variable deathrate represents a mortality rate per 1000 births within a state and birth month, calculated by dividing the total number of deaths by the total number of births and multiplying by The variable birthrate represents the birthrate predicted by the first stage regression. I expect the coefficient on birthrate, β 1, to be positive because as the birthrate 36
38 decreases, due to abortion legalization, the mortality rate should be reduced, as well. As with the first model, this model includes state of birth fixed effects, represented by δ s, and birth month fixed effects, represented by γ b. This birth cohort dummies capture national death trends for year olds over time. I weight regressions by the total number of births in each birth month and state of birth, birthcount. Standard errors are clustered by statebth and µ represents the error term. Results: Table 14 demonstrates that the birthrate, as predicted by the abortion legalization variables, has a positive and significant impact on the mortality rate. The first stage regression illustrates that legal6 and legal18 are strong predictors of the birthrate, fulfilling the requirement for good instruments, with negative coefficients significant at the 1% level. It is also important to note that legal6, legal18, and legal30 are jointly significant at the 1% level in the first stage regression. In the second stage regression, the coefficient on the predicted birthrate is positive, as expected, and statistically significant at the 1% level. The coefficient on the birthrate suggests that a decrease in the birthrate, stemming from abortion legalization, of 1 birth per 1000 women ages 15-44, decreases the mortality rate by around.8 deaths per 1000 births. This result is consistent with the fixed effects regression, demonstrating that a decrease in the birthrate caused by the abortion law changes reduces the mortality rate significantly An IV regression using the legal variables as instruments for the birthrate and teen birthrate suggest that a decrease in the teen birthrate, stemming from abortion legalization, of 1 birth per 1000 women ages 15-19, decrease the mortality rate by around 2 deaths per 1000 births, a result that is much larger than that for the overall birthrate and is significant at the 1% level. 37
39 VII. Discussion of Main Results The results of the Fixed Effects models suggest that abortion legalization is associated with a decrease in the birthrate. This effect is much greater for the teen birthrate, supporting the idea that abortion legalization decreased the number of births to mothers with characteristics which would disadvantage their children, rendering them unhealthy in adulthood. This result suggests that the effect of abortion legalization on adult mortality may be working through the pathway of altering quasi-permanent maternal characteristics. Since the impact of abortion legalization on adult mortality in the next generation is stemming from a change in the number and composition of the births, I expected to observe effects for those individuals born six, eighteen, and thirty months after legalization. Abortion legalization is associated with a statistically significant decrease in the mortality rates for those individuals born six, eighteen, and thirty months after legalization, confirming the hypothesis and suggesting that the health impacts of abortion legalization on children extend into adulthood. The Instrumental Variables analysis also confirms this result and is consistent with my hypothesis. The IV regressions demonstrate a positive and statistically significant impact of the birthrate, as predicted by the legalization variables, on the mortality rate, meaning that a decrease in the birthrate would also lead to a decrease in the death rate. It is important to note that the impact of abortion legislation on the adult mortality in the next generation is of the largest magnitude thirty months after legalization. However, the largest effect of abortion legalization on the births occurs eighteen months after legalization. Even though the drop in births was largest 18 months after legalization, it is possible that those mothers who had abortions 18 months after legalization and those that had abortions 30 months after legalization are different. For the effects I see on deaths to be stemming from this 38
40 differential selection mechanism, those mothers who had abortions 30 months after legalization would have to possess characteristics that make them more even likely to raise unhealthy children than those mothers who had abortions 18 months after legalization, such as low income and education. Abortion legalization impacts only the teen birthrate thirty months after legalization, providing some support for this theory. This question warrants further research. I will use legal18 as my main specification for the rest of this paper because the effect on births was the largest eighteen months after legalization. However, I will note when the specification yields different results from comparable analyses with the legal30 variable. The impact of abortion legalization on race and gender specific mortality rates sheds light on the mechanisms through which abortion legislation can impact health and mortality. Abortion legalization is associated with a much larger reduction in the birthrates for black individuals than for whites. This result is suggestive of a change in the racial composition of the cohorts born after legalization and provides evidence for selection based on maternal characteristics. I address this possibility in more depth in the Mechanisms section. Since black birthrate decreased substantially more after legalization than the white birthrate, a result that holds for the black teen birthrate, it is not surprising the mortality effect is larger for blacks. In the Mechanisms section, I examine the possible mechanisms through which legalization impacts mortality separately race because it is clear that these two groups are differentially affected by abortion legislation. Abortion legalization is associated with a more significant decrease in the mortality rates for males than for females. This effect most likely does not stem from selection based on maternal characteristics because there is no reason to suspect that abortion legalization affects 39
41 mother s characteristics differentially by gender of the child However, males may be more affected by adverse circumstances in-utero than females. In their study, Kirchengast et al. (2009) examine the impact of stress factors in-utero, such as maternal nicotine consumption and maternal age, hypothesizing that if males are more vulnerable to these types of stress factors, the male advantage in birth weight would be significantly reduced. They find results that confirm their hypothesis. Maternal nicotine consumption during pregnancy reduces the gender differences in birth weight significantly, as does a low maternal age (under 18). To the extent that stress factors in-utero disproportionately affect male babies, the health of a male cohort at birth and beyond may be more responsive to the policy environment. As I noted above, it is also possible that males living in disadvantaged circumstances as children for those born into less than ideal environments react in more risky and violent ways than females. If this is the case, one would expect to see a decrease in male risky behavior following legalization. The results demonstrate that abortion legalization is associated with the largest decrease in deaths of black males ages Some evidence for the risky behavior hypothesis is demonstrated by the fact that abortion legalization is associated with a statistically significant decrease in the number of deaths caused by drug accidents, and motor vehicle accidents. 20 Although these results start to shed light on the mechanisms through which abortion legalization impacts mortality and suggest that selection effects are primarily driving my results, the next section explores mechanisms in more detail. 18 Abortion legalization is associated with an analogous decrease in the birthrate of females and the birthrate of males. As a result, it does not seem as if abortion legalization changed the gender distribution of the population. 19 However, fathers presence is impacted by a child s gender. Dahl and Moretti (2008) find that fathers are 3.1% less likely to live with their children if their first born is a girl versus a boy. As a result, the gender of the first born sibling has an impact on the income of a family, with first-born girl families having lower income and higher poverty rights than first-born boy families. 20 For an extended discussion of the causes of death and risky behavior, see Section IX. 40
42 IX. Mechanisms The main goal of this section is to further understand the mechanisms through which abortion legalization impacts mortality. As noted above, abortion legalization could be impacting adult mortality through any of four pathways: decreasing the number of unwanted children, changing the characteristics of mothers, allowing mothers to abort a fetus with in-utero health problems, and decreasing the overall birth cohort size. Understanding the mechanisms underlying the relationship between legalization and adult mortality is important because it will shed light on ways to improve the health of a cohort, a desirable policy objective. Timing of the Pregnancy (Unwantedness): It is possible that the health effects of abortion legalization in adulthood are working through selection on wantedness, decreasing the number of pregnancies that are not timed optimally. Though mortality records do not provide information on wantedness, one can observe characteristics that are likely to proxy for unwantedness in the birth certificate data. I control for the fraction of the birth month-birth state cohort for which the father s age is reported on the birth certificate and mother s age at birth. 21 The presence of paternal information on the birth certificate is a commonly used proxy for paternal involvement at birth in the literature. Specifically, I use whether the father s age was reported at birth as a proxy for the father s presence, as did Fertig and Watson (2009). Father s age is not reported at all until 1969 so I drop 1968 from my sample when using these controls. The average cohort in my sample has father s age reported 90% of the time. 21 I do not know this information for individual deaths but only know it for the cohort. 41
43 I use the maternal age variables from the natality data to create cohort-level controls. Maternal age is reported in the natality data by every state from I create variables indicating the fraction of the cohort born to a teenage mother, the fraction of the white cohort born to a teenage mother, and the fraction of the black cohort born to a teenage mother. Results: Involvement of Father (Proxied by Whether Fathers Age is Reported) and Maternal Age: Table 15 demonstrates that, when controlling for wantedness, the impact of abortion legalization on the adult mortality of the next generation is smaller. Regression 1 in Table 15 represents the baseline Fixed Effects mortality rate regression once the 1968 mortality data is excluded. The coefficient on legal18 continues to be significant but is smaller than the coefficient on legal18 using the original dataset. After controlling for the fraction of the cohort with fathers age reported at birth and the fraction of the cohort with a teen mother, the coefficient on legal18 has decreased by.03 percentage points (15%) and has decreased in significance from the 5% level to the 10% level, suggestive of an effect of wantedness on the adult mortality in the next generation. The control variables are both positive though jointly insignificant. I also include wantedness proxies in the race-specific regressions. Regression 3 represents the baseline fixed effects white mortality rate regression once the 1968 mortality data is not included. The coefficient on legal18 in Regression 3 is substantially smaller than that in Table 8 and is no longer significant. After controlling for the fraction of the white cohort with fathers age reported at birth and the fraction of the white cohort with a teen mother, the coefficient on legal18 has decreased by around.04 percentage points. 42
44 Regression 5 represents the baseline fixed effects black mortality rate regression once the 1968 mortality data is not included. In Regression 5, the coefficient on legal18 is negative significant at the 5% level but smaller than the coefficient on legal18 in Table 9. After controlling for the fraction of the black cohort with fathers age reported at birth and the fraction of the black cohort with a teen mother, the coefficient on legal18 has decreased by.07 percentage points. Although controlling for the fraction of the black cohort with fathers age reported at birth does not eliminate the significance of the coefficient on legal18, it does reduce the magnitude of the coefficient by almost 15%. Therefore, Table 15 is suggestive of one mechanism through which abortion legalization impacts adult mortality. The father s age reported on the birth certificate and teen motherhood may be indicative of the wantedness of the pregnancy, factors that can influence the health of the next generation. 22 In sum, there is indirect evidence supporting the notion that legalization reduces mortality by promoting optimal timing of childbearing. Imperfect proxies for wantedness explain roughly 15 percent of the effect overall and black mortality rates; it is possible that wantedness would have a greater impact if it could be accurately measured. However, it is likely that there are other potential mechanisms at work and these are explored in the next section. Selection Based on Maternal Characteristics It is possible that the health effects of abortion legalization in adulthood are working through selection on maternal characteristics. Though mortality records do not provide information on individual maternal characteristics, one can construct birth month-birth year cohort characteristics using birth certificate data. I control for mother s education at birth. Also, 22 The results for legal6 and legal30 are comparable. 43
45 the birth and death regressions by race shed some light on selection based on maternal characteristics. I use the maternal education variables from the natality data to create cohort-level controls. Not all states report mothers education so these states are excluded from the relevant analyses. 23 As with fathers age, mothers education is not reported until 1969, so the natality data from 1968 is not included in this analysis. I create variables indicating the fraction of the cohort born to a mother with a high school diploma, the fraction of the cohort born to a mother that dropped out of high school, and the fraction of the cohort born to a college graduate. 24 I also create race specific versions of these variables. All control variables are at the cohort, not individual, level. Results: Race: As Tables 4 and 5 demonstrate, abortion legalization is associated with a larger decrease in black births and than white births and black teen births than white teen births. Consequently, the racial composition of those cohorts born after legalization is different than that for those cohorts born prior to the legislation. Tables 6 and 7 include regressions with a control for the fraction of black births, capturing the changing racial composition of the cohort. As Regressions 4 and 8 in Table 6 and Regression 4 in Table 7 demonstrate, controlling for the fraction of the cohort that is black does not change the magnitude or significance of the effect of abortion legalization. These results suggest that maternal race may not be a major mechanism through which abortion legalization impacts adult mortality in the next generation. 23 See Appendix C for a list of omitted states. 24 See Appendix C for a description of the process to create the control variables. 44
46 Maternal Education: Table 16 demonstrates that, when controlling for maternal education at birth, the impact of abortion legalization on the adult mortality of the next generation is largely unaffected. Regression 1 in Table 16 represents the baseline fixed effects mortality rate regression using a restricted data set omitting 14 states and year 1968 of the mortality data. The coefficient on legal18 is similar in size to the one in Table 6 and is significant at the 1% level. After controlling for the fraction of the cohort born to a mother with a high school diploma, the fraction of the cohort born to a mother that dropped out of high school, and the fraction of the cohort born to a college graduate, the coefficient on legal18 continues to be significant at the 1% level and decreases in magnitude by only.01 percentage points. The p-value from a test of the joint significance of these control variables is A similar analysis is performed for sub-populations. Regression 3 of Table 16 represents the baseline fixed effects white mortality rate regression using a restricted data set omitting 14 states and year 1968 of the mortality data. The coefficient on legal18 is similar in size to the one in Table 8 and is significant at the 5% level. After controlling for the fraction of the white cohort born to a mother with a high school diploma, the fraction of the white cohort born to a mother that dropped out of high school, and the fraction of the white cohort born to a college graduate, the coefficient on legal18 continues to be significant at the 5% level and decreases in magnitude by only.01 percentage points, similar to the result in Regression 2. Regression 5 represents the baseline fixed effects black mortality rate regression using a restricted data set omitting 14 states and year 1968 of the mortality data. The coefficient on legal18 is similar in size to the one in Table 9 and is significant at the 1% level. After controlling 45
47 for the cohort composition of maternal education, the coefficient on legal18 continues to be significant at the 1% level but decreases in magnitude by.06 percentage points (7%). This result provides suggestive evidence that the legislation s impact on black adult health may in part be stemming from its relationship to maternal educational attainment. However, the maternal education control variables in Regression 6 are not jointly significant. 25 Given the correlation between race, education, and income, these results shed light on the possibility that selection based on maternal income is a mechanism through which legalization impacts adult mortality in the next generation. The maternal education control variables do not significantly reduce the impact of abortion legalization on the overall mortality rate and the white mortality rate and only slightly reduce the impact on the black mortality rate. These results cast doubt on the idea that maternal selection based on income may be a pathway through which abortion impacts health in the next generation. Unfortunately, the natality data do not contain information on maternal income so I was unable to directly control for maternal income, and, consequently, I cannot rule it out as a possible mechanism. Future work could examine the impact of controlling for maternal income more rigorously. Combining Selection Based on Wantedness and Maternal Characteristics Controlling for Father s Presence at Birth, Maternal Age, and Maternal Education: Table17 sheds light on why abortion legalization affects the early adult mortality in the next generation. Regression 1 represents the baseline fixed effects mortality rate regression using a restricted data set omitting 14 states and year 1968 of the mortality data. It is necessary to use the most restricted data set to include all of the control variables. After controlling for the 25 The results for legal6 and legal30 are comparable. 46
48 fraction of the cohort with father s age reported on the birth certificate, the fraction of the cohort with a teen mom, and maternal education, the coefficient on legal18 continues to be significant at the 1% level but decreases by.1 percentage points (a decrease of around 30%). In addition, the control variables are jointly significant at the 1% level, evidence that, selection based on wantedness and maternal characteristics together is driving some of the association between abortion legalization and mortality. Regression 4 is the analogous regression using the white mortality rate as the dependent variable. After including all of the white cohort level control variables, the coefficient on legal18 decreases by around.09 percentage points and is no longer significant. Also, the control variables are jointly significant at the 5% level, also suggestive of an impact of unwantedness and maternal selection. Table 17 contains a similar regression using the black mortality rate as the dependent variable. After including all of the control variables, the coefficient on legal18 continues to be significant. The control variables are not jointly significant but the coefficient on legal18 decreases by.18 percentage points (21%), a substantial effect. Consequently, the results suggest that legalization alters maternal characteristics and the wantedness of the affected cohort, and these factors in turn can explain almost a third of the legislation s impact on the health of the next generation. 26 In-Utero Health Conditions: An alternative explanation for the relationship between legalization and adult mortality is that abortion legislation makes it possible for mothers to abort fetuses with in-utero health 26 The results for legal6 and legal30 are comparable. 47
49 conditions. If this is a driving mechanism through which abortion legalization impacts the adult mortality in the next generation, I would expect a decrease in deaths from certain causes. Of the major causes of death for this age group, heart disease and cancer in young adulthood are medical problems that may arise from in-utero health issues. In contrast, drug accidents and motor vehicle accidents are measures of risky behavior and probably have little to do with such conditions, so if abortion legalization is associated with a decrease in risky behavior caused deaths, it would suggest that the ability of women to abort a fetus with in-utero health problems is not a major mechanism at work. I generate dummy variables to represent the following causes of death: cancer, heart disease, suicide, homicide, drug accidents, and motor vehicle accidents. 27 I choose these causes of death because they are the most common for individuals ages 25-44, the best approximation of the age range I am focusing on (Heron 2006). I generate mortality rates for each cause of death by dividing the total number of deaths from a certain cause by the total number of births and multiplying by I also create a mortality rate for the risky causes of death (homicide, drug accidents, and motor vehicle accidents) in a similar manner. Results: Deaths Likely to Arise from In-Utero Medical Problems: Heart Disease and Cancer: Table 18 suggests that abortion legalization is not associated with a decrease in deaths likely arising from in-utero health conditions for individuals born after legalization in ages Each regression in Table 18 is weighted and without controls. 28 The coefficients for legal18 are shown. The fixed effects regressions demonstrate that abortion legalization is not associated 27 See Appendix A for complete methods on creating cause of death dummy variables 28 Including the controls does not significantly impact any of the coefficients. 48
50 with a significant decline in deaths caused by heart disease for those individuals born eighteen months after legalization. Similarly, abortion legalization is not significantly associated with the cancer mortality rate for individuals ages and, in fact, the coefficient on legal18 is positive. The absence of a significant association between abortion legislation and the incidence of deaths among young adults caused by heart disease sheds light on the mechanisms through which abortion legalization impacts mortality. Stamler et al. (1999) explain that the three major risk factors for heart disease are a high cholesterol level, high blood pressure, and smoking. To some extent, cholesterol and blood pressure are related to genetics, but behaviors such as diet, exercise, and smoking play a role (Stamler et al. 2017). Consequently, this result suggests that abortion legalization did not substantially improve the general health behaviors of the cohorts born after legalization. It is important to note, however, that health behaviors leading to death in ages would most likely have to be extreme. Also, Partington et al. (1992) find that the most common causes of death among those with Fragile X are cardiovascular related and Hill et al. (2003) find that individuals with Down syndrome have elevated risks of heart disease. Given this relationship between heart disease and in-utero health problems, the heart disease mortality result suggests that allowing mothers to abort a fetus with in-utero health problems is not a driving mechanism of the relationship between abortion legalization and adult mortality. Also, the fact that abortion legalization is not associated with a decrease in deaths caused by cancer suggests that in-utero health conditions are not the major determinant of selection induced by legalization. For individuals who die of cancer in their 20 s, the cause of cancer is usually unknown, but can be induced by radiation. Behavioral factors, such as diet and exercise that impact heart disease incidence for young adults take considerably longer to cause cancer, as 49
51 Bleyer (2002) explains. Also, Hill et al. (2003) find that individuals with Down syndrome have elevated risks of certain types of cancer, including leukemia, testicular cancer, liver cancer, and stomach cancer. As with the heart disease mortality result, this result suggests that abortion legalization did not change the general health behaviors of the next generation and provides evidence that women s increased ability to abort a fetus with in-utero health problems is not driving my results. Deaths Not Likely to Arise from In-Utero Medical Problems: Risky Behavior Caused Deaths: Table 18 suggests that abortion legalization is associated with a decrease in deaths caused by risky behavior, deaths not likely arising from in-utero health conditions. Regression 7 demonstrates the impact of abortion legalization on all deaths caused by risky behavior together (motor vehicle accidents, drug accidents, and homicide). The mean mortality rate for deaths caused by risky behavior is lower by about.20 percentage points (4%) within a state and birth month, compared with if abortion was not legal eighteen months before, an effect that is significant at the 5% level Although abortion legalization is not associated with a significant decline in the mortality due to suicide or homicide, it is associated with a negative effect on mortality due to drug accidents. The mortality rate for deaths caused by drug accidents is about.05 percentage points (almost 13%) lower within a state and birth month, compared with if abortion was not legal eighteen months before, an effect that is significant at the 5% level. 31 Similarly, the mean mortality rate for deaths caused by motor vehicle accidents is lower by about 29 Using legal30 does not change this result, and in fact the coefficient on legal30 is larger and significant at the 1% level. The coefficient on legal6, however, is insignificant, but negative. 30 Including suicide as a risky behavior caused death decreases the coefficient on legal18 slightly but it is still significant at the 10% level. 31 The coefficient on legal30 is negative and significant at the 1% level and larger than the coefficient on legal18, suggesting a lagged impact of abortion legalization on deaths caused by drug accidents. However, abortion legalization is associated with a positive and significant effect on the mortality rate for deaths caused by drug accidents for those individuals born six months after legalization. 50
52 .11 percentage points (4%) within a state and birth month, compared with if abortion was not legal eighteen months before, an effect that is significant at the 5% level. 32 Therefore, the fixed effects regressions suggest that abortion legalization is associated with a decline in mortality caused by risky behavior. It is surprising that abortion legalization is not associated with suicide. Education is a factor in suicide since compared to men who have more than a high school degree, men who have a high school degree have 40 percent higher, and men who have less than a high school degree have 47 percent higher, risks of suicide mortality, as Denney et al. (2009) find (Denney et al. 1177). This same relationship is true of income, another characteristic of the next generation impacted by abortion legalization. Also, Markowitz et al. (2002) find that substance use is strongly associated with suicide attempts among college students and Charles and Stephens (2006) found that abortion legalization is associated with a decrease in substance abuse among high school students. However, Donohue and Levitt (2001), find that abortion legalization did not have an impact on violent crime or murder, consistent with my results, which suggest that abortion legislation is not associated with a significant decrease in the incidence of deaths caused by homicide. Nevertheless, the homicide and suicide results do not contradict the other results in this section, which suggest that in-utero health selection is not a major mechanism driving the relationship between abortion legalization and adult mortality in the next generation. Table 18 demonstrates that legalization is associated with a statistically significant reduction in deaths caused by risky behavior, and by drug accidents and motor vehicle accidents 32 Abortion legalization is also associated with a significant decline in mortality caused by motor vehicle accidents for those individuals born thirty months after legislation, with a larger effect than for those born eighteen months after legalization. For those born six months after legalization, there is an insignificant decline in deaths caused by motor vehicle accidents. 51
53 individually. These results can provide insight on the mechanisms through which abortion impacts mortality. A decrease in risky behavior could suggest that abortion legalization leads to selection based on maternal characteristics. Mishra and Lalumiere (2008) confirm that there was a decrease in deaths caused by risky behavior in the United States and Canada in the 1990 s, a large portion of the time period I utilize. Specifically, Mishra and Lalumiere find that there were statistically significant declines in violence, accidents, and behaviors related to accidents, results that are consistent with my findings. This is consistent with the results in Donahue and Levitt (2001) demonstrating a decrease in the incidence of crime among adults born after legalization, and supports a story of selection on maternal characteristics rather than in-utero health conditions. In sum, since abortion legalization is not associated with significant declines in deaths caused by heart disease and cancer, I do not find strong evidence linking abortion policy to deaths likely arising from in-utero medical problems. However, abortion legalization is associated with a significant decline in deaths likely to be caused by risky behavior, a result that further suggests that a reduction in the incidence of children born with in-utero health conditions is unlikely to explain the bulk of the association between abortion policy and adult mortality. Cohort Size The Cohort Size hypothesis suggests that abortion legalization, by decreasing the size of the cohort, increases the educational attainment and income of this cohort. Higher levels of education and income could also improve health for this cohort in adulthood. I examine this possibility by creating cohort level controls using the 2000 Census Data. Specifically, I create variables indicating the fraction of the birth state and birth cohort with a high school diploma, the 52
54 fraction of the population that dropped out of high school, the fraction of the population with a college degree, and the fraction of the population in poverty. I also create race and gender specific versions of these variables. It is important to note that the age range of those born from in year 2000 is 24-32, which is not the age range I utilize to examine mortality. As a result, I try use characteristics that would not be likely to change from age 24 to 30, such as whether a person graduates from high school. Admittedly, it is possible that the characteristics I look at could change after year 2000 and impact the mortality of those in my sample. It is also important to note that I use this data to create cohort level control variables. I do not try to match up those in the Census data with those in my mortality data. For more information on the Census Data and how I create the controls, see Appendix C. Results: Table 19 demonstrates that, when controlling for the education and income of this cohort in adulthood, the impact of abortion legalization on the overall adult mortality of the next generation is largely unaffected. Regression 1 in Table 19 represents the baseline fixed effects mortality rate regression from Table 6. After controlling for the fraction of the cohort with a high school diploma, the fraction of the cohort that dropped out of high school, the fraction of the cohort that graduated college, and the fraction of the cohort in poverty, the coefficient on legal18 continues to be significant at the 1% level and does not decrease in magnitude. The p- value from a test of the joint significance of these control variables is A similar analysis is performed for sub-populations. Regression 3 of Table 16 represents the baseline fixed effects white mortality rate regression from Table 8. After including the white 53
55 cohort level controls, the coefficient on legal18 continues to be significant at the 1% level and, in fact, increases in magnitude. Regression 5 represents the baseline fixed effects black mortality rate regression from Table 9. After controlling for the black cohort composition of education and income, the coefficient on legal18 continues to be significant at the 1% level but decreases in magnitude by.06 percentage points (7%). The black cohort level control variables are also jointly significant at the 10% level, with a p-value of around.09. This result provides suggestive evidence that the legislation s impact on black adult health may in part be stemming from its relationship other adult outcomes, including education and income. 33 In sum, although the cohort education and income control variables do not significantly reduce the impact of abortion legalization on the overall mortality rate and the white mortality rate, they do reduce the impact on the black mortality rate. These results suggest that the cohort size does not explain the bulk of the relationship between abortion legalization and adult mortality in the next generation because including the controls does not impact the overall or white mortality rates. In addition, adult outcomes, including education and income, are also related to other mechanisms that I examine in this section, most plausibly wantedness and maternal selection. As a result, the impact of the Census cohort level controls on the black mortality rate could be evidence for the dominance of these other mechanisms. Nevertheless, since the cohort size mechanism suggests that abortion legislation, by decreasing the size of the cohort, increases the educational attainment and income of this cohort, I cannot rule out the possibility that this pathway is contributing to the association between legalization and the next generation s mortality. 33 The results for legal6 and legal30 are comparable. 54
56 X. Robustness Tests In this section, I attempt to test the robustness of my results by using alternative specifications, by controlling for other factors that could influence women s fertility decisions, by taking travel distance into account, and by dropping states that may be driving my results. Controlling for Minor s Access to Abortion and Birth Control It is possible that some of the decrease in mortality rates for adults ages born from can be driven by other factors impacting births. Laws regarding birth control access for minors and abortion access for minors were also changing during this time period and it is important to determine if these legal shifts are also contributing to my results. As a result, this section is designed to examine the impact of fertility control laws during the time period that affect minor s access to contraception and abortion on the adult mortality in the next generation. Information on Minors Access: There was no law change analogous to Roe v. Wade definitively making birth control legal for minors. The pill was approved by the FDA in 1960, though prior to this date, doctors were aware of its contraceptive effects and prescribed it for this purpose. By 1965, when the Supreme Court, in Griswold v. Connecticut, declared laws banning married women from using contraceptives unconstitutional, 41 percent of married women younger than 30 were already taking the pill (Goldin and Katz 732). The pill was not legal for single women until 1972, when the Supreme Court, in Eisenstadt v. Baird, overturned a statute prohibiting the sale of contraceptives to unmarried persons. Between 1969 and 1978, most states changed the age at which minors could obtain the pill without parental consent, increasing minors access to the pill. 55
57 Abortion access for minors was also changing during this time period. Following Roe v. Wade, a number of states restricted the age at which minors could obtain abortions without parental consent. However, during the mid and late 1970 s, many states began changing these laws, decreasing the age of consent usually to 18 or 14. Some states changed the minimum age when a minor could consent to her own abortion multiple times over this period. These were the changes, documented in Guldi (2005) that I used in my analysis. 34 Results: Birth Control Pill Access for Minors: Births: Table 20 contains regressions including both the abortion legalization variables and the birth control access for minor variables and demonstrates that the decrease in the teen birthrate from 1968 to 1975 is stemming primarily from the changes in abortion access. All regressions in Table 20 are weighted and use legal18 as the explanatory variable. 35 Although the coefficients on the birth control access variables are negative, neither of them are significant. However, even while controlling for the changes in birth control access for minors, legal18, representing whether abortion has been legal for 18 months, has a much larger negative impact on the teen birthrate than the birth control legalization variables, an effect that is statistically significant at the 1% level in all of the regressions. In addition, the size of the coefficients on legal18 are very similar to those in Table 3, demonstrating that accounting for changes in birth control access for minors does not diminish the effect of abortion legalization on the teen birthrate. Consequently, 34 See Appendix E for information on the data used in these regressions. 35 The results do not change substantially when legal6 and legal30 are used instead of legal18. 56
58 the changes in birth control laws for minors are not driving the substantial decrease in the teen birthrate stemming from abortion legalization. 36 The fact that the pill was legalized gradually can help to explain these results. Any minor who was married or had the consent of her parents to take the pill already had access at this point. In addition, any woman who pretended to be engaged or convinced a physician that she had irregular periods may have also been able to use the pill (Goldin and Katz 734). Consequently, there was no definitive change in laws allowing all minors to use the birth control pill, which can explain why there was no significant drop in births following the enactment of state laws decreasing the age a minor could take the pill without parental consent. Deaths: Given the lack of a definitive change in the birth control laws, it is not surprising that, as Table 20 demonstrates, birth control pill access for minors is not associated with a decrease in the adult mortality in the next generation. All regressions in Table 20 are weighted and use legal18 as the explanatory variable. 37 The coefficients on the birth control pill variables are positive, suggesting that there is not even a negative correlation between birth control pill access for minors and death rates. Even when controlling for the changes in birth control access for minors, legal18 continues to have a statistically significant negative impact on the overall death rate in Regressions 3 and 4. In addition, the size of the coefficients on legal18 are not smaller than those in Table 6, demonstrating that accounting for changes in birth control access for minors does not diminish the effect of abortion legalization on the death rate. Consequently, the 36 Looking at teen birthrates by race does not change the results. The coefficients on the abortion legalization variables continue to be much larger than those on the pill variables in these regressions. 37 The results do not change substantially when legal6 and legal30 are used instead of legal18. 57
59 changes in birth control laws for minors are not driving the decrease in the mortality rate stemming from abortion legalization. 38 Abortion Access for Minors: Births: Table 21 contains regressions demonstrating that the impact of abortion legalization on the teen birthrate remains substantial while controlling for the effect of the changing abortion access for minors. All regressions in Table 21 are weighted and use legal18 as the explanatory variable. 39 The changes in the teen birthrate stemming from abortion legalization, measured by legal18, remain negative and significant at the 1% level in all of the regressions controlling for variations in the parental consent laws for minor s seeking an abortion. The coefficients on the variable indicating minors access to abortion is negative and significant in Regressions 1 and 2, but the coefficients on legal18 are much larger in both of these regressions and continue to be significant at the 1% level. Furthermore, the size of the coefficients on legal18 are very similar to those in Table 3, demonstrating that accounting for changes in abortion access for minors does not diminish the effect abortion legalization has on the teen birthrate. Therefore, the changes in the teen birthrate during this time period are driven by the initial legalization of abortion, rather than the expansion of abortion access to minors These results do not change when examining the impact of both the abortion legalization and pill variables on mortality rates by race. The coefficients on the abortion legalization variables are very similar to those in Tables 8 and The results do not change substantially when legal6 and legal30 are used instead of legal Looking at teen birthrates by race does not change the results. The coefficients on the abortion legalization variables continue to be much larger than those on the pill variables in these regressions. 58
60 Deaths: Table 21 confirms that although minor legalization may have an independent effect on the adult mortality in the next generation, it does diminish the association between abortion legalization and mortality rates. Each of the regressions in Table 21 use legal As Regression 3 demonstrates, the coefficient on legal18 continues to be significant after controlling for whether abortion was legal for 14 year olds (assuming the laws were changed at the beginning of the year), and is only slightly smaller than coefficient in Table 6. In Regression 4, after controlling for whether abortion was legal for 14 year olds (assuming the laws were changed at the end of the year), the coefficient on legal18 is significant at the 1% level and is a similar magnitude to the coefficient in Table 6. These results suggest that controlling for whether abortion was legal for minors does not diminish the impact of abortion legalization on the mortality rate in the next generation. However, the coefficients on both of the variables indicating whether abortion was legal for 14 year olds are negative and one of them is significant. These results suggest that minor legalization may have a separate, independent effect on the adult mortality rate in the next generation. Consequently, the relationship between minor legalization and adult health in the next generation warrants further research. 42 Controlling for Travel Distance During Early Legalization: There is some evidence that early legalization allowed women outside of the early states to travel to obtain abortions. For example, in 1972, over 100,000 women travelled from a different state to obtain an abortion in New York City (Gold 2003). Also, the number of abortions in states with liberal access, like New York and California, experienced a decline of 41 The results do not change substantially when legal6 and legal30 are used instead of legal These results do not change when examining the impact of both the abortion legalization and minor legalization variables on mortality rates by race. 59
61 23% in the procedures reported by providers after Roe v. Wade, suggesting they served significant numbers of out-of-state women prior to the legalization of abortion through Roe v. Wade (Weinstock et al 1975). Furthermore, Hansen (1980) explains that the largest increase in abortion occurred before the Roe decision, not after it, further suggesting that early legalization may be the primary mechanism through which abortion services were made more readily available (Hansen 375). As a result, it is important to examine the hypothesis that early legalization extended access to out of state women and incorporate this possibility into my analysis. To do so, I use the natality data and determine the percentage of births that residents of non-early states have in early states. I use a cutoff of one percent as a proxy for the ability for women to travel and obtain abortions in early states. To incorporate this possibility into my legal variables, I assume abortion is legal in the states that have equal to or greater than one percent of births in early states, 43 creating three new analogous legal variables: legal6_justadj, legal18_justadj, and legal30_justadj. I use these, along with the original legal variables, as the independent variables in the Fixed Effects regressions. It is important to note that no states had at least 1% of births in the other two early states, Hawaii and Alaska, both of which are difficult to reach by travel. Also, Washington had a law in place that required women to be residents of the state for 30 days before allowing them to obtain an abortion (Gold 2003). As a result, although Idaho and Oregon had greater than 1% of births in Washington, women from other states were essentially unable to utilize abortion services in Washington, so I do not count abortion as legal in Idaho and Oregon. Consequently, the 43 The states that had greater than or equal to one percent of births in an early state are as follows: Idaho and Oregon had at least 1% of their births in Washington, New Jersey had at least 1% of its births in New York, and Nevada had at least 1% of its births in California. 60
62 following results indicate the impact of women s ability to travel to New York or California to obtain an abortion on the birthrate and young adult mortality in the next generation. Results: Births: Table 22 demonstrates that the combined effect on the birthrate and teen birthrate of being in a state in which abortion is legal and being within traveling distance of a state in which abortion is legal is larger than the impact of being in a state in which abortion is legal alone, suggesting that women s ability to travel to early states did contribute to the reduction in the birthrate and teen birthrate. In Regression 1, the coefficient on legal18 is negative and significant at the 1% level and analogous to the coefficient on legal18 in Table 3. The coefficient on legal18_justadj is negative and significant at the 5% level, suggestive of an impact of travel. 44 According to Regression 1, abortion legalization, including the impact of travel, is associated with a.32 percentage point reduction in the birthrate within a state and birth month. Regression 2 demonstrates that, accounting for travel, abortion legalization is associated with about a.70 percentage point reduction in the teen birthrate within a state and birth month, a much larger result than shown in Table 3. The coefficient on legal18_justadj is negative and significant at the 1% level and suggests that about.24 percentage points of the reduction in the teen birthrate within a state and birth month is stemming from teenagers traveling to early states to receive abortions. 45 Therefore, Table 22 provides evidence that accounting for the ability of 44 In the regression using legal6, the coefficient on legal6_justadj is negative and significant at the 5% level, suggesting that abortion legalization in a nearby state is associated with a decrease in the birthrate. In the regression using legal30 the coefficients on legal30 and legal30_justadj are both negative but insignificant. 45 The results using legal6 and legal30 are comparable. 61
63 women to travel to early states increases the impact of abortion legalization on the birthrate and teen birthrate. 46 Deaths: Table 22 provides suggestive evidence that accounting for the ability of women to travel does not decrease the impact of abortion legalization on the adult mortality in the next generation. Regression 3 demonstrates that accounting for travel, the coefficient on legal18 does not decrease from that in Table 6 and continues to be significant at the 1% level. Although abortion legalization is associated with a decrease in the birthrate eighteen months after legalization to women in states with greater than 1% of births in New York or California, those born eighteen months after legalization in these states do not have lower mortality rates. It is possible there could be differential selection of the women capable of traveling to early states, but more research is needed in this area to understand this result. Nevertheless, controlling for the possibility of travel does not decrease the impact of abortion legalization on the mortality rate demonstrated in Table Time Trend Regressions: I control for state-specific trends in the birthrate and mortality rate occurring in states before abortion legalization occurred. Although the birth results continue to be significant, I find that the mortality results are sensitive to including these state-specific time trends. Abortion legalization continues to be associated with a decrease in the mortality of the next generation but 46 When accounting for the ability of white women to travel to early states for abortion services, the impact of abortion legalization on the birthrate increases by.09 percentage points six months after legalization within a state and birth month. The coefficients on the travel variables are insignificant 18 and 30 months after legalization and are of a much smaller magnitude. When accounting for the ability of black women to travel to early states for abortion services, the impact of abortion legalization on the birthrate greatly increases, by.23 percentage points 18 months after legalization and by.37 percentage points 30 months after legalization within a state and birth month, effects that are significant at the 5% and 1% levels respectively. The coefficient on the travel variable is insignificant six months after legalization. 47 The result is similar for those born six and thirty months after legalization and by race. 62
64 only the coefficient on legal18 in the regression examining the impact of abortion legalization on the black mortality rate continues to be significant. It is possible that there may just not be enough statistical power in the time trend regressions to distinguish the time trend from the effect of the policy. For more information, see Appendix F. XI. Conclusion This paper seeks to investigate the relationship between abortion legislation and the adult health of birth cohorts affected by that legislation. Given the literature showing the link between abortion and childhood outcomes and the literature examining long-run impacts of early life circumstances, it is expected that lenient abortion policies will improve adult health for affected birth cohorts. I find that abortion legalization is associated with a statistically significant decrease in the adult mortality of the next generation. The results suggest that of the typical 40,000 deaths per year of individuals ages 20-30, roughly 1,000 deaths were avoided as a result of abortion legalization. 48 I find that the impact of abortion legalization varies by gender and race, with the greatest effects for black males. Abortion legalization is also associated with the largest reduction in deaths caused by risky behavior. The results in this paper also help provide insight on why abortion legalization matters. Four mechanisms are proposed in Section II and the evidence presented here is suggestive of two of them. 1. Timing of Pregnancy: I find evidence that controlling for parental involvement and the age of the mother at birth reduces the apparent impact of abortion legalization on the 48 I calculate the number of deaths avoided by abortion legalization by multiplying the coefficient on legal18 divided by 1000 by the number of births in 1970 (representative of the typical number of births for the time period). I calculate the typical number of deaths per year for year olds by multiplying the mean of the mortality rate divided by 1000 by the number of births in
65 overall and black adult mortality in the next generation by approximately 15%. Both paternal age reported at birth and maternal age at birth are proxies for whether a pregnancy was timed optimally, which can impact the health of the child. 2. Maternal Characteristics: I find that controlling for the fraction of the cohort that is black, indicating maternal selection based on race, does not change the magnitude or significance of the effect of abortion legalization. These results suggest that maternal race may not be a major mechanism through which abortion legalization impacts adult mortality in the next generation. I also find that the maternal education control variables do not significantly reduce the impact of abortion legalization on the overall mortality rate and the white mortality rate. However, they do reduce the impact of abortion legalization on the black mortality rate and, in conjunction with the cohort level controls for wantedness, decrease the effect of abortion legislation more substantially, by around 30%. Also, given the relationship between childhood disadvantage and risky behavior, the results demonstrating that abortion legalization is associated with a decrease in risky behavior may provide more support for the maternal selection story. Consequently, there is some suggestive evidence that maternal characteristics may, in part, explain the relationship between abortion legalization and adult health in the next generation. 3. In-Utero Health Conditions: I do not find strong evidence linking abortion policy to deaths likely arising from in-utero medical problems. However, I find that abortion legalization is associated with a significant decline in deaths caused by risky behavior, unlikely to be related to in-utero health. Thus, in-utero health conditions are unlikely to explain the bulk of the association between abortion policy and adult mortality. 64
66 4. Cohort Size: Although the cohort education and income control variables do not significantly reduce the impact of abortion legalization on the overall mortality rate and the white mortality rate, they do reduce the impact on the black mortality rate. Since the cohort size mechanism suggests that abortion legislation, by decreasing the size of the cohort, increases the educational attainment and income of this cohort, I cannot rule out the possibility that this pathway is contributing to the association between legalization and the next generation s mortality. However, it is more likely that the income and education of these cohorts are changing because of selection based on wantedness and maternal selection, given the evidence I find supporting these mechanisms. Overall, the results suggest that selection based on the wantedness of the pregnancy and maternal characteristics may be driving the link between legalization and adult mortality. Unwanted or mistimed children and children born to more disadvantaged mothers might receive fewer resources and might be treated differently in unobservable ways, impacting their health. Furthermore, the results in this paper highlight the importance of early life circumstances of children, an influence that continues as children enter young adulthood and has the potential to extend even further. The mechanisms explored in this paper may also be those driving the impact of abortion legalization on child health and disadvantage, adolescent outcomes, and adult employment and education. Further examination of these mechanisms, as well as of the impact of abortion legalization on other adult health outcomes as this cohort ages, would be informative to abortion and contraceptive policy formation. 65
67 The analyses presented here also suggest that it may be possible to improve the health of future cohorts in both childhood and adulthood through policy interventions that dedicate resources to mothers who have not timed their pregnancies optimally and to disadvantaged mothers or by providing access to fertility control tools to postpone pregnancies until they are wanted. Since January 2011, there have been numerous proposed and implemented restrictions on abortion. For example, in April 2011, lawmakers in Virginia approved an amendment that would ban private insurance plans from covering abortions if they participate in a state health care exchange under the new health care law (Tavernise 2011). In March 2011, South Dakota passed a law forcing women to wait three days after an initial doctor's visit before terminating a pregnancy, the nation's longest waiting period (New York Times 2011). Furthermore, in March 2011, the House of Representatives approved a bill cutting all funding to Planned Parenthood (Steinhauer 2011). These restrictions would most likely reduce the number of abortions women receive. Levine, Trainor, and Zimmerman (1996) identify that the imposition of funding restrictions lowers the abortion rate by 1.5% abortions per 1000 women aged 15-44, an effect that is statistically significant at the 1% level (Levine 567). Consequently, the results of this paper, as well as those of the existing literature, demonstrate that since abortion legalization has positive health benefits for the population, a decrease in the abortion rate resulting from these new policies may result in negative health outcomes. Therefore, the health consequences of funding restrictions should be considered in the context of abortion policy reform. 66
68 References Alters, Sandra, and Wendy Schiff. Essential Concepts for Healthy Living. Sudbury, MA: Jones and Bartlett, "An Extraordinary Intrusion on Women's Rights." New York Times. 30 Mar < Ananat, Elizabeth O., Jonathan Gruber, Phillip B. Levine, and Douglas Staiger. "Abortion and Selection." The Review of Economics and Statistics 91.1 (2009): Bailey, Martha J. "More Power To The Pill: The Impact Of Contraceptive Freedom On Women's Life Cycle Labor Supply." The Quarterly Journal of Economics (2006): Becker, Gary S. A Treatise on the Family. Cambridge, MA: Harvard Univ. Press, Bilter, Marianne P., and Madeline Zavodny. "Child Maltreatment, Abortion Availability, and Economic Conditions." Review of Economics of the Household 2 (2004): Bitler, Marianne, and Madeline Zavodny. "Did Abortion Legalization Reduce the Number of Unwanted Children? Evidence from Adoptions." Perspectives of Sexual and Reproductive Health 34.1 (2002): Bleyer, W. Archie. "Cancer In Older Adolescents and Young Adults: Epidemiology, Diagnosis, Treatment, Survival, and Importance of Clinical Trials." Med Pediatr Oncol 38 (2002): Buckles, Kasey and Daniel M. Hungerman. Season of Birth and Later Outcomes: Old Questions, New Answers. National Bureau of Economic Research Working Paper 67
69 14573 (2010): National Bureau of Economic Research. August. < Case, Anne, Angela Fertig, and Christina Paxson. "The Lasting Impact of Childhood Health and Circumstance." Journal of Health Economics 24.2 (2005): Case, Anne, Darren Lubotsky, and Christina Paxson. "Economic Status and Health in Childhood: The Origins of the Gradient." American Economic Review 92.5 (2002): Charles, Kerwin K., and Melvin Stephens Jr. "Abortion Legalization And Adolescent Substance Use." Journal of Law and Economics XLIX (2006): Cobb-Clark, Deborah A., Ryan, Christopher Anthony and Sartbayeva, Ana, Taking Chances: The Effect of Growing Up on Welfare on the Risky Behavior of Young People. Institute for the Study of Labor Discussion Paper No (2009): The Institute for the Study of Labor. < Dahl, Gordon B., and Enrico Moretti. "The Demand for Sons." Review of Economic Studies 75.4 (2008): Denney, Justin T., Richard G. Rogers, Patrick M. Krueger, and Tim Wadsworth. "Adult Suicide Mortality in the United States: Marital Status, Family Size, Socioeconomic Status, and Differences by Sex." Social Science Quarterly 90.5 (2009): Donohue, John J., and Steven D. Levitt. "Further Evidence That Legalized Abortion Lowered Crime." The Journal of Human Resources 1st ser. XXXIX (2004):
70 Donohue, John J., and Steven D. Levitt. "Measurement Error, Legalized Abortion, and the Decline in Crime: A Response to Foote and Goetz." Quarterly Journal of Economics CXXIII.1 (2008): Donohue, John J., and Stephen D. Levitt. "The Impact of Legalized Abortion on Crime." The Quarterly Journal of Economics CXVI.2 (2001): Fergusson, David M., L. John Horwood, Joseph M. Boden, and Gabrielle Jenkin. "Childhood Social Disadvantage and Smoking in Adulthood: Results of a 25-year Longitudinal Study." Addiction (2007): Fertig, Angela R., and Tara Watson. "Minimum Drinking Age Laws and Infant Health Outcomes." Journal of Health Economics 28.3 (2009): Foote, Christopher L., and Christopher F. Goetz. "The Impact of Legalized Abortion on Crime: Comment." Quarterly Journal of Economics (2008): Gold, Rachel Benson. "Lessons from Before Roe: Will Past Be Prologue?" Guttmacher Institute: Home Page. Mar < Goldin, Claudia, and Lawrence F. Katz. "The Power of the Pill: Oral Contraceptives and Women's Career and Marriage Decisions." Journal of Political Economy (2002): Gruber, Jonahthan, Phillip Levine, and Douglas Staiger. "Abortion Legalization And Child Living Circumstances: Who Is The "Marginal Child"?" The Quarterly Journal of Economics (1999):
71 Guldi, Melanie. Abortion or the Pill- Which Matters More? The Impact of Access on the Birthrates of Young Women. University of California, Davis. (2005):1-38. Hansen, Susan B. "State Implementation of Supreme Court Decisions: Abortion Rates Since Roe v. Wade." The Journal of Politics 42 (1980): Heron, Melonie. Deaths: Leading Causes for Rep. no. Vol 58 No. 14. NVSS: National Vital Statistics Reports. Hill, Deirdre, Gloria Gridley, Sven Cnattingius, Lene Mellemkjaer, Martha Linet, Hans-Olaf Adami, Jorgen H. Olsen, Olef Nyren, and Joseph F. Fraumeni. "Mortality and Cancer Incidence Among Individuals With Down Syndrome." Arch Intern Med 163 (2003): Johnson, Rucker C. and Robert F. Schoeni. Early-Life Origins of Adult Disease: The Significance of Poor Infant Health and Childhood Poverty. UC Berkeley Unpublished Manuscript. (2007): < pdf>. Joyce, Ted. "A Simple Test of Abortion and Crime." The Review of Economics and Statistics 91.1 (2009): Joyce, Ted. "Did Legalized Abortion Lower Crime?" The Journal of Human Resources XXXIX.1 (2004): Kalist, David E. "Abortion and Female Labor Force Participation: Evidence Prior to Roe v. Wade." Journal of Labor Research XXV.3 (2004):
72 Katz, Lawrence F., Jeffrey R. Kling, and Jeffrey B. Liebman. "Moving to Opportunity in Boston: Early Results of a Randomized Mobility Experiment*." Quarterly Journal of Economics (2001): Kirchengast, Sylvia, and Beda Hartmann. "The Male Disadvantage Hypothesis Reconsidered: Is There Really a Weaker Sex? An Analysis of Gender Differences in Newborn Somatometrics and Vital Parameters." Journal of Life Science 1.1 (2009): Google Scholar. Levine, Phillip B., Amy B. Trainor, and David J. Zimmerman. "The Effect of Medicaid Abortion Funding Restrictions on Abortions, Pregnancies and Births." Journal of Health Economics 15 (1996): Markowitz, Sara, Pinka Chatterji, Robert Kaestner, and Dhaval Dave. Substance Abuse and Suicidal Behavior Among Young Adults. National Bureau of Economic Research Working Paper 8810 (2002): National Bureau of Economic Research. < Mishra, Sandeep, and Martin Lalumiere. "Is the Crime Drop of the 1990s in Canada and the USA Associated with a General Decline in Risky and Health-related Behavior?." Social Science & Medicine 68.1 (2009): Partington, M. W., H. Robinson, S. Laing, and G. Turner. "Mortality in the Fragile X Syndrome: Preliminary Data." American Journal of Medical Genetics (1992): Pop-Eleches, Cristian. "The Impact of an Abortion Ban on Socioeconomic Outcomes of Children: Evidence from Romania." Journal of Political Economy (2006):
73 Potts, Malcolm, and Peter Diggory. Abortion. Cambridge University Press, Rosenberg, Gerald N. The Hollow Hope: Can Courts Bring About Social Change?. Chicago: The University Of Chicago Press, Smith, James P., Healthy Bodies and Thick Wallets: The Dual Relation between Health and Economic Status, Journal of Economic Perspectives, 13(2), pp Smith, Roy G., Robert W. Gardner, Patricia Steinhoff, Chin S. Chung, and James A. Palmore. "The Effect of Induced Abortion on the Incidence of Down's Syndrome in Hawaii." Family Planning Perspectives 12.4 (1980): Guttmacher Institute. Stamler, Jeremiah, Rose Stamler, and James D. Neaton. "Low Risk-Factor Profile and Long-term Cardiovascular and Noncardiovascular Mortality and Life Expectancy: Findings for 5 Large Cohorts of Young Adult and Middle-Aged Men and Women." JAMA (1999): Steinhauer, Jennifer. "The Caucus: Brown Says Planned Parenthood Cuts Go 'Too Far'" New York Times (blog). 22 Mar < Szabo, Thomas L. Diagnostic Ultrasound Imaging inside Out. San Diego: Elsevier Academic, Tavernise, Sabrina. "Virginia Lawmakers Limit Insurers' Abortion Coverage." New York Times. 7 Apr < Tietze, Christopher. "Legal Abortions in the United States: Rates and Ratios by Race and Age, " Family Planning Perspectives 9.1 (1977):
74 Weinstock, Edward, Christopher Tietze, Frederick S. Jaffe, and Joy G. Dryfoos. "Legal Abortion in the United States Since the 1973 Supreme Court Decisions." Family Planning Perspectives 7.1 (1975):
75 Appendices Appendix A: Data Natality Data: The natality data from are 50% samples of the total number of births in each year, so it is necessary to create a variable, recwt, which I set equal to 2, in order to count each birth twice. After 1971, some states still only have 50% samples but the variable recwt is in the data and is set to 1 or 2, accordingly. This variable is included in the collapse command and is used to weight the number of observations properly. Mortality Data: I generate dummy variables to represent specific causes of death for use in my empirical analysis. To accomplish this, I identify the coding for the causes of death I use in the mortality data codebook. The coding switches from the International Classification of Deaths version 9 (ICD-9) to ICD-10 in 1999, so it is necessary to choose causes of death included in both versions. Once I identify the codes, I create a dummy variable equal to one if the variable representing the cause of death, ucr282 or ucr34 in , and ucr358 or ucr39 in , was equal to the code for the chosen disease and 0 otherwise. For example, the dummy variable drugaccident, measuring death caused by accidental drug overdose, is equal to 1 when ucr282 is equal to 31700, the code for this cause of death, and 0 otherwise. Overall I create 6 dummy variables measuring these causes of death: cancer, heart disease, suicide, homicide, motor vehicle accidents, and accidents involving drug use. 74
76 To create a variable to identify the birth month of the individual, I use the age at death and year of death. Since the birth month of individuals in this data is unknown, I assume that each individual was his or her age plus 6 months at the time of death and created a new age variable, agenew, to reflect that, equal to the individual s age added to 0.5 (6 months/12 total months). I then create a variable deathmonth, equal to the year of death added to the month divided by 12 (year + (monthdth/12), so that both the year and month of death are incorporated into one variable. Finally, to calculate the birth month for each observation, I generate a variable, birth month to equal deathmonth agenew. For example, a 20 year old individual who died in January of 1989 would have a birth month of ( ), which means this person was born in July of I drop observations for which birth month is less than , before the 1968 cohort was born, and greater than 1976, after the 1975 cohort was born, since these observations do not fall within my time-frame of interest. I later use this variable to connect the mortality data set with the natality and abortion legalization data. Appendix B: Log of Number of Births Results I also examine the impact of legalization on the log of the number of births to see if it is consistent with the association between the abortion legislation and the birthrate. Overall Births The Fixed Effects models illustrate that abortion legalization was associated with a lower number of overall births. All of the regressions in Table 23 include fixed effects, which can account for the high r-squared values. When abortion has been legal for six months, as captured by the legal6 variable, the decrease in the logarithm of the total number of births is statistically significant and substantial. Regression 1 demonstrates that if abortion was legal six months 75
77 before birth, the number of births is lower by about 3% within a state and birth month, compared with if abortion was not legal six months prior to birth, a result that reaches 4% in the weighted regression 2. Regression 3 suggests that when abortion has been legal for 18 months, the number of births is lower by 2.4% within a state and birth month, compared with abortion was not legal six months prior to birth. Though this result is not significant, it reaches significance in the weighted regression 4 and yields an effect of 5.7%. Both regressions 5 and 6 demonstrate that when abortion has been legal for thirty months, abortion legalization is no longer associated with a significant decrease in the number of births because the coefficient on legal30 is not statistically significant. Consequently, Table 23 illustrates that abortion legislation is associated with the largest decrease in births eighteen months after legalization, evidence of a slightly lagged effect of abortion legislation. Other Results: Abortion legalization is associated with a much larger decrease in teen births than in overall births. The largest decrease in the number births to teens, 11%, occurred when abortion was legal for eighteen months prior to birth. Births to young teens, defined as mothers below the age of eighteen, significantly decreased after abortion was legal for 6 months, though by less than overall teen births, suggesting that it took longer for young teens to have the same amount of access as eighteen and nineteen year olds. In addition, the effects of abortion legalization are significant for both white and black births, with larger results for black births. Furthermore, there is a highly significant but lagged impact of abortion legalization on the number of births to white teens and black teens, with much larger effects for black teens. 76
78 Appendix C: Mechanisms Maternal Characteristics Data: To create the cohort level controls indicating whether the father was present at birth, and maternal age and education, I use the natality data. It is important to note that several states during this time period did not report maternal education so I use these controls on a restricted sample omitting these states. 49 Fathers age and mothers education were not reported until 1969, so the natality data from 1968 is not used in this analysis. I use the total number of states and years when using the maternal age controls. I create dummy variables indicating if the father s age is reported, if the mother was a teenager, if the mother had dropped out of high school, had a high school diploma, and had a college education. I also create race specific versions of these dummy variables. I then collapse the data by state of birth and birth month, which creates overall counts and counts by race of the number of children born with a father present, to teen mothers, and mothers with certain levels of education. To create the cohort level control variables, I divide the counts based on each characteristic by the total number of births. For example, to create fractionteenmom, which represents the fraction of those born from to a teenage mother, I divide the total number of individuals in my data with teen mothers by the total number of births in my data. I use this same method to create four other control variables: fractionmomhsdropout, fractionmomhsgrad, fractionmomcollgrad, fractionfagereported. I create race specific cohort control variables by 49 There were fourteen states that did not report mothers education. These states are Alabama, Arkansas, California, Connecticut, Delaware, District of Columbia, Florida, Georgia, Idaho, Maryland, New Mexico, Pennsylvania, Texas, and Washington. 77
79 dividing the total number of births of each race to moms with the specific characteristic (or born with fathers age reported) by the total number of counts by the respective race. These are for use in the race specific regressions. I also create race specific cohort control variables for use in the overall mortality regressions by dividing the total number of births of each race to moms of a certain age or education level (or born with father s age reported) by the overall number of births. Census Data Data: The Census data is obtained from the 2000 Census using the IPUMS USA website. I create an extract using the IPUMS website including the educational attainment, poverty status, race, and gender, and birthplace of those individuals who were born from It is important to note that the age range of those born during this time period in year 2000 is 24-32, which is not the age range I utilize to examine mortality. As a result, I try use characteristics that would not be likely to change from age 24 to 30, such as whether a person graduates from high school. Admittedly, it is possible that the characteristics I look at could change after year 2000 and impact the mortality of those in my sample. It is also important to note that I use this data to create cohort level control variables. I do not try to match up those in the Census data with those in my mortality data. Once I have the Census abstract, I create a variable indicating the state of birth of each individual utilizing the birthplace variable in the Census data. I then drop all of the observations for which birthplace is outside the United States. I create dummy variables which indicate the gender and race of each individual. I generate dummy variables indicating whether each 78
80 individual is a high school dropout, is a high school graduate, is a college graduate, and is considered below the poverty line. I also create race and gender specific versions of these dummy variables. I create a variable count, equal to 1 for all individuals. I collapse the data by the birth state and age of each individual, yielding a count of the total number of individuals in the Census born from in each state overall, by race, and by gender. In the collapse command, I weight by perwt, the Census variable indicating the individual level weight, to obtain counts for the total population. Collapsing the data also yields counts of the total number of individuals in the Census born from in each state that are high school dropouts, high school graduates, college graduates, and are poor. More specific counts of these variables by race and gender are also created when I collapse the data. To create the cohort level control variables, I divide the counts based on each characteristic by the total number of individuals in the sample. For example, to create fractionhsgrad, which represents the fraction of those born from with a high school diploma, I divide the total number of individuals in my data with high school diplomas by the total number of individuals in my data. I use this same method to create four other control variables: fractionhsdropout, fractioncollegegrad, fractionpoverty. I create race and gender specific cohort control variables by dividing the total number of individuals of each race and gender with a specific characteristic by the total number of counts by the respective race or gender. I then use the general and race and gender specific cohort level controls in my mortality regressions. To merge the Census data with my overall data incorporating the natality, mortality, and legalization data, I need to create a variable age00, equal to what the age of the individuals in my mortality data would be in year To do this, I use the birth month variable and the fact that 79
81 the Census data are collected in April. For example, all of those individuals in my mortality data born in January of 1968 ( ) through April of 1968 ( ) would be 32 in 2000, so I set age00 equal to 32. I continue this method to determine the age of each individual based on their birth month. I then merge the Census and overall data by state of birth and the age of the individual in year This is the data I use to run my mortality regressions with the Census cohort level controls. Appendix D: Difference-in-Differences Model Methods: I also use a difference-in-differences model, using a state-cohort analysis. Charles and Stephens (2006) utilize a similar model exploiting the differential timing of abortion legalization in early and non-early states to analyze the impact of abortion legalization on adolescent substance abuse. Ananat et al. (2009) also use a difference-in-differences model to examine the effect of abortion legalization on young adult outcomes. Births: The model I use includes the variable early, a dummy variable indicating whether or not the individual was born in an early legalizer state, together with cohort indicators. Cohort1 indicates whether the individual was born from , when no legislation was passed. Cohort2 indicates whether the individual was born from , when abortion was legalized in some states, prior to Roe v. Wade. Cohort3 indicates whether the individual was born from , after the national legalization of abortion. Birthrate represents the overall birthrate per 1000 women ages The Difference in Difference model is as follows: 80
82 Birthrate = β 0 + β 1 early + β 2 cohort2 + β 3 cohort3 + β 4 earlycoh2 + β 5 earlycoh3 +µ This model examines the effect on birthrates of being born in an early legalizer state during cohort 1, compared to the impact of being born in an early legalizer state during cohorts 2 and 3. Primarily, I expect to see an effect in the interaction term earlycoh2, a variable indicating whether an individual was born in an early state, where the policy change occurred, and during cohort 2, when the abortion policy change occurred. There could also be observable effects in the earlycoh3 interaction term, a variable indicating whether an individual was born in an early state during cohort 3. A significant coefficient on earlycoh3 would suggest that abortion legislation has a lagged impact on birthrates. I predict that the coefficients on these interactions will be negative, suggesting that abortion legislation has a negative effect on the birthrate. Deaths: As in the birth regression, early is a dummy variable indicating whether or not the individual was born in an early legalizer state. Cohort1 indicates whether the individual was born from , when no legislation was passed. Cohort2 indicates whether the individual was born from , when abortion was legalized in some states, prior to Roe v. Wade. Cohort3 indicates whether the individual was born from , after the national legalization of abortion. Deathrate represents the overall mortality rate per 1000 individuals. The controls, represented by X, include population characteristics, such as the fraction of the population that is African American, other race, and male (fractionblack, fractionoth, and fractionmale). The Difference in Difference model is as follows: deathrate = β 0 + β 1 early + β 2 cohort2 + β 3 cohort3 + β 4 earlycoh2 + β 5 earlycoh3 +β 6 X +µ 81
83 This model examines the effect on mortality rates of being born in an early legalizer state during cohort 1, compared to the impact of being born in an early legalizer state during cohorts 2 and 3. As in the birth model, I expect to see an effect in the interaction term earlycoh2. There could also be observable effects in the earlycoh3 interaction term, if abortion legalization has a lagged impact on mortality in the next generation. I predict that the coefficients on these interactions will be negative, suggesting that abortion legislation has a negative effect on the mortality rate. Data: I create a dummy variable, early, to indicate whether or not the individual was born in a state that legalized abortion prior to Roe v. Wade. Furthermore, I generate cohort variables to indicate whether or not an individual was born in a specific cohort. These variables are used in the difference-in-differences model. Results: The results of the Difference in Difference model, shown in Table 24, confirm that abortion has a negative and significant impact on the birthrate, teen birthrate, and mortality rate, results consistent with the Fixed Effects regressions. In both of the birth regressions, the coefficients on early are negative and significant, suggesting that the birthrates are lower overall in early states than in non-early states. In both of the birth regressions the coefficient on cohort3 is negative and significant, demonstrating that birthrates are lower overall from In Regression 1, there is a negative and statistically significant coefficient on the interaction term, earlycoh2, demonstrating that the birthrate is lower in an early state during legalization, compared to an early state prior to abortion legalization, suggesting the legislation decreased the 82
84 overall birthrate. The coefficient on earlycoh3 is not significant, suggesting there is not a lagged effect of legalization on the overall birthrate. Regression 2 examines the impact of abortion legalization on teen births and demonstrates that the teen birthrate is significantly lower in an early state in both cohorts 2 and 3 when compared to cohort 1, evidence that the negative impact of legalization continues past immediately after the legislation is passed. The size of the coefficient on earlycoh2 in Regression 2 is twice that in Regression 1, demonstrating that abortion legalization has a stronger impact on teen births than the overall birthrate, consistent with the results of the Fixed Effects Regression. 50 In Regression 3, the coefficient on cohort2 is negative and significant, suggesting that those born later have lower mortality rates, an intuitive result. Regression 3 also demonstrates that those born in an early state in cohort 2 have lower mortality rates in adulthood than those born in an early state in cohort 1, a result that is statistically significant at the 1% level. The coefficient on earlycoh3 is statistically significant and negative, evidence of a sustained impact of abortion legalization on adult mortality for those born in early states after the legislation is passed, suggesting that abortion access continued to expand right after legalization. Since the coefficient on earlycoh3 was only significant when examining its impact on the teen birthrate, the results suggest that the sustained impact of abortion legalization in early states in cohort 3 is most likely driven by the expanded access to teens during this time period. Therefore, the Difference in Difference regressions confirm the results of the Fixed Effects regressions, 50 The Difference in Difference regressions also produce a negative and statistically significant coefficient in earlycoh2 when examining the impact of abortion legalization on the white birthrate and the black birthrate, with a larger coefficient for the black birthrate, consistent with the Fixed Effects regressions. 83
85 demonstrating that abortion legalization is associated with a decrease in the birthrate, teen birthrate, and mortality rate in the next generation. 51 Appendix E: Controlling for Birth Control Pill and Abortion Access for Minors Data: Using the information on minor s access to these contraceptive methods in Guldi (2005), I created a data set including the state, the year, and the month, and variables indicating whether or not abortion or birth control was legal for minors. Since the data in Guldi (2005) lists only the year that the laws regarding minors access to the pill changed, I created one variable assuming the laws changed at the beginning of the year (beg), and one assuming that the laws changed at the end of the year (end). In addition, I created variables indicating whether 14 year olds (pillleg14beg) were legally able to take the pill. These variables are all lagged 12 months to take into account the amount of time it takes for the pill to have an effect. Since the data in Guldi (2005) lists only the year that the parental consent laws for minors seeking an abortion changed, as well, I created one variable assuming the laws changed at the beginning of the year (beg), and one assuming that the laws changed at the end of the year (end). In addition, I created variables indicating 14 year olds (minleg14beg) were legally able to have an abortion. These variables are all lagged by 6, 18, and 30 months, as were the abortion legalization variables. These variables are used as controls in regressions to ensure any effects I am observing are coming from Roe v. Wade and early legalization, not the later changes in related laws. 51 The Difference in Difference regressions also produce a negative and statistically significant coefficient in earlycoh2 when examining the impact of abortion legalization on the black mortality rate, with a continued significant impact in earlycoh3. None of the coefficients on the interaction terms are significant when the white mortality rate is used as the dependent variable. These results also confirm those produced by the Fixed Effects regressions. 84
86 Appendix F: Time Trend Regressions: Methods: I control for state-specific trends in the birthrate and mortality rate occurring in states before abortion legalization occurred. Birth Regression: birthrate bs = β 0 + β 1 legal18 bs + γ b + δ s *birthmonth b + µ bs Death Regression: deathrate bs = β 0 + β 1 legal18 bs + γ b + δ s *birthmonth b + µ bs As before, the birthrate represents the birthrate per 1000 women ages and the deathrate represents the mortality rate per 1000 births. The explanatory variable, legal18, indicates whether abortion was legal eighteen months prior to birth and the model includes state of birth and birth month fixed effects and a linear time trend within each state. The birth regressions are weighted by the female population and the death regressions are weighted by the total number of births. Standard errors are clustered. Results: Table 25 demonstrates that, when controlling for linear time trends, abortion legalization continues to have a significant negative effect on the birthrate. All regressions in Table 25 are weighted and use legal18 as the explanatory variable. 52 As Regression 1 illustrates, controlling for linear time trends does not diminish the impact of legal18 on the birthrate and the magnitude 52 The results do not change substantially when legal6 and legal30 are used instead of legal18. 85
87 of the effect, a decrease in the birthrate of.23 percentage points, is very similar to that demonstrated in Table 3, a decrease in the birthrate of.24 percentage points. Controlling for linear time trends in the teen birthrate regression does decrease the magnitude of the effect by about.10 percentage points, but does not diminish the significance of the effect. As Regressions 3 and 4 illustrate, abortion legalization continues to have a negative impact on the white and black birthrates eighteen months after legalization even when controlling for linear time trends. The coefficients on legal18 for both of these regressions did not change substantially as a result of the linear time trend and continue to be significant at the 1% level. Consequently, the results of the linear time trend regressions are consistent with the fixed effects results, further evidence that abortion legalization is associated with a decrease in the birthrate. However, Table 25 demonstrates that, when controlling for linear time trends, abortion legalization no longer has a significant negative effect on the mortality rate. Abortion legalization is associated with a negative impact on the mortality rate eighteen months after legalization but this result is no longer significant and the size of the coefficient has been greatly reduced from that shown in Table 6. Looking at the impact by race, Regression 6 illustrates that abortion legalization is no longer associated with a significant decrease in the white mortality rate eighteen months after legalization. However, the coefficient on legal18 in Regression 7 is significant, suggesting that abortion legalization continues to be associated with a decrease in the black mortality rate even after controlling for time trends. Nevertheless, the size of the coefficient on legal18 is greatly reduced from that shown in Table 9. Therefore, the mortality results are sensitive to time trends. It is possible that the regression does not have enough statistical power to distinguish between time trends and the effect of the policy. 86
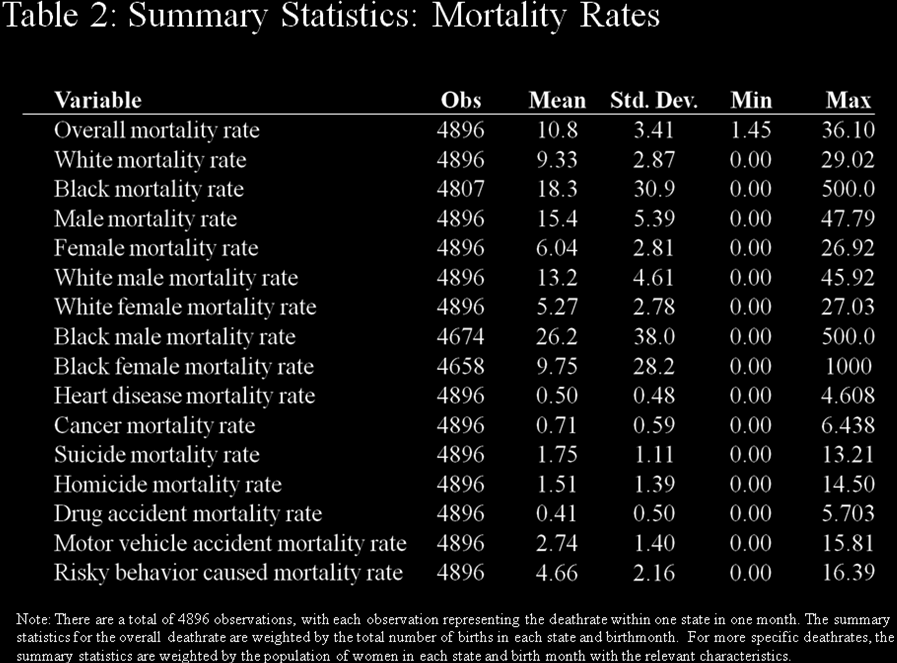
88 87
89 88

90 89

91 90

92 91
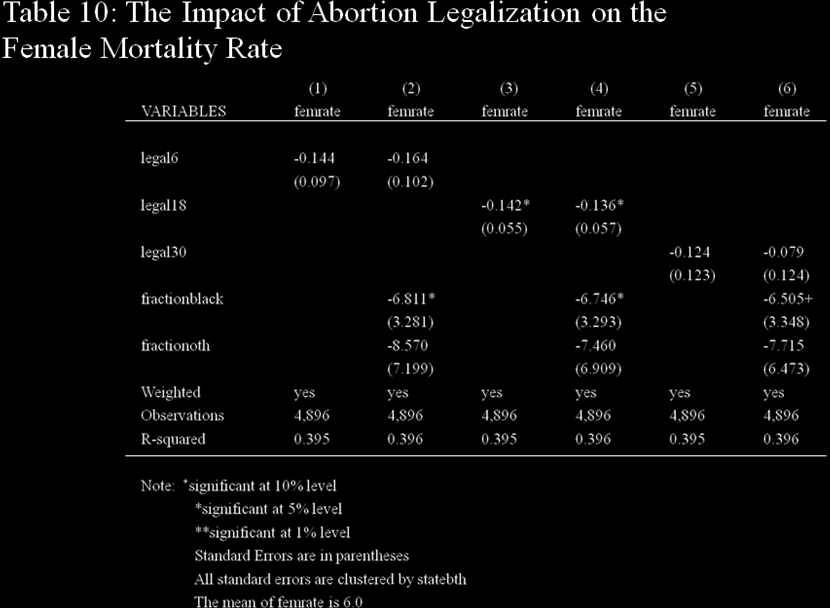
93 92

94 93

95 94
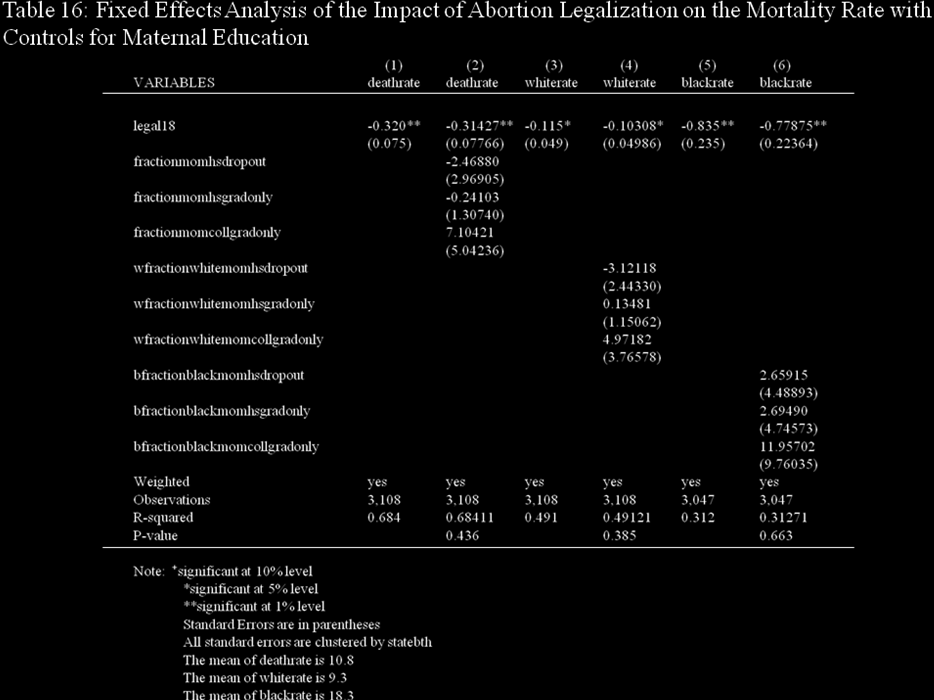
96 95
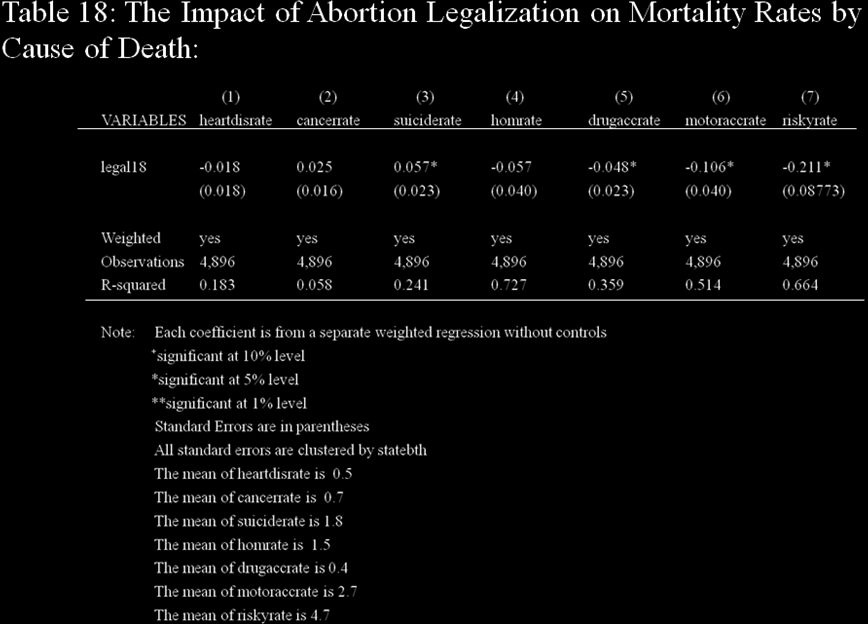
97 96

98 97
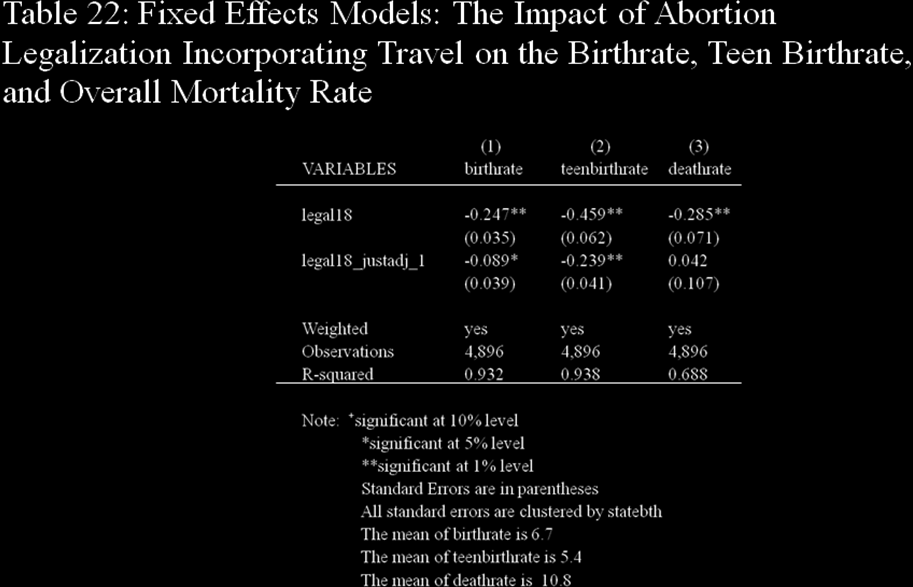
99 98

100 99
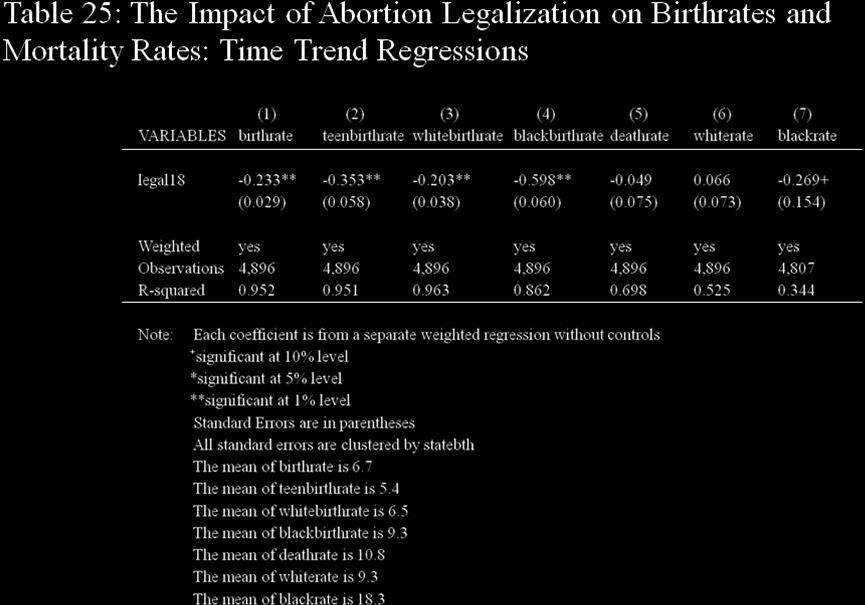
101 100
Education, Income, and Poverty: The Long-term Impact of Abortion
 Education, Income, and Poverty: The Long-term Impact of Abortion Allison Davido Faculty Advisor: Dr. Martha Bailey Economics Senior Honors Thesis April 15, 2009 Abstract The legalization of abortion is
Adolescent Mortality. Alaska s adolescent mortality rate is 29% higher than the national rate and almost 1.6 times the Healthy People 2010 target.
 Alaska Maternal and Child Health Data Book 23 15 Adolescent Mortality Nationally, unintentional injury, assault and suicide account for 51% of deaths among adolescents ages 1-14 years in 2. Over the last
CORRELATIONAL ANALYSIS BETWEEN TEENAGE PREGNANCY AND MATERNAL MORTALITY IN MALAWI
 CORRELATIONAL ANALYSIS BETWEEN TEENAGE PREGNANCY AND MATERNAL MORTALITY IN MALAWI Abiba Longwe-Ngwira and Nissily Mushani African Institute for Development Policy (AFIDEP) P.O. Box 31024, Lilongwe 3 Malawi
Morbidity and Mortality among Adolescents and Young Adults in the United States
 Morbidity and Mortality among Adolescents and Young Adults in the United States AstraZeneca Fact Sheet 2011 Authors Robert Wm. Blum MD, MPH, PhD William H. Gates, Sr. Professor and Chair Farah Qureshi,
DOES MORE SCHOOLING CAUSE BETTER HEALTH?
 DOES MORE SCHOOLING CAUSE BETTER HEALTH? MEMORIAL LECTURE IN HONOR OF TADASHI YAMADA 2011 MEETING OF JAPAN HEALTH ECONOMICS ASSOCIATION MICHAEL GROSSMAN CITY UNIVERSITY OF NEW YORK GRADUATE CENTER AND
The Health and Well-being of the Aboriginal Population in British Columbia
 The Health and Well-being of the Aboriginal Population in British Columbia Interim Update February 27 Table of Contents Terminology...1 Health Status of Aboriginal People in BC... 2 Challenges in Vital
Health Disparities in New Orleans
 Health Disparities in New Orleans New Orleans is a city facing significant health challenges. New Orleans' health-related challenges include a high rate of obesity, a high rate of people without health
Last year, The Center for Health Affairs (CHA) asked
 asked") Planning & Action February 2008 9 By Mark Salling, Ph.D., and Michele Egan Health Needs Analysis, Assessment Looks at the Region Last year, The Center for Health Affairs (CHA) asked Community Solutions
Planning & Action February 2008 9 By Mark Salling, Ph.D., and Michele Egan Health Needs Analysis, Assessment Looks at the Region Last year, The Center for Health Affairs (CHA) asked Community Solutions
U.S. Teenage Pregnancy Statistics Overall Trends, Trends by Race and Ethnicity And State-by-State Information
 U.S. Teenage Pregnancy Statistics Overall Trends, Trends by Race and Ethnicity And State-by-State Information The Alan Guttmacher Institute 120 Wall Street, New York, NY 10005 www.guttmacher.org Updated
The Impact of an Abortion Ban on Socio-Economic Outcomes of Children: Evidence from Romania
 The Impact of an Abortion Ban on Socio-Economic Outcomes of Children: Evidence from Romania Cristian Pop-Eleches Columbia University October 2005 Abstract This study examines educational and labor outcomes
49. INFANT MORTALITY RATE. Infant mortality rate is defined as the death of an infant before his or her first birthday.
 49. INFANT MORTALITY RATE Wing Tam (Alice) Jennifer Cheng Stat 157 course project More Risk in Everyday Life Risk Meter LIKELIHOOD of exposure to hazardous levels Low Medium High Consequences: Severity,
NATIONAL BABY FACTS. Infants, Toddlers, and Their Families in the United States THE BASICS ABOUT INFANTS AND TODDLERS
 NATIONAL BABY FACTS Infants, Toddlers, and Their Families in the United States T he facts about infants and toddlers in the United States tell us an important story of what it s like to be a very young
Delaying First Pregnancy
 Delaying First Pregnancy Introduction The age at which a woman has her first pregnancy affects the health and life of a mother and her baby. While pregnancy can present health risks at any age, delaying
Abortion Legalization and Adolescent Substance Use
 Abortion Legalization and Adolescent Substance Use Kerwin Kofi Charles University of Michigan and National Bureau of Economic Research and Melvin Stephens Jr. Carnegie Mellon University and National Bureau
Marriage and divorce: patterns by gender, race, and educational attainment
 ARTICLE OCTOBER 2013 Marriage and divorce: patterns by gender, race, and educational attainment Using data from the National Longitudinal Survey of Youth 1979 (NLSY79), this article examines s and divorces
May 2014 U.S. Teenage Pregnancies, Births and Abortions, 2010: National and State Trends by Age, Race and Ethnicity
 May 2014 U.S. Teenage Pregnancies, Births and Abortions, 2010: National and State Trends by Age, Race and Ethnicity Kathryn Kost and Stanley Henshaw Table of Contents Introduction 2 Key Findings 2 Discussion
Education: It Matters More to Health than Ever Before
 ISSUE BRIEF Education: It Matters More to Health than Ever Before Americans with fewer years of education have poorer health and shorter lives, and that has never been more true than today. In fact, since
The American Cancer Society Cancer Prevention Study I: 12-Year Followup
 Chapter 3 The American Cancer Society Cancer Prevention Study I: 12-Year Followup of 1 Million Men and Women David M. Burns, Thomas G. Shanks, Won Choi, Michael J. Thun, Clark W. Heath, Jr., and Lawrence
Educational Attainment in the United States: 2003
 Educational Attainment in the United States: 2003 Population Characteristics Issued June 2004 P20-550 The population in the United States is becoming more educated, but significant differences in educational
Data Analysis and Interpretation. Eleanor Howell, MS Manager, Data Dissemination Unit State Center for Health Statistics
 Data Analysis and Interpretation Eleanor Howell, MS Manager, Data Dissemination Unit State Center for Health Statistics Why do we need data? To show evidence or support for an idea To track progress over
Worksheet: Firearm Availability and Unintentional Firearm Deaths
 Worksheet: Firearm Availability and Unintentional Firearm Deaths Name: Date: / / 1. How might the possibility that... where there are more guns parents care less about their children s welfare.... influence
Epidemiology 521. Epidemiology of Maternal and Child Health Problems. Winter / Spring, 2010
 Extended MPH Degree Program School of Public Health Department of Epidemiology University of Washington Epidemiology 521 Epidemiology of Maternal and Child Health Problems Winter / Spring, 2010 Instructor:
ARE FLORIDA'S CHILDREN BORN HEALTHY AND DO THEY HAVE HEALTH INSURANCE?
 infant mortality rate per 1,000 live births ARE FLORIDA'S CHILDREN BORN HEALTHY AND DO THEY HAVE HEALTH INSURANCE? Too Many of Florida's Babies Die at Birth, Particularly African American Infants In the
State Health Assessment Health Priority Status Report Update. June 29, 2015 Presented by UIC SPH and IDPH
 State Health Assessment Health Priority Status Report Update June 29, 2015 Presented by UIC SPH and IDPH 1 Health Priority Presentation Objectives 1. Explain context of how this discussion fits into our
Pregnant and Parenting Youth in Foster Care in Washington State: Comparison to Other Teens and Young Women who Gave Birth
 January 2014 RDA Report 11.202 Olympia, Washington Pregnant and Parenting in Care in Washington State: Comparison to Other and Women who Gave Birth Laurie Cawthon, MD, MPH Barbara Lucenko, PhD Peter Woodcox,
Number, Timing, and Duration of Marriages and Divorces: 2009
 Number, Timing, and Duration of Marriages and Divorces: 2009 Household Economic Studies Issued May 2011 P70-125 INTRODUCTION Marriage and divorce are central to the study of living arrangements and family
in children less than one year old. It is commonly divided into two categories, neonatal
 INTRODUCTION Infant Mortality Rate is one of the most important indicators of the general level of health or well being of a given community. It is a measure of the yearly rate of deaths in children less
Motor Vehicle Deaths Updated: August 2014
 Motor Vehicle Deaths Updated: Motor vehicle death rates rise rapidly during the teen years and remain very high into early adulthood. The rate for teens, however, has followed a downward trend for most
TEENAGE PREGNANCY. Arizona,2000-2010. Public Health Services Bureau of Public Health Statistics Health Status and Vital Statistics Section
 TEENAGE PREGNANCY Arizona,2000-2010 Public Health Services Bureau of Public Health Statistics Health Status and Vital Statistics Section ~ Leadership for a Healthy Arizona ~ Janice K. Brewer, Governor
TIME SERIES ANALYSIS
 DEPARTMENT OF POLITICAL SCIENCE AND INTERNATIONAL RELATIONS Posc/Uapp 816 TIME SERIES ANALYSIS I. AGENDA: A. Correction B. Time series C. Reading: Agresti and Finlay Statistical Methods in the Social Sciences,
The relationship between socioeconomic status and healthy behaviors: A mediational analysis. Jenn Risch Ashley Papoy.
 Running head: SOCIOECONOMIC STATUS AND HEALTHY BEHAVIORS The relationship between socioeconomic status and healthy behaviors: A mediational analysis Jenn Risch Ashley Papoy Hanover College Prior research
Successful Children and Youth
 Successful Children and Youth are cared for by nurturing adults who support their healthy growth and development; live in safe environments free from abuse, neglect, and trauma; have basic necessities;
Ladies by Design Junior Debutante Course COORDINATOR CERTIFICATION Touching Tomorrow s Women Today
 Ladies by Design Junior Debutante Course COORDINATOR CERTIFICATION Touching Tomorrow s Women Today Module 2: All About Girls: Statistics and Facts African American girls and teens statistics National Girls
Cost of Poverty to Community Sustainability
 Cost of Poverty to Community Sustainability Ruby K. Payne, Ph.D. In total, the United States spends nearly $1 trillion every year to fight poverty. That amounts to $20,610 for every poor person in America,
Education and Wage Differential by Race: Convergence or Divergence? *
 Education and Wage Differential by Race: Convergence or Divergence? * Tian Luo Thesis Advisor: Professor Andrea Weber University of California, Berkeley Department of Economics April 2009 Abstract This
Important facts to remember
 Important facts to remember If you re pregnant or trying to get pregnant, or if you know someone who is, there are several important points to remember: See a healthcare professional regularly. Get plenty
Relationship Between Child Abuse, Substance Abuse and Violence
 Relationship Between Child Abuse, Substance Abuse and Violence Native American Population (All Ages) Leads nation in death caused by: alcohol-related motor vehicle fatalities chronic liver disease and
America s Health Starts With Healthy Children: How Do States Compare?
 America s Health Starts With Healthy Children: How Do States Compare? October 2008 Executive Summary Page 2 Introduction Page 5 A National Overview Page 13 How Do States Compare? Page 18 A State Snapshot:
Maternity Leave and Employment Patterns of First-Time Mothers: 1961 2008
 Maternity Leave and Employment Patterns of First-Time Mothers: 96 008 Household Economic Studies Issued October 0 P70-8 INTRODUCTION The labor force participation of mothers has increased dramatically
Massachusetts Evidence-Based Home Visiting Program: Needs Assessment Narrative
 Narrative Appendix C: Data Indicator Definitions and Sources Used in Community Risk Ranking Outcome #1 Maternal & Infant Health 1 Premature births -Percent: # live births before 37 weeks/total # live births
The Effect of Abortion Legalization on Sexual Behavior: Evidence from Sexually Transmitted Diseases
 The Effect of Abortion Legalization on Sexual Behavior: Evidence from Sexually Transmitted Diseases Jonathan Klick and Thomas Stratmann ABSTRACT Unwanted pregnancy represents a major cost of sexual activity.
The Role of Hospital Heterogeneity in Measuring Marginal Returns to Medical Care: A Reply to Barreca, Guldi, Lindo, and Waddell *
 The Role of Hospital Heterogeneity in Measuring Marginal Returns to Medical Care: A Reply to Barreca, Guldi, Lindo, and Waddell * Douglas Almond Joseph J. Doyle, Jr. Amanda E. Kowalski Heidi Williams Abstract:
Teens Who Drop Out Teens Not In School and Not Working School Achievement
 Teens Who Drop Out Teens Not In School and Not Working School Achievement DEFINITION The trend graph is based on the national Kids Count definition of dropouts: the percentage of teenagers 16 through
Sources of Health Insurance Coverage in Georgia 2007-2008
 Sources of Health Insurance Coverage in Georgia 2007-2008 Tabulations of the March 2008 Annual Social and Economic Supplement to the Current Population Survey and The 2008 Georgia Population Survey William
CITY OF MILWAUKEE POLICE SATISFACTION SURVEY
 RESEARCH BRIEF Joseph Cera, PhD Survey Center Director UW-Milwaukee Atiera Coleman, MA Project Assistant UW-Milwaukee CITY OF MILWAUKEE POLICE SATISFACTION SURVEY At the request of and in cooperation with
TEENAGE PREGNANCY. Arizona,1999-2009. Public Health Services Bureau of Public Health Statistics Health Status and Vital Statistics Section
 TEENAGE PREGNANCY Arizona,1999-2009 Public Health Services Bureau of Public Health Statistics Health Status and Vital Statistics Section ~ Leadership for a Healthy Arizona ~ Janice K. Brewer, Governor
Adopted Children s Outcomes as Young Adults in Regards to Educational Attainment and Income
 Adopted Children s Outcomes as Young Adults in Regards to Educational Attainment and Income NICOLE SPEAR I. Introduction Adopting a child is not an easy undertaking. In fact, adopting a child requires
Racial and Ethnic Disparities in Maternal Mortality in the United States
 Racial and Ethnic Disparities in Maternal Mortality in the United States KYRIAKOS S. MARKIDES, PHD UNIVERSITY OF TEXAS MEDICAL BRANCH GALVESTON, TEXAS PRESENTED AT THE HOWARD TAYLOR INTERNATIONAL SYMPOSIUM
Comorbidity of mental disorders and physical conditions 2007
 Comorbidity of mental disorders and physical conditions 2007 Comorbidity of mental disorders and physical conditions, 2007 Australian Institute of Health and Welfare Canberra Cat. no. PHE 155 The Australian
Family Structure and Abortion Law
 Family Structure and Abortion Law Deborah Goldschmidt November 2014 - Preliminary, do not circulate Abstract This study examines the relationship between abortion regulations and family structure. These
Are Women Opting Out? Debunking the Myth
 BRIEFING PAPER November 2005 Are Women Opting Out? Debunking the Myth BY HEATHER BOUSHEY Executive Summary A front page article in the New York Times (Story 2005) recently reported that women at Yale University
Trends in Adult Female Substance Abuse Treatment Admissions Reporting Primary Alcohol Abuse: 1992 to 2007. Alcohol abuse affects millions of
 Treatment Episode Data Set The TEDS Report January 7, 2010 Trends in Adult Female Substance Abuse Treatment Admissions Reporting Primary Alcohol Abuse: 1992 to 2007 In Brief Between 1992 and 2007, the
Business Cycles and Divorce: Evidence from Microdata *
 Business Cycles and Divorce: Evidence from Microdata * Judith K. Hellerstein 1 Melinda Sandler Morrill 2 Ben Zou 3 We use individual-level data to show that divorce is pro-cyclical on average, a finding
Lesson Seventeen: Uncovering the Facts about Adoption, Abortion and Teen Parenthood
 Lesson Seventeen: Uncovering the Facts about Adoption, Abortion and Teen Parenthood Student Learning Objectives: The students will be able to... 1. Identify who can legally consent to have an abortion,
Policy Forum. Racial and Ethnic Health Disparities in Illinois: Are There Any Solutions?
 Policy Forum I N S T I T U T E O F G O V E R N M E N T&P U B L I C A F F A I R S I N S T I T U T E O F G O V E R N M E N T&P U B L I C A F F A I R S Racial and Ethnic Health Disparities in Illinois: Are
Substance Use, Treatment Need and Receipt of Treatment in Minnesota:
 Substance Use, Treatment Need and Receipt of Treatment in Minnesota: Results from Minnesota Student Survey, Minnesota Survey on Adult Substance Use, and Drug and Alcohol Abuse Normative Evaluation System
Projections of the Size and Composition of the U.S. Population: 2014 to 2060 Population Estimates and Projections
 Projections of the Size and Composition of the U.S. Population: to Population Estimates and Projections Current Population Reports By Sandra L. Colby and Jennifer M. Ortman Issued March 15 P25-1143 INTRODUCTION
Underage Drinking. Underage Drinking Statistics
 Underage Drinking Underage drinking is a serious public health problem in the United States. Alcohol is the most widely used substance of abuse among America s youth, and drinking by young people poses
Current Adoption Policy and Practice - a comparison between North America and Australia
 Current Adoption Policy and Practice - a comparison between North America and Australia Introduction I am often asked about current adoption policy and practice in Australia and how this differs from policy
EXPANDING THE POSSIBILITIES. mindthe gap: low-income women in dire. need of health insurance
 EXPANDING THE POSSIBILITIES mindthe gap: low-income women in dire need of health insurance ABOUT THE CENTER The National Women s Law Center is a non-profit organization whose mission is to expand the possibilities
Income is the most common measure
 Income Goal A healthy standard of living for all Income is the most common measure of socioeconomic status, and a strong predictor of the health of an individual or community. When assessing the health
TEEN MARIJUANA USE WORSENS DEPRESSION
 TEEN MARIJUANA USE WORSENS DEPRESSION An Analysis of Recent Data Shows Self-Medicating Could Actually Make Things Worse Millions of American teens* report experiencing weeks of hopelessness and loss of
Graduate Student Epidemiology Program
 Graduate Student Epidemiology Program To promote training in MCH Epidemiology Real-World Experience in: Data Analysis and Monitoring Needs Assessment Program Evaluation 2014 Program Guide Submit your application
Type 1 Diabetes ( Juvenile Diabetes)
") Type 1 Diabetes W ( Juvenile Diabetes) hat is Type 1 Diabetes? Type 1 diabetes, also known as juvenile-onset diabetes, is one of the three main forms of diabetes affecting millions of people worldwide.
Type 1 Diabetes W ( Juvenile Diabetes) hat is Type 1 Diabetes? Type 1 diabetes, also known as juvenile-onset diabetes, is one of the three main forms of diabetes affecting millions of people worldwide.
Lifetime Likelihood of Going to State or Federal Prison
 U.S. Department of Justice Office of Justice Programs Bureau of Justice Statistics Special Report March 1997, NCJ-160092 Lifetime Likelihood of Going to State or Federal Prison By Thomas P. Bonczar and
The Role of International Law in Reducing Maternal Mortality
 The Role of International Law in Reducing Maternal Mortality K. Madison Burnett * Safe motherhood is a human rights issue The death of a woman during pregnancy or childbirth is not only a health issue
Durham County Community Health. Assessment? What Is a Community Health
 Durham County Community Health Assessment This document presents key findings from the 2011 Durham County Community Health Assessment. The goal of the assessment was to provide a compilation of valid and
FAMILY HEALTH SERVICES DIVISION Profiles 2014 OVERVIEW
 FAMILY HEALTH SERVICES DIVISION Profiles 2014 OVERVIEW Family Health Services Division Overview Data Sources Life Course Perspective and Title V Priorities Population Overview Births Infant Mortality Chapter
CHAPTER I INTRODUCTION. Here in the Philippines, we believe in the saying of our national hero Dr.
 1 CHAPTER I INTRODUCTION Background of the Study Here in the Philippines, we believe in the saying of our national hero Dr. Jose P. Rizal that Youth is the hope of our Mother land. In their hand lies the
Huron County Community Health Profile
 2014 Huron County Community Health Profile ` Prepared by: Eileen Unruh RN, MSN Samantha Fackler RN, MSN 11/1/2014 1 HURON COUNTY COMMUNITY HEALTH PROFILE TABLE OF CONTENTS INTRODUCTION.... 4 DEMOGRAPHICS...
No. 125 April 2001. Enhanced Surveillance of Maternal Mortality in North Carolina
 CHIS Studies North Carolina Public Health A Special Report Series by the 1908 Mail Service Center, Raleigh, N.C. 27699-1908 www.schs.state.nc.us/schs/ No. 125 April 2001 Enhanced Surveillance of Maternal
Social Security Eligibility and the Labor Supply of Elderly Immigrants. George J. Borjas Harvard University and National Bureau of Economic Research
 Social Security Eligibility and the Labor Supply of Elderly Immigrants George J. Borjas Harvard University and National Bureau of Economic Research Updated for the 9th Annual Joint Conference of the Retirement
WAGE REPORTS FOR WORKERS COVERED BY FEDERAL OLD-AGE INSURANCE IN 1937
 WAGE REPORTS FOR WORKERS COVERED BY FEDERAL OLD-AGE INSURANCE IN 937 JOHN J. CORSON* 3 DURING 937 approximately 3 million men and women worked in employment covered by Federal old-age insurance. They received
Racial and Ethnic Disparities in Women s Health Coverage and Access To Care Findings from the 2001 Kaiser Women s Health Survey
 March 2004 Racial and Ethnic Disparities in Women s Health Coverage and Access To Care Findings from the 2001 Kaiser Women s Health Survey Attention to racial and ethnic differences in health status and
The Impact of Ultrasound Laws on the Demand for Abortions by Young Women
 The Impact of Ultrasound Laws on the Demand for Abortions by Young Women Mark Gius Quinnipiac University The purpose of the present study is to determine if laws requiring ultrasounds have any effect on
Health Care Access to Vulnerable Populations
 Health Care Access to Vulnerable Populations Closing the Gap: Reducing Racial and Ethnic Disparities in Florida Rosebud L. Foster, ED.D. Access to Health Care The timely use of personal health services
http://www.cdc.gov/nchs.
 As the Nation s principal health statistics agency, the National Center for Health Statistics (NCHS) compiles statistical information to guide actions and policies to improve the health of the population.
Sacramento County 2010
 Indicators of Alcohol and Other Drug Risk and Consequences for California Counties County 21 Indicators of Alcohol and Other Drug Risk and Consequences for California Counties County 21 TABLE OF CONTENTS
Testing for Adverse Selection Using Micro Data on Automatic Renewal Term Life Insurance
 Testing for Adverse Selection Using Micro Data on Automatic Renewal Term Life Insurance Shinichi Yamamoto Department of Economics, Ritsumeikan University Kyoto, Japan s-yamato@ec.ritsumei.ac.jp Takau Yoneyama
EXPANDING THE POSSIBILITIES. states. must close the gap: low-income women. need health insurance
 EXPANDING THE POSSIBILITIES states must close the gap: low-income women need health insurance ABOUT THE CENTER The National Women s Law Center is a non-profit organization whose mission is to expand the
Health Profile for St. Louis City
 Health Profile for St. Louis City The health indicators of St. Louis City show that the city has many health problems. To highlight a few, the city s rates of sexually transmitted diseases (i.e., HIV/AIDS,
9. Substance Abuse. pg 166-169: Self-reported alcohol consumption. pg 170-171: Childhood experience of living with someone who used drugs
 9. pg 166-169: Self-reported alcohol consumption pg 170-171: Childhood experience of living with someone who used drugs pg 172-173: Hospitalizations related to alcohol and substance abuse pg 174-179: Accidental
On behalf of the Association of Maternal and Child Health Programs (AMCHP), I am
, I am") Christopher Kus, M.D., M.P.H. Association of Maternal and Child Health Programs, Public Witness Testimony House Labor, Health and Human Services and Education Appropriations Subcommittee March 13, 2013
Christopher Kus, M.D., M.P.H. Association of Maternal and Child Health Programs, Public Witness Testimony House Labor, Health and Human Services and Education Appropriations Subcommittee March 13, 2013
Outline Chapter 1 Child Psychology 211 Dr. Robert Frank. 1 What is child development, and how has its study evolved?
 Outline Chapter 1 Chapter 1: GUIDEPOSTS FOR STUDY 1 What is child development, and how has its study evolved? 2 What are six fundamental points about child development on which consensus has emerged? 3
Virginia RANKING: 19
 Virginia RANKING: 19 Virginia provides fairly comprehensive protection for women, the unborn, and newly born children. It is also one of only a small number of states that has enacted meaningful, protective
Undue Burdens: The Effect of Abortion Restrictions on Foster Care Entry Rates
 Undue Burdens: The Effect of Abortion Restrictions on Foster Care Entry Rates Sarah MacDonald Sutherland Professor Marjorie B. McElroy, Faculty Advisor Honors Thesis submitted in partial fulfillment of
Substance-Exposed Newborns
 Substance-Exposed Newborns State of Oklahoma 2013 Substance-Exposed Newborns State of Oklahoma 2013 Legal Background Federal guidelines in the Child Abuse Prevention and Treatment Act (CAPTA) require states
Demographic Analysis of the Salt River Pima-Maricopa Indian Community Using 2010 Census and 2010 American Community Survey Estimates
 Demographic Analysis of the Salt River Pima-Maricopa Indian Community Using 2010 Census and 2010 American Community Survey Estimates Completed for: Grants & Contract Office The Salt River Pima-Maricopa
KANKAKEE COUNTY ANALYSIS OF COMMUNITY HEALTH NEEDS
 ANALYSIS OF COMMUNITY HEALTH NEEDS March 2007 Prepared for Kankakee County Health Department Provena St. Mary s Hospital Riverside HealthCare Prepared by University of Illinois College of Medicine at Rockford
King County City Health Profile Vashon Island
 King County City Health Profile Vashon Island West Seattle North Highline Burien SeaTac/Tukwila Vashon Island Des Moines/Normandy Park Kent-West East Federal Way Fed Way-Dash Point/Woodmont December, 212
San Diego County 2010
 Indicators of Alcohol and Other Drug Risk and Consequences for California Counties San Diego County 21 Indicators of Alcohol and Other Drug Risk and Consequences for California Counties San Diego County
University Hospital Community Health Needs Assessment FY 2014
 FY 2014 Prepared by Kathy Opromollo Executive Director of Ambulatory Care Services Newark New Jersey is the State s largest city. In striving to identify and address Newark s most pressing health care
Substance Abuse 2014-2015. Chapter 10: Substance Abuse
 Substance Abuse 214-215 Chapter 1: Substance Abuse 265 214-215 Health of Boston Substance Abuse Substance abuse involves the excessive use of alcohol or illicit substances (e.g., marijuana, cocaine, heroin,
The Power of the Pill for the Next Generation: Oral Contraception s Effects on Fertility, Abortion, and Maternal & Child Characteristics
 The Power of the Pill for the Next Generation: Oral Contraception s Effects on Fertility, Abortion, and Maternal & Child Characteristics Elizabeth Oltmans Ananat (Duke University and NBER) Daniel M. Hungerman
Alabama s Rural and Urban Counties
 Selected Indicators of Health Status in Alabama Alabama s Rural and Urban Counties Jointly produced to assist those seeking to improve health care in rural Alabama by The Office of Primary Care and Rural
Overall, 67.8% of the 404,638 state
 U.S. Department of Justice Office of Justice Programs Bureau of Justice Statistics Special Report April 2014 ncj 244205 Recidivism of Prisoners Released in 30 States in 2005: Patterns from 2005 to 2010
Jamaica Coalition for a Healthy Society & the Lawyers Christian Fellowship, Jamaica
 Jamaica Coalition for a Healthy Society & the Lawyers Christian Fellowship, Jamaica International Conference on Human Rights: International Law and the Welfare of the Family December 2013. Kingston, Jamaica
Family Health Dataline
 October 1999 Vol 5, No 3 Corrected Feb. 2000 IN THIS ISSUE: In Alaska during 1996-97, 41% of live births were the result of unintended pregnancies. All racial, age, and education groups evaluated had high
THE EFFECT OF INSURANCE ON INFANT HEALTH: A CASE STUDY OF LOW-INCOME WOMEN IN NEW JERSEY. Center for Research on Child Wellbeing Working Paper #98-30
 THE EFFECT OF INSURANCE ON INFANT HEALTH: A CASE STUDY OF LOW-INCOME WOMEN IN NEW JERSEY Center for Research on Child Wellbeing Working Paper #98-30 Robert Kaestner Nancy Reichman Theodore Joyce Effect