Ultrasonic Drug Delivery
|
|
|
- Jonah Stevenson
- 9 years ago
- Views:
Transcription
1 Ultrasonic Drug Delivery Encapsulation Systems PO Box 759 Broomall, PA USA Ph: / Fax Bruce K. Redding Jr.

2 Non-Invasive Insulin Delivery

3 U-Wand Designed to Fit a Women s Grip

4 U-Strip Insulin Patch & U-Wand Skin Transport Mechanism

5 Transdermal drug delivery The three principal layers of the skin Stratum corneum 15 μm Epidermis Dermis Hair follicle 50 μm

6 ICG Fluorescence Mode Imaging Another feature that we looked for in the images was temporary increases in the diameter of pores or hair follicles. The images below are of the same sweat duct before and after treatment. They are not conclusive, but may indicate a slight increase. ~ 5 µm ~ 10 µm Fluorescence 500 µm x 500 µm image at 10µm depth at time 0hr. Fluorescence 500 µm x 500 µm image at 10µm depth after 1hr treatment.

7 Drug Delivery Pathway Lipid bilayers. keratinocyte

8 U-Strip Insulin Patch Physics

9 Cavitation Could Lead To Drug Damage

10 Ultrasonic Massaging Action Effected By Alternating Waveform Enlarges Pore Size Homogenization Skin Transport Sawtooth waveform Square waveform

11 Sonic Waveform Duty Cycles The alternating waveform Duty Cycle means the time in milliseconds the signal is on a particular waveform. Example, U-Strip U insulin delivery is generally 50 msecs on sawtooth followed by 50 msecs on square wave. There is a 2 msec gap between the next sequence. At the start the skin is primed on sawtooth for 30 seconds. The U-Wand, U designed to deliver skin care compounds just under the SC layer, Sub-Dermal delivery, operates with no Priming, and a 80 msec sawtooth,, 20 msec squarewave. The A-Wand, A designed to compounds transdermally, to the dermis, operates with no Priming, and a 20 msec sawtooth,, 80 msec squarewave,, but uses a higher sonic intensity than the U-Wand. U

12 Duty Cycle Comparisons Product Application Delivery Transdermal vs. Sub-Dermal Device Freq. (khz) Intensity (mw/ sq.cm) Skin Priming Sawtooth Wave Duty Cycle msecs Square Wave Duty Cycle msecs Gap Timing Between Next Signal series msecs Insulin Delivery- Humulin Transdermal U-Strip seconds Insulin Delivery- Humalog Transdermal U-Strip seconds Insulin Delivery- Humulin Transdermal A-Wand Betadyne Transdermal A-Wand Capoxone Transdermal A-Wand Eucerin Sub-Dermal U-Wand

13 U-Strip Treated Insulin

14 U-Strip Insulin Patch & U-Wand Engineering A A New Form of TDD Electronics

15 Patch design P Transdermal Delivery Device with Ultrasound Backbone material Semi-permeable film Insulin Sonic membrane Absorbent Peel-away film

16 Absorbent Pad Liberation Factors

17 Patch-Cap

18 Low Profile Transdermal Patch Center absorbent pad holds drug. No Risk of adhesive contamination. Plastic components pass through ultrasound. On/Off Function Rate Control, Limitation Designed for both Low and High molecular weight drugs. Bottom View

19 The U-Strip Transducer Bonding layers Cavity End cap PZT End cap Transducer Delivers alternating sonic waveform: 1/5 the power of a sonic toothbrush, khz at 125 mw/sq. cm intensity

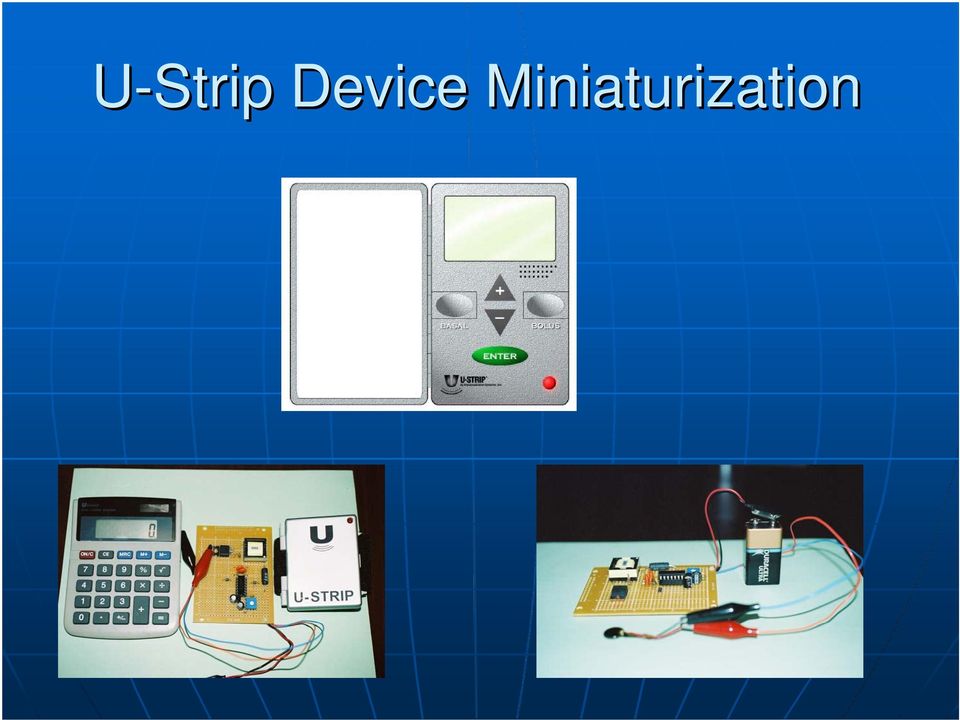
20 U-Strip Device Miniaturization
21 A-Wand
22 A-Wand with Pouch Cap Compatibility: Model No. BKR Pouch-Cap with Foam Border Activation Tab on Cap Activation Receiver on Wand Cap Snap On Tabs Indicator Lamp Activation Control Wand Will Not Activate Unless Proper Cap Is Affixed
23 A-Wand with Pouch Cap Compatibility: Model No. BKR View of Wand Plastic Housing Cross-Section Cap Attachment Transducer Array Block Battery Compartment 9 VDC Battery Wand Housing Circuit Compartment Battery Cover
24 Pouch-Cap Design: BKR Peel Away Film Perforated Film Layer Cream Storage Drum with Sonic Membrane at Bottom Foam Ring Activation Tab Cap Housing Activation Insert
25 Delivery of Copaxone via A-Wand Before After, Note deposition under SC Layer Originally designed for Application of Cosmetics under the skin a new more powerful version, the A-Wand, has demonstrated a match for Sub-Q delivery via hypodermic needle, Non-invasively, for MS
26 U-Strip Insulin Patch Clinical Summary
27 Clinical History in the order they were accomplished HPT-1A: Calibration trial with 5 healthy normal volunteers using saline instead of insulin as a model drug to determine ultrasonic settings. HPT-1B: Calibration trial with 4 healthy normal volunteers. Trial demonstrated ability to deliver 1 unit/hour insulin. Diabetes & Glandular Research Assocs. HPT-3: Skin Irritation study conducted on 25 Type-2 diabetic, males and females, wearing insulin patch on abdomen & upper left arm for 5 hour period. No skin irritation found. KGL Skin Labs. HPT-4: Skin Irritation study conducted on 25 Type-2 diabetic, males and females, of exposure to U-Strip U ultrasound on abdomen & upper left arm for 5 hour period. No skin irritation found. KGL Skin Labs.
28 Clinical History in the order they were accomplished HPT-2A: Comparison study between insulin pump and insulin patch using 6 male type-2 2 diabetics over a 5 hour study period. HPT-2B: Comparison of insulin patch vs. fasting level (no type-2 2 medication) during daytime evaluation to determine which system was more effective in glucose reduction and control. HPT-2C: Comparison of insulin patch vs. type-2 2 medication during night time evaluation to determine which system was more effective in glucose reduction and control. HPT-2D: Comparison of insulin patch vs. type-2 2 medication during daytime evaluation to determine which system was more effective in glucose reduction and control. HPT-5: Confocal imaging of insulin & Dye mixture to determine pathway through the skin using U-Strip. U
29
30 HPT-2 2 Pump Profile Volunteer is placed on Insulin pump/ Continuous Glucometer (Mini-Med Med Paradigm Real time 722 CSII) and a glucose profile with insulin injection is developed. Continuous Glucometer feature of the 722 insulin pump measures glucose readings every 5 minutes. Pump profile was used as a comparison for the U-Strip U patch.
31 Goal-1: Drop the Glucose Level of a Type-2 2 Diabetic to Mild or Safe Range Physiologic Insulin Secretion: 24-Hour Profile Insulin (µu/ml) Basal Insulin 150 Breakfast Lunch Dinner Glucose (mg/dl) A.M. P.M. Time of Day Basal Glucose
32 HPT-2A STUDY SCHEDULE VISIT ACTIVITY 1 Informed consent 2 Medical tests and histories 3 Insulin pump & glucose profile 4 U-Strip system: Max Trial 5 U-Strip system: Max Trial 6 RUN STUDY 7 RUN STUDY NOTES Cellulose Pad, 5-5 hour study Nylon Pad, 5-5 hour study Best Performing Patch Material Low Profile Patch
33 Six Check Points 1. Real Time Glucometer Readings of Patients Serum Glucose Levels: a Real Time Indicator of U-strip U Performance 2. Serum Blood Analysis: Humalog Levels 3. Serum Blood Analysis: C-peptide C Levels 4. Serum Blood Analysis: Glucose Levels 5. Weight Reduction in Transdermal Delivery Device 6. Skin Scans of Test Area.
34 HPT-2 Patch vs. Insulin Pump Volunteer Pump Patch ID Ending Ending Drop % Drop % 1-24% -20% SR 2-43% -21% DD 3-55% -36% FB 4-30% -23% TN 5-27% -14% CD 6-47% -25% PM
35 Vol. 2: Glucose via CSII, Lispro Concentration and C-Peptide C Curves of G L U C O S E, M G /D L TIME, MIN BASELINE, U- STRIP GLUCOSE PROFILE, U- STRIP SYSTEM BASELINE, PUMP GLUCOSE PROFILE, PUMP uu/ml of Insulin Found C-Peptide Values Start Hr-1 Hr-2 Hr-3 Hr-4 Hr-5 Time Interval Start Hr-1 Hr-2 Hr-3 Time Hr-4 Hr-5 Serum Insulin via Pump Serum Insulin via U- Strip Human C- Peptide via Pump Human C- Peptide via U- Strip
36 Serum Blood Analysis: Vol-1 Time Serum Insulin Serum Insulin via Pump via Patch Time Serum C-Peptide Serum C-Peptide via Pump via Patch Start Hr Hr Hr Hr Hr Start Hr Hr Hr Hr Hr Time Serum Glucose Serum Glucose via Pump via Patch Start Hr Hr Hr Hr Hr
37 Vol-1: Comparative 2-hr 2 % Drop in Glucose and C-Peptide C Levels Glucose Glucose via Pump via Patch Starting Hour Drop Drop % 12.4% 16.8% C-Peptide C-Peptide via Pump via Patch Starting Hour Drop Drop % 10.3% 13.3%
38 Glucose Drops Pump vs. Patch HPT-2 Vol-1 Glucose Comparison Pump Vs. Patch HPT-2 U-Strip/Insulin Vol-2 Glucose Comparison Pump vs Patch HPT-2 Vol-3 Glucose Comparison Pump vs. Patch Glucose (mg/dl) Time in Hours CGMS Baseline Glucose CGMS on Pump Patch Baseline Glucose on Patch Glucose (mg/dl) Time in Hours CGMS Baseline Glucose CGMS on Pump Patch Day Baseline Glucose on Patch Glucose (mg/dl) Time in Hours CGMS Baseline Glucose CGMS on Pump Patch Baselin Glucose on Patch HPT-2 Vol-4 Glucose Comparison Pump Vs. Patch HPT-2 Vol-5 Glucose Comparison Pump Vs. Patch HPT-2 Vol-6 Glucose Comparison Glucose (mg/dl) CGMS Baseline Glucose CGMS on Pump Patch Baseline Glucose on Patch Glucose (mg/dl) CGMS Baseline Glucose CGMS on Pump Patch Baseline Glucose on Patch Glucose (mg/dl) CGMS Baseline Glucose CGMS on Pump Patch Baseline Glucose on Patch Time in Hours Time in Hours Time in Hours
39 HPT-2B U-Strip U vs. Fasting Glucose Vol.4 Vol Glucose (mg/dl) Fasting U-Strip Glucose (mg/dl) Fasting U-Strip Time (min) Time (min) Vol Metformin X X X X X Avandia X X X X Exubera X Byetta X
40 HPT-2C U-Strip U vs. Medication Night Time Comparison Vol.-5 Vol Glucose (mg/dl) Medication U-Strip Glucose ( m g /d L ) Medication U-Strip Time (min) Time (min) Vol Metformin X X X X X Avandia X X X X Exubera X Byetta X
41 HPT-2D U-Strip U vs. Medication Daytime Comparison Vol.-5 Vol Glucose (mg/dl) Day Medication U-Strip Glucose (mg/dl) Day Medication U-Strip Time (min) Time (min) Vol Metformin X X X X X Avandia X X X X Exubera X Byetta X
42 Lispro Blood Concentration, uu/ml Pump Vs. Patch Time, hr SR Vol-1 DD Vol-2 FB Vol-3 TN Vol-4 CD Vol-5 Mean Vol / / / / / /
43 Lispro Blood Concentration, uu/ml after Transdermal USTRIP Time, hr SR DD FB TN CD Mean Baseline
44 Conclusions: The U-Strip U effected a better reduction in glucose within the first two hours of the study - at a rate faster (8.5mg/dl/hr) than for the insulin pump (6mg/dl/hr) The U-Strip U was superior to the pump in suppressing endogenous insulin production within the first 2-hour 2 period (higher % C-C peptide drop/hr). See Table 5. An important advantage offered by U-Strip U is that a better degree of the intracellular drug uptake may be achieved at a substantially lower drug concentration in the blood. In comparison to oral meds for Ty-2 s s the U-U Strip was more reliable in both daytime and night time glucose control.
45 Range of Molecular Size Passive TDD Requires Assistance U-Strip Capable Range Unknown Insulin rpa tpa Up to 500 Da Up to 1000 Da 6000 Da 36 kda 75 kda Greater than 125 kda Molecular Size U-strip Is Theorized to Be Capable of Delivering From 0 to 125,000 Mol Wt. Compounds
46 Non-Invasive Insulin Delivery