The State of Business Development Services. By Elaine Edgcomb and William Girardo
|
|
|
- Joseph Collins
- 8 years ago
- Views:
Transcription
1 The State of Business Development Services By Elaine Edgcomb and William Girardo May 2012

2 Funded in part through a grant award with the U.S. Small Business Administration. All opinions, conclusions, or recommendations expressed are those of the authors and do not necessarily reflect the views of the SBA. Additional support is provided by the C.S. Mott and Citi Foundations. Copyright 2012 by FIELD, Microenterprise Fund for Innovation, Effectiveness, Learning and Dissemination Published in the United States of America 2012 by the Aspen Institute All rights reserved Printed in the United States of America ISBN:

3 The State of Business Development Services By Elaine Edgcomb and William Girardo May 2012 FIELD The Aspen Institute One Dupont Circle, NW, Suite 700 Washington, DC

4

5 Introduction The U.S. microenterprise development field has always been a field that is microfinance plus. Since the first survey of the field, conducted by the Aspen Institute in 1992, it has been clear that the majority of individuals assisted by microenterprise development organizations (MDOs) receive training, technical assistance, coaching, mentoring and a whole array of other services that can collectively be called business development services (BDS), or services designed to help an aspiring entrepreneur start, sustain or grow his business. These services are offered both by microlenders and by organizations that specialize in nonfinancial assistance. In some instances, entrepreneurs may come seeking loans, but find that they need help in improving their credit, or their business fundamentals, before they can access financing. In many other instances, aspirants come specifically seeking the knowledge and skills that can help them achieve the success they desire. This report documents the scale and scope of this business development service work by U.S. MDOs as of It draws on data collected in both the 2010 and 2008 U.S. Microenterprise Censuses (implemented by FIELD at the Aspen Institute) to describe the characteristics of this work and how it has changed over the last two years. It also examines the characteristics of large-scale programs providing business development services and how they differ from smaller-scale programs. The difference in characteristics is important to note as increasing demands are placed on the field in the face of the continuing effects of the Great Recession. As the report will show in greater detail, the data describe an industry spread across the United States that in aggregate appears to be reaching more aspiring entrepreneurs each year. It also describes an industry that survived the first two years of financial crisis and economic challenge, and that, while remaining the same in many respects, has changed in some critical ways. Among the key findings that the report will explore are these: The size of the overall field appears to be growing. The 2010 census identified over 800 MDOs, of whom 366 completed surveys, and 356 reported that they provided business development services to their clients. This is 90 more than reported providing BDS services in Over half of them may have been too young to report a full year of data in the previous census. With funding from the U.S. Small Business Administration s PRIME (Program for Investment in Micro-entrepreneurs) program, FIELD at the Aspen Institute is exploring how microenterprise development organizations can scale up their business development services in order to serve many more microentrepreneurs, and serve them more effectively. This is the second report that examines the scale and scope of the field with respect to business development services, and explores the factors that appear to support large-scale programs. Other studies in this research initiative describe the strategies and experience of large-scale service providers, and offer scans of practice, case studies and other materials on specific approaches including financial education and credit building, distance-based services and access to markets brands strategies. These materials can be accessed at: ScalingBiz.html. 1

6 The number of individuals assisted appears to be growing as well, although the trend data suggest that the increase in the count of individuals assisted (from 61,833 in 2008 to 110,791 in 2010) may have as much to do with the increase in the number of survey respondents, and the new entrants to the field, as it does to growth in individual organizations. 1 The 2010 census found more large-scale MDOs that is, organizations serving 500 or more individuals with business development services than it did in There were 38 that met this criterion in 2008 and 46 in These numbers reflected some churn in the industry, with some institutions growing over two years to join this cohort and others declining in numbers served. In addition, there were a number of institutions that did not report in one year or the other making a full analysis of the trend difficult. The distribution of service across the field reflects the rule: about 20 percent of the programs serve roughly 80 percent of all the individuals assisted with business development services. This type of bifurcation is not new, but reflects a field that has always been, and remains fairly, a homegrown industry with local supporters serving local communities. This reality has always raised the question: what factors enable some institutions to grow larger than the norm, and what can other organizations learn from the experience of these larger-scale providers? This report will look at how the target market, service model, program age, institutional structure, and revenue streams may influence program scale. Despite the challenging context between 2008 and 2010, the field as reflected by those institutions that reported data held its own financially. The mean and median operating budgets reported in 2008 and 2010 were close in size and trend data from a smaller group of institutions reporting in both years support this finding. Budgets were sustained by federal funding and, for some, an increase in earned revenues helped. In aggregate, federal dollars represented the largest source of funding for operating budgets in 2010, whereas in 2008, private philanthropy exceeded federal support. Trend data also indicated that for many organizations, earned revenues also increased, compensating for reductions in private funding, as well as in state and local support. These findings reflect the dynamic funding environment that affected the industry in the wake of the financial crisis. The compensatory financing that MDOs were able to generate from federal sources and earned income enabled them to maintain and, in many instances, add services. As a consequence of this budget support, although the number of hours of service provided to individuals ticked up only in a few organizations, MDOs appeared to be offering more types of assistance. The number of organizations providing training, technical assistance, coaching and mentoring, financial literacy, credit counseling, business incubation and tax preparation all increased, although most by small amounts. The increasing diversification of services likely reflects an effort to respond to the changing needs of clients facing the economic downturn, more of whom 1 A change in metric may also influence these results. The 2008 census asked for the number of individuals receiving training and technical assistance services. The 2010 census asked for the number of individuals receiving business development services. Although some organizations may have interpreted these terms synonymously, others may have omitted counts of individuals receiving other forms of assistance such as mentoring and coaching, access to markets services, tax preparation and so on in their 2008 responses. 2

7 were arriving at MDO doors with credit issues or the desire to explore business in the face of a daunting job market. The report that follows has three parts: Part 1 will explore the key findings from the analysis of both the 2008 and 2010 census in greater detail. Part 2 will lay out the key findings from the 2010 census. Part 3 will compare large- and small-scale MDOs to better understand the factors that influence scale. 3

8 The U.S. Microenterprise Census data can be found at a web portal to data on the microenterprise field. MicroTracker contains listings of over 800 organizations offering microenterprise services, detailed profiles on 366 of them, predefined data reports, and data tools that enable users to develop customized reports that answer questions regarding the scale, scope, finances, and performance of the field. Nonprofit MDOs can find the site useful for benchmarking performance against their peers. Funders can find it helpful in identifying potential partners as well as monitoring grantees. Researchers and others interested in the industry can find a rich source of data. Complete census results are available on the site for both 2008 and Data collection for 2011 is underway. Part 1: The Evolution of Business Development Services The years since the start of the financial and economic crises have been turbulent ones for small and microbusinesses, and for the microenterprise development organizations that seek to support them. Although most attention has been focused on the credit crisis and how microlenders responded by extending credit to more businesses in need, the changed context also had implications for business development services. As more microentrepreneurs needed help surviving the downturns in their markets, and as more unemployed considered self-employment as a jobs strategy, MDOs needed to find ways to be responsive. In addition, economic turbulence had funding implications for many MDOs and increased the challenge of raising the funds needed to serve their traditional clientele and more. This section of the report will lay out how MDOs fared in providing business development services from 2008 to What changed? What remained the same? And where did this leave the field two years after the start of these hard times? The findings in this section are drawn from analyzing data submitted to FIELD by MDOs in response to the 2008 and 2010 U.S. Microenterprise Census. The census is an industry-wide survey that attempts to identify all organizations across the United States providing microenterprise services, and to collect detailed, descriptive data from as many of them as possible. That data describes the scale and scope of program services, along with basic organizational information on staffing, structure, funding, and target markets. Census data capture key information on both microfinance and business development services, and this report will focus on the data related to that second type of service. The data offer a set of insights about the work of helping aspiring entrepreneurs sustain and grow their businesses. The number of institutions offering business development services appears to be growing. The 2010 census identified over 800 MDOs, of which 366 completed surveys, and 356 reported that they provided business development services to their clients. In 2008, 266 MDOs of 369 programs that completed surveys indicated that they offered business development services. The 2010 respondents include 30 programs whose start dates were in 2009 and 2010, and an additional 18 that launched in 2008 and may not have had a full year of activity before the 2008 census. Together, 4

9

10 complex: while some institutions grew, others clearly struggled. But, with the addition of new institutions providing services, more of the market appears to have been served. The 2010 census found more large-scale MDOs that is organizations serving more than 500 individuals with business development services than it did in There were 38 that met this criterion in 2008 and 46 in These numbers reflected some churn in the industry. Twelve institutions that were in the 500 plus club in 2008 were still in the club in Eight institutions grew into this category since Six that were in the 2008 club declined in the number of individuals they served and no longer made the cut off. The rest either did not respond to this question in 2008, or did not appear in the 2008 data set at all. In any case, the large-scale BDS providers in the 2010 data set are a substantially different group of organizations than appeared in the 2008 data set. The median and mean number of individuals served by this group was 1,040 and 1,854 respectively, as compared to 921 and 1,169 in This means that the large-scale BDS providers reporting in 2010 are 59 percentage points larger, on average, than those reporting in The median number of individuals served is also 13 percentage points higher than in Although the percent of large-scale institutions still remains small in the industry, there appears to be more of them than observed in the previous census results, and they serve more individuals than those that reported two years earlier. 3 The distribution of service across the field reflects the rule. About 20 percent of the programs serve roughly 80 percent of all the individuals assisted with business development services. This type of bifurcation is not new. The 2008 data revealed fairly similar results. If anything, the 2010 data suggest an even higher concentration of effort in the field. In 2008, the largescale BDS providers represented 21 percent of all MDOs that provided data on the number of individuals served, and they served 72 percent of all reported individuals. In 2010, the large-scale BDS providers represented 19 percent of all reporting MDOs, and they served 77 percent of the total population served. This stratification reflects a field that has always been, and remains, a fairly home-grown industry with local MDOs serving local communities, often with funding that is relatively local as well. This reality has always raised the question: what factors enable some institutions to grow larger than the norm, and what can other organizations learn from the experience of these larger-scale providers? Part three of this report will look at the how target market, service model, program age, institutional structure, and revenue streams may influence program scale. 3 There also may be more organizations that merit inclusion in the 500 plus club. There are several MDOs that reported serving more than 500 individuals overall, but that did not respond to the question asking how many of their assisted individuals were recipients of business development services. So the number 46 should be considered the lower bound for MDOs in this category. 6

11 Figure 1: Distribution of Service across the Field Large-scale MDOs All other MDOs Individuals served by large-scale MDOs Individuals served by all other MDOs Despite the challenging context between 2008 and 2010, the field as reflected by those institutions that reported financial data held its own financially. Using 2010 dollar values, the median reported operating budget in 2008 was $271,934 and, in 2010, it was $278,000. The mean was $525,048 in 2008 and $530,741 in 2010 (162 MDOs provided data in 2008; 214 provided it in 2010). Trend data on 69 MDOs reporting in both years support this finding. Again, using 2010 dollar values, the median operating budget increased from $278,517 in 2008 to $325,650 in And, the mean operating budget increased from $586,408 to $653,597. Figure 2: Operating Budgets in 2008 and 2010 $700,000 $600,000 $500,000 All Reporting MDOs Trend Group $400,000 $300, $200,000 $100,000 $0 Median Mean Median Mean 7
. Trend data on 69 MDOs reporting in both years support this finding.")
12 Budgets were sustained by federal funding and for some, an increased reliance on earned revenues. In 2008, 162 organizations reported that private philanthropy was responsible for 31 percent of their budgets and federal support was responsible for 28 percent. In contrast, in 2010, 192 MDOs reported that private philanthropy covered 23 percent of operating budgets and federal support represented 37 percent of their budgets. A trend group of 61 MDOs reporting both years indicated that private philanthropic dollars decreased from covering 27.6 percent of their operating budgets in 2008 to 19.3 percent in The actual dollars declined by almost $1.5 million over the two year period. In contrast, federal support rose from 30 percent to 39.2 percent of operating budgets, and dollars increased by $4.4 million. The trend group also reported reductions in state and local support and an increase in earned revenue from 17 percent in 2008 to 23.3 percent in These findings reflect the dynamic funding environment that affected the industry in the wake of the financial crisis. As the stock market tumbled, foundations experienced drops in their endowments, which reduced their capacity to fund, and the federal government stepped in with emergency funding to support the recovery. In addition, as many microlenders increased their lending responding to the needs of entrepreneurs locked out of mainstream markets, their earnings from interest and fee income also increased. Figure 3: MDOs Reporting Sources of Funding Both Years (Trend Group) N = % 40.0% 35.0% 30.0% 25.0% 20.0% 15.0% 10.0% 5.0% 0.0%

13 And, surprisingly, although the number of hours of service provided to individuals ticked up only in a few organizations, MDOs appeared to be offering more types of assistance. The number of organizations providing training, technical assistance, coaching and mentoring, financial literacy, credit counseling, business incubation and tax preparation all increased, although most by small amounts. The greatest percentage increases were in those offering training (11 percentage points), credit counseling (7 points), coaching and mentoring, and tax preparation (each 6 points). The increasing diversification of services likely reflects an effort to respond to the changing needs of clients facing the economic downturn, more of whom were arriving at MDO doors with credit issues or the desire to explore business in the face of a daunting job market. Figure 4: Percent of BDS Services Offered by MDOs Reporting in Both 2008 and % 90% 80% 70% 60% 50% 40% 30% 20% 10% 0%
, credit counseling (7 points), coaching and mentoring, and tax preparation (each 6 points).")
14 Part 2: Key Findings from the 2010 Census This section will summarize the key findings from the 2010 census, offering an aggregate picture of those microenterprise development organizations that reported providing business development services to individuals that year. The findings provide a more detailed look at the state of business development services as practiced across the industry. Because 97 percent of all reporting organizations indicated that they offered business development services, these services touch the majority of individuals assisted in programs across the U.S. BDS Organizations, Their Age and Geographic Location The organizations that provide business development services are varied in their institutional form. Some are institutions whose sole purpose is to provide microenterprise development assistance. Many others are embedded in organizations with broader missions. They include community development finance institutions that provide financing and technical assistance for multiple purposes; educational and human services organizations; place-based community development corporations; and others. The survey captured data from all these types of institutions. Three hundred and sixty-six organizations responded to the 2010 U.S. Microenterprise Census, and, of that number, 356 indicated that they provided some form of business development services. Within that number, 285 organizations identified themselves as having a separate microenterprise development program within their structure, suggesting that 74 percent of institutions offering BDS services represented organizations with broader missions. Some organizations consider business development services their lead service for microenterprise development. Others are credit-led institutions that offer business development services as a complement to their financing. 4 It is important to keep that breadth of institutional form in mind when reviewing the data. The 356 reporting organizations also varied in age. Among those that reported their starting year (n = 319), 74 programs are young programs, starting in 2006 or later; 53 programs are experienced, that is they started between 2001 and 2005; and 192 programs are mature, that is, they started before The oldest program reported starting in Two reported starting in the 1960s; ten in the 1970s; and 37 in the 1980s. The 1990s saw the industry take off: 129 reported starting in that decade, which corresponded to a period of great support for the microenterprise movement from the federal government, complemented by strong philanthropic interest. Another 141 reported start dates of 2000 or later, and 48 of them started in the last three years, indicating the continuing power this strategy holds for institutions concerned with poverty alleviation, job creation and community economic development. 4 For ease of reference, all organizations that offer business development services as part of their portfolio will be called BDS organizations in this paper. However, it is important to keep in mind that a number of them would not be characterized as that by their leadership. 10

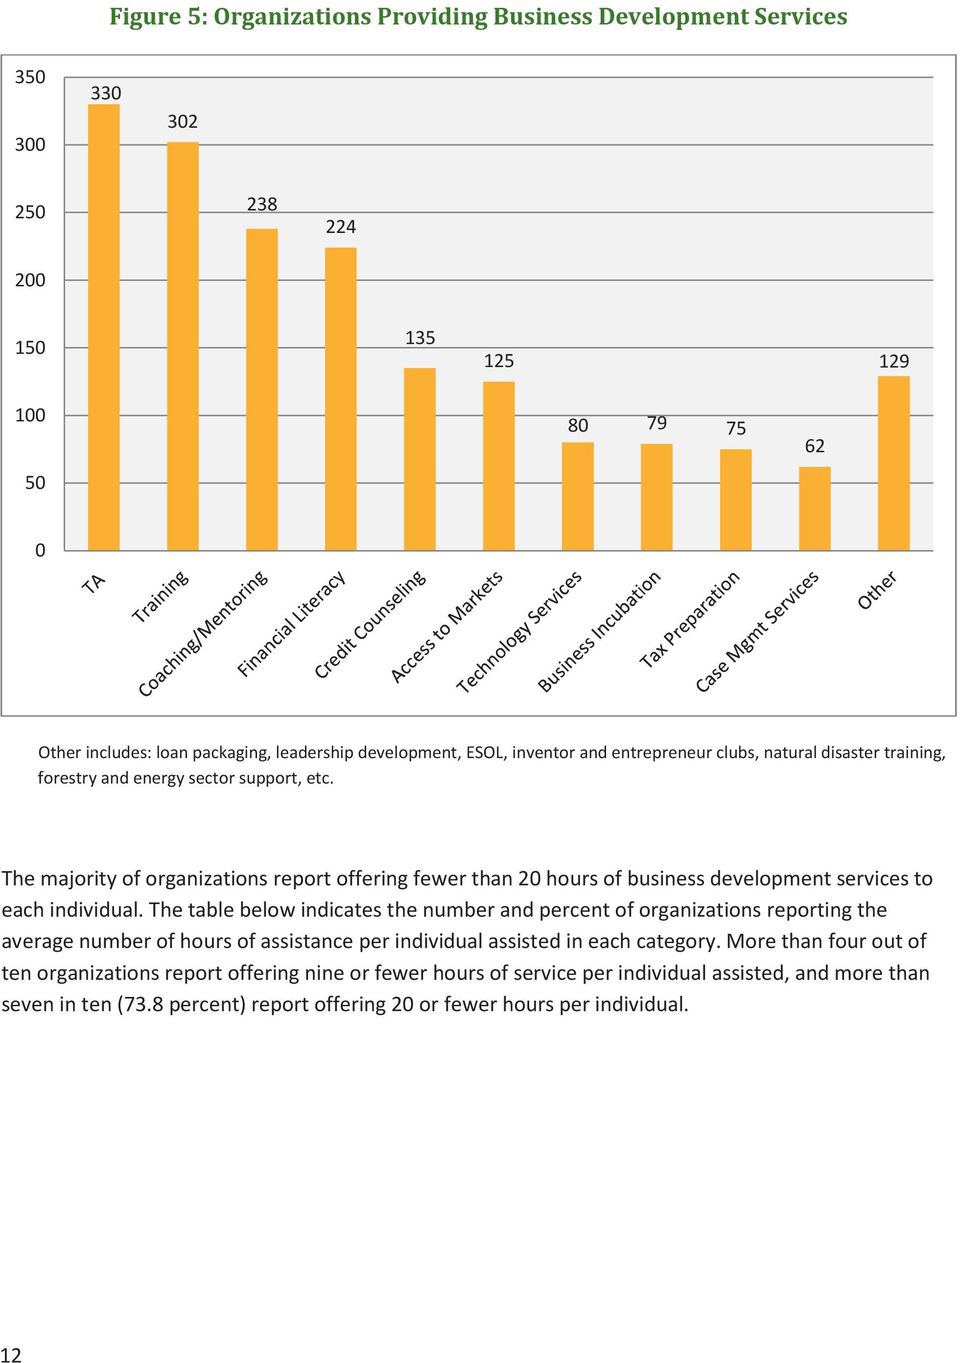
15 More than half (57 percent) report serving urban areas and almost half (48.3 percent) report serving rural areas. Sixty-four organizations (18 percent) report providing services statewide, and only 23 organizations (6.5 percent) serve individuals in multiple states. The states with the largest number of business development service providers among the survey respondents are: California: 42 providers Oregon: 29 New York: 26 Georgia: 17 Nebraska: 16 Pennsylvania: 16 Ohio: 15 Minnesota: 14 Washington: 13 Individuals Served with Business Development Services The majority of these programs are small. The survey asked respondents to report the total number of individuals assisted with business development services in 2010, including anyone who received any level of service from the organization. 5 Two hundred and thirty-seven organizations answered that question, and for that group, the median number of individuals assisted was 115; the mean was 467. The range was from 1 to 17,487. In all, these organizations reported providing business development services to 110,791 individuals. BDS Services Business development services organizations provide a large number of services. The chart below shows them in order of their prevalence: 5 FIELD, under its performance measurement project, MicroTest, asks organizations to distinguish between participants, those who receive any level of service, and clients, those who receive a microloan or other financing product, or who receive a substantial amount of service in a year. While MDOs define substantial in terms of their own program offerings, the rule of thumb is ten hours or more in a given fiscal year. The survey did not ask respondents to classify assisted individuals in this way. Therefore the number should be understood as including individuals receiving all levels of service from the most limited to the most comprehensive. 11

16
17

18 The median earned revenue was $39,404, with almost 40 percent reporting no earned revenue at all. The mean was $146,746, and the range was from $50 to $3.6 million. The median percent of budget covered by earned revenue was 3 percent and the mean was 11.2 percent across the whole group (114 MDOs reported their funding sources). For those that reported having earned revenues, the median was 12 percent and the mean was 23 percent. Social Enterprise Microenterprise development organizations that offer financing earn revenues through interest and fee income that partly cover their operating costs. To that end, microfinance is a social enterprise. In addition, twenty-nine organizations (8.1 percent of the group) reported having other social enterprises, which were defined as business ventures designed either for a social purpose producing direct benefits for clients and generating financial returns to cover their costs or earned income operations designed to provide revenue to support general program operations. The mean earned revenues for those organizations (n = 16) was 30.7 percent, and the median was 23.5 percent. The range of earned revenue for these organizations was from 1 percent to 60 percent. The data is not sufficient to determine the relationship of that earned revenue to the specific enterprise that generated it. It does, however, appear that organizations with social enterprises tend to have more earned revenue than others in the industry, perhaps indicating a more revenue-focused sustainability strategy overall. Within the field, social enterprise is a small component of program strategy, and in most cases, the role of social enterprises in generating adequate revenues to sustain organizations is currently limited. 14

19

20

21 Figure 7: Percent of Large- and Small-Scale BDS Organizations Providing Services 100% 90% 80% 70% 60% 50% 40% 30% 20% 10% 0% Large-Scale BDS Small-Scale BDS Other includes: loan packaging, leadership development, ESOL, inventor and entrepreneur clubs, natural disaster training, forestry and energy sector support, etc. This suggests that growth has come for these organizations, not just by extending core products and services, but by adding services to their program. Growth, in part, comes from aggregation, rather than massification, of services. This type of growth is more challenging as it requires adding new capacities, and sometimes structures, to deliver the new services. Investments in technology, incubators, and access to market services, in particular, demand substantial resources to do well. At the same time, large-scale organizations tend to offer fewer hours of service than small-scale organizations. The table below compares these institutions. The majority of large-scale providers report offering nine or fewer hours of services to clients, whereas a third of small-scale organizations offer between 10 and 20 hours, and another 26 percent offer 21 hours or more. This is not surprising as the large-scale group includes some high-volume microlenders that provide technical assistance in conjunction with microloans, and small business development centers and women s business centers that serve many individuals with short-term services. It does not mean that intensive services are not offered to some individuals; it does mean that the individuals engage with the programs at different levels of intensity depending on their interests and needs, and that such participation may vary over the length of their connection to the MDOs. Because large-scale organizations offer many options, they may also offer varying degrees of interaction to program participants. 17
22
23
24
25 Conclusion The 2010 U.S. Microenterprise Census results offer an interesting window into the evolution of the U. S. microenterprise development field with respect to business development services. As earlier sections have indicated, despite challenges, the number of individuals assisted appears to have grown. At the same time, the data indicate that only a small number of MDOs have developed programs that are reaching large numbers of aspiring entrepreneurs. Within the field, reaching more than 500 individuals a year with BDS training and technical assistance still places an organization among the largest. Only 46 organizations out of 356 respondents reported serving at least that many in Within that group, the range was substantial. Twenty-seven, or just less than 60 percent, served over 1,000 individuals, and the largest organization actually a state-based Small Business Development Center (SBDC) network -- reported that it provided services to 17,487 individuals. These data illustrate the scale that the nonprofit field has reached and the concentration of scale with respect to business development services. The data also suggest several factors that have influenced the scale of organizations: geographic target market appears to matter, as does organizational age. The capacity to mobilize external resources year after year also appears critical as earned revenues are a small portion of organizational budgets. In addition, it seems that large-scale organizations have grown not only through extending core services to more individuals but also through integrating more types of services within their portfolios. This suggests the increasing complexity of organizational structure and strategy that accompanies growth. In addition, 29 of them 63 percent of the group also offer microloans. Finally, the data indicate the challenges that institutions face in underwriting the cost of services. Earned revenues play a limited role in financing relatively large annual operating budgets, and most organizations implement their services with modest staff sizes. This requires them to be highly efficient within structures attempting to offer a large array of products and services. Examples of how these large-scale organizations address these challenges, and how they continue to grow, can be found in the four short cases that are included in the Appendix to this report. In addition, these questions are further explored in other studies produced by FIELD, and will be a continuing focus of research under FIELD s PRIME-funded body of work. Interested readers can find this work at: 21
26 Appendix Appalachian Center for Economic Networks (ACEnet): Growth through Specialization ACEnet is a community development corporation, based in Athens, Ohio, that has worked since 1985 to support the development of a healthy and vibrant economy in the counties of Appalachian Ohio. Early in its development, ACEnet worked with worker-owned cooperatives, and in 1991 launched its first business incubator program with two mixed-use facilities. Soon afterward, ACEnet launched the sectoral or industry-focused network and service approach that remains its focus today, and for which it has become nationally recognized. In 2010, it reported serving 1,216 individuals on a budget of $743,528. It is a lean organization that attempts to be highly efficient while offering a suite of products and services that range in level of engagement with the participant. In this respect, it is similar to many other high-volume business development services organizations that calibrate their offerings to the needs and commitment level of the entrepreneurs and aspiring entrepreneurs that it serves. ACEnet is best known for its work in the food sector and, in particular, for its work to connect food producers to larger regional and national markets. It has worked to build producers capacity to develop market-ready food products through training, technical assistance and incubator services that include access to shared equipment, product testing, marketing assistance, and other support. It has also worked to increase market share for these entrepreneurs products by creating and facilitating two brands, Food We Love and The 30 Mile Meal. The first promotes a line of locally-produced specialty food products by executing a marketing campaign using an umbrella brand and opening doors to 30 regional stores. It is not a retail store brand but a marketing tool to encourage people to buy more from local farmers markets, to patronize local restaurants that feature menus created from local ingredients, and to generate tourism around visits to Athens and its surroundings focused on food festivals and other promotions. As ACEnet has grown, it has incorporated work in product development, product placement, marketing and consumer education, and quality control. Collaborating with strategic partners, it has worked to improve the food value chain for local producers at almost every key point in the system: 22
27 ACEnet has also demonstrated the entrepreneurial characteristic associated with large-scale business development services providers. In 2010, it generated 62 percent of its budget through earned revenue. The majority of that revenue results from incubator fees paid by participating entrepreneurs in both of its incubators, which, in addition to food production facilities, offer space for offices, light manufacturing and warehousing. ACEnet also charges clients fees for its in-person and distance training. It generates contract revenue from other regional organizations that hire it to provide training services and also offers consulting services to institutions interested in learning from ACEnet s experience with kitchen incubation, regional flavor and brands strategies. Its newest effort to both expand the reach of its strategy and generate more earned revenue focuses on the development of a replication model for its brands strategies. The model is being developed and tested in conjunction with the Athens Visitors Bureau (with which it has partnered for The 30 Mile Meal). ACEnet has come to the conclusion that its own brands work will only partially cover its cost, but that its intellectual capital can be mined more effectively than it has in the past. Other large-scale organizations have similarly leveraged their intellectual capital for revenue generation, and have found that this income has value in increasing and diversifying earned revenue streams. It requires analyzing each service as a line of business and assessing it in terms of its value to both clients and to the organization, and developing earned revenue strategies that work for both. The challenge is to do this without stretching staff too thin; and ACEnet, already thinly staffed for an organization with so many clients, will have to think through how this can support and not diminish its core work. Its use of distance learning tools to reach large numbers of individuals economically has been one approach to managing time and resources that other organizations have also tried. 23
28 A final characteristic that ACEnet demonstrates, which is also found in other scaling business development services organizations, is its willingness to innovate, test and discard as needed, over and over again. The components of its access to markets strategies have undergone multiple iterations over the years. It shelved its work with artisans when its brand strategy for this sector (Art of Ohio) did not exhibit the same early success as its food strategies had. And it has been actively exploring different approaches to social media and distance learning strategies as it seeks to reach and engage ever larger numbers of producers in a community capable of producing strong economic development results. Knowing that its value increases with the number of engaged entrepreneurs it can marshal and support, scaling is an essential part of its DNA. More detailed discussions of ACEnet s brands strategies and earned revenue strategies are available: For more on brands, see Using a Brands Strategy for Scaling Business Development Services: A Case Study of the Appalachian Center for Economic Networks, For more on how ACEnet envisions its work in the food value chain, see AceNet Food System Value Chain, For more on its earned revenue strategies, see Building Sustainability by Increasing Earned Revenue, 24
29 The Entrepreneur Fund: An Entrepreneurial Approach to Institutional Growth The Entrepreneur Fund in northern Minnesota (and also serving northwest Wisconsin) is a multidimensional entrepreneurial development program whose name only suggests part of what the organization does. Although lending is what the name connotes, in fact the organization provides training, consulting and financing to emerging and small businesses. In 2010, it reported serving 636 microenterprise development clients on $585,000 in program expenses. Its overall operating budget, however, was $2 million. In addition to serving microentrepreneurs, the organization offers services to small business owners. The Fund demonstrates the characteristic of innovation that many high scale business development organizations demonstrate. More than ten years ago, in 1998, the Entrepreneur Fund developed the CORE FOUR Business Planning Course, a curriculum based on its years of experience training individuals interested in starting their own business. The Fund now trains and certifies other organizations to use the course, and it has been widely adapted in the industry. In addition, it has found markets in community colleges, technical schools, chambers of commerce, economic development agencies, and others. More recently, in 2008, it launched the Greenstone Group, which was designed to develop growthoriented entrepreneurial talent in the region using an entrepreneurship development systems approach, a strategy pioneered by a number of rural organizations across the country. The systems approach focuses on both the demand side of entrepreneurial development-- that is, nurturing entrepreneurs with individual and group coaching, and opportunities for networking-- and on the supply side by working to coordinate the array of resources (financial and technical) that entrepreneurs need at different stages of their evolution. The organization raised funds for a ten-year commitment to this initiative. (More can be learned about entrepreneurial development systems at and at The addition of this initiative also demonstrates the way other high-scale business development services organizations have grown, less by massifying one product or service, and more by adding services that meet the needs of different types of entrepreneurs. In this case, the Greenstone Group responds to the growth-oriented end of the continuum, while CORE FOUR meets the needs of the pre-start up or early stage business. The Fund also demonstrates the entrepreneurial approach that many high-scale business development organizations manifest as they seek to sustain their programs. In 2010, the organization generated 22 percent of its overall budget through earned income. Those revenues came from: 25
30 Interest on loans $ 245,000 Interest on idle funds 2,000 Program fees (training, loan fund, and Greenstone Group participant fees) CORE FOUR workbook sales and instructor training (gross revenues) 50, ,000 Miscellaneous 18,000 Total $ 430,000 This list of sources demonstrates the role that microloans play in generating income. This income represents 57 percent of all earned revenues. High volume microlenders that provide technical assistance as part of the loan process are among the largest business development services providers as well, although they tend to offer fewer hours of service than other organizations that focus more intensely on business development. The list also demonstrates how smart organizations have been able to capture value from their investment in tools and materials from which other organizations can benefit. The CEO of the Entrepreneur Fund also noted that, We continue to contemplate/plan for more changes in the business model as funding streams change, shift, alter. The learning never stops. Since its start in 1989, it has experienced a number of these changes as it has worked to deepen its impact in its region, and this statement reflects the continued focus on the importance of business model innovation as it looks ahead. 26
31 WESST: A Complex Organization WESST describes itself as a statewide small business development and training organization committed to growing New Mexico s economy by cultivating entrepreneurship. Founded in 1988, it offers services and loans specifically targeted to low-income women and minorities, although it has grown over the years to include options for aspiring entrepreneurs of all backgrounds. The organization demonstrates several of the characteristics of large-scale business development services, as observed in the data. It is 24 years old and has a staff of 28. In 1994, it expanded from one location in the capital to include six Enterprise Centers in Albuquerque, Rio Rancho, Santa Fe, Las Cruces, Roswell, and Farmington. Its operational expenses in 2010 were $2.2 million. The organization has grown not only geographically, but also by adding services. Over time it has developed a continuum that meets the needs of businesses at every entrepreneurial stage, as the chart below indicates. In 2009, it opened a mixed-use business incubation facility in Albuquerque, which also serves as the organization s headquarters and hub for all services in that target market. And, most recently, it is adding a digital media studio, a 1,000 square-foot facility that will allow WESST to stream business classes to its other enterprise centers and to create distance learning content. In addition, WESST expects to generate revenue from leasing the studio to advertising and marketing firms, game developers, app creators, and independent filmmakers. WESST secured funding for the studio from 27
32 Comcast Cable Company, which, as part of an agreement with the State of New Mexico struck during franchise negotiations, has provided $200,000 for capital improvements and another $200,000 for inkind use of its airwaves. Like most business development organizations, WESST raises subsidy for the majority of its over $2 million dollar budget. Its president is an effective fundraiser, and the institution has been able to generate substantial federal support, especially from the U.S. Small Business Administration s Office of Women s Business Ownership. It also secured federal, state and local financing for its Albuquerque Enterprise Center. Earned revenues represented five percent of its operating budget in 2010, generated primarily from incubator and training fees. Like other high-scale business development services organizations, it seeks to be entrepreneurial in the use of its resources. To that end, it expects to generate more revenue in the future through the addition of more tenants to the incubator, and leasing the media studio to individuals and small companies. In addition, it has created a Pay It Forward Campaign targeted to current and former WESST clients who have benefitted from WESST services. Solicited clients are being asked to contribute to WESST, so that WESST can help the next round of would-be entrepreneurs. Videos of client endorsements are available on its website, 28
33 Wisconsin Women s Business Initiative Corporation: Generating Earned Revenues from Multiple Streams Wisconsin Women s Business Initiative Corporation (WWBIC) is a statewide organization that combines business development services and microfinance, and runs a unique social enterprise, Coffee with a Conscience, a café that sells Fair Trade coffee and specialty food products created by its clients. Like other large-scale business development service providers, it offers a suite of products: two business planning courses, short entrepreneurial training workshops, financial education classes, and one-on-one technical assistance. The organization also has a growing microloan program and an individual development account program as well. In 2010, it served 2,790 individuals and reported operating expenses of $3.7 million. Its earned revenue was 16 percent, which was over five times the median for all business development services organizations reporting that year (3 percent was the median). In 2011, its earned revenue increased to 19 percent. The largest revenue-producers were the interest and fees paid on its microloan portfolio (42 percent), although the café was close behind (40 percent). Like many large-scale microenterprise organizations, much of its one-on-one technical assistance is provided within the context of the loan process. As the loan program has grown, so has this component of its earned revenues. But the organization is very entrepreneurial, and it seeks revenue opportunities in a variety of places: Training fees: The 14-week business planning course costs $300, and individual workshops range from $15 to $30 for each. A sliding scale based on ability to pay ensures that low-income individuals can access all services, and many individual workshops are offered at no cost. Each quarter, approximately 97 percent of WWBIC s education clients take a no-cost workshop or receive a reduced-fee scholarship. Coffee with a Conscience generated $339,000 in revenues and a net profit of $50,000 in 2011, all of which was used to cover WWBIC s operational expenses. The café has been in business for 16 years and organizational leadership reported it took 10 years to reach past breakeven. Consulting fees: Senior WWBIC leaders offer train the trainer workshops, strategic planning consulting and capacity building services to smaller nonprofits seeking to learn from its experience. Interest on loan funds also add to overall revenues. WWBIC s CEO notes that, in the microenterprise field, You have to be scrappy. Earned revenues enable you to be in control of your own destiny, and this is important in today s context. At the same time, she and the management team think that the organization s sustainability strategy will always depend on a combination of subsidy and earned revenue, and they aim for diversification in their sources. In 2010, the organization had the following distribution of revenues: 29
34 Although half the budget was supported by federal sources, there were multiple streams within that category that the organization tapped. They included the U.S. Small Business Administration, the U.S. Treasury CDFI Fund, Community Development Block Grant funding, Department of Health and Human Services funding, and support from the U.S. Department of Agriculture. In this way, WWBIC demonstrates a characteristic of many other large-scale programs that mobilize more funding from federal sources than small-scale ones (45 percent versus 39 percent). If winning federal grants is an indicator of institutional capacity, this is further evidence of the type of organizational competencies that the larger organizations have been able to develop and use to grow program services. WWBIC s leaders also remain confident that its primary federal sources will remain available to it, as they are long-term programs that have demonstrated their value. WWBIC also anticipates that earned revenue will grow as its loan fund grows. In 2008, it disbursed 63 microloans valued at $845,540. The outstanding portfolio was $1.5 million. In 2010, the organization disbursed 199 microloans, valued at $2.9 million and its outstanding portfolio had more than doubled to $3.9 million. In addition, the organization made almost $1 million in small business loans. At the end of 2011, total loans outstanding including micro and small business loans were $5.9 million. WWBIC expects future growth to come from the addition of a seed loan product (a quicker, smaller loan) and from expansion efforts targeted both to the cities (deeper) and rural Wisconsin (broader). As mentioned above, every applicant and borrower is a technical assistance client as well. Some technical assistance is provided by loan officers, but a team of business coaches is available to advise clients with more sophisticated needs. After each loan closes, a coach visits the borrower, assesses his/her needs and creates an individualized care plan to guide continued work with that borrower. All clients receive at least one touch a year, and those who require more assistance receive it. Although this costs the organization, the effort is expected to pay off in both business impact and portfolio quality. Looking ahead to future capital needs, WWBIC has set up a simple public offering directed to individual investors. The terms are 5 years and 2 percent interest. Started in the summer of 2011, by spring 2012, the offering had generated $250,000 from seven investors, and is expected to grow that amount in the coming year. This will provide a source of low-cost capital that, over time, will continue to increase the scale of the program and the income it can generate to support it. 30
35
36 12/019
Key Data on the Scale of Business Development Services
 Key Data on the Scale of Business Development Services April 2010 Authors: Elaine L. Edgcomb, Director William Girardo, Research Associate The Aspen Institute Microenterprise Fund for Innovation, Effectiveness,
Key Data on the. Authors: dus.org
 Key Data on the Scale of Microlending in the U.S. February 2011 Authors: William Girardo, Research Associate Elaine L. Edgcomb, Director 1 Dupont Circle, NW, Suite 700 Washington, DC 20036 Website: www.field
Leading the Pack, On Par or Shaky?: Benchmarking Loan Program Performance. By Luz Gomez and Joyce Klein
 Leading the Pack, On Par or Shaky?: Benchmarking Loan Program Performance By Luz Gomez and Joyce Klein September 2012 Leading the Pack, On Par or Shaky?: Benchmarking Loan Program Performance By Luz Gomez
Figure 1: Growth in the number of loans disbursed (n=418)
") Issue 6, August 2014 U.S. Microenterprise Census Highlights, FY2012 Size of the field Based on extrapolations from Census data, FIELD estimates that the U.S. microenterprise industry served 329,538 individuals
Issue 6, August 2014 U.S. Microenterprise Census Highlights, FY2012 Size of the field Based on extrapolations from Census data, FIELD estimates that the U.S. microenterprise industry served 329,538 individuals
Theorizing that many low-income
 JULY 2000 ISSUE 4 Ultimately, FIELD hopes to advance the industry s knowledge about how to deliver effective follow-up services beyond core training or lending. Five new grants focus on: FOLLOW-UP SERVICES:
Sustaining the Delivery of Business Development Services: Strategies and Practices for Mobilizing Resources
 Sustaining the Delivery of Business Development Services: Strategies and Practices for Mobilizing Resources Author: Luz Gomez with assistance from Elaine Edgcomb September 2013 Microenterprise Fund for
HOUSE COMMITTEE ON SMALL BUSINESS. Hearing on. SBA Microloan Program. June 14, 2007
 HOUSE COMMITTEE ON SMALL BUSINESS Hearing on SBA Microloan Program June 14, 2007 Written Statement of Elaine L. Edgcomb, Director, FIELD The Aspen Institute Washington, D.C. Madam Chair Velazquez, Ranking
Statement of problem. Why microfinance?
 WANT IMPACT? BUILD MARKET-RELEVANT MICROLENDERS Joyce Klein, Director of the Aspen Institute Microenterprise Fund for Innovation, Effectiveness, Learning and Dissemination The Aspen Institute Microenterprise
BUILDING ENTREPRENEURSHIP DEVELOPMENT SYSTEMS IN NORTHERN IOWA 1
 BUILDING ENTREPRENEURSHIP DEVELOPMENT SYSTEMS IN NORTHERN IOWA 1 COMMON ROOTS, DIFFERENT APPROACHES BACKGROUND ON THE JOHN PAPPAJOHN ENTREPRENEURIAL CENTERS (JPEC) IN IOWA John Pappajohn s roots are in
Rising Tide Capital 2
 Rising Tide Capital 2 Our Mission Rising Tide Capital, Inc. is a 501(c)3 non-profit organization headquartered in Jersey City, NJ whose mission is to assist struggling entrepreneurs and communities to
ECONOMIC DEVELOPMENT PROGRAMS AND GRANTS AVAILABLE IN WASHINGTON COUNTY
 Appendix O ECONOMIC DEVELOPMENT PROGRAMS AND GRANTS AVAILABLE IN WASHINGTON COUNTY (See Part 2 in Chapter XIII for Additional Programs) Wisconsin Department of Commerce Programs Industrial Revenue Bond
How To Help Small Businesses In North Carolina
 STATE SUPPORT FOR SMALL BUSINESS LENDING: A Roadmap for North Carolina October 2014 Introduction Small businesses are the economic engines of our state and local communities. In North Carolina, businesses
The WE Lend Initiative www.we-lendinitiative.org $2.5MM Grant Empowering Women Entrepreneurs through Increased Access to Capital.
 1 The WE Lend Initiative www.we-lendinitiative.org $2.5MM Grant Empowering Women Entrepreneurs through Increased Access to Capital Media Q&A 2 The Initiative What is the WE Lend Initiative? The WE Lend
How To Understand How A Reservation Program Works
 The Native American Entrepreneurship Report March 2002 Native Assets Research Center First Nations Development Institute 2300 Fall Hill Ave., Suite 412 Fredericksburg, VA 22401 540-371-5615 www.firstnations.org
Distance Learning and the Changing Face of Business Development Services
 Distance Learning and the Changing Face of Business Development Services Authors: Luz Gomez Joyce Klein August 2011 Microenterprise Fund for Innovation, Effectiveness, Learning and Dissemination (FIELD)
SOURCES OF CAPITAL. 1. KINDS OF MONEY When you plan the capital requirements of your new firm, you can consider two forms of money.
 SOURCES OF CAPITAL New businesses must be capitalized carefully. Entrepreneurs must identify their start-up capital needs and their cash flow through their break-even point. The total of the two, plus
BUILDING ASSETS THROUGH MICROBUSINESS
 BUILDING ASSETS THROUGH MICROBUSINESS ACCESS OPPORTUNITY MOBILITY publication authors Joyce Klein Director, FIELD, The Aspen Institute Laura Fischer Research Associate, FIELD, The Aspen Institute microenterprise
99TH GENERAL ASSEMBLY State of Illinois 2015 and 2016 SB0708
 *LRB00MGMb* TH GENERAL ASSEMBLY State of Illinois 0 and 0 SB00 Introduced //0, by Sen. Dan Kotowski SYNOPSIS AS New Act 0 ILCS 0/. new INTRODUCED: Creates the Microloan Program Act. Provides that the Director
Case #C Wisconsin Women s Business Initiative Corporation ( WWBIC ) https://www.wwbic.com/
 https://www.wwbic.com/") Case #C Wisconsin Women s Business Initiative Corporation ( WWBIC ) https://www.wwbic.com/ Mission The Wisconsin Women s Business Initiative Corporation ( WWBIC ) is a leading innovative statewide economic
Case #C Wisconsin Women s Business Initiative Corporation ( WWBIC ) https://www.wwbic.com/ Mission The Wisconsin Women s Business Initiative Corporation ( WWBIC ) is a leading innovative statewide economic
of the microcredit sector in the European Union 2010-11
 Overview of the microcredit sector in the European Union 2010-11 Summary For the first time the EMN Overview survey covered Non-EU member states including all potential EU candidate states. A special emphasis
APPENDIX 13-1 ECONOMIC DEVELOPMENT PROGRAMS AND GRANTS AVAILABLE
 APPENDIX 13-1 ECONOMIC DEVELOPMENT PROGRAMS AND GRANTS AVAILABLE (See Part 2 in Chapter 13 for Additional Programs) Wisconsin Department of Commerce Programs Industrial Revenue Bond (IRB) Program Overview
Module. Creating a Community that Encourages Innovation, Entrepreneurship & New Business Start-ups Appendices
 Module Creating a Community that Encourages Innovation, Entrepreneurship & New Business Start-ups Appendices Appendices CREATING A COMMUNITY THAT ENCOURAGES INNOVATION, ENTREPRENEURSHIP, & NEW BUSINESS
Methodology and Findings
 Conclusion CDFIs The community development financial institution industry in Appalachia is less mature than the national industry. Appalachian CDFIs largely target rural markets for their lending. Appalachian
The Evolving Credit Landscape: Capturing Reporting Barriers among Nonprofit Financial Institutions
 The Evolving Credit Landscape: Capturing Reporting Barriers among Nonprofit Financial Institutions The marketplace for credit products and services is evolving rapidly. Emerging and established companies
WE-Lend Initiative Overview
 WE-Lend Initiative Overview Women s Business Centers (WBC s) play a critical role in the growth, sustainability, and success of women entrepreneurs. On April 4, 2014 the Sam s Club Giving Program and Sam
Microenterprise Development as Job Creation
 Job Creation: Entrepreneurship Approaches Microenterprise Development as Job Creation By Elaine L. Edgcomb and Tamra Thetford, The Aspen Institute, FIELD (Microenterprise Fund for Innovation, Effectiveness,
Area of Focus. Job Focus
 Foreword THE FEDERAL RESERVE BANK of KANSAS CITY serves the seven states of the Tenth Federal Reserve District, which include Colorado, Kansas, Nebraska, Oklahoma, Wyoming, northern New Mexico and western
2012 Economic Development Finance Service Conference Federal Program Update SBA
 2012 Economic Development Finance Service Conference Federal Program Update SBA April 26, 2012 10:30-12:00pm SBA Programs Microloan Program Community Advantage Intermediary Lending Pilot Program 7(a) 504
EVALUATION OF BANK/CDFI PARTNERSHIP OPPORTUNITIES
 IV. EVALUATION OF BANK/CDFI PARTNERSHIP OPPORTUNITIES Banks should carefully review prospective relationships with CDFIs. In particular, they should evaluate the CDFI s service area relative to the bank
Community Development Financial Institutions
 Community Development Financial Institutions A P U B L I C A T I O N O F T H E C D F I D A T A P R O J E C T What are community development financial institutions? Community development financial institutions
Microenterprise and the Small-Dollar Loan Market
 Economic Brief May 2012, EB12-05 Microenterprise and the Small-Dollar Loan Market By Tammie Hoy, Jessie Romero, and Kimberly Zeuli Small business is a designation that includes businesses of many different
TOWN OF NEW CASTLE BUSINESS INCENTIVE POLICY. First Draft: For discussion only
 TOWN OF NEW CASTLE BUSINESS INCENTIVE POLICY First Draft: For discussion only Incentives may be offered to businesses and industries which meet the Town s goal of developing a long-term, sustainable economic
Enhancing Economic Opportunity through Entrepreneurship
 OVERVIEW REPORT M I C R O E N T E R P R I S E Enhancing Economic Opportunity through Entrepreneurship Lessons learned from the third round of the Collaborative Fund for Women s Economic Development M F
ALTERNATIVE FINANCING SOURCES FOR YOUR SMALL BUSINESS
 7605B/7601 ALTERNATIVE FINANCING SOURCES FOR YOUR SMALL BUSINESS Revised October 1999 University of Wisconsin System This publication has been developed by the Wisconsin SBDC in partnership with the U.
Re: Policy Recommendations to create jobs using existing Administration authority
 August 30, 2011 Don Graves, Jr. Executive Director President's Council on Jobs and Competitiveness The White House 1600 Pennsylvania Avenue Washington, DC 20500 Re: Policy Recommendations to create jobs
Brandon Napoli, Director of Micro lending at VEDC
 Brandon Napoli, Director of Micro lending at VEDC Statement for Record for the Subcommittee on Economic Growth, Tax and Capital Access of the House Small Business Committee U.S. House of Representatives
Alternative Financial Institutions in Appalachia
 Alternative Financial Institutions in Appalachia Previous chapters have discussed trends in the financial services industry that affect access to capital for small business development in Appalachia, particularly
F I N A N C I A L R E S O U R C E S
 Introduction F or new businesses to start up and for existing businesses to grow, they must have access to financial resources in the state or region where they operate. Ready access to capital or loan
FIELD Microenterprise Fund For Innovation, Effectiveness, Learning and Dissemination
 FIELD Microenterprise Fund For Innovation, Effectiveness, Learning and Dissemination Financial Literacy and Credit- Building Services in Microenterprise September 2010 The Aspen Institute www.fieldus.org
NESsT Glossary of Terms
 NESsT Glossary of Terms Base of the Pyramid (BoP): The World Resources Institute defines the base of the economic pyramid (BoP) as those with annual incomes below USD 3,000 in local purchasing power approximately
MICROTEST MEASURES AND DEFINITIONS
 MICROTEST MEASURES AND DEFINITIONS Measure Definition Targeting Measures Total Number of Clients served during FY Number/Percent of Women Clients Number of Clients of Color, Racial or Ethnic minorities
WWBIC FACT SHEET. For More Information: Wisconsin Women's Business Initiative Corporation Email: info@wwbic.com www.wwbic.com www.onlinewbc.
 WWBIC FACT SHEET Mission: The Wisconsin Women's Business Initiative Corporation (WWBIC) is a statewide economic development corporation providing quality business education, financial awareness programs,
Located downtown at 1250 6 th Avenue, ACCION San Diego is an independent, 501 (c) (3) non-profit organization that provides economic opportunity to
 (3) non-profit organization that provides economic opportunity to") Located downtown at 1250 6 th Avenue, ACCION San Diego is an independent, 501 (c) (3) non-profit organization that provides economic opportunity to micro-entrepreneurs who lack access to traditional forms
Located downtown at 1250 6 th Avenue, ACCION San Diego is an independent, 501 (c) (3) non-profit organization that provides economic opportunity to micro-entrepreneurs who lack access to traditional forms
Entrepreneur Fund Strategic Plan 2011-2016 Approved August 2011
 Entrepreneur Fund Strategic Plan 2011-2016 Approved August 2011 Page 1 of 8 Overview The Entrepreneur Fund helps people start and grow successful, locally owned small businesses. Our mission is to promote
An Assessment of Capacity Building in Washington State
 An Assessment of Capacity Building in Washington State The Nonprofit Ecosystem Framework Executive Summary prepared by The Giving Practice A consulting service of Philanthropy Northwest February 2012 About
Economic Recovery and Beyond
 Economic Recovery and Beyond Penny Pickett Associate Administrator for Entrepreneurial Development U. S. Small Business Administration www.sba.gov Federal Reserve Bank of Dallas October 14, 2009 SBA s
U.S. Small Business Administration and the Entrepreneurial Economy
 1 The Small Business Administration and the Entrepreneurial Economy Penny Pickett Associate Administrator for Entrepreneurial Development U. S. Small Business Administration www.sba.gov National Association
LEGISLATIVE BILL 449
 LB LB LEGISLATURE OF NEBRASKA ONE HUNDRED FOURTH LEGISLATURE FIRST SESSION LEGISLATIVE BILL Introduced by Mello,. Read first time January 0, Committee: Appropriations A BILL FOR AN ACT relating to the
Progress Notes. A Case Study of the Latino Economic Development Corporation. from FIELD. Building Financial Skills for Business Success: Introduction
 Progress Notes from FIELD A u g u s t 2 0 1 0 Building Financial Skills for Business Success: A Case Study of the Latino Economic Development Corporation Introduction Microenterprise practitioners have
Nonprofit Fundraising 2010 - Change in the Number of Companies
 The 2010 Nonprofit Fundra aising Survey Funds Raised in 20100 Compared with 2009 March 2011 The Nonprof fit Research Collaborative With special thanks to the representatives of 1,845 charitable organizations
MICROLENDING IN THE UNITED STATES A TIMELINE HISTORY, 1973-2010
 MICROLENDING IN THE UNITED STATES A TIMELINE HISTORY, 1973-2010 OVERVIEW Microfinance offers fair and empowering products loans, savings accounts, insurance, and more that help people get ahead financially.
COMPETITIVE AND SPECIAL COMPETITIVE OPPORTUNITY GAP ANALYSIS OF THE 7(A) AND 504 PROGRAMS
 AND 504 PROGRAMS") COMPETITIVE AND SPECIAL COMPETITIVE OPPORTUNITY GAP ANALYSIS OF THE 7(A) AND 504 PROGRAMS Final Report January 2008 Prepared for: U.S. Small Business Administration Prepared by: The Urban Institute 2100
COMPETITIVE AND SPECIAL COMPETITIVE OPPORTUNITY GAP ANALYSIS OF THE 7(A) AND 504 PROGRAMS Final Report January 2008 Prepared for: U.S. Small Business Administration Prepared by: The Urban Institute 2100
A project of the Atlanta Wealth Building Initiative and The Community Foundation for Greater Atlanta
 A project of the Wealth Building Initiative and The Project Wealth Building Initiative and its first business, Lettuce Project Ellen Macht, Project Manager, responsible for managing all aspects of the
Small Business Start-Ups: National Resources
 Small Business Start-Ups: National Resources U.S. Small Business Administration (SBA) www.sba.gov SDA Direct: http://www.sba.gov/sba-direct US Small Business Administration 409 3rd St, SW Washington DC
Social Return on Investment
 Social Return on Investment for Microenterprise Development A Presentation at the AEO Conference, Portland, May 2005 Elaine Edgcomb The Aspen Institute/FIELD Julie Abrams Women s Initiative for Self Employment
Financial Institution Disclosure Form City of Minneapolis, Minnesota
 Financial Institution Disclosure Form City of Minneapolis, Minnesota Financial institutions which participate in or desire to participate in City of Minneapolis programs or the provision of banking services
The Economic Impact of The Support Center s Small Business Revolving Loan Fund
 Creating economic opportunity for all people. The Economic Impact of The Support Center s Small Business Revolving Loan Fund January 2014 3120 Highwoods Blvd, Suite 350 Raleigh, NC 27604 919.803.1437 phone
Credit: Global Alliance for Clean Cookstoves INCREASING INVESTMENT IN THE CLEAN COOKING SECTOR
 Credit: Global Alliance for Clean Cookstoves INCREASING INVESTMENT IN THE CLEAN COOKING SECTOR A STRATEGY TO DRIVE INVESTMENT BACKGROUND The Global Alliance for Clean Cookstoves is a publicprivate partnership
MICROCREDIT ENTERPRISES. Financial Statements For the Year Ended December 31, 2013
 Financial Statements Table of Contents Independent Auditor s Report 1-2 Financial Statements: Statement of Financial Position 3 Statement of Activities 4 Statement of Cash Flows 5 6-18 Page 10900 NE 4th
TISCH CENTER B.S. IN HOTEL AND TOURISM MANAGEMENT COURSE DESCRIPTIONS 2011
 AS OF THE FALL SEMESTER UPDATED APRIL 15, MAJOR CORE Tourism Impacts and Issues TCHT1-DC 1000 A survey of the dimensions, operations, and issues of the global tourism industry. Topics covered include:
R e s o u r c e g u i d e f o r d u a l c a r e e r s p o u s e s a n d P a rt n e r s
 R e s o u r c e g u i d e f o r d u a l c a r e e r s p o u s e s a n d P a rt n e r s Get plugged in... The AssociATed colleges Center for Independent Scholars The Center for Independent Scholars offers
Inequity of the Circular Economy. By Daniel Cochran, Appalachian State University 2015
 Inequity of the Circular Economy By Daniel Cochran, Appalachian State University 2015 Author Note Daniel Cochran, Masters of Business Administration, Appalachian State University, Boone, North Carolina
SMALL BUSINESS ADMINISTRATION
 SMALL BUSINESS ADMINISTRATION AT A GLANCE: 2006 Discretionary Budget Authority: $593 million (Decrease from 2005: 3 percent) Major Programs: Small Business Loans Small Business Development Centers Disaster
Changes in Self-Employment: 2010 to 2011
 Changes in Self-Employment: 2010 to 2011 American Community Survey Briefs By China Layne Issued January 2013 ACSBR/11-21 INTRODUCTION From December 2007 to June 2009, the United States experienced an economic
Progress Notes. from FIELD. A Case of Two Vermont Microenterprise Programs. Building Businesses by Building Credit: Introduction.
 Progress Notes from FIELD August 2012 Building Businesses by Building Credit: A Case of Two Vermont Microenterprise Programs Introduction While microenterprise practitioners have long had financial education
Strategic Objective 2.1: Inclusive Entrepreneurship
 Strategic Objective 2.1: Inclusive Entrepreneurship Ensure inclusive entrepreneurship by expanding access and opportunity to small businesses and entrepreneurs in communities where market gaps remain Performance
Software Productization Center Small Business Institute. A Case Study of Cooperation
 Software Productization Center Small Business Institute A Case Study of Cooperation By Patrick McCaskey Business Administration Department Millersville University Millersville, PA, USA (717) 872-3842 Pat.McCaskey@millersville.edu
Take the Mystery out of SBA Loans Small Biz Day. Michael Foutch Economic Development Specialist U.S. Small Business Administration
 Take the Mystery out of SBA Loans Small Biz Day Michael Foutch Economic Development Specialist U.S. Small Business Administration How do we help entrepreneurs? Financing Technical assistance and counseling
America s SBDC Call for Presentation Guidelines
 America s SBDC Call for Presentation Guidelines Welcome to America s Small Business Development Center (SBDC) call for presentation guidelines. The conference provides professional development to our national
microenterprise Fall 2000 FACT SHEET SERIES ISSUE 5 SOURCES OF PUBLIC FUNDING
 microenterprise Fall 2000 FACT SHEET SERIES SOURCES OF PUBLIC FUNDING The evolution of microenterprise programs has witnessed a significant increase in the number and diversity of funding sources which
18 YORK SMALL BUSINESS ENTERPRISE CENTRE 2013 ACTIVITY REPORT AND PROPOSED 2014 PROGRAM INITIATIVES
 Clause No. 18 in Report No. 1 of was adopted, without amendment, by the Council of The Regional Municipality of York at its meeting held on January 23, 2014. 18 YORK SMALL BUSINESS ENTERPRISE CENTRE 2013
Final Report. January 2008. The Urban Institute. Prepared for: U.S. Small Business Administration. Prepared by: Rachel Brash
 PUBLIC SECTOR DUPLICATION OF SMALL BUSINESS ADMINISTRATION LOAN AND INVESTMENT PROGRAMS: AN ANALYSIS OF OVERLAP BETWEEN FEDERAL, STATE, AND LOCAL PROGRAMS PROVIDING FINANCIAL ASSISTANCE TO SMALL BUSINESSES
SeaTac - Tukwila Food Innovation Network (FIN)
") SeaTac - Tukwila Food Innovation Network (FIN) What is the Food Innovation Network (FIN)? The Food Innovation Network is a governance structure for accomplishing the goal of promoting increased local food
SeaTac - Tukwila Food Innovation Network (FIN) What is the Food Innovation Network (FIN)? The Food Innovation Network is a governance structure for accomplishing the goal of promoting increased local food
Welcome to the City of Watervliet
 Welcome to the City of Watervliet Dear Friends, Starting and operating a business is both challenging and rewarding. Small businesses provide the majority of new job opportunities in the United States.
Grant Guidelines. 4. Is this the best possible use of Citi Foundation funds given other opportunities before us?
 Grant Guidelines The mission of the Citi Foundation is to promote economic progress and create measurable impact in lowincome communities around the world. We invest in efforts that increase financial
Best Practices from Participating States: Partnering with Community Development Financial Institutions (CDFIs)
") Best Practices from Participating States: Partnering with Community Development Financial Institutions (CDFIs) February 2015 1 Acknowledgements This SSBCI Best Practices document resulted from constructive
Best Practices from Participating States: Partnering with Community Development Financial Institutions (CDFIs) February 2015 1 Acknowledgements This SSBCI Best Practices document resulted from constructive
Together We Are Stronger
 Information Kit Together We Are Stronger MISSION STATEMENT FSHCC mission is to promote the economic advancement Florida s Hispanic community, with a focus on economic and political empowerment, and public
Impact Investing through Donor Advised Funds at Community Foundations Models & How to Get Started
 Impact Investing through Donor Advised Funds at Community Foundations Models & How to Get Started This webinar is part of a project to develop an impact investment toolkit for community foundations funded
Self-Help: Scaling Microfinance in California
 Self-Help: Scaling Microfinance in California A Case Study of Business Model Innovation Date of Publication: January 2013 Author: Ginger McNally National Federation of Community Development Credit Unions
SBA Update Prime Contractors Group Eric Ness SBA Wisconsin District Director
 SBA Update Prime Contractors Group Eric Ness SBA Wisconsin District Director October 13, 2015 1 Overview Programs and Services Capital Contracting Counseling 2 7(a) Loan Program SBA s primary business
October 21, 2010. Access to Credit: An analysis of the credit climate for small businesses in the Capital Region
 October 21, 2010 Access to Credit: An analysis of the credit climate for small businesses in the Capital Region Since the start of the recession in the third quarter of 2007, small business owners have
MICROCREDIT ENTERPRISES. (A California Not-For-Profit Organization) FINANCIAL STATEMENTS DECEMBER 31, 2007
 FINANCIAL STATEMENTS DECEMBER 31, 2007") (A California Not-For-Profit Organization) FINANCIAL STATEMENTS DECEMBER 31, 2007 TABLE OF CONTENTS Independent auditors' report Page 2 Statement of financial position - December 31, 2007 Statement of
(A California Not-For-Profit Organization) FINANCIAL STATEMENTS DECEMBER 31, 2007 TABLE OF CONTENTS Independent auditors' report Page 2 Statement of financial position - December 31, 2007 Statement of
America s SBDC Call for Presentation Guidelines Making Small Business Big Business
 America s SBDC Call for Presentation Guidelines Making Small Business Big Business Welcome to America s SBDC call for presentation guidelines. America s SBDC annual conference is the premier professional
Venture Capital Tax Credits By State
 Venture Capital Tax Credits By State Alabama States Credit Amount Eligibility Notes Alaska Arizona Angel Investment Bill (Direct Tax Credit available for investments made after June 30, 2006, for tax years
U.S. Small Business Administration. The SBA Advantage. Resources and Programs for Success
 U.S. Small Business Administration The SBA Advantage Resources and Programs for Success The SBA Advantage Millions of entrepreneurs use SBA resources and programs to: Start or grow a business Effectively
II. CDFI ORGANIZATIONAL STRUCTURES
 II. CDFI ORGANIZATIONAL STRUCTURES This section describes the organizational structures and characteristics of CDFIs. It provides information that can assist financial institutions and community leaders
Women Entrepreneurs Summit Series Report
 Women Entrepreneurs Summit Series Report Background Women are playing a central role in rebuilding the middle class and keeping our economy growing. Women owned businesses represent one of the fastest
Community Investing in Canada. Written by: Susannah Cameron, Executive Director Canadian Community Investment Network Cooperative Canada
 Community Investing in Canada Written by: Susannah Cameron, Executive Director Canadian Community Investment Network Cooperative Canada TABLE OF CONTENTS Introduction... 1 Describing the community investing
Contribution of S ESOPs to participants retirement security
 Contribution of S ESOPs to participants retirement security Prepared for the Employee-Owned S Corporations of America March 2015 Executive summary Since 1998, S corporations have been permitted to maintain
SMALL BUSINESS REVOLVING LOAN FUND GUIDELINES 1.0 INTRODUCTION
 SMALL BUSINESS REVOLVING LOAN FUND GUIDELINES 1.0 INTRODUCTION Fay-Penn Economic Development Council has established a Small Business Loan Fund. The Small Business Loan Fund Program is designed to stimulate
BUSINESS INCUBATORS. October 2013
 BUSINESS INCUBATORS October 2013 Prepared By: Paul Nicolosi Thomas Keeling Hinshaw Consulting, LLC (312) 343-2940 pnicolosi@hinshawconsulting.com tkeeling@hinshawconsulting.com WHITEPAPER: BUSINESS INCUBATORS
Economic Development
 50 Credit: Brad Holt. The Chickasaw Nation s economic development efforts have enabled the tribe to better serve its citizens. Pictured above is the Chickasaw Nation Medical Center in Ada, Oklahoma. Native
Community First Fund Strategic Plan 2006-2010
 I. Introduction Community First Fund, the premier economic development organization serving central Pennsylvania, has a fourteen-year history of providing loans and technical assistance for small business
Overview of SBA Economic Development Programs and the Impact of the Recovery Act
 Overview of SBA Economic Development Programs and the Impact of the Recovery Act 1 Access to Capital SBA guarantees loans on reasonable terms through financing partners to small businesses that are unable
PUBLIC DISCLOSURE. March 02, 2009 COMMUNITY REINVESTMENT ACT PERFORMANCE EVALUATION. First National Bank of Michigan Charter Number 24637
 O SMALL BANK Comptroller of the Currency Administrator of National Banks Washington, DC 20219 PUBLIC DISCLOSURE March 02, 2009 COMMUNITY REINVESTMENT ACT PERFORMANCE EVALUATION First National Bank of Michigan
On March 11, 2010, President Barack
 U.S. Department of Commerce International Trade Administration Introduction Exports Support American Jobs Updated measure will quantify progress as global economy recovers. On March 11, 21, President Barack
What You Need to Know About Loans in 2013
 Gary Lindner President & CEO Our Mission, Vision, and Core Values Our Mission PeopleFund creates economic opportunity and financial stability for underserved people by providing access to capital, education
REQUEST FOR INVESTMENT PROPOSALS WORKING CAPITAL FOR GROWING BUSINESS
 REQUEST FOR INVESTMENT PROPOSALS WORKING CAPITAL FOR GROWING BUSINESS CFED, with support from the Northwest Area Foundation, Wachovia, Cascadia Revolving Fund, and the National Community Capital Association,
Community Investments Vol 15, Issue 2 Making the New Markets Tax Credit Count
 Community Investments Vol 15, Issue 2 Making the New Markets Tax Credit Count Author(s): Robert Rapoza, President, Rapoza Associates August 2003 The New Markets Tax Credit (NMTC) program was enacted in
CONNECT THE DOTS WHAT IS CAPACITY BUILDING?
 TOPIC #4: Nonprofit Capacity Building CONNECT THE DOTS A series of topical papers presented by the Omaha Community Foundation to begin a conversation on subjects that matter to our community WHAT IS CAPACITY