How To Understand The Relationship Between Maize And The Teosinte
|
|
|
- Beatrix Barrett
- 3 years ago
- Views:
Transcription
1 Copyright 2005 by the Genetics Society of America DOI: /genetics Genetic Diversity and Population Structure of Teosinte Kenji Fukunaga,*,1 Jason Hill, Yves Vigouroux,*,2 Yoshihiro Matsuoka,*,3 Jesus Sanchez G., Kejun Liu,,4 Edward S. Buckler** and John Doebley*,5 *Laboratory of Genetics, University of Wisconsin, Madison, Wisconsin 53706, Department of Plant Biology, University of Minnesota, St. Paul, Minnesota 55108, Centro Universitario de Ciencias Biologicas y Agropecuarias, Universidad de Guadalajara, Zapopan, Jalisco, Mexico CP45110, Statistics Department, North Carolina State University, Raleigh, North Carolina and **USDA-ARS, Institute for Genomic Diversity, Cornell University, Ithaca, New York Manuscript received May 19, 2004 Accepted for publication January 3, 2005 ABSTRACT The teosintes, the closest wild relatives of maize, are important resources for the study of maize genetics and evolution and for plant breeding. We genotyped 237 individual teosinte plants for 93 microsatellites. Phylogenetic relationships among species and subspecific taxa were largely consistent with prior analyses for other types of molecular markers. Plants of all species formed monophyletic clades, although relationships among species were not fully resolved. Phylogenetic analysis indicated that the Mexican annual teosintes divide into two clusters that largely correspond to the previously defined subspecies, Z. mays ssp. parviglumis and ssp. mexicana, although there are a few samples that represent either evolutionary intermediates or hybrids between these two subspecies. The Mexican annual teosintes show genetic substructuring along geographic lines. Hybridization or introgression between some teosintes and maize occurs at a low level and appears most common with Z. mays ssp. mexicana. Phylogeographic and phylogenetic analyses of the Mexican annual teosintes indicated that ssp. parviglumis diversified in the eastern part of its distribution and spread from east to west and that ssp. mexicana diversified in the Central Plateau of Mexico and spread along multiple paths to the north and east. We defined core sets of collections of Z. mays ssp. mexicana and ssp. parviglumis that attempt to capture the maximum number of microsatellite alleles for given sample sizes. TEOSINTE is a wild grass native to Mexico and Cen- analyses, a refined understanding of its phylogenetics tral America (Figure 1) and the closest wild relative and population structure can help guide further re- of cultivated maize (Zea mays ssp. mays L.). Teosinte search in all of these areas. represents an important resource for the study of maize Together, teosinte and maize compose the genus Zea, genetics (Evans and Kermicle 2001), quantitative ge- which has four species (Figure 1): (1) Z. luxurians netics (Lukens and Doebley 1999), molecular popula- (Durieu and Ascherson) Bird, an annual teosinte from tion genetics (Gaut et al. 2000), genome evolution Central America; (2) Z. diploperennis Iltis, Doebley and (Sanz-Alferez et al. 2003), and crop evolution (Doeico; Guzman, a diploid perennial teosinte from Jalisco, Mexbley 1990a). Notably, teosinte has become one of the (3) Z. perennis (Hitchc.) Reeves and Mangels- best-characterized systems for plant molecular populaico; dorf, a tetraploid perennial teosinte from Jalisco, Mex- tion genetics, including studies utilizing DNA samples and (4) Z. mays, a polytypic annual species that recovered from archeological specimens ( Jaenickessp. includes four subspecies. The four subspecies are (1) Després et al. 2003). The teosintes also represent an mays (maize); (2) ssp. mexicana (Schrader) Iltis, important potential resource for maize breeding, alelevations a large-spikeleted teosinte adapted to the drier high though they have not yet been extensively used in this ( m) of northern and central capacity. Given the breadth of use of teosinte in genetic Mexico; (3) ssp. parviglumis Iltis and Doebley, a small- spikeleted teosinte adapted to the moister middle elevation ( m) of southwestern Mexico; and (4) ssp. huehuetenangensis (Iltis and Doebley) Doebley, an 1 Present address: The International Research Center for Japanese Studies, 3-2 Oeyama-cho, Goryo, Nishikyo-ku, Kyoto , Japan. annual teosinte found only in the province of 2 Present address: Institut de Recherche pour le Developpement, Montpellier 34730, France. 1990b). The four species of Z. mays have been placed Huehuetenango in western Guatemala (Doebley 3 Present address: Fukui Prefectural University, Matsuoka-cho, Yos- into two sections: section Zea, which contains only Z. hida-gun, Fukui , Japan. 4 mays, and section Luxuriantes, which is composed of the Present address: National Institute of Statistical Sciences, 19 T. W. Alexander Dr., Research Triangle Park, NC other three species. Most of these teosinte species and 5 Corresponding author: Laboratory of Genetics, University of Wisconsin, 445 Henry Mall, Madison, WI jdoebley@wisc.edu sisting of only a few local populations; however, subspecies have narrow geographic distributions conssp. Genetics 169: (April 2005)

2 2242 K. Fukunaga et al. Figure 1. Geographical distribution of the teosinte populations used in this study. Since many accessions come from geographically very close locations, their symbols overlap on the map. mexicana and ssp. parviglumis are exceptions, being 1). Wilkes (1967) divided Z. mays ssp. mexicana into three widely distributed in Mexico (Figure 1). Recently, Iltis races: Central Plateau, Chalco, and Nobogame. Because many new populations have been discovered since Wilkes seminal and Benz (2000) classified Z. luxurians from Nicaragua work (Sanchez et al. 1998), we divided Z. mays ssp. mexicana as a new species, Z. nicaraguensis Iltis and Benz. Here, into five geographical groups: Central Plateau, Chalco, Duwe treat it as one geographical group of Z. luxurians. rango, Nobogame, and Puebla. Further extending Wilkes To clarify the phylogeny and population structure of analysis, we divided Z. mays ssp. parviglumis into two races, the teosintes, we used a set of 93 microsatellite or simple Balsas and Jalisco, and into five geographical groups, eastern Balsas, Central Balsas, Jalisco, Oaxaca, and southern Guerrero sequence repeat (SSR) loci and a sample of 237 individ- (Table 1, Figure 1). Two individual plants of the genus Tripsaual teosinte plants that cover the entire geographical cum (one individual each of T. zopilotense and T. peruvianum) distribution of the teosintes. We addressed four ques- were used as the outgroup in phylogenetic analyses. See supplementary tions: (1) How are Zea taxa related to each other?, (2) materials at How did the annual teosintes diversify in Mexico?, (3) for the complete passport data for the plants, including germplasm bank accession numbers and geographical coordinates. How is genetic diversity structured in the Mexican an- SSR genotypes: Ninety-three SSRs that are evenly distributed nual teosintes?, and (4) Has introgression among spe- throughout the genome were used to genotype all 237 Zea cies or subspecies played a role in teosinte evolution? plants and the two Tripsacum individuals. These SSRs were We also define core sets of teosinte accessions that best used in the previous analysis of maize and its wild progenitor capture the diversity of the teosintes. (Matsuoka et al. 2002b). The plants were genotyped at Celera AgGen (Davis, CA) following procedures published elsewhere (Matsuoka et al. 2002b). See supplementary materials at MATERIALS AND METHODS for a list of the SSRs, their repeat type, and their genomic locations. Plant materials: We sampled 237 teosinte plants from 172 Diversity analyses: Basic statistics, including the number of accessions representing the entire geographical distribution alleles, observed heterozygosity, gene diversity (or expected of teosinte from northern Mexico to western Nicaragua. For each heterozygosity), and the number of taxon-specific (private) accession, 1 5 individuals were assayed. The sample includes 93 alleles, were calculated for species, subspecies, and races using Z. mays ssp. mexicana individuals (69 accessions), 114 Z. mays ssp. PowerMarker (Liu 2002). In these analyses, individual plants parviglumis (82 accessions), 7 Z. mays ssp. huehuetenangensis (3 of possible hybrid origin as determined by population struc- accessions), 13 Z. luxurians (10 accessions), 6 Z. diploperennis ture analysis (see below) were excluded. (5 accessions), and 4 Z. perennis (3 accessions) (Figure 1, Table Phylogenetic trees: We used the FITCH program in the
 classified Z. luxurians from Nicaragua work (Sanchez et al. 1998), we divided Z. mays ssp.")
3 Genetic Diversity in Teosinte 2243 PHYLIP package (Felsenstein 1993) with the log-transformed proportion-of-shared-alleles distance as implemented in the computer program Microsat ( projects/microsat/). In FITCH, the J option was used to randomize the input order of samples. We constructed three types of trees: (1) a tree with all individual plants, (2) a tree with individual plants pooled into operational taxonomic units (OTUs) on the basis of their geographic origin and position in the individual tree, and (3) trees rooted with T. zopilotense and T. peruvianum. Data were pooled into 76 OTUs of two to four individual plants (or five plants in the case of Z. diploperennis). Membership of the plants in the 76 OTUs was based on their geographic origin and position in Figure 2 (see supplemental materials at Pooling was necessary to reduce the number of entries in the FITCH analysis to a level at which bootstrap replicates could be analyzed. Data for the two Tripsacum species were pooled to create a single synthetic outgroup. This was done because of the high frequency of null phenotypes ( alleles ) for the SSRs in the single Tripsacum samples. Once pooled, the syn- thetic Tripsacum outgroup possessed visible alleles at 61 SSRs and null phenotypes at the other 32 SSRs. In the trees rooted with Tripsacum, we scored null phenotypes in two ways be- cause of the large number of null phenotypes in Tripsacum. First, all null phenotypes at a locus were scored as the same null allele 0 in both Zea and Tripsacum. Second, null pheno- types in teosintes were scored as the allele 0 but as a distinct null allele 00 in Tripsacum, on the basis of the assumption that these alleles had independent origins. Given the high frequency of nulls in Tripsacum (50% nulls in each individual plant), it is highly probable that nulls in Tripsacum are inde- pendent of nulls in Zea. To determine the degree of statistical support for different branch points, we evaluated 1000 trees constructed from bootstrap resamplings of the data. Analysis of phylogeography: We tested geographic (clinal) vs. dispersal models for the current distribution of populations of Z. mays ssp. mexicana and ssp. parviglumis. In the geographic model, migration occurs on a small scale and populations are isolated by distance. In this case, genetic distance should be correlated with geographical distance between populations. In dispersal models, long distance migration is allowed, and two geographically close populations may have been derived from distinct distant founder populations. In this case, genetic distance will be less correlated with geographical distance than with distance along the dispersal routes (dispersal distance). To test which scenario best fits the distribution of ssp. mexicana and ssp. parviglumis, we compared the geographical (clinal) and multiple dispersal distance matrices to the genetic distance between the populations. The Nobogame and Durango popula- tions, which are geographically very distant, were removed from the analysis to prevent these geographic outliers from having undue weight on the analysis. Various dispersal hypotheses were constructed using the Phylogeographer 1.0 (Buckler 1999). We placed the nodes A F on the map (Figure 4). These nodes correspond to teo- sinte population centers as follows: A, eastern Balsas region; B, Central Plateau; C, Valley of Mexico; D, Balsas river drain- age; E, southern Guerrero; and F, Jalisco. Each of these centers is ecologically relatively homogeneous with respect to altitude, length of growing season, and annual rainfall, and teosinte populations within each center share morphological similarity (Wilkes 1967; Sanchez et al. 1998). Populations within these seven centers were connected to their respective nodes (A F) as shown in Figure 4. Different dispersal models were then constructed by connecting nodes A F in various ways. Dispersal distance between two populations for a particular dispersal model is the sum of the distances along paths that connect them. Figure 4 shows the dispersal models we tested. To calculate genetic distance, we randomly picked one indi- vidual from each OTU as a representative. Individual plants of possible hybrid origin as determined by population structure analysis (see below) were excluded. We calculated the log-transformed proportion-of-shared-alleles distance among these in- dividuals and used this distance matrix in all tests. We then calculated correlation coefficients between the genetic dis- tance matrix and dispersal and clinal matrices according to Smouse et al. (1986). The significance of the correlations was estimated using matrix permutation tests with 10,000 replicates (Dietz 1983; Smouse et al. 1986). Population structure analysis: For the analysis of population structure and detection of intermediate types (hybrids or an- cestral forms), we used a model-based clustering method as implemented in the software program STRUCTURE (Pritch- ard et al. 2000). In this analysis, a number of populations (K) is assumed to be present and to contribute to the genotypes of the sampled individuals. The genotype of each individual is a function of the allele frequencies in these K populations (clusters) and the proportion of its genotype drawn from each of the K populations (q k ). Loci are assumed to be independent, and each K population is assumed to follow Hardy-Weinberg equilibrium. A Monte Carlo Markov chain method was used to estimate allele frequencies in each of the K populations and the degree of admixture for each individual plant. In the analyses, we did not use any prior information about the geographic origin of the plants. We used STRUCTURE with 1,000,000 iterations and a burn-in period of 30,000. We increased the parameter, ALPHAPROPSD, from 0.05 (the default value) to 0.50 to ex- plore a wide range of possible values of ALPHA, the degree of admixture. At least three independent runs were assessed for each fixed number of populations (K). For the analysis of introgression between maize and teosinte, we used a sample of 52 Mexican maize landraces (Matsuoka et al. 2002b). Separate analyses with maize were made for Z. luxurians, Z. diploperennis, and Z. mays ssp. huehuetenangensis. In each case, we assumed two clusters. We analyzed the ssp. parviglumis and ssp. mexicana plants together with maize (ssp. mays), assuming three clusters. We performed this analysis with the three subspecies together since introgression between ssp. mexicana and ssp. parviglumis may also have occurred. Plants possessing 80% ancestry in their own cluster were considered to be of possible hybrid origin. For the analysis of population structure within ssp. mexicana and ssp. parviglumis, we used STRUCTURE with K 1 6 on each subspecies sepa- rately. For all analyses with STRUCTURE, we used only a subset of 70 SSRs that had 10% null phenotypes (null alleles or missing data). Core set: To assist in the management of a large germplasm collection, core sets have been defined to represent a large proportion of diversity encompassed in the entire collection (Brown 1989). Recently, core sets in many crops and their relatives have been established (Grenier 2000a,b; Oritz et al. 1998). To assist in the use of ssp. mexicana and ssp. parviglumis germplasm, we defined core sets of accessions that capture the maximum number of SSR alleles using the Core Set function in PowerMarker (Liu 2002). The method is based on a simulated annealing algorithm (Liu 2003). One-hundred replicates with different initial subsets were performed. RESULTS Diversity statistics: Observed heterozygosity, gene di- versity (expected heterozygosity), number of alleles, and number of private alleles of each taxon are shown in Table 1. Z. mays possesses substantially higher values for heterozygosity and gene diversity than the other diploid
 trees rooted with T. zopilotense and T. peruvianum. Data were pooled into 76 OTUs of two to four individual plants (or five plants in the case of Z.")
4 2244 K. Fukunaga et al. TABLE 1 Diversity statistics for teosinte microsatellites No. of No. of Observed Gene No. of No. of Taxon accessions plants heterozygosity diversity alleles private alleles Section Luxuriantes Z. diploperennis Z. luxurians Z. perennis Section Zea Z. mays ssp. huehuetenangensis ssp. mexicana Race Central Plateau Race Chalco Race Nobogame ssp. parviglumis Race Balsas Race Jalisco Gene diversity and observed heterozygosity were calculated as the average over plants for a taxon. species (Z. luxurians and Z. diploperennis). Within Z. mays structure analysis and accordingly are marked with a (sensu lato), ssp. huehuetenangensis possesses a lower gene large H in Figure 2. Four of the six individuals of the diversity value than either ssp. parviglumis or ssp. mexicana. eastern Balsas geographic group of ssp. parviglumis were Subspecies parviglumis possesses slightly greater gene diversity identified as putative hybrids, containing 20% ssp. than ssp. mexicana; however, it possesses twice as mexicana ancestry. many private alleles despite roughly equivalent samples Within ssp. mexicana, there is clear geographic pat- of each. Among the races of ssp. parviglumis and terning of the individuals within Figure 2. Plants from ssp. mexicana, Nobogame is the least diverse. Overall, Durango, Nobogame, the Valley of Mexico (Chalco), and the taxa with narrow geographic distributions (Z. luxuri- Puebla mostly cluster near other plants of the same geographic ans, Z. diploperennis, ssp. huehuetenangensis, and race Nobogame) origin. However, plants from the Central Plateau show the least diversity, and the broadly distrib- are dispersed throughout the ssp. mexicana clade. Within uted ssp. parviglumis is the most diverse taxon. ssp. parviglumis, plants from Jalisco, Oaxaca, and south- For all taxa, observed heterozygosity is substantially ern Guerrero mostly cluster near other plants of the lower than gene diversity (expected heterozygosity), although same geographic origin. Plants from the Central Balsas under Hardy-Weinberg expectations these val- area are more dispersed with plants from the eastern ues should be the same. This discrepancy may arise for portion of the Central Balsas region separated from several reasons: (1) failure of one allele to amplify dur- those of the western portion. As mentioned above, ing PCR reactions (so-called allele drop-out ), (2) population plants from the eastern Balsas region occur either near structure, and (3) inbreeding during seed in- or within the ssp. mexicana clade. crease in germplasm banks. To further assess the phylogenetic affinities within Phylogeny: A phylogenetic tree of all 237 individuals Zea, we constructed a Fitch-Margoliash tree (Figure 3) was constructed using the Fitch-Margoliash method for pooled groups (OTUs) of two to four individual (Figure 2). In this tree, individuals that are putative plants (or five plants in the case of Z. diploperennis). hybrids between taxa as shown by population structure Membership of the plants in the 76 OTUs was based analysis (see below) are marked with a large H. The on their geographic origin and position in Figure 2 (see tree shows that the individual plants of any given species supplemental materials at form a monophyletic group, if one excludes one Z. mental/). In this tree, there is strong support from the diploperennis plant of apparent hybrid origin. The two bootstrap procedure for the monophyly of Z. luxurians perennial species (Z. diploperennis and Z. perennis) are (100%), ssp. huehuetenangensis (100%), and ssp. mexicana sisters, and Z. luxurians is sister to them. Within Z. mays, (98%). The two perennial species, Z. diploperennis ssp. huehuetenangensis is monophyletic and sister to the and Z. perennis, are also well supported as a monophyletic other two subspecies. Individuals of ssp. mexicana and group (99.5%). Z. mays ssp. parviglumis is paraphyother ssp. parviglumis are largely but not completely separated. letic as the eastern Balsas group of this subspecies is All individuals that failed to cluster with their own subspecies basal to ssp. mexicana. Since the eastern Balsas group is were identified as putative hybrids by population of putative hybrid origin (see below), we reassessed the

5 Genetic Diversity in Teosinte 2245 Figure 2. Unrooted phylogeny of individual teosinte plants using the Fitch-Margoliash method and the log-transformed proportion of shared-allele distance among 93 microsatellite loci. The tree contains 237 individuals. A large H indicates plants identified as being of putative hybrid origin by population structure analysis. Z. mays ssp. parviglumis: (B) Central Balsas, (E) eastern Balsas, (J) Jalisco, (O) Oaxaca, (S) South Guerrero. Z. mays ssp. mexicana: (C) Central Plateau, (H) Chalco, (D) Durango, (N) Nobogame, (P) Puebla. (U) Z. mays ssp. huehuetenangensis, (Xg) Z. luxurians (Guatemala), (Xn) Z. luxurians (Nicaragua), (R) Z. diploperennis, (Z) Z. perennis. phylogeny after excluding this OTU, in which case ssp. proximity. Only one placement is inconsistent with geography, parviglumis is monophyletic, but has only 46% bootstrap namely the position of the southern Guerrero support as such. OTU (parsog01) within the Central Balsas clade. Many Figure 3 reveals strong geographic patterning of the of the basal branches are short within the ssp. parviglumis OTUs within ssp. parviglumis. Excluding eastern Balsas, clade and few branch points have strong bootstrap support; which is basal to ssp. mexicana, OTUs from the eastern however, the consistency of the clades with geograwhich portion of the Central Balsas region (parcbl01 parcbl07) phy suggest that many of the observed relationships are the basal-most samples within this subspecies. Nested likely reflect the history of populations within this sub- within these OTUs is a clade composed of southern species. Guerrero OTUs plus the Oaxaca OTU, suggesting that Geographic patterning of OTUs is also seen within the latter groups were derived from the populations ssp. mexicana (Figure 3). There is a basal split of this of the eastern Central Balsas. OTUs from the western subspecies with OTUs from the Central Plateau geo- portion of the Central Balsas region (parcbl08 graphic region falling in both clades. One clade contains parcbl23) are derived from those of the eastern portion. the Nobogame geographic group along with OTUs The Jalisco OTUs fall within the clade of the western from the northwestern portion of the Central Plateau Central Balsas OTUs, consistent with their geographic (centp10, centp12, and centp13). In the other clade, the
 Central Balsas, (E) eastern Balsas, (J) Jalisco, (O) Oaxaca, (S) South Guerrero. Z. mays ssp. mexicana: (C) Central Plateau, (H) Chalco, (D) Durango, (N) Nobogame, (P) Puebla. (U) Z.")
6 2246 K. Fukunaga et al.
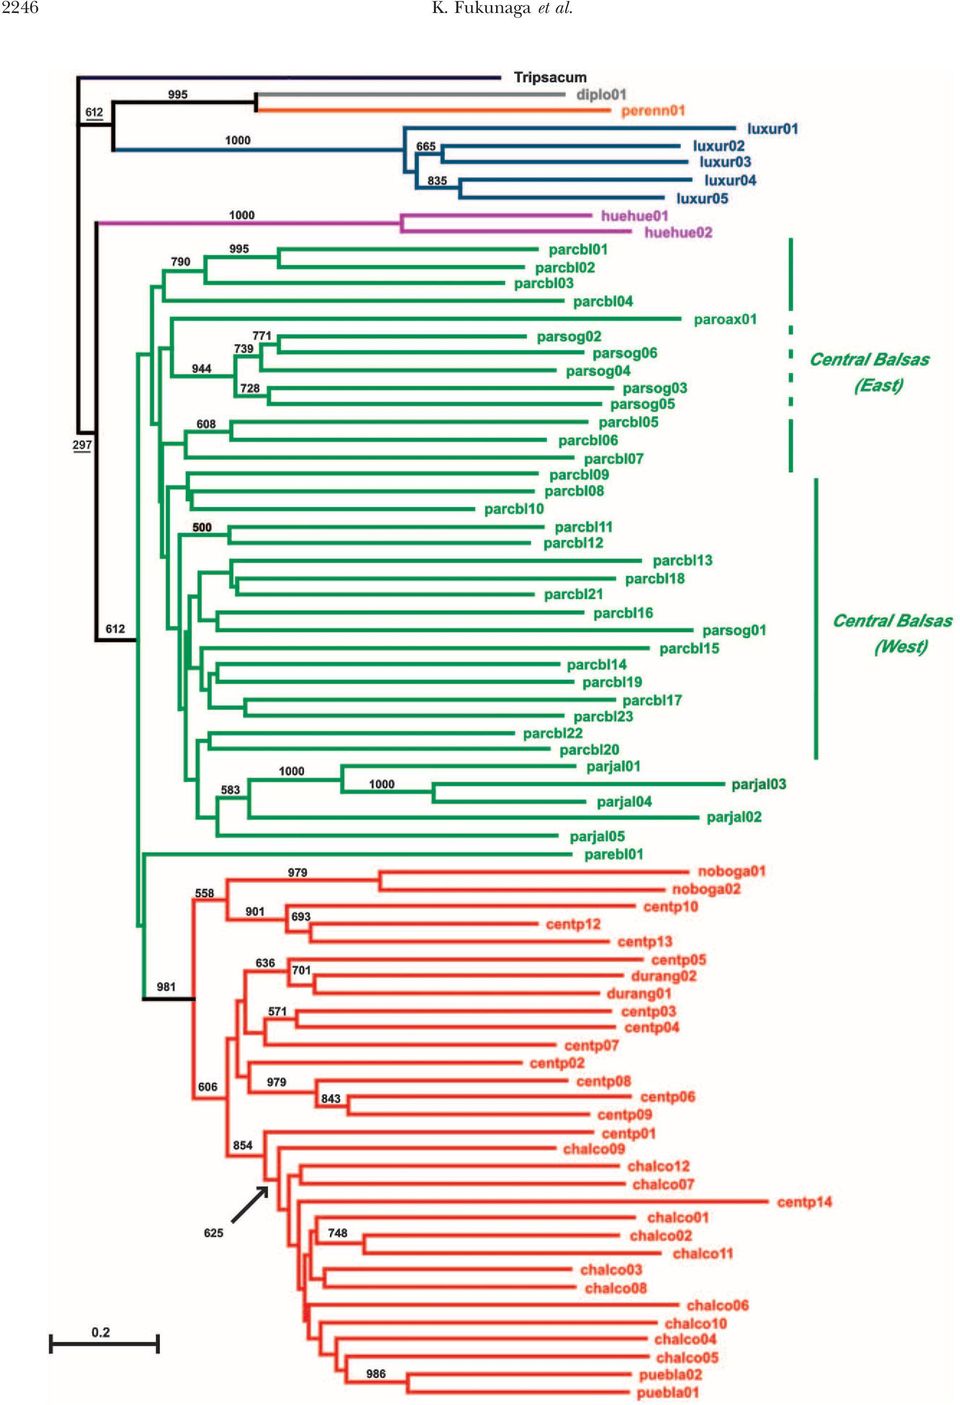
7 Genetic Diversity in Teosinte 2247 Durango geographic group clusters with OTU centp05 through areas B F and shows migrations from the west from the core region of Central Plateau populations. along two paths. OTU centp01 of race Central Plateau, which grows at The correlation coefficient between geographic the highest elevation (2300 m) for this race, is basal to (clinal model) and genetic distance is 0.28 (P 0.001), race Chalco, which grows at elevations of 2300 m and indicating a significant relationship between these distance higher in the Valley of Mexico. The Puebla geographic measures (Table 2). However, the correlation cohigher group, which lies to the east of the Valley of Mexico, is efficients between dispersal and genetic distance for the nested within the race Chalco of the Valley of Mexico different dispersal models are all higher. Model 1 shows (see Figure 1). The position of OTU centp14 from Jali- the highest correlation of the models tested (0.49; P sco is exceptional in that it is within the Chalco group 0.001). The partial correlation between geographic and from the Valley of Mexico and may represent a case genetic distance, while the dispersal distance for model of long-distance dispersal. Bootstrap support for most 1 is held constant, is (P 0.81); the partial clades within ssp. mexicana is generally weak, although correlation between model 1 dispersal and genetic distance, the Nobogame (98%) and Puebla (99%) clades are while geographic distance is held constant, is 0.42 strongly supported. (P 0.001). These results indicate that dispersal model An interesting question for Zea systematics is the 1 explains considerable variation that is not explained placement of the root of phylogeny for the genus. We by the clinal model (or by most other dispersal models), rooted the Zea OTU tree using Tripsacum (Figure 3). while essentially all the variation explained by the clinal When nulls in Zea and Tripsacum were treated as the model is also explained by the dispersal model. same allele (identical by descent), the root was placed Population structure: Hybridization with maize: Teo- between Z. luxurians and the perennial species such that sinte grows near maize in most locations and is capable Z. luxurians was basal to Z. mays; however, this rooting of hybridizing with maize, allowing admixture between was found in only 35% of the bootstrap samples. When maize and the teosintes to occur. To measure the degree nulls in Zea and Tripsacum were treated as distinct of admixture, we performed population structure analy- alleles (nonidentical by descent), the root was placed sis using the software program STRUCTURE (Pritchard between section Luxuriantes (the perennial species and et al. 2000). Z. luxurians, Z. diploperennis, and Z. Z. luxurians) and section Zea (Z. mays). This rooting has mays ssp. huehuetenangensis were analyzed separately with stronger support (61%); however, it is not statistically maize, assuming two clusters in each analysis. The results robust. indicate that all plants of Z. luxurians and ssp. huehuetenangensis Phylogeography of ssp. mexicana and ssp. parviglumis: have a high membership in their own cluster We compared multiple dispersal models against a clinal ( 99%) with maize contributing 1% to their ancestry. model for the geographic distribution of the Mexican This result argues that there has been little or no gene annual teosintes (ssp. mexicana and ssp. parviglumis) to flow from maize into these teosintes, although different determine which model best explains the observed pattern plant samples may produce different results. In contrast, of extant variation (Figure 4). Models (1 10 in only five of six plants of Z. diploperennis showed a high Figure 4) were chosen to test different linkages between membership ( 99%) in their own cluster, and one the two subspecies as well as different linkages between plant of Z. diploperennis (DPCUA01) showed only 77% the four population centers for ssp. parviglumis. Model membership in its own cluster plus 23% membership 1 connects ssp. parviglumis through the eastern Balsas in the maize cluster. The plant is likely a maize-diploperennis region to ssp. mexicana through a point between the hybrid or an introgressant. Central Plateau and Chalco regions. Models 5, 6, 7, and To test for admixture between maize, ssp. parviglumis, 8 are variants of this connection. Models 5, 6, and 7 and ssp. mexicana, these three taxa were evaluated tocould be envisioned as showing an origin in the south gether in a single analysis that assumed three clusters. (area E) and migration along two paths to the north. Z. mays ssp. mexicana and ssp. mays showed average mem- Models 2, 3, and 4 are all variants of a connection be- bership in their expected clusters of 92% and 96%, tween ssp. parviglumis to ssp. mexicana through the central respectively, indicating that these taxa maintain distinct Balsas area (D). Model 9 connects the subspecies gene pools despite growing sympatrically. Z. mays ssp. through areas C E and shows migrations out of the parviglumis showed an ancestry in its own cluster of only south along two paths. Model 10 connects the subspecies 68%, the majority of its remaining ancestry (27%) being Figure 3. Rooted phylogeny for 76 groups (OTUs) of individual plants using the Fitch-Margoliash method and the logtransformed proportion of shared-allele distance among 93 microsatellite loci. The numbers on the branches indicate the number of times a clade appeared in 1000 bootstrap samples and are shown for all clades with 50% bootstrap support. To locate the root for Zea, separate analyses including the outgroup, Tripsacum, but only 61 SSRs, were performed. The tree as drawn shows the placement of the root when null alleles in Tripsacum are coded as distinct (not identical by descent) from null alleles in Zea (see text). Bootstrap values from this analysis are underlined.
, race Chalco, which grows at elevations of 2300 m and indicating a significant relationship between these distance higher in the Valley of Mexico.")
8 2248 K. Fukunaga et al. Figure 4. Dispersal models for 63 OTUs of Z. mays ssp. mexicana and ssp. parviglumis. Gray circles indicate nodes of the tree, which are labeled A F. Model 1 shows the highest correlation with genetic distance. attributed to the maize cluster. This result suggests some region have a high membership in the spp. mexicana cluster: degree of admixture between spp. mays and ssp. parviglumis; PREBL3b (28%), PREBL4a (64%), PREBL3a (38%), however, it may also be a function of the recent and PREBL4b (74%). Moreover, both of the remaining divergence between these two taxa such that their gene two plants had 19% ancestry in the ssp. mexicana cluster. pools are not yet completely differentiated. These results suggest that the eastern Balsas ssp. parviglumis Examination of the STUCTURE results for individual represent either mexicana-parviglumis hybrids or perhaps plants identifies some putative hybrids. Seven ssp. mexi- an evolutionarily intermediate form between these two cana plants have 20% membership in the maize cluster: subspecies. Three other ssp. parviglumis plants have high MXCEN3 (21%), MXCEN5b (33%), MXCHA9 (23%), membership in the ssp. mexicana cluster: PRJAL17 (34%), MXCHA13a (23%), MXCHA16a (55%), MXPUE3 (26%), PRCBL03c (39%), and PRCBL45c (92%). and MXPUE4 (28%). Three ssp. mexicana plants have sub- When the populations were plotted on a map, the stantial membership in the ssp. parviglumis cluster, all of results of the structure analysis reveal some geographic them from race Central Plateau: MXCEN4b (34%), trends (Figure 5). First, the ssp. mexicana populations MXCEN22 (22%), and MXCEN23 (33%). One ssp. mexicana that show admixture with maize are all from the eastern plant (MXCEN19d) has 99% membership in ssp. portion of the ssp. mexicana range (the eastern Central parviglumis and may represent a mislabeled individual. Plateau, Valley of Mexico, and Puebla). Second, the Four of six ssp. parviglumis plants from the eastern Balsas ssp. mexicana populations that show admixture with ssp.

9 Genetic Diversity in Teosinte 2249 TABLE 2 Correlations (r) between geographic or dispersal and genetic (SSR) distance matrices Model r Model x model y r each core set is equivalent to that found in the entire sample (Tables 1 and 4). Each core set contains a number of accessions from different geographic groups that are proportional to the number of accessions for the different geographic groups in the entire sample, as revealed by nonsignificant goodness-of-fit tests (data not shown). Geographic Geographic model Model 1 geographic Model 2 geographic Model 3 geographic Model 4 geographic DISCUSSION Model 5 geographic Diversity: Estimates of gene diversity were high for Model 6 geographic all taxa, reflecting the highly polymorphic nature of Model 7 geographic SSRs. The gene diversity values reported here for the Model 8 geographic Model 9 geographic Model 10 geographic Models 1 10 are shown in Figure 4. The geographic model is the matrix of geographic or linear distances between the populations. Model x model y indicates the partial correlation of model x with genetic distance when model y is held constant. exhibit lower gene diversity than taxa with broad geographic distributions (Table 1, Figure 1). The lowest value (0.67) is found for race Nobogame, which occurs in a single valley in the state of Chihuahua. Z. diploper- ennis, which exists in only a few local populations on the Sierra de Manatlán of Jalisco, also has a very low value (0.69). Z. luxurians (0.73) and Z. mays ssp. huehuetenangensis (0.72) exhibit the next highest values. Z. mays ssp. huehuetenangensis exists in multiple populations, but all are within a single province of Guatemala. Similarly, Z. luxurians is known mostly from a restricted region of southeastern Guatemala, although it has out- lier populations in Honduras and Nicaragua. The taxa that exhibit the highest gene diversity (races Balsas and Central Plateau) have very broad geographic distributions. This overall pattern suggests that small population size or bottlenecks associated with the founding of the narrowly distributed taxa have caused the observed reductions in gene diversity. A comparison of ssp. mexicana and ssp. parviglumis indi- cates that the latter subspecies is more diverse with a slightly higher gene diversity and a far greater number of private alleles. Examination of Figure 3 also shows that branch lengths appear shorter for ssp. parviglumis than for ssp. mexicana, especially for the internal branches within the clades. Since changes in allele frequency due to genetic drift contribute substantially to genetic distance (branch length), the longer internal branches for ssp. mexicana might reflect smaller local population sizes and repeated founder events. Under these circum- stances, rare (private) alleles would be readily lost, accounting for the substantially smaller number of private alleles observed in ssp. mexicana. Consistent with the idea that ssp. mexicana populations are smaller or experi- enced repeated founder events, previous isozyme data parviglumis are from the western portion of the ssp. mexicana range. Third, four of the seven ssp. parviglumis plants that show admixture with ssp. mexicana are from the eastern Balsas region, which is situated near the ssp. mexicana populations of the Valley of Mexico, suggesting an opportunity for hybridization. Population substructure: Both Z. mays ssp. parviglumis and ssp. mexicana are broadly distributed throughout Mexico, raising the question of whether they behave as a single Hardy-Weinberg population or exhibit some degree of geographic substructuring. To address this question, we performed population structure analysis using the software program STRUCTURE (Pritchard et al. 2000). For ssp. parviglumis, the highest likelihood was obtained for K 2 clusters of plants, dividing this subspecies into a group of 32 plants that come largely from the eastern part of its range (Balsas) and a group of 18 plants that come largely from the western part ( Jalisco) (Table 3; supplemental materials at genetics.org/supplemental/). Twenty-eight plants were intermediate between these two groups. For ssp. mexicana, the highest likelihood was obtained for K 3 clusters of plants. One cluster includes the Nobogame region and allied plants from the Central Plateau, another includes the Chalco-Puebla regions and their allied plants from the Central Plateau, and the third contains other plants of the Central Plateau and the Durango regions. Only two plants were intermediate among these three groups. Core sets: We have analyzed a large number of accessions (172). For some other bioassays, researchers may need to reduce the number of samples utilized because of time-cost considerations. We have selected core sets of accessions for ssp. mexicana and ssp. parviglumis that capture the maximum number of SSR alleles for sample sizes of 12 and 25 plants (Table 4). Gene diversity in teosintes exceed those that we have previously observed (Matsuoka et al. 2002a). The reasons for this difference likely are that we used mostly dinucleotide repeat loci in the present study, whereas in our previous study we used mostly trinucleotide repeat loci (Matsuoka et al. 2002a), and the fact that dinucleotide loci have a higher mutation rate (Vigouroux et al. 2002). If one considers relative diversity among taxa, then it is apparent that those taxa with very narrow geographic distributions
. Geographic 0.283 Geographic model 1 0.032 1 0.493 Model 1 geographic 0.423 2 0.390 Model 2 geographic 0.287 3 0.365 Model 3 geographic 0.")
10 2250 K. Fukunaga et al. Figure 5. Results of the population structure analysis for ssp. mexicana (squares) and ssp. parviglumis (circles). The symbols for plants of apparent mixed ancestry based on the arbitrary criterion of possessing 80% membership in their own subspecies are enlarged. For the enlarged symbols, the symbol is color coded proportionally to its degree of ancestry from ssp. mexicana (red), ssp. parviglumis (green), and ssp. mays (yellow). show that G ST, a measure of population subdivision, is consistent with the placement of the root for Zea between 0.29 in race Central Plateau (ssp. mexicana) as compared the perennials and Z. luxurians such that Z. luxurians is to 0.16 in race Balsas (ssp. parviglumis) (Doebley et al. basal to Z. mays (Buckler and Holtsford 1996). How- 1984). ever, this rooting is less well supported than the rooting Phylogeny: Our analyses present the first comprehen- of Zea between sections Luxuriantes and Zea. sive phylogeny for Zea using a large number of nuclear In our phylogeny, the two perennial species are sister markers. Despite this large number and comprehensive taxa (Figure 3), supporting the interpretation that Z. sampling, many of the branch points within the tree perennis is an autotetraploid derived from a Z. diploperhave little statistical support. Thus, we present only a ennis-like ancestor (Doebley et al. 1987; Kato and phylogenetic hypothesis that will require verification or Lopez 1990). Our phylogeny also indicates that ssp. revision in the future. Our most strongly supported root huehuetenangensis is basal to the Mexican annual teosintes within Zea suggests an initial division of the genus into (ssp. mexicana and ssp. parviglumis), which is in agreesection Luxuriantes (Z. perennis, Z. diploperennis, and Z. ment with rdna sequences (Buckler and Holtsford luxurians) and section Zea (Z. mays sensu lato) (Figure 1996). The subspecies mexicana is derived from within 3). This rooting results when null alleles in Zea and ssp. parviglumis, rendering the latter subspecies paraphy- Tripsacum are treated as nonidentical by descent. This letic (Figure 3). assumption seem reasonable since the high frequency The paraphyly of ssp. parviglumis hinges upon the of nulls in Tripsacum (50% in each Tripsacum sample) status of the eastern Balsas populations, which appear suggests a high probability of multiple independent ori- intermediate between the two subspecies in Figure 2. gins of nulls. This rooting of Zea is consistent with a We consider two interpretations: cpdna phylogeny that has very strong statistical support (Doebley et al. 1984). If one treats the nulls in Zea and 1. If the eastern Balsas populations are interpreted as Tripsacum as identical by descent, then the SSR data are parviglumis-mexicana hybrids, then both subspecies
 as compared the perennials and Z.")
11 Genetic Diversity in Teosinte 2251 TABLE 3 Population structure groups for the Mexican annual teosintes Cluster Central Plateau Chalco Nobogame Intermediate Balsas Jalisco Intermediate Members Z. mays ssp. mexicana MXCEN05a, MXCEN06, MXCEN07, MXCEN08, MXCEN09, MXCEN10, MXCEN11, MXCEN12, MXCEN13, MXCEN14c, MXCEN15b, MXCEN16, MXCEN17, MXCEN18c, MXCEN19, MXDUR01a, MXDUR02, MXDUR03, MXDUR04 MXCEN01, MXCEN02b, MXCEN28b, MXCHA01, MXCHA02, MXCHA03, MXCHA04, MXCHA05, MXCHA06, MXCHA10, MXCHA11, MXCHA12b, MXCHA13, MXCHA14, MXCHA15, MXCHA16b, MXCHA17, MXCHA18, MXCHA19a, MXCHA20, MXCHA21, MXCHA22, MXCHA23, MXCHA24, MXCHA25, MXCHA28, MXCHA29b, MXCHA30, MXCHA32, MXCHA33, MXCHA34, MXCHA7, MXCHA9 MXCEN04a, MXCEN20, MXCEN21, MXCEN25, MXCEN26, MXCEN27d, MXCEN29, MXNOB01a, MXNOB02, MXNOB03c, MXNOB04 MXCEN04a, MXCEN29 Z. mays ssp. parviglumis PRCBL01, PRCBL02a, PRCBL03, PRCBL04a, PRCBL05, PRCBL07d, PRCBL09a, PRCBL11, PRCBL12, PRCBL19, PRCBL20, PRCBL23, PRCBL24, PRCBL25, PRCBL29, PRCBL34, PRCBL36, PRCBL48, PROAX01, PROAX02, PRSOG01, PRSOG02, PRSOG03, PRSOG04a, PRSOG05, PRSOG06, PRSOG07d, PRSOG08, PRSOG09, PRSOG10b, PRSOG11, PRSOG12 PRCBL42, PRCBL44, PRCBL51, PRJAL01, PRJAL02, PRJAL03, PRJAL04, PRJAL05, PRJAL06a, PRJAL07, PRJAL08, PRJAL09, PRJAL10, PRJAL12, PRJAL14, PRJAL15b, PRJAL16, PRJAL17 PRCBL06, PRCBL08, PRCBL10c, PRCBL13, PRCBL14, PRCBL15, PRCBL16b, PRCBL17, PRCBL26b, PRCBL27, PRCBL28, PRCBL30, PRCBL31, PRCBL32, PRCBL33, PRCBL35, PRCBL37, PRCBL38, PRCBL39, PRCBL40, PRCBL41, PRCBL43b, PRCBL45a, PRCBL46c, PRCBL47, PRCBL50, PRJAL11, PRSOG13 would be monophyletic. The population structure ture or introgression) for a sample (Pritchard et al. analysis is consistent with this interpretation since it 2000). This analysis fits a model that minimizes both identified four of six eastern Balsas plants as being Hardy-Weinberg and linkage disequilibrium within clusadmixed between ssp. parviglumis and ssp. mexicana, ters. We used this analysis to identify the degree of and the remaining two plants are both estimated to admixture between each of the teosinte taxa and maize. possess nearly 20% ssp. mexicana germplasm. Geo- We found no evidence for gene flow or admixture begraphically, the eastern Balsas populations are in be- tween Z. luxurians or ssp. huehuetenangensis and maize. tween the Chalco populations of ssp. mexicana and This result is consistent with prior field observations the central Balsas population of ssp. parviglumis, so that these taxa rarely hybridize with maize or that their an opportunity for hybridization exists. hybrids with maize are restricted to plants that invade 2. If the eastern Balsas populations are interpreted as maize fields (Wilkes 1977). We did identify one Z. the ancestral population out of which ssp. parviglumis diploperennis plant that appears to be admixed with and ssp. mexicana were derived, then ssp. parviglumis maize. This observation is congruent with previous rewould be paraphyletic. In this case, the STRUCTURE ports from isozymes (Doebley et al. 1984) and rdna analysis erroneously identifies eastern Balsas plants (Buckler and Holtsford 1996). It is also consistent as parviglumis-mexicana admixtures when in fact they with field observations that Z. diploperennis grows near represent the basal (intermediate) population from maize fields and occasionally forms hybrids with maize which both ssp. mexicana and other ssp. parviglumis (Benz et al. 1990). were derived. If this interpretation is correct, then Subspecies mexicana is the teosinte that grows most the mexicana-parviglumis ancestor grew at the middle commonly in maize fields and has been observed to elevations ( 1700 m) and spread from there to both hybridize readily with maize (Wilkes 1977). In some lower elevations (most ssp. parviglumis) and higher fields, upwards of 10% of teosinte plants are actually elevations (ssp. mexicana). maize-teosinte hybrids (Wilkes 1967). Despite this record Introgression: We performed a model-based analysis of hybridization, the STRUCTURE analysis indi- of population structure that allows one to infer both cates that maize and ssp. mexicana have very distinct the number of populations (clusters) and the degree of gene pools with an estimate of only 8% of the ssp. membership of each individual in each cluster (admix- mexicana gene pool being derived from maize. One ssp.

12 2252 K. Fukunaga et al. TABLE 4 by allele presence/absence. An interesting fact is that Core set accessions of ssp. mexicana and ssp. parviglumis two of these three ssp. mexicana plants with ssp. parvi- Z. mays ssp. parviglumis Z. mays ssp. mexicana glumis admixture occur at the low elevation (1520 and 1625 m) typical of ssp. parviglumis. Core set of 12 Core set of 25 Core set of 12 Core set of 25 Of 117 ssp. parviglumis plants, 56 were identified by the STRUCTURE analysis as being admixed with maize PRCBL07 PRCBL07 MXCEN14 MXCEN05 (i.e., possessing 20% or more maize germplasm). Rather PRCBL09 PRCBL09 MXCEN15 MXCEN06 than introgression, this result likely reflects the recent PRCBL11 PRCBL14 MXCEN20 MXCEN10 origin of maize from ssp. parviglumis such that their PRCBL16 PRCBL16 MXCEN27 MXCEN14 gene pools have not yet fully differentiated. We suggest PRCBL34 PRCBL17 MXCHA02 MXCEN15 recent origin rather than admixture since ssp. parvi- PRCBL44 PRCBL18 MXCHA13 MXCEN16 PRCBL45 PRCBL32 MXCHA15 MXCEN20 glumis (1) is known as the most pure, wild teosinte, PRCBL46 PRCBL33 MXCHA18 MXCEN24 (2) frequently grows in natural settings apart from maize PRCBL48 PRCBL34 MXCHA27 MXCEN27 fields, and (3) does not commonly hybridize with maize PRJAL16 PRCBL37 MXDUR04 MXCHA02 (Wilkes 1977). An additional 7 ssp. parviglumis plants PROAX02 PRCBL41 MXNOB04 MXCHA11 were identified as admixed with ssp. mexicana. Four of PRSOG09 PRCBL44 MXPUE1 MXCHA13 these are from the eastern Balsas region and may repre- PRCBL45 MXCHA15 sent either parviglumis-mexicana introgressants or evolu- PRCBL46 MXCHA17 PRCBL48 MXCHA18 tionary intermediates as discussed above. Another ssp. PRCBL50 MXCHA21 parviglumis plant (PRCBL45c) was assessed as possessing PRCBL51 MXCHA22 92% ssp. mexicana germplasm. This plant comes from PREBL01 MXCHA23 a population located near race Central Plateau popula- PRJAL01 MXCHA24 tions of ssp. mexicana. Two other plants from this popula- PRJAL08 MXCHA27 tion also showed relatively high admixture with ssp. mexi- PRJAL16 MXDUR04 PROAX02 MXNOB01 cana (PRCBL45b at 14% and PRCBL45d at 19%). Given PRSOG04 MXNOB03 the geographic location of these plants near the Central PRSOG09 MXNOB04 Plateau and these STRUCTURE results, it seems possi- PRSOG10 MXPUE1 ble that this population possesses a mixture of mexicanaparviglumis germplasm. Another ssp. parviglumis plant GD GD GD GD (PRJAL17) with 34% ssp. mexicana ancestry was identified GD, gene diversity. in Jalisco. This Jaliscan population is isolated from ssp. mexicana, and all other Jalisco populations showed quite low percentages of ssp. mexicana genome ( 2%). mexicana plant (MXCHA16a) was identified as pos- The origin of this intermediate type could be due to sessing 55% maize ancestry and may be a maize-teosinte long-distance dispersal. F 1. Six others have 25% maize, suggesting that some Phylogeography: The phylogeographic analysis indiof these may represent BC 1 s. If these putative F 1 and cates that dispersal model 1 fits the distribution of popu- BC 1 plants are excluded, then ssp. mexicana has only lations of the Mexican annual teosintes better than a 4% membership in the maize cluster. Genetic barriers clinal model does. This dispersal model shows a linkage to gene flow may be blocking the more complete ho- between ssp. mexicana and parviglumis through the eastmogenization of the maize and ssp. mexicana gene pools ern Balsas region (the mountains of Ixcateopan; node where they grow sympatrically (Evans and Kermicle A in Figure 4). From the eastern Balsas, ssp. parviglumis 2001). diversifies in the central Balsas region (node D) and Three ssp. mexicana plants, all from the Central Pla- spreads from there along one path into southern Guerteau, were identified as being admixed with ssp. parvi- rero (node E, Mazatlán and El Salado) and Oaxaca, glumis. This observation is difficult to explain, given and along a second path into Jalisco (node F). The that these two subspecies do not grow sympatrically. We subspecies mexicana radiates out of a point between consider three possible explanations: (1) there is long- nodes B and C, spreading along one path to the Valley distance dispersal from ssp. parviglumis to ssp. mexicana of Mexico (node C, Chalco) and Puebla, and along a populations; (2) the STRUCTURE analysis may erron- second path into the Central Plateau through node B. eously attribute admixture with maize to admixture with This phylogeographic model and our phylogenies ssp. parviglumis; or (3) the gene pools of the two subspehave several implications (Figures 2 and 3): cies are too recently diverged to be fully differentiated. The first explanation seems unlikely but cannot be disregion 1. Subspecies parviglumis originated in the eastern Balsas counted. The latter two explanations seem more likely, since populations of this region are basal to given that the gene pools of ssp. mexicana, ssp. parviglumis, other ssp. parviglumis populations (Figure 2). and maize differ more in allele frequencies than 2. Subspecies parviglumis originated at middle elevations

13 Genetic Diversity in Teosinte 2253 ( m) and then diversified into the lower wetter lower elevations in the river valleys of southern elevations. and western Mexico mostly below 1800 m (Wilkes 1967; 3. The ssp. mexicana populations from the northwestern Iltis and Doebley 1980; Doebley 1983). Z. mays ssp. part of the Central Plateau may represent the foundssp. mexicana often has red, hairy leaf sheaths, while Z. mays ing populations of this subspecies as shown in Figures parviglumis possesses mostly green and glabrous leaf 2 and 3. Interestingly, the STRUCTURE analysis indilarger sheaths. Z. mays ssp. mexicana typically has larger seed, cated that these populations show 7% admixture male spikelets, and few tassel branches as com- with ssp. parviglumis as compared to 2% for other pared to ssp. parviglumis. As shown in Figures 2 and 3, ssp. mexicana populations. However, rather than adalthough the SSR data are consistent with this ecological division, mixture, STRUCTURE may be detecting an ancestral the ssp. parviglumis populations of the eastern similarity between the gene pools of the ssp. parvitions Balsas region are intermediate. What are the implicaglumis and the ssp. mexicana populations of the northnomic of these intermediate populations from a taxo- western Central Plateau. perspective? 4. Despite their proximity and status as the two north- 1. If they are mexicana-parviglumis hybrids as discussed ern-most populations, Nobogame and Durango actuabove, then the taxonomic division is secure and ally represent independent colonizations of northit is not surprising that subspecies form occasional ern Mexico that were derived from distinct ancestral hybrid populations. populations in the Central Plateau. 2. If they are evolutionarily intermediate populations, 5. Other recent long-distance dispersal events, such as as discussed above, then ssp. parviglumis would be the movement of a race Chalco type from the Valley paraphyletic, but it is already a paraphyletic taxon of Mexico to Puebla, may have occurred. Birds or since ssp. mays was derived from within it. Moreover, humans might be the vectors for such events. the parviglumis-mexicana division would still provide Taxonomy: A taxonomy should provide a useful tool a useful taxonomic division of the Mexican annual for field biologists while reflecting the phylogenetic history teosintes into the upland and lowland forms. of the taxa as accurately as possible. The results Recently, Iltis and Benz (2000) described a new reported here generally fit the taxonomy of Zea devel- species of Zea from Nicaragua, Z. nicaraguensis. These oped by Iltis and Doebley (Doebley and Iltis 1980; authors noted that Z. nicaraguensis is similar to and Iltis and Doebley 1980; Doebley 1990b). However, closely allied with Z. luxurians. Our data confirm their there are a few ambiguities worthy of discussion. observation that Z. nicaraguensis and Z. luxurians are Doebley and Iltis (1980) divided the genus into closely related. Their evidence that it represents a new section Luxuriantes (Z. diploperennis, Z. perennis, and Z. species is based on differences in ecology and tassel and luxurians) and section Zea (Z. mays). Our best-supported plant morphology. Our data indicate that Z. nicaraphylogeny and a strongly supported cpdna-based phy- guensis is not strongly differentiated from Z. luxurians logeny (Doebley et al. 1987) are consistent with this by SSR data. In Figure 2, our three samples of Z. nicaradivision, but the SSR phylogeny lacks robust statistical guensis are all nested within Z. luxurians and the branch support. If further data demonstrate that the root of length between these samples and samples of Z. luxuri- Zea lies between the perennial and annual species, as ans are not particularly long. The status of Z. nicarasuggested by Buckler and Holtsford (1996), then guensis should be investigated by determining its crosssection Luxuriantes would be paraphyletic. Although compatibility with Z. luxurians. If they are interfertile, paraphyletic, the section Luxuriantes/section Zea split then it would be best to treat Z. nicaraguensis as a subspewould remain a reasonable division of Zea since mem- cies of Z. luxurians. bers of each section share a suite of morphological and Core sets of collections: We employed a method genetic features (Doebley 1990b). Other than its an- based on a simulated annealing algorithm (Liu 2003) nual habit, Z. luxurians has little, if anything, in common to choose core sets of 12 and 25 accessions for both ssp. with Z. mays. Paraphyletic taxa are commonly used in mexicana and ssp. parviglumis to maximize SSR diversity. taxonomy, since requiring all taxa to be strictly mono- This algorithm improves upon previously proposed alphyletic would lead to the creation of absurd taxa of no gorithms by avoiding local maxima during the search utility to field biologists. Zea already possesses one other for the global maximum (Liu 2003). The core sets that paraphyletic taxa, ssp. parviglumis, since ssp. mays is nested we defined cover broad geographic distributions of the within it. Mexican annual teosintes. For applications such as SNP Iltis and Doebley (1980) divided the Mexican an- discovery or capturing the maximum amount of allelic nual teosintes into two subspecies on the basis of ecology diversity for quantitative genetic analyses, these core and inflorescence morphology. Z. mays ssp. mexicana sets or similar ones should prove useful when available grows in the cooler, drier central highlands mostly above resources do not allow the assay of a larger number of 1800 m, while Z. mays ssp. parviglumis grows in warmer, plants.

14 2254 K. Fukunaga et al. We thank Hugh Iltis who provided many of the seeds for this non-random procedures. B. Using molecular markers. Theor. study, Jerry Kermicle for comments on the manuscript, and Korise Appl. Genet. 101: Rasmusson for help with manuscript preparation. This work was supnew teosinte from Pacific coastal Nicaragua. Novon 10: Iltis, H. H., and B. F. Benz, 2000 Zea nicaraguensis (Poaceae), a ported by National Science Foundation grant DBI Iltis, H. H., and J. F. Doebley, 1980 Taxonomy of Zea (Gramineae). II. Subspecific categories in the Zea mays complex and a generic synopsis. Am. J. Bot. 67: Jaenicke-Després, V., E. S. Buckler, B. D. Smith, M. T. P. Gilbert, LITERATURE CITED A. Cooper et al., 2003 Early allelic selection in maize as revealed by ancient DNA. Science 302: Benz, B. F., L. R. Sánchez-Velásquez and F. J. Santana-Michel, Kato, T. A., and A. R. Lopez, 1990 Chromosome knobs of the 1990 Ecology and ethnobotany of Zea diploperennis: preliminary perennial teosintes. Maydica 35: investigations. Maydica 35: Liu, K., 2002 PowerMarker: a powerful software for marker data Brown, A. H. D., 1989 Core collections: a practical approach to analysis. http: / Liu, K., 2003 Software and methods for analysing molecular genetic genetic resource management. Genome 31: marker data. Ph.D. Thesis, North Carolina State University, Ra- Buckler, E. S., IV, 1999 Phylogeographer: A tool for developing and leigh, NC. testing phylogeographic hypotheses. http: / Lukens, L. N., and J. F. Doebley, 1999 Epistatic and environmental bioinformatics/phyloindex.htm. interactions for quantitative trait loci involved in maize evolution. Buckler, E. S., IV, and T. P. Holtsford, 1996 Zea systematics: Genet. Res. 74: ribosomal ITS evidence. Mol. Biol. Evol. 13: Matsuoka, Y., S. E. Mitchell, S. Kresovich, M. M. Goodman and Dietz, E. J., 1983 Permutation tests for association between two J. F. Doebley, 2002a Microsatellites in Zea variability, patterns distance matrices. Syst. Zool. 32: of mutations, and use for evolutionary studies. Theor. Appl. Doebley, J. F., 1983 The maize and teosinte male inflorescence: a Genet. 104: numerical taxonomic study. Ann. Mo. Bot. Gard. 70: Matsuoka, Y., Y. Vigouroux, M. M. Goodman, J. Sanchez, E. S. Doebley, J. F., 1990a Molecular evidence and the evolution of Buckler et al., 2002b A single domestication for maize shown maize. Econ. Bot. 44 (Suppl. 3): by multilocus microsatellite genotyping. Proc. Natl. Acad. Sci. Doebley, J. F., 1990b Molecular systematics of Zea (Gramineae). USA 99: Maydica 35: Oritz, R., E. N. Ruiz-Tapia and A. Mujica-Sanchez, 1998 Sampling Doebley, J. F., and H. H. Iltis, 1980 Taxonomy of Zea species strategy for a core collection of Peruvian quinoa germplasm. (Gramineae). I. A subgeneric classification with key to taxa. Am. Theor. Appl. Genet. 96: J. Bot. 67: Pritchard, J. K., M. Stephens and P. Donnelly, 2000 Inference Doebley, J. F., M. M. Goodman and C. W. Stuber, 1984 Isoenzy- of population structure using multilocus genotype data. Genetics matic variation in Zea (Gramineae). Syst. Bot. 9: : Doebley, J. F., W. Renfroe and A. Blanton, 1987 Restriction site Sanchez, J., T. A. Kato, M. Aguilar, J. M. Hernandez, A. Lopez et variation in the Zea chloroplast genome. Genetics 117: al., 1998 Distribución y caracterizacion del teocintle. Instituto Evans, M. S., and J. L. Kermicle, 2001 Teosinte crossing barrier1, a Nacional de Investigaciones Forestales, Agricolas y Pecuarias, Jalilocus governing hybridization of teosinte with maize. Theor. sco, México. Appl. Genet. 103: Sanz-Alferez, S., P. SanMiguel, Y. K. Jin, P. S. Springer and J. L. Felsenstein, J., 1993 PHYLIP (Phylogeny Inference Package), Vertransposon family of maize. Genome 46: Bennetzen, 2003 Structure and evolution of the Cinful retrosion 3.5c. Department of Genetics, University of Washington, Seattle. Smouse, P. E., J. C. Long and R. R. Sokal, 1986 Multiple regression Gaut, B. S., M. Le Thierry d Ennequin, A. S. Peek and M. C. and correlation extensions of the Mantel test of matrix correspon- Sawkins, 2000 Maize as a model for the evolution of plant dence. Syst. Zool. 35: nuclear genomes. Proc. Natl. Acad. Sci. USA 97: Vigouroux, Y., J. S. Jaqueth, Y. Matsuoka, O. S. Smith, W. D. Beavis et al., 2002 Rate and pattern of mutation at microsatellite Grenier, C., P. J. Bramel-Cox, M. Noirot, K. E. Prasada Rao and P. loci in maize. Mol. Biol. Evol. 19: Hamon, 2000a Assessment of genetic diversity in three subsets Wilkes, H. G., 1967 Teosinte: The Closest Relative of Maize. Bussey constituted from the ICRISAT sorghum collection using random Institute, Harvard University, Cambridge, MA. vs. non-random procedures. A. Using morpho-agronomical and Wilkes, H. G., 1977 Hybridization of maize and teosinte in Mexico passport data. Theor. Appl. Genet. 101: and Guatemala and the improvement of maize. Econ. Bot. 31: Grenier, C.,M. Deu, S. Kresovich,P. J. Bramel-Cox and P. Hamon, b Assessment of genetic diversity in three subsets constituted from the ICRISAT sorghum collection using random vs. Communicating editor: M. Nordborg
, a ported by National Science Foundation grant DBI-0096033. Iltis, H. H., and J. F. Doebley, 1980 Taxonomy of Zea (Gramineae). II.")
Globally, about 9.7% of cancers in men are prostate cancers, and the risk of developing the
 Chapter 5 Analysis of Prostate Cancer Association Study Data 5.1 Risk factors for Prostate Cancer Globally, about 9.7% of cancers in men are prostate cancers, and the risk of developing the disease has
Biology 1406 - Notes for exam 5 - Population genetics Ch 13, 14, 15
 Biology 1406 - Notes for exam 5 - Population genetics Ch 13, 14, 15 Species - group of individuals that are capable of interbreeding and producing fertile offspring; genetically similar 13.7, 14.2 Population
Conservation genetics in Amentotaxus formosana
 Conservation genetics in Amentotaxus formosana Yu-Chung Chiang 1 1 Department of Biological Science, National Sun Yat-sen University, Kaohsiung 804 Ya-Zhu Ko 1, Mei-Hui Chen 2, Tzen-Yuh Chiang 3 2 Conservation
Summary. 16 1 Genes and Variation. 16 2 Evolution as Genetic Change. Name Class Date
 Chapter 16 Summary Evolution of Populations 16 1 Genes and Variation Darwin s original ideas can now be understood in genetic terms. Beginning with variation, we now know that traits are controlled by
BAPS: Bayesian Analysis of Population Structure
 BAPS: Bayesian Analysis of Population Structure Manual v. 6.0 NOTE: ANY INQUIRIES CONCERNING THE PROGRAM SHOULD BE SENT TO JUKKA CORANDER (first.last at helsinki.fi). http://www.helsinki.fi/bsg/software/baps/
Multivariate Analysis of Ecological Data
 Multivariate Analysis of Ecological Data MICHAEL GREENACRE Professor of Statistics at the Pompeu Fabra University in Barcelona, Spain RAUL PRIMICERIO Associate Professor of Ecology, Evolutionary Biology
DnaSP, DNA polymorphism analyses by the coalescent and other methods.
 DnaSP, DNA polymorphism analyses by the coalescent and other methods. Author affiliation: Julio Rozas 1, *, Juan C. Sánchez-DelBarrio 2,3, Xavier Messeguer 2 and Ricardo Rozas 1 1 Departament de Genètica,
Genetics and Evolution: An ios Application to Supplement Introductory Courses in. Transmission and Evolutionary Genetics
 G3: Genes Genomes Genetics Early Online, published on April 11, 2014 as doi:10.1534/g3.114.010215 Genetics and Evolution: An ios Application to Supplement Introductory Courses in Transmission and Evolutionary
A Hands-On Exercise To Demonstrate Evolution
 HOW-TO-DO-IT A Hands-On Exercise To Demonstrate Evolution by Natural Selection & Genetic Drift H ELEN J. YOUNG T RUMAN P. Y OUNG Although students learn (i.e., hear about) the components of evolution by
Documentation for structure software: Version 2.3
 Documentation for structure software: Version 2.3 Jonathan K. Pritchard a Xiaoquan Wen a Daniel Falush b 1 2 3 a Department of Human Genetics University of Chicago b Department of Statistics University
Basic Principles of Forensic Molecular Biology and Genetics. Population Genetics
 Basic Principles of Forensic Molecular Biology and Genetics Population Genetics Significance of a Match What is the significance of: a fiber match? a hair match? a glass match? a DNA match? Meaning of
Lab 2/Phylogenetics/September 16, 2002 1 PHYLOGENETICS
 Lab 2/Phylogenetics/September 16, 2002 1 Read: Tudge Chapter 2 PHYLOGENETICS Objective of the Lab: To understand how DNA and protein sequence information can be used to make comparisons and assess evolutionary
Chapter 8: Recombinant DNA 2002 by W. H. Freeman and Company Chapter 8: Recombinant DNA 2002 by W. H. Freeman and Company
 Genetic engineering: humans Gene replacement therapy or gene therapy Many technical and ethical issues implications for gene pool for germ-line gene therapy what traits constitute disease rather than just
A Primer of Genome Science THIRD
 A Primer of Genome Science THIRD EDITION GREG GIBSON-SPENCER V. MUSE North Carolina State University Sinauer Associates, Inc. Publishers Sunderland, Massachusetts USA Contents Preface xi 1 Genome Projects:
HLA data analysis in anthropology: basic theory and practice
 HLA data analysis in anthropology: basic theory and practice Alicia Sanchez-Mazas and José Manuel Nunes Laboratory of Anthropology, Genetics and Peopling history (AGP), Department of Anthropology and Ecology,
UN EXEMPLE D INFÉRENCES BAYÉSIENNES
 Journées SUCCES France Grilles Institut de Physique du Globe de Paris 5 et 6 novembre 2015 UN EXEMPLE D INFÉRENCES BAYÉSIENNES EN GÉNÉTIQUE DES POPULATIONS, LE CAS DU CRAPAUD CALAMITE (EPIDALEA CALAMITA)
Forensic DNA Testing Terminology
 Forensic DNA Testing Terminology ABI 310 Genetic Analyzer a capillary electrophoresis instrument used by forensic DNA laboratories to separate short tandem repeat (STR) loci on the basis of their size.
Bayesian Phylogeny and Measures of Branch Support
 Bayesian Phylogeny and Measures of Branch Support Bayesian Statistics Imagine we have a bag containing 100 dice of which we know that 90 are fair and 10 are biased. The
Lecture 10 Friday, March 20, 2009
 Lecture 10 Friday, March 20, 2009 Reproductive isolating mechanisms Prezygotic barriers: Anything that prevents mating and fertilization is a prezygotic mechanism. Habitat isolation, behavioral isolation,
AP Biology Essential Knowledge Student Diagnostic
 AP Biology Essential Knowledge Student Diagnostic Background The Essential Knowledge statements provided in the AP Biology Curriculum Framework are scientific claims describing phenomenon occurring in
Sequence Analysis 15: lecture 5. Substitution matrices Multiple sequence alignment
 Sequence Analysis 15: lecture 5 Substitution matrices Multiple sequence alignment A teacher's dilemma To understand... Multiple sequence alignment Substitution matrices Phylogenetic trees You first need
PRINCIPLES OF POPULATION GENETICS
 PRINCIPLES OF POPULATION GENETICS FOURTH EDITION Daniel L. Hartl Harvard University Andrew G. Clark Cornell University UniversitSts- und Landesbibliothek Darmstadt Bibliothek Biologie Sinauer Associates,
REVIEWS. Computer programs for population genetics data analysis: a survival guide FOCUS ON STATISTICAL ANALYSIS
 FOCUS ON STATISTICAL ANALYSIS REVIEWS Computer programs for population genetics data analysis: a survival guide Laurent Excoffier and Gerald Heckel Abstract The analysis of genetic diversity within species
T HREE NEW TEOSINTES ( Z EA SPP., POACEAE) FROM M É XICO 1
 FROM M É XICO 1") American Journal of Botany 98(9): 1537 1548. 2011. T HREE NEW TEOSINTES ( Z EA SPP., POACEAE) FROM M É XICO 1 J. J. Sánchez G. 2, L. De La Cruz L. 2, V. A. Vidal M. 4, J. Ron P. 2, S. Taba 3, F. Santacruz-Ruvalcaba
American Journal of Botany 98(9): 1537 1548. 2011. T HREE NEW TEOSINTES ( Z EA SPP., POACEAE) FROM M É XICO 1 J. J. Sánchez G. 2, L. De La Cruz L. 2, V. A. Vidal M. 4, J. Ron P. 2, S. Taba 3, F. Santacruz-Ruvalcaba
SeattleSNPs Interactive Tutorial: Web Tools for Site Selection, Linkage Disequilibrium and Haplotype Analysis
 SeattleSNPs Interactive Tutorial: Web Tools for Site Selection, Linkage Disequilibrium and Haplotype Analysis Goal: This tutorial introduces several websites and tools useful for determining linkage disequilibrium
Understanding by Design. Title: BIOLOGY/LAB. Established Goal(s) / Content Standard(s): Essential Question(s) Understanding(s):
 / Content Standard(s): Essential Question(s) Understanding(s):") Understanding by Design Title: BIOLOGY/LAB Standard: EVOLUTION and BIODIVERSITY Grade(s):9/10/11/12 Established Goal(s) / Content Standard(s): 5. Evolution and Biodiversity Central Concepts: Evolution
Understanding by Design Title: BIOLOGY/LAB Standard: EVOLUTION and BIODIVERSITY Grade(s):9/10/11/12 Established Goal(s) / Content Standard(s): 5. Evolution and Biodiversity Central Concepts: Evolution
STATISTICA. Clustering Techniques. Case Study: Defining Clusters of Shopping Center Patrons. and
 Clustering Techniques and STATISTICA Case Study: Defining Clusters of Shopping Center Patrons STATISTICA Solutions for Business Intelligence, Data Mining, Quality Control, and Web-based Analytics Table
Approximating the Coalescent with Recombination. Niall Cardin Corpus Christi College, University of Oxford April 2, 2007
 Approximating the Coalescent with Recombination A Thesis submitted for the Degree of Doctor of Philosophy Niall Cardin Corpus Christi College, University of Oxford April 2, 2007 Approximating the Coalescent
A combinatorial test for significant codivergence between cool-season grasses and their symbiotic fungal endophytes
 A combinatorial test for significant codivergence between cool-season grasses and their symbiotic fungal endophytes Ruriko Yoshida Dept. of Statistics University of Kentucky Joint work with C.L. Schardl,
Introduction to Phylogenetic Analysis
 Subjects of this lecture Introduction to Phylogenetic nalysis Irit Orr 1 Introducing some of the terminology of phylogenetics. 2 Introducing some of the most commonly used methods for phylogenetic analysis.
Why Taking This Course? Course Introduction, Descriptive Statistics and Data Visualization. Learning Goals. GENOME 560, Spring 2012
 Why Taking This Course? Course Introduction, Descriptive Statistics and Data Visualization GENOME 560, Spring 2012 Data are interesting because they help us understand the world Genomics: Massive Amounts
Environmental Remote Sensing GEOG 2021
 Environmental Remote Sensing GEOG 2021 Lecture 4 Image classification 2 Purpose categorising data data abstraction / simplification data interpretation mapping for land cover mapping use land cover class
Marker-Assisted Backcrossing. Marker-Assisted Selection. 1. Select donor alleles at markers flanking target gene. Losing the target allele
 Marker-Assisted Backcrossing Marker-Assisted Selection CS74 009 Jim Holland Target gene = Recurrent parent allele = Donor parent allele. Select donor allele at markers linked to target gene.. Select recurrent
The origin and diversity of maize in the american continent
 The origin and diversity of maize in the american continent www.greenpeace.org.mx José Antonio Serratos Hernández Universidad Autónoma de la Ciudad de México This document was written for Greenpeace Mexico
TARGETED INTROGRESSION OF COTTON FIBER QUALITY QTLs USING MOLECULAR MARKERS
 TARGETED INTROGRESSION OF COTTON FIBER QUALITY QTLs USING MOLECULAR MARKERS J.-M. Lacape, T.-B. Nguyen, B. Hau, and M. Giband CIRAD-CA, Programme Coton, TA 70/03, Avenue Agropolis, 34398 Montpellier Cede
20-10-2015. DNA profiles in DUS testing of grasses. A new UPOV model? Lolium perenne (perennial ryegrass) Pilot study (2014)
 Pilot study (2014)") 2--25 DNA profiles in DUS testing of grasses A new UPOV model? Henk Bonthuis Naktuinbouw Aanvragersoverleg Rvp Wageningsche Berg 9 oktober 25 Lolium perenne (perennial ryegrass) Challenges Genetically
2--25 DNA profiles in DUS testing of grasses A new UPOV model? Henk Bonthuis Naktuinbouw Aanvragersoverleg Rvp Wageningsche Berg 9 oktober 25 Lolium perenne (perennial ryegrass) Challenges Genetically
Molecular Clocks and Tree Dating with r8s and BEAST
 Integrative Biology 200B University of California, Berkeley Principals of Phylogenetics: Ecology and Evolution Spring 2011 Updated by Nick Matzke Molecular Clocks and Tree Dating with r8s and BEAST Today
Molecular typing of VTEC: from PFGE to NGS-based phylogeny
 Molecular typing of VTEC: from PFGE to NGS-based phylogeny Valeria Michelacci 10th Annual Workshop of the National Reference Laboratories for E. coli in the EU Rome, November 5 th 2015 Molecular typing
Genetic evidence reveals temporal change in hybridization
 Molecular Ecology (2008) 17, 1998 2011 doi: 10.1111/j.1365-294X.2008.03723.x Genetic evidence reveals temporal change in hybridization Blackwell Publishing Ltd patterns in a wild baboon population J. TUNG,*
Simulation Model of Mating Behavior in Flies
 Simulation Model of Mating Behavior in Flies MEHMET KAYIM & AYKUT Ecological and Evolutionary Genetics Lab. Department of Biology, Middle East Technical University International Workshop on Hybrid Systems
Introduction to Bioinformatics AS 250.265 Laboratory Assignment 6
 Introduction to Bioinformatics AS 250.265 Laboratory Assignment 6 In the last lab, you learned how to perform basic multiple sequence alignments. While useful in themselves for determining conserved residues
Extensive Cryptic Diversity in Indo-Australian Rainbowfishes Revealed by DNA Barcoding
 Extensive Cryptic Diversity in Indo-Australian Rainbowfishes Revealed by DNA Barcoding Kadarusman, Hubert N, Hadiaty R.K #, Sudarto, Paradis E., Pouyaud L. Akademi Perikanan Sorong, Papua Barat, Indonesia
Integrating DNA Motif Discovery and Genome-Wide Expression Analysis. Erin M. Conlon
 Integrating DNA Motif Discovery and Genome-Wide Expression Analysis Department of Mathematics and Statistics University of Massachusetts Amherst Statistics in Functional Genomics Workshop Ascona, Switzerland
Biology Behind the Crime Scene Week 4: Lab #4 Genetics Exercise (Meiosis) and RFLP Analysis of DNA
 and RFLP Analysis of DNA") Page 1 of 5 Biology Behind the Crime Scene Week 4: Lab #4 Genetics Exercise (Meiosis) and RFLP Analysis of DNA Genetics Exercise: Understanding how meiosis affects genetic inheritance and DNA patterns
Page 1 of 5 Biology Behind the Crime Scene Week 4: Lab #4 Genetics Exercise (Meiosis) and RFLP Analysis of DNA Genetics Exercise: Understanding how meiosis affects genetic inheritance and DNA patterns
Statistics Graduate Courses
 Statistics Graduate Courses STAT 7002--Topics in Statistics-Biological/Physical/Mathematics (cr.arr.).organized study of selected topics. Subjects and earnable credit may vary from semester to semester.
Deterministic computer simulations were performed to evaluate the effect of maternallytransmitted
 Supporting Information 3. Host-parasite simulations Deterministic computer simulations were performed to evaluate the effect of maternallytransmitted parasites on the evolution of sex. Briefly, the simulations
Clustering & Visualization
 Chapter 5 Clustering & Visualization Clustering in high-dimensional databases is an important problem and there are a number of different clustering paradigms which are applicable to high-dimensional data.
Rules and Format for Taxonomic Nucleotide Sequence Annotation for Fungi: a proposal
 Rules and Format for Taxonomic Nucleotide Sequence Annotation for Fungi: a proposal The need for third-party sequence annotation Taxonomic names attached to nucleotide sequences occasionally need to be
Genetic approaches for mobilizing gene bank variation. Prashant Vikram CRP Wheat Representative CIMMYT
 Genetic approaches for mobilizing gene bank variation Prashant Vikram CRP Wheat Representative CIMMYT Why we need gene bank? Rht1 & 2: Japanese dwarf landrace wheat Daruma Rht 8 : Japanese landrace Akakomugi
GAW 15 Problem 3: Simulated Rheumatoid Arthritis Data Full Model and Simulation Parameters
 GAW 15 Problem 3: Simulated Rheumatoid Arthritis Data Full Model and Simulation Parameters Michael B Miller , Michael Li , Gregg Lind , Soon-Young
SNPbrowser Software v3.5
 Product Bulletin SNP Genotyping SNPbrowser Software v3.5 A Free Software Tool for the Knowledge-Driven Selection of SNP Genotyping Assays Easily visualize SNPs integrated with a physical map, linkage disequilibrium
One essential problem for population genetics is to characterize
 Posterior predictive checks to quantify lack-of-fit in admixture models of latent population structure David Mimno a, David M. Blei b, and Barbara E. Engelhardt c,1 a Department of Information Science,
Protein Sequence Analysis - Overview -
 Protein Sequence Analysis - Overview - UDEL Workshop Raja Mazumder Research Associate Professor, Department of Biochemistry and Molecular Biology Georgetown University Medical Center Topics Why do protein
MOLECULAR MARKERS AND THEIR APPLICATIONS IN CEREALS BREEDING
 MOLECULAR MARKERS AND THEIR APPLICATIONS IN CEREALS BREEDING Viktor Korzun Lochow-Petkus GmbH, Grimsehlstr.24, 37574 Einbeck, Germany korzun@lochow-petkus.de Summary The development of molecular techniques
Tutorial for proteome data analysis using the Perseus software platform
 Tutorial for proteome data analysis using the Perseus software platform Laboratory of Mass Spectrometry, LNBio, CNPEM Tutorial version 1.0, January 2014. Note: This tutorial was written based on the information
A guide to the analysis of KASP genotyping data using cluster plots
 extraction sequencing genotyping extraction sequencing genotyping extraction sequencing genotyping extraction sequencing A guide to the analysis of KASP genotyping data using cluster plots Contents of
Kathleen Gray Ferris Museum of Vertebrate Zoology 3101 Valley Life Sciences Building UC Berkeley Berkeley, CA 94720-3161 kgf7@berkeley.
 Kathleen Gray Ferris Museum of Vertebrate Zoology 3101 Valley Life Sciences Building UC Berkeley Berkeley, CA 94720-3161 kgf7@berkeley.edu Area of Specialization Ecological and Evolutionary Genetics of
Journal of Statistical Software
 JSS Journal of Statistical Software October 2006, Volume 16, Code Snippet 3. http://www.jstatsoft.org/ LDheatmap: An R Function for Graphical Display of Pairwise Linkage Disequilibria between Single Nucleotide
Y Chromosome Markers
 Y Chromosome Markers Lineage Markers Autosomal chromosomes recombine with each meiosis Y and Mitochondrial DNA does not This means that the Y and mtdna remains constant from generation to generation Except
DNA Sequence Alignment Analysis
 Analysis of DNA sequence data p. 1 Analysis of DNA sequence data using MEGA and DNAsp. Analysis of two genes from the X and Y chromosomes of plant species from the genus Silene The first two computer classes
A successful market segmentation initiative answers the following critical business questions: * How can we a. Customer Status.
 MARKET SEGMENTATION The simplest and most effective way to operate an organization is to deliver one product or service that meets the needs of one type of customer. However, to the delight of many organizations
Data Mining Cluster Analysis: Basic Concepts and Algorithms. Lecture Notes for Chapter 8. Introduction to Data Mining
 Data Mining Cluster Analysis: Basic Concepts and Algorithms Lecture Notes for Chapter 8 Introduction to Data Mining by Tan, Steinbach, Kumar Tan,Steinbach, Kumar Introduction to Data Mining 4/8/2004 Hierarchical
ASSIsT: An Automatic SNP ScorIng Tool for in and out-breeding species Reference Manual
 ASSIsT: An Automatic SNP ScorIng Tool for in and out-breeding species Reference Manual Di Guardo M, Micheletti D, Bianco L, Koehorst-van Putten HJJ, Longhi S, Costa F, Aranzana MJ, Velasco R, Arús P, Troggio
Principles of Evolution - Origin of Species
 Theories of Organic Evolution X Multiple Centers of Creation (de Buffon) developed the concept of "centers of creation throughout the world organisms had arisen, which other species had evolved from X
SNP Essentials The same SNP story
 HOW SNPS HELP RESEARCHERS FIND THE GENETIC CAUSES OF DISEASE SNP Essentials One of the findings of the Human Genome Project is that the DNA of any two people, all 3.1 billion molecules of it, is more than
Borges, J. L. 1998. On exactitude in science. P. 325, In, Jorge Luis Borges, Collected Fictions (Trans. Hurley, H.) Penguin Books.
 Penguin Books.") ... In that Empire, the Art of Cartography attained such Perfection that the map of a single Province occupied the entirety of a City, and the map of the Empire, the entirety of a Province. In time, those
... In that Empire, the Art of Cartography attained such Perfection that the map of a single Province occupied the entirety of a City, and the map of the Empire, the entirety of a Province. In time, those
Name: Class: Date: Multiple Choice Identify the choice that best completes the statement or answers the question.
 Name: Class: Date: Chapter 17 Practice Multiple Choice Identify the choice that best completes the statement or answers the question. 1. The correct order for the levels of Linnaeus's classification system,
BASIC STATISTICAL METHODS FOR GENOMIC DATA ANALYSIS
 BASIC STATISTICAL METHODS FOR GENOMIC DATA ANALYSIS SEEMA JAGGI Indian Agricultural Statistics Research Institute Library Avenue, New Delhi-110 012 seema@iasri.res.in Genomics A genome is an organism s
Required and Recommended Supporting Information for IUCN Red List Assessments
 Required and Recommended Supporting Information for IUCN Red List Assessments This is Annex 1 of the Rules of Procedure IUCN Red List Assessment Process 2013-2016 as approved by the IUCN SSC Steering Committee
I. Genes found on the same chromosome = linked genes
 Genetic recombination in Eukaryotes: crossing over, part 1 I. Genes found on the same chromosome = linked genes II. III. Linkage and crossing over Crossing over & chromosome mapping I. Genes found on the
Global Seasonal Phase Lag between Solar Heating and Surface Temperature
 Global Seasonal Phase Lag between Solar Heating and Surface Temperature Summer REU Program Professor Tom Witten By Abstract There is a seasonal phase lag between solar heating from the sun and the surface
DATA MINING CLUSTER ANALYSIS: BASIC CONCEPTS
 DATA MINING CLUSTER ANALYSIS: BASIC CONCEPTS 1 AND ALGORITHMS Chiara Renso KDD-LAB ISTI- CNR, Pisa, Italy WHAT IS CLUSTER ANALYSIS? Finding groups of objects such that the objects in a group will be similar
Basics of Marker Assisted Selection
 asics of Marker ssisted Selection Chapter 15 asics of Marker ssisted Selection Julius van der Werf, Department of nimal Science rian Kinghorn, Twynam Chair of nimal reeding Technologies University of New
Data for phylogenetic analysis
 Data for phylogenetic analysis The data that are used to estimate the phylogeny of a set of tips are the characteristics of those tips. Therefore the success of phylogenetic inference depends in large
Service courses for graduate students in degree programs other than the MS or PhD programs in Biostatistics.
 Course Catalog In order to be assured that all prerequisites are met, students must acquire a permission number from the education coordinator prior to enrolling in any Biostatistics course. Courses are
RETRIEVING SEQUENCE INFORMATION. Nucleotide sequence databases. Database search. Sequence alignment and comparison
 RETRIEVING SEQUENCE INFORMATION Nucleotide sequence databases Database search Sequence alignment and comparison Biological sequence databases Originally just a storage place for sequences. Currently the
Diablo Valley College Catalog 2014-2015
 Mathematics MATH Michael Norris, Interim Dean Math and Computer Science Division Math Building, Room 267 Possible career opportunities Mathematicians work in a variety of fields, among them statistics,
Commonly Used STR Markers
 Commonly Used STR Markers Repeats Satellites 100 to 1000 bases repeated Minisatellites VNTR variable number tandem repeat 10 to 100 bases repeated Microsatellites STR short tandem repeat 2 to 6 bases repeated
Inference for two Population Means
 Inference for two Population Means Bret Hanlon and Bret Larget Department of Statistics University of Wisconsin Madison October 27 November 1, 2011 Two Population Means 1 / 65 Case Study Case Study Example
Forensic Statistics. From the ground up. 15 th International Symposium on Human Identification
 Forensic Statistics 15 th International Symposium on Human Identification From the ground up UNTHSC John V. Planz, Ph.D. UNT Health Science Center at Fort Worth Why so much attention to statistics? Exclusions
Gene Mapping Techniques
 Gene Mapping Techniques OBJECTIVES By the end of this session the student should be able to: Define genetic linkage and recombinant frequency State how genetic distance may be estimated State how restriction
Visualization of Phylogenetic Trees and Metadata
 Visualization of Phylogenetic Trees and Metadata November 27, 2015 Sample to Insight CLC bio, a QIAGEN Company Silkeborgvej 2 Prismet 8000 Aarhus C Denmark Telephone: +45 70 22 32 44 www.clcbio.com support-clcbio@qiagen.com
Big Data, Socio- Psychological Theory, Algorithmic Text Analysis, and Predicting the Michigan Consumer Sentiment Index
 Big Data, Socio- Psychological Theory, Algorithmic Text Analysis, and Predicting the Michigan Consumer Sentiment Index Rickard Nyman *, Paul Ormerod Centre for the Study of Decision Making Under Uncertainty,
Molecular and Cell Biology Laboratory (BIOL-UA 223) Instructor: Ignatius Tan Phone: 212-998-8295 Office: 764 Brown Email: ignatius.tan@nyu.
 Instructor: Ignatius Tan Phone: 212-998-8295 Office: 764 Brown Email: ignatius.tan@nyu.") Molecular and Cell Biology Laboratory (BIOL-UA 223) Instructor: Ignatius Tan Phone: 212-998-8295 Office: 764 Brown Email: ignatius.tan@nyu.edu Course Hours: Section 1: Mon: 12:30-3:15 Section 2: Wed: 12:30-3:15
Molecular and Cell Biology Laboratory (BIOL-UA 223) Instructor: Ignatius Tan Phone: 212-998-8295 Office: 764 Brown Email: ignatius.tan@nyu.edu Course Hours: Section 1: Mon: 12:30-3:15 Section 2: Wed: 12:30-3:15
Network Protocol Analysis using Bioinformatics Algorithms
 Network Protocol Analysis using Bioinformatics Algorithms Marshall A. Beddoe Marshall_Beddoe@McAfee.com ABSTRACT Network protocol analysis is currently performed by hand using only intuition and a protocol
Evolution (18%) 11 Items Sample Test Prep Questions
 11 Items Sample Test Prep Questions") Evolution (18%) 11 Items Sample Test Prep Questions Grade 7 (Evolution) 3.a Students know both genetic variation and environmental factors are causes of evolution and diversity of organisms. (pg. 109 Science
Evolution (18%) 11 Items Sample Test Prep Questions Grade 7 (Evolution) 3.a Students know both genetic variation and environmental factors are causes of evolution and diversity of organisms. (pg. 109 Science
Data Integration. Lectures 16 & 17. ECS289A, WQ03, Filkov
 Data Integration Lectures 16 & 17 Lectures Outline Goals for Data Integration Homogeneous data integration time series data (Filkov et al. 2002) Heterogeneous data integration microarray + sequence microarray
Name Class Date. binomial nomenclature. MAIN IDEA: Linnaeus developed the scientific naming system still used today.
 Section 1: The Linnaean System of Classification 17.1 Reading Guide KEY CONCEPT Organisms can be classified based on physical similarities. VOCABULARY taxonomy taxon binomial nomenclature genus MAIN IDEA:
Typing in the NGS era: The way forward!
 Typing in the NGS era: The way forward! Valeria Michelacci NGS course, June 2015 Typing from sequence data NGS-derived conventional Multi Locus Sequence Typing (University of Warwick, 7 housekeeping genes)
Clustering. 15-381 Artificial Intelligence Henry Lin. Organizing data into clusters such that there is
 Clustering 15-381 Artificial Intelligence Henry Lin Modified from excellent slides of Eamonn Keogh, Ziv Bar-Joseph, and Andrew Moore What is Clustering? Organizing data into clusters such that there is
Agriculture between High Tech and Organics
 Agriculture between High Tech and Organics Denver AAAS 2003 Symposium February 15 Klaus Ammann klaus.ammann@ips.unibe.ch www.bio-scope.org www.academia-engelberg.ch Natural geneflow with its many possibilities
Heredity - Patterns of Inheritance
 Heredity - Patterns of Inheritance Genes and Alleles A. Genes 1. A sequence of nucleotides that codes for a special functional product a. Transfer RNA b. Enzyme c. Structural protein d. Pigments 2. Genes
. Learn the number of classes and the structure of each class using similarity between unlabeled training patterns
 Outline Part 1: of data clustering Non-Supervised Learning and Clustering : Problem formulation cluster analysis : Taxonomies of Clustering Techniques : Data types and Proximity Measures : Difficulties
These Maps Are For The Birds
 These Maps Are For The Birds Students will study New York State Breeding Bird Atlas maps to learn where different bird species nest and how their distributions have changed over time. Objectives: Students
Prediction of Stock Performance Using Analytical Techniques
 136 JOURNAL OF EMERGING TECHNOLOGIES IN WEB INTELLIGENCE, VOL. 5, NO. 2, MAY 2013 Prediction of Stock Performance Using Analytical Techniques Carol Hargreaves Institute of Systems Science National University
Population Genetics and Multifactorial Inheritance 2002
 Population Genetics and Multifactorial Inheritance 2002 Consanguinity Genetic drift Founder effect Selection Mutation rate Polymorphism Balanced polymorphism Hardy-Weinberg Equilibrium Hardy-Weinberg Equilibrium
Practice Questions 1: Evolution
 Practice Questions 1: Evolution 1. Which concept is best illustrated in the flowchart below? A. natural selection B. genetic manipulation C. dynamic equilibrium D. material cycles 2. The diagram below
Biotechnology: DNA Technology & Genomics
 Chapter 20. Biotechnology: DNA Technology & Genomics 2003-2004 The BIG Questions How can we use our knowledge of DNA to: diagnose disease or defect? cure disease or defect? change/improve organisms? What
Genetic modification for cell pedigree labels to aid disease treatment
 Genetic modification for cell pedigree labels to aid disease treatment Ronald L. Rivest rivest@mit.edu March 10, 2014 Abstract We suggest modifying the human genome in order to aid in the treatment of
SPECIAL PERTURBATIONS UNCORRELATED TRACK PROCESSING
 AAS 07-228 SPECIAL PERTURBATIONS UNCORRELATED TRACK PROCESSING INTRODUCTION James G. Miller * Two historical uncorrelated track (UCT) processing approaches have been employed using general perturbations