Small Business Study: A Profile of Small Businesses in San Antonio Metro Area
|
|
|
- Peregrine Briggs
- 8 years ago
- Views:
Transcription
1 Small Business Study: A Profile of Small Businesses in San Antonio Metro Area Prepared by Maya Halebic, M.B.A. Senior Economist Steve Nivin, Ph.D. Director & Chief Economist February, 2012 The SABÉR Research Institute is an alliance between St. Mary s University and the San Antonio Hispanic Chamber of Commerce. 0

2 Executive Summary This report, prepared by the SABÉR Research Institute, gives an in-depth analysis of the importance of small business firms in the San Antonio Metropolitan Statistical Area (MSA) and provides a summary of the demographic and economic characteristics of selected industries in the area. Major industry employers include Aerospace, Health Care & Bioscience, Hospitality, Information Technology & Security, New Energy, Retail Trade, Oil & Gas, and Construction. Hospitality was the leading industry employer in the San Antonio metropolitan area, employing an estimated total of 80,469 workers in The industry with the most small business establishments is Retail Trade, with a total of 8,585 firms. The following are key findings of the study: According to the U.S. Census Bureau, small business establishments with less than 100 employees represent 97% of all employer firms both in the state of Texas and in the San Antonio MSA. Based on the cost of the state tax system on small businesses, Texas was ranked as one of the best states in The top three industries in the state of Texas reporting the greatest percent increases in small business firms over the period are Finance and Insurance (32.87%), followed by Accommodation and Food Services (28.66%), and Health Care and Social Assistance (28.31%). The leading three industries in the San Antonio MSA with the most significant relative increases in establishments from 1998 to 2009 include Real Estate, Rental and Leasing (41.17%), Accommodation and Food Services (39.15%), and Health Care and Social Assistance (37.72%). Small business owners report the following regulations as the main challenges creating the most difficulty for their businesses: access to capital, tax, health insurance, and industry-specific licensing and permitting. With an estimated total of 204 small business establishments, the Aerospace industry in the San Antonio metropolitan area employed 2,141 workers in 2011 and generated roughly $466.5 million in annual sales revenue. 1

3 Although there was a slight dip in growth between 2008 and 2010, Texas was the only U.S. state that added aerospace manufacturing jobs. From 2000 to 2010, the Aerospace industry in Texas grew by 75%, making the state one of the top three states in aerospace manufacturing. In 2011, Health Care & Bioscience industry was the #3 industry employer in the San Antonio MSA, employing a total of 52,361 workers. Furthermore, the industry generated an annual sales volume of $8.4 billion and had over 6,000 small business establishments. One of every six San Antonio employees works in the Health Care & Bioscience industry. From 1999 to 2009, the number of net new jobs in the industry increased by 35%. The Hospitality industry was the #1 employer in the San Antonio metropolitan area in 2011, employing well over 80,000 workers. With an estimated 5,897 small business establishments, the industry generated a total of $4.6 billion in annual sales revenue. From 1998 to 2008, employment in the Hospitality industry in the San Antonio MSA increased by 26%. The restaurant sector remained the dominant sector throughout the decade. In 2008, the Hospitality industry employed one out of every eight workers in the San Antonio MSA. With a total of 787 small business firms, the Information Technology & Security industry employed an estimated 5,327 workers in 2011 in the San Antonio metropolitan area and generated $1.6 billion in annual sales. Between 1998 and 2008, the economic impact of the industry grew by 100%, from $4 billion in 1998 to $8 billion in In 2008, the state of Texas ranked #2 nationwide in the number of high-tech workers, in high-tech employment growth, in the size of high-tech payroll, and in the number of high-tech establishments. The New Energy industry in the San Antonio MSA employed 735 workers in 2011, had a total of 6,985 small business establishments, and generated an estimated $2.1 billion in sales. In 2009, Texas was ranked #2 nationwide in the number of renewable energy jobs, with 15% growth from 1998 to Between now and 2035, the Energy Information 2

4 Administration (EIA) estimates the strongest growth in fuel use to occur in renewable fuels used to generate electricity and to power vehicles. The Retail Trade industry was the #2 employer in the San Antonio metropolitan area in 2011, employing an estimated total of 59,596 workers. The industry had 8,585 small business firms and generated a total of $16.6 billion in sales revenue. Similar to the Retail Trade industry in the San Antonio MSA, the industry is also the #2 employer statewide. Between 1998 and 2009, the total number of employees in Texas and in the San Antonio metropolitan area grew by 18% and 29%, respectively. Since December 2009, Retail Trade has added 1,500 new jobs and has gained 2,220 jobs in the San Antonio MSA. This is equivalent to an annual growth rate of 2.2%, which is mainly a result of seasonal hiring. In 2011, the Oil & Gas industry in the San Antonio MSA employed a total of 428 workers, had over 3,500 small business establishments, and generated an estimated $1.2 billion in sales. According to the Texas Petro Index (TPI), employment in the state s Oil & Gas industry has rebounded to its pre-recession levels. In June 2011, Texas employed an estimated 224,200 workers in the industry; this is more than the 223,200 at the height of the last energy boom in October 2008 and almost 15% more than in June of the previous year. During 2011, the Oil & Gas industry in Texas added more than 28,000 jobs; this is nearly 13% of all jobs added to the state s economy. A total of 4,016 small businesses in the Construction industry employed over 28,000 workers in the San Antonio MSA in 2011 and generated an estimated total of $6.7 billion in sales. While the state s Construction industry lost more than 17% of its workforce during the recession, the industry has recovered nearly one-third of all the jobs lost since the industry started growing again in the middle of Most of the jobs added have been in heavy and civil construction, and utility construction. While most sectors of the industry have grown, highway, street, and bridge construction have continued to see declines. 3

5 Introduction The purpose of the present study is to discuss the importance of small businesses in the state of Texas as well as in the San Antonio MSA. In other words, this study intends to depict the demographic characteristics of small businesses and their economic contributions to the state and to the San Antonio MSA. This study is intended to serve as an informational reference, a planning resource, and a catalyst for discussion. Methodology This study provides a profile of small business establishments in the San Antonio MSA. The San Antonio MSA is an eight-county region that includes Bexar, Guadalupe, Comal, Medina, Atascosa, Wilson, Kendall, and Bandera counties. To discuss the importance of small business firms, describe their demographic characteristics, and point out the key opportunities and challenges such firms are facing, existing literature on small businesses at the local, state, and national level was reviewed. To define small business establishments, the Governor s office definition of small businesses was used, which focuses on firms with less than 100 employees. Data provided by the U.S. Census Bureau were used to summarize the demographic characteristics of small business firms for the state of Texas and the San Antonio MSA for the period Furthermore, the U.S. Census Bureau data were used to show the growth trends of small businesses for the top ten industries in Texas and in the San Antonio metro area between 1998 and Profiles of small business establishments for selected industries in the San Antonio MSA were created using 2011 data provided by InfoUSA. NAICS codes were used to create an industry cluster for each industry. The selection of industries for which industry clusters were created was jointly agreed upon by the research team of the SABÉR Research Institute and the City of San Antonio, International and Economic Development Department. Those industries include Aerospace, Health Care & Bioscience, Hospitality, Information Technology & Security, New Energy, Retail Trade, Oil & Gas, and Construction. Importance of Small Businesses Small businesses are an integral part of the regional social and economic landscape. Research shows that small businesses and entrepreneurship respectively play a vital role in innovation, 4

6 regional economic development, and the pursuit of new markets. 1 In fact, Glaeser and Kerr of Harvard Business School show that regional economic growth is highly correlated with the presence of many small, entrepreneurial employers. 2 According to the U.S. Census Bureau, small businesses with less than 100 employees represent 97% of all employer firms in Texas as well as in the metro area of San Antonio. Small businesses are the key drivers of job creation statewide and contribute positively to the economic climate that helps attract employers of all sizes to the state 3. In April 2011, the Small Business and Entrepreneurship Council ranked Texas as one the best states for small businesses in their Business Tax Index 2011: Best to Worst State Tax Systems for Entrepreneurship and Small Business report. Texas ranked second in the index based on the cost of the state tax system on small businesses 4. Definition and Characteristics of Small Businesses In Texas and San Antonio MSA In trying to gain a better understanding of small businesses impact and their contributions to the regional economy, the present study uses a Governor s office definition of small businesses which focuses on firms with less than 100 employees who tend to be associated with the entrepreneurial spirit of the American economy. 5 Using this definition for the state of Texas, the data show that small businesses with less than 100 employees hired close to 3 million workers in 2008 (Table 1). These small businesses numbered 508,193 and represented approximately 97% of the 522,336 private firms for that year and their roughly 3 million jobs accounted for 32% of the 9.2 million private, non-farm employment in the state. 6 1 Looking Ahead: Opportunities and Challenges for Entrepreneurship and Small Business Owners, by Chad Moutray, in Small Business Research Summary, Small Business Administration, Office of Advocacy, October The Secret to Job Growth: Think Small, by Edward L. Glaeser and William R. Kerr, in Harvard Business Review, July Small Businesses Represent True Vibrancy of Texas Economy, Governor Rick Perry, NFIB Texas Small Business Day Luncheon, March 2, 2011, 4 Business Tax Index 2011: Best to Worst State Tax Systems for Entrepreneurship and Small Business, by Raymond J. Keating, in Small Business and Entrepreneurship Council, April Taken from the Office of the Governor Web site on May 11, The U.S. Census Bureau through the Statistics of U.S. Businesses (SUSB) provides national, state, and metropolitan data on enterprises by size and industry. An enterprise is a business with one or more establishments under common ownership or control. For the purposes of the present study, a firm is defined as part of an enterprise tabulated in a particular industry, state, or metropolitan area. Taken from on May 11,

7 Table 1: Texas Small Business Facts ( ) Number of Establishments Number of employer firms with less than 100 employees 508, , ,410 Total number of employer firms 522, , ,875 Employment Employment by firms with less than 100 employees 2,954,925 2,738,283 2,618,469 Total employment 9,231,955 8,051,148 7,570,820 Source: U.S. Census Bureau, County Business Patterns ; U.S. Census Bureau, Statistics of U.S. Businesses: 2008, All Industries, Texas Figure 1 shows the number and percentage of small business establishments in Texas in 2008 as broken down by employee size range. According to the U.S. Census Bureau, a majority (51%) of small businesses in Texas employ less than five employees. Figure 1: Small Business Establishments Number and Percentage of Establishments by Employee Size Range in Texas, ,289 50,778 (3.31%) (9.72%) 70,470 (13.49%) 103,124 (19.74%) 266,532 (51.03%) Source: U.S. Census Bureau, County Business Patterns 2008 The number of small firms in Texas with less than 100 employees increased by 12.58% since 1998 with an annual average percent change in growth of 1.19% during the period Employment by firms with less than 100 employees increased by 12.85% since During the period , employment by firms with less than 100 employees increased by 1.22% annually. 6
 of small businesses in Texas employ less than five employees.")
8 Appendix I shows historical data on businesses in Texas broken down by employment size of the enterprise. All data are for the period and were taken from the U.S. Census Bureau, County Business Patterns 7. Table 2 shows a summary of the data for the number of small business establishments as well as employment for the San Antonio Metropolitan Statistical Area. Small businesses with less than 100 employees hired over 200,000 workers in These small firms accounted for roughly 40,000 and represented 97% of the 40,535 private firms for that year. Approximately 227,000 jobs accounted for 31% of the 735,867 private, non-farm employment in the San Antonio MSA. Table 2: San Antonio Metropolitan Statistical Area (MSA) Small Business Facts ( ) Number of Establishments Number of employer firms with less than 100 employees 39,403 36,051 32,206 Total number of employer firms 40,535 37,015 33,047 Employment Employment by firms with less than 100 employees 226, , ,812 Total employment 735, , ,897 Source: U.S. Census Bureau, County Business Patterns ; U.S. Census Bureau, Statistics of U.S. Businesses: 2008, 2008 Annual Tabulations, Metropolitan Statistical Areas (MSA s) Figure 2 shows the number and percentage of establishments by employee size range in the San Antonio MSA in According to the U.S. Census Bureau, almost 50% of all small business establishments employ less than five employees. Figure 2: Small Business Establishments Number and Percentage of Establishments by Employee Size Range in San Antonio MSA, ,617 (13.86%) 3,983 (9.83%) 1,477 (3.64%) 8,113 (20.01%) 20,213 (49.87%) Source: U.S. Census Bureau, County Business Patterns

9 The number of small firms with less than 100 employees increased by 22.35% since 1998 with an annual average percent change in growth of 2.04% during the period Employment by firms with less than 100 employees increased by 23.90% since During the period , employment by firms with less than 100 employees increased by 2.17% annually. Appendix II shows historical data on businesses in the San Antonio MSA broken down by employment size of the enterprise. All data are for the period and were taken from the U.S. Census Bureau, County Business Patterns. 7 According to InfoUSA, there were an estimated 54,944 small businesses in the San Antonio metropolitan area employing approximately 446,207 workers. Figure 3 shows a distribution of total employment and number of establishments by selected industries. The top three industries in terms of employment are Hospitality employing a total of 80,469 workers, followed by Retail Trade (59,596), and Health Care & Bioscience (52,361). While Health Care and Bioscience combined employ 52,361 workers, individually the ratio of their employment is approximately 80:20; that is, Health Care industry employs about 80% of the total workforce in the Health Care & Bioscience industry (or 40,515 workers), and Bioscience employs roughly 20% or 11,846 workers. 8

10 Industry Figure 3: Employment & Number of Establishments by Selected Industries in the San Antonio MSA, 2011 Total Employment by Industry Total Number of Establishments Aerospace Oil & Gas Information Technology & Security New Energy 2,141 3,580 5,327 6, Health Care & Bioscience Retail Trade Hospitality 52,361 59,596 80,469 6,055 8,585 5,897 Other 243,968 33, , , , , , ,000 Total Number of Employees Note: Other includes sectors which are not part of the selected industries presented in this figure. For a more detailed breakdown of this category, please refer to Figure 4. Source: InfoUSA, 2011; Calculations by SABÉR Institute Figure 4 shows the distribution of all the industries included in Other. The top three industry employers in this category are Educational Services employing 37,528 workers, followed by Other Services (33, 972), and Construction (28,356). 9


11 Industry Figure 4: Employment & Number of Establishments Among Other Industries in the San Antonio MSA, 2011 Total Employment by Industry Total Number of Establishments Management of Companies and Enterprises Arts, Entertainment, and Recreation Agriculture, Forestry, Fishing and Hunting Unclassified Establishments Information Transportation and Warehousing Social Assistance Administrative and Support Services Public Administration Real Estate and Rental and Leasing Manufacturing Finance and Insurance Wholesale Trade Professional, Scientific, and Technical Services Construction Other Services (except Public Administration) Educational Services ,937 5,134 6,996 10,539 12,420 13,059 13,518 14,273 18,736 19,783 24,339 28,356 33,972 37, ,000 20,000 30,000 40,000 Total Number of Employees , , ,396 1,332 3,452 2,226 4,860 4,016 6,826 1,279 Source: InfoUSA, 2011; Calculations by SABÉR Institute Business Owner Demographics According to the U.S. Census Bureau, 2007 Survey of Business Owners, 84.2% of all businesses in Texas were White-owned (or 1,822,440), followed by Hispanic-owned (20.7%), Black or African-American-owned (7.1%), Asian-owned (5.3%), and Native Hawaiian and Other Pacific Islander-owned (0.1%). Approximately 50.4% of all firms are male-owned, while 28.2% are female-owned. The remaining 21.4% are equally male-/female-owned. Additionally, Table 3 shows employment and sales data broken down by race and ethnicity, and gender. 10
 Educational Services 229 238 911 3,937 5,134 6,996 10,539 12,420 13,059 13,518 14,273 18,736 19,783 24,339 28,356 33,972 37,528 0 10,000 20,000 30,000 40,000")
12 Table 3: Texas Business Owner Demographics Level in 2007 Firms Employment Receipts ($1,000) White-owned 1,822,440 3,848, ,522,358 Black or African-American-owned 154,283 72,652 9,280,648 Asian-owned 114, ,545 40,209,344 Native Hawaiian and Other Pacific Islander-owned 1,196 1, ,969 Hispanic-owned* 447, ,673 61,895,886 Female-owned 609, ,474 96,803,111 Male-owned 1,090,854 2,911, ,009,743 Total** 2,164,852 8,712,639 2,621,467,877 Note: * Hispanic can be of any race. **Total includes all races and ethnicities. Source: U.S. Census Bureau, 2007 Survey of Business Owners; Calculations by SABÉR Institute Similar to the state of Texas, a great majority of firms (89.5%) in the San Antonio metropolitan area are White-owned, followed by Hispanic-owned (32.9%), Black or African-American-owned (3.4%), Asian-owned (3.0%), and Native Hawaiian and Other Pacific Islander-owned (0.1%). In terms of gender, 51.7% of all businesses are male-owned and 28.2% are female-owned. The remaining 20.1% are equally male-/female-owned. Table 4: San Antonio MSA Business Owner Demographics Level in 2007 Firms Employment Receipts ($1,000) White-owned 154, ,194 60,652,611 Black or African-American-owned 5,821 4, ,967 Asian-owned 5,239 10,677 1,634,631 Native Hawaiian and Other Pacific Islander-owned ,055 Hispanic-owned* 56,644 58,694 7,454,152 Female-owned 48,531 50,830 7,217,664 Male-owned 89, ,893 47,799,563 Total** 172, , ,232,069 Note: * Hispanic can be of any race. **Total includes all races and ethnicities. Source: U.S. Census Bureau, 2007 Survey of Business Owners; Calculations by SABÉR Institute Comparative Analysis of Small Businesses In Texas and San Antonio MSA The following is a comparative analysis of small businesses employing less than 100 employees in Texas and in the San Antonio MSA. This analysis includes a comparison of small businesses for the top ten industries in the state of Texas and in the metro area of San Antonio and points 11

13 Total Number of Establishments out the growth trends for the period All data are taken from the U.S. Census Bureau, County Business Patterns. Figure 5 shows the growth trends for the number of small businesses in the top ten industries in the state. With almost 75,000 establishments in 2009, the Retail Trade industry remains the leading industry with the most small business firms. From 1998 to 2009, the Retail Trade industry grew by 3.94%. Industries with the greatest percent increases over the period include Professional, Scientific, and Technical Services with 23.63% growth, Real Estate, Rental and Leasing (24.37%), Health Care and Social Assistance (28.31%), Accommodation and Food Services (28.66%), and Finance and Insurance (32.87%). While most of the top ten industries saw growth from , the Wholesale Trade industry experienced a decline of 5.66%. 80,000 Figure 5: Trends in Small Business Establishments in Texas Total Number of Establishments by Top 10 Industries in Texas, ,000 60,000 50,000 Retail Trade Other Services (Except Public Administration) Professional, Scientific, and Technical Services Health Care and Social Assistance 40,000 30,000 20,000 Construction Accommodation and Food Services Wholesale Trade Finance and Insurance 10, Administrative and Waste Management Services Real Estate, Rental and Leasing Source: U.S. Census Bureau, County Business Patterns Figure 6 shows the growth trends for the number of small businesses in the top ten industries in the San Antonio MSA. The growth patterns for the metro area of San Antonio are similar to those of Texas. The Retail Trade industry remained the industry with the most small business 12

14 Total Number of Establishments establishments over the period , growing by 14.18%. Industries with the largest percent increases over the period include Professional, Scientific, and Technical Services with 31.58% growth, Finance and Insurance (33.46%), Health Care and Social Assistance (37.72%), Accommodation and Food Services (39.15%), and Real Estate, Rental and Leasing (41.17%). The growth trend of the Wholesale Trade industry remained rather flat during the period with a growth rate of 0.20%. Figure 6: Trends in Small Business Establishments in San Antonio MSA Total Number of Establishments by Top 10 Industries in San Antonio MSA, ,000 5,000 Retail Trade Other Services (Except Public Administration) Health Care and Social Assistance 4,000 3,000 Professional, Scientific and Technical Services Accommodation and Food Services Construction 2,000 Finance and Insurance 1, Wholesale Trade Administrative and Support Management Services Real Estate, Rental and Leasing Source: U.S. Census Bureau, County Business Patterns Profiles of Small Businesses by Selected Industries in San Antonio MSA Appendix III contains profiles for small businesses in the San Antonio MSA for industries included in the SA 2020 initiative as well as other selected industries with a large concentration of small business firms. Industries that are part of the SA 2020 plan are Aerospace, Health Care & Bioscience, Information Technology & Security, and New Energy. Other selected industries include Hospitality, Retail Trade, Oil & Gas, and Construction. 13

15 Establishments Our analysis shows that the top three industries in respect to the total number of small business establishments in 2011 include Retail Trade with 8,585 establishments, Health Care & Bioscience (6,055), and Hospitality (5,897). Employment Industries employing the greatest number of workers are Hospitality (80,469), followed by Retail Trade (59,596), and Health Care & Bioscience (52,361). A great majority of small business establishments employ less than five employees. The following are the industries with at least 50% of all establishments employing between one and four employees: Aerospace (52.9%), Health Care & Bioscience (53.1%), Oil & Gas (59.6%), Retail Trade (61.5%), Information Technology & Security (64.5%), and Construction (65.2%). Sales Volume The top three industries generating the greatest sales volume are Retail Trade ($16,596,033,000), Health Care & Bioscience ($8,390,339,000), and Construction ($6,673,606,000). Looking at the percentage of small business establishments by sales volume range, a great majority of firms generate up to $1,000,000 annually. Industries with at least 50% of all establishments generating up to $1,000,000 include Oil & Gas (50.2%), Aerospace (54.9%), Construction (57.1%), Retail Trade (58.8%), Information Technology & Security (60.9%), Health Care & Bioscience (64.9%), and Hospitality (76.5%). Industry Trends Aerospace The state of Texas nationally ranks in the top three states in aerospace manufacturing in regard to capital investments, employees, value added per employee, and value of shipments, according to 14

16 the U.S. Census Bureau. From 2008 to 2010, Texas was the only U.S. state to add aerospace manufacturing jobs 8. With a total of 204 small business establishments in the San Antonio MSA area, the Aerospace industry employs over 2,000 workers and generates an estimated $466.5 million in sales revenue 9. The industry s growth in the San Antonio MSA over the past 20 years has been both dramatic and consistent. The industry has grown 440% over the past 20 years, 260% over the past 15 years, and almost 75% over the past 10 years. Although there was a small dip between 2008 and 2010, the Aerospace industry posted 10% growth over the period, an especially challenging period in the national economy. The number of employees in the industry has almost doubled since 1990, recording an estimated total of 13,616 employees in Wages in the industry have consistently been among the highest in the San Antonio MSA. They have risen sharply in recent years, up by 67% over the past decade 10. Health Care & Bioscience The San Antonio MSA area is home to 6,055 Health Care & Bioscience small business establishments, which employ well over 52,000 employees and generate $8.4 billion in annual sales 9. Analyzed separately, the Health Care industry employs 40,515 workers while the Bioscience industry occupies 11,846. Stated differently, the Health Care industry employs an estimated 77.4% of the total combined Health Care & Bioscience; Bioscience employs 22.6%. In 2009, the economic impact of the Health Care & Bioscience industry was projected at $24.5 billion. Between 1999 and 2009, the industry added nearly 33,000 net new jobs, an increase of 35%. While it is important to look at and discuss the trends of Health Care and Bioscience combined, it is also imperative to look at these two industries separately as they employ a significantly different share of workers in the San Antonio metropolitan area. Health Care 8 Taken from the Office of the Governor Web site on December 27, Estimates based on analysis of InfoUSA data for San Antonio MSA, The Aerospace Industry in San Antonio Economic Impact in 2010, by Richard V. Butler and Mary E. Stefl, The Greater San Antonio Chamber of Commerce, December

17 The top three industries in the Health Care sector in the San Antonio metro area include Physicians & Surgeons with a total of 12,093 employees, followed by Dentists (5,160), and Clinics (3,806) 9. From 1999 to 2009, the economic impact of Health Care Services in San Antonio MSA grew by %, from $4.9 billion in 1999 to $11.6 billion in Physicians and Hospitals, the two largest provider groups, have consistently made a substantial contribution to the San Antonio economy. In 2009, the economic impact of Hospitals was estimated at $6.57 billion, while the impact of Physicians was at $3.25 billion. Over the period , both groups more than doubled in size: the economic impact of Hospitals increased by % and that of Physicians rose by % 11. From November 2010 to November 2011, employment in the Health Care Services in the state of Texas increased by 32,300 and 2.6%, respectively, from 1,255,600 in November 2010 to 1,287,900 in November The San Antonio MSA area accounted for 15.79% of this annual increase 18. Bioscience According to the Governor s Office, Department of Economic Development & Tourism 12, the following are the key factors that strengthen the state s status as a leader in the Bioscience industry: (1) proactive government support, a concentration of highly trained biotech workers, multiple top-tier medical and research institutions, a first-rate transportation and logistics infrastructure, and a top-ranked business climate. In 2009, the total economic impact of the Bioscience industry in the state of Texas was estimated at $75 billion. For every Bioscience job, another 2.3 jobs were created elsewhere in the state s economy. From 2005 through 2008, employment in most of the major Bioscience sectors in Texas increased steadily and remained relatively stable through 2009 despite the global recession. Bioscience employment trends for 2010 were generally positive. The major Bioscience sectors in San Antonio MSA with aboveaverage employment concentrations include Medical and Diagnostic Laboratories, Scientific R&D Services, and the Hospitals sector. 11 San Antonio s Health Care And Bioscience Industry Economic Impact in 2009, by Richard V. Butler and Mary E. Stefl, The Greater San Antonio Chamber of Commerce, Texas Biotechnology Industry Report, by Office of the Governor, Economic Development & Tourism, May

18 Hospitality With a total of 80,469 employees, the Hospitality industry is the largest small business employer in the San Antonio MSA area. From 1998 to 2008, the Hospitality industry s economic impact on the San Antonio MSA grew substantially, from $6.4 billion in 1998 to $11 billion in While the growth of the industry over the period was a modest 8%, the longer term trend reflects a vibrant and dynamic industry. Furthermore, employment increased by 26% over the decade. Total wages in the industry rose by 71% in the ten-year period between 1998 and Over the period , all of the Hospitality industry s major sectors experienced growth. The Restaurant sector remained the dominant sector throughout the decade. The economic impact of the Restaurant sector increased by 80% during the period , from 2,500 million in 1998 to 4,500 million in This is equivalent to a 6.05% annualized growth rate 13. From November 2010 to November 2011, Texas Hospitality industry added 38,200 jobs. This is an increase of 3.8%. The San Antonio MSA area accounted for 3.66% of the yearly increase 18. Information Technology & Security A total of 787 small business establishments in the San Antonio MSA area employ an estimated 5,327 workers in the Information Technology & Security industry and generate approximately $1.6 billion annually. From 1998 to 2008 the economic impact of the industry in San Antonio MSA doubled, from $4 billion in 1998 to $8 billion in Underlying the overall increasing trend had been a shift in the relative importance of the two major sectors of the Information Technology & Security industry, namely the Products and the Services sector. During the early 2000 s the Products sector suffered from the closing of two large semiconductor plants in the city. While it increased by about 70% from 1998 to 2008, the Services sector nearly tripled over the decade, rising by close to 171%. Due to its abundant supply of reasonably-priced electricity, its highly developed power and networking infrastructure, and the region s low risk of natural disasters, San Antonio s attractiveness as a location for major firms data centers will accelerate this trend. Employment in the industry increased by 43.96% over the period , from 13 The Economic Impact of San Antonio s Hospitality Industry, by Richard V. Butler and Mary E. Stefl, The Greater San Antonio Chamber of Commerce,

19 10,870 in 1998 to 15,648 in The annual payroll in the industry nearly doubled over the decade, increasing from million in 1998 to million in According to the TechAmerica s Cyberstates 2011 report 15, Texas ranked second nationwide in the number of high-tech workers, in the size of high-tech payroll, and in the number of high-tech establishments in Moreover, TechAmerica reported that in 2010, the average tech industry wage in the state of Texas paid 84% more than the average private sector wage. New Energy An estimated total of 735 small business establishments in the San Antonio metro area employ about 7,000 workers in the New Energy industry and generate an annual total of $2.1 billion in sales revenue 9. In its Annual Energy Outlook 2010 report 16, the U.S. Energy Information Administration (EIA) forecasts several key trends in energy use of the next 25 years. Foremost are the increased use of renewables and the declining reliance on imported fossil fuels. Between now and 2035, the EIA projects the strongest growth in fuel use to occur in renewable fuels used to generate electricity and to power vehicles. The EIA credits this growth first and foremost to government programs, including state RPS programs like that in Texas, along with rising fossil fuel prices. Even though fossil fuels will continue to be the nation s primary energy source over the next 25 years, their share of overall energy use is expected to fall from 84% in 2008 to 78% in With abundant wind, solar, and biomass resources found across Texas, the state enjoys the largest renewable energy potential nationwide. With over 4,800 companies employing more than 55,600 Texans in renewable energy sectors, the state has developed a solid foundation in the growing renewable energy industry. In 2009, Texas was ranked second nationally in number of 14 Information Technology In San Antonio Economic Impact in 2008, by Richard V. Butler and Mary E. Stefl, The Greater San Antonio Chamber of Commerce, Taken from the TechAmerica Foundation Web site on December 28, Annual Energy Outlook 2010 With Projections to 2035, by U.S. Energy Information Administration, Office of Integrated Analysis and Forecasting, U.S. Department of Energy, Washington DC, April

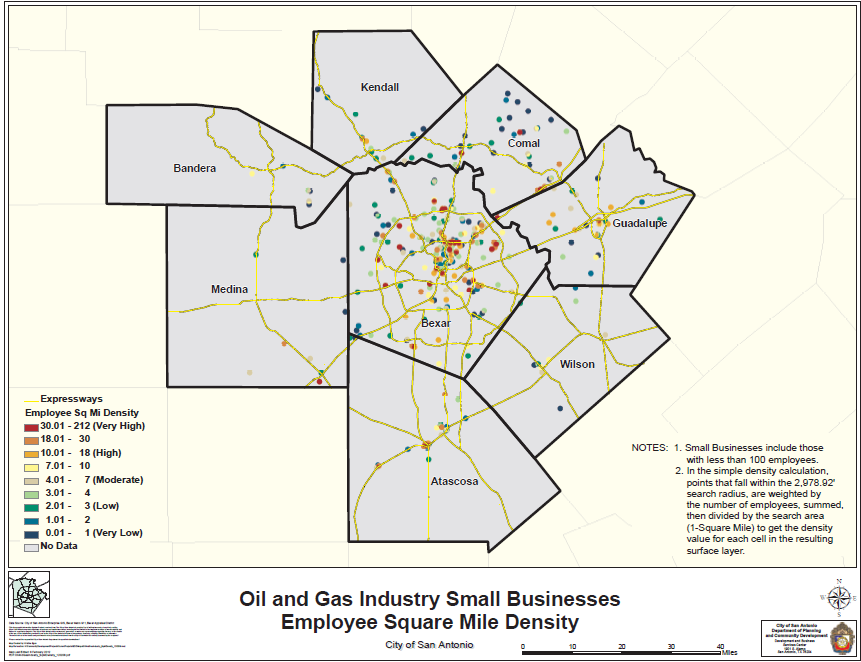
20 renewable energy jobs, with 15% growth from 1998 to 2007, and fourth nationally in new clean energy patents over the same time period 17. Retail Trade Our analysis of InfoUSA 2011 data shows that the Retail Trade industry is the #2 industry employer in the San Antonio metropolitan area, employing an estimated total of 59,596 workers. According to the latest Texas Labor Market Review 18, job growth in the state was driven by Retail Trade. With the addition of 33,000 jobs from October 2011 to November 2011, Retail Trade continued its momentum as retailers embraced the holiday shopping season. The San Antonio MSA area accounted for 5.76% of the monthly increase. With a revised growth of 10,300 jobs in October 2011, this industry has posted 43,300 jobs during the last two months, recording the largest gain seen since 2007 for that time period. As major metro markets of Texas have exceeded the pace of the nation s output growth, it follows that statewide consumer purchasing power and relative income expectations translate to superior retail spending 19. Oil & Gas A total of 428 small business firms employ an estimated 3,580 employees in the San Antonio metro area in the Oil & Gas industry. Those small business establishments generate over $1.2 billion annually. From November 2010 to November 2011, employment in Oil & Gas Extraction in the state of Texas increased by 6,500, from 82,900 in November 2010 to 89,400 in November According to the December 2011 issue of Texas Labor Market Review 18, several companies will bring over 2,000 jobs to San Antonio due to Eagle Ford Shale drilling projects. The Eagle Ford Shale, an oil and natural gas producing field located just south of San Antonio, has positively impacted the region s economy. In 2010, this shale play generated close to $2.9 billion in revenue, supported about 12,600 full-time jobs in the area, and provided nearly $47.6 million in local government revenue. Under moderate assumptions, by 2020, the Eagle Ford Shale is expected to account for close to $11.6 billion in gross state product, $21.6 billion in total 17 Texas Renewable Energy Industry Report, by Office of the Governor, Economic Development & Tourism, August Texas Labor Market Review, by Texas Workforce Commission, December 2011, Quarterly Economic Trends, Third Quarter, by The Greater San Antonio Chamber of Commerce, 19

21 economic impact, and support close to 67,971 full-time jobs in the area. Analysts, investors, and industry experts agree that due to a high reservoir quality, the Eagle Ford Shale will likely become a premiere oil and gas play in the future. High yield condensate and oil production together with a favorable business climate are very attractive to individual operators, and they are expected to play a key role in stimulating economic development in the region 20. Construction The Construction industry employs an estimated 28,356 workers in the San Antonio metropolitan area and generates well over $6.6 billion in annual sales revenue. According to the Texas comptroller 21, Texas lost over 17% of its workforce during the recession. However, the industry has recovered approximately one-third of all jobs lost since the Construction industry started growing again in the middle of In 2011, most of the jobs in the industry were added in heavy and civil construction. While most sectors of the Construction industry have grown, highway, street, and bridge construction and building finishing contractors have continued to see declines. A positive development for the Texas Construction industry is the increase in the number of multi-family building permits in From 2010 to 2011, the number of multifamily building permits was up by 63%, increasing from 16,108 units to 26,193 units. According to McGraw-Hill Construction Dodge, the total value of the contracts in 2011 for nonresidential building construction of offices and warehouses in the state rose by 10.6% from Total construction employment in Texas increased by 27,100 (or by 4.8%) during Statewide construction employment totaled 594,500 in August Appendix IV contains an outline of each industry and the corresponding industry cluster. Each industry cluster was created based on the North American Industry Classification System (NAICS) codes. 20 Economic Impact of the Eagle Ford Shale, by Center for Community and Business Research, University of Texas at San Antonio, Institute for Economic Development, February Annual Cash Report Review of the Texas Economy, Susan Combs, Texas Comptroller of Public Accounts, 20
22 Opportunities and Challenges for Small Businesses This section outlines the most important issues and opportunities facing small business owners. Based on our experience with the local business community as well as our research, challenges and opportunities faced by local and regional small business firms are the same or similar as those faced by small businesses nationwide. Challenges and opportunities seen in the national and regional marketplace are not unique to national and regional small businesses. Rather, American small business companies face the same issues and opportunities as their competitors across the borders 22. Challenges Access to Capital Access to capital enables small business owners to start, support, and expand their companies. During the recession, both credit and capital availability for small firms fell sharply, thus hindering small business owners efforts to finance their operations and start new business ventures. While larger businesses normally rely on banks for only 30% of their financing, small businesses receive 90% of their financing from banks 23. As a result of the recession, commercial banks reduced their outstanding small loans by more than $14 billion, or approximately 2%, between June 30, 2008, and June 30, During the same period, the number of new commercial and industrial loans, including loans to small businesses, fell by an estimated 24% 23. In spite of overall economic recovery, the lending environment for small business firms may take longer to recover completely. For instance, following the 1990 and 2001 recessions, commercial lending continued to fall dropping by 13.3% between 1990 and 1994, and 20.4% between 2001 and Hence, support for the small business lending market may continue to be necessary even as economic growth resumes Taken from the Shirlaws Web site on December 19, Supporting America s Small Businesses. by The White House, 21
23 Economy Small firms continue to struggle in the economic downturn. The National Federation of Independent Business (NFIB) reports that owners are less willing to expand their small businesses, to hire additional workers, to invest in new plant and equipment, or to borrow money. 24 For small business owners, significantly higher energy costs affect both the bottom line and the demand for their products and services. In 2001, the average cost of a barrel of crude oil was $25.92; by 2007, that figure had grown to $ By 2008, crude oil prices had swelled to $ a barrel. Since January 2011, crude oil prices have been fluctuating between $97.36 and $ Regulations Regulations at state and federal levels challenge the success and growth of small businesses. The U.S. Small Business Administration (SBA) estimated total small business regulatory costs at $1.75 trillion at the federal level. Small businesses shoulder regulatory costs that are 36% greater per employee than their larger competitors. Hence, businesses with fewer than 20 employees spend $10,585 per employee per year, while firms with 500 or more employees spend $7,755 per employee per year to comply with federal regulations. In general, regulatory compliance costs place small businesses at a competitive disadvantage relative to large businesses, hindering their ability to grow, create jobs, reinvest in their operations, and prosper. 26 A ranking of the states based on the policy environments for entrepreneurs can be seen in Figure Taken from the National Federation of Independent Business (NFIB) Web site on May 12, Taken from The Wall Street Journal (WSJ) Web site on May 12, Small Business Big Opportunity: Finding Solutions for Small Business Challenges. by The Travelers Institute,

24 Figure 7 Small business survival index 2010: State rankings (Ranked from the friendliest to the least friendly policy environments for entrepreneurship) Source: Raymond J. Keating, Small Business and Entrepreneurship Council, Small Business Survival Index 2010, available at Environmental Regulations Compliance with environmental regulations is much more expensive per employee at small businesses than at larger firms. The cost per employee for complying with environmental regulations at firms with fewer than 20 employees is $4,101 per year. That is four times greater than the $883 per year per employee at companies with 500 or more employees. Energy bills are one of the top three expenditures for small businesses (only payroll and materials are higher). When small firms face a spike in energy prices, they are not able to adjust the price of their goods and services quickly enough to match the cost increases 11. Cost and Availability of Health Insurance The cost of health insurance has ranked as the top concern of small business owners. From 1999 to 2008, health insurance costs for small businesses increased by 129%. 26 Small business firms are disadvantaged relative to their larger competitors because of the higher premiums they must 23
25 pay to provide health insurance for their employees. 27 Health insurance premiums have increased significantly over the recent past, growing a cumulative 138% between 1999 and 2010, and outpacing cumulative wage growth of 42% over the same period. These premium increases have forced small business owners to make changes to the coverage they offer their workers, including sharing the cost of coverage with their employees, pursuing lower cost options, or choosing not to offer health coverage at all. 28 Workforce Businesses with fewer than five employees make up the largest percentage of employer firms and they compete for labor resources with their larger counterparts. This becomes even more difficult in light of the disparity in total compensation, and the result is greater employee turnover. Research shows that firms that offer benefits have a 26.2% lower probability of having an employee leave in a given year. Moreover, the provision of benefits increases the probability of the employee staying another year by almost 14%. 29 Tax Regulations Tax compliance costs on American small businesses total $18 billion to $19 billion annually. Companies with fewer than 20 employees spend $1,584 per employee every year to comply with federal tax requirements. That is three times higher than the cost per employee for large businesses. Furthermore, 75% of small businesses pay their business tax at individual rates rather than at the corporate rate. High tax rates directly impact small firms cash flow. Hence, the more a business pays in taxes at local, state, and federal levels, the less money the business has to pay employees, keep the business operations running, and possibly add more jobs 26. Risk Management Based on a survey conducted by Travelers Select Accounts, risk management ranks relatively low among priorities facing small business owners. Rather, small business owners prioritize 27 The Economic Effects of Health Care Reform on Small Businesses and Their Employees. by Executive Office of the President, Council of Economic Advisers, July 25, Kaiser Family Foundation and the Health Research & Educational Trust (2011) 29 The Relationship Between Employee Turnover and Employee Compensation in Small Business, by John B. Hope and Patrick C. Mackin (SAG Corporation), U.S. Small Business Administration, Office of Advocacy, July
26 activities related to growing their business over those related to protecting their business against insurable risk 26. The American Red Cross noted that, while reports vary, as many as 40% of small businesses do not reopen after a major disaster like a flood, tornado, or earthquake. 30 Opportunities Increased Investments in Technology and Innovation With many regional officials seeking the next big thing that will drive their local and regional economies for years to come, there is an appreciation that small businesses are leading the way toward new inventions, processes and products. 31 What s more, regions with greater entrepreneurial growth have been associated with higher levels of innovation and technology use, and states that promote new firm formation through public policy are more likely to experience higher employment, incomes, and overall output. 32 Pursuing New Markets Overseas Overseas markets can provide new customers for small business owners, but entrepreneurs have yet to fully tap their potential for growth in the export arena. One of the strengths in the economy right now is the export sector. Exports increased to $172.7 billion, the most on records dating back to A weaker dollar as well as rapid growth in developing countries has lead to increasing U.S. exports. 33 According to the International Trade Administration 34, a great number of businesses in San Antonio MSA are worldwide exporters of machinery manufacturing. Out of a total of 506 machinery manufacturing exporters, 216 (or 42%) are businesses with less than 100 employees. 30 American Red Cross Web site, available at American Red Cross, Preparing Your Business for the Unthinkable, available at 31 The Influence of R&D Expenditures on New Firm Formation and Economic Growth, by Bruce Kirchoff and Catherine Armington (BJK Associates), U.S. Small Business Administration, Office of Advocacy, October Taxes and Entrepreneurial Activity: An Empirical Investigation using Longitudinal Tax Return Data, by Donald Bruce and Tami Gurley, U.S. Small Business Administration, Office of Advocacy, March Taken from The New York Times Web Site on May 12, Taken from International Trade Administration Web Site on June 14,
27 Promoting Business Ownership among Selected Demographic Groups Women and minorities have been very entrepreneurial over the past few decades a trend that is expected to continue. For instance, in 2007, women owned 7.8 million businesses and accounted for 28.7% of all businesses nationwide. These firms generated $1.2 trillion in receipts, approximately 3.9% of all business receipts nationwide. 35 The number of Hispanic-owned businesses increased by 43.7% to 2.3 million, more than twice the national rate of 18.0% between 2002 and Hispanic-owned businesses generated $345.2 billion in sales in 2007, up 55.5% compared with From 2002 to 2007, the number of black-owned businesses increased by 60.5% to 1.9 million, more than triple the national rate of 18.0%. Over the same period, receipts generated by black-owned businesses increased by 55.1% to $137.5 billion. 37 The number of U.S. businesses owned by people of Asian origin increased 40.4% to 1.5 million between 2002 and 2007, increasing at more than twice the national rate and generating $507.6 billion in receipts, a 55.4% increase from Advancing Education and Training Research shows that regions with more highly educated citizens tend to be more entrepreneurial and to experience more rapid economic growth. From the perspective of small firms, it is important to keep in mind that small businesses are often times the first employers of many workers who are often less educated than the rest of the population. As a result, small businesses must devote significant resources to training and educating their workforce Taken from the U.S. Census Bureau Web site on May 12, Taken from the U.S. Census Bureau Web site on May 12, Taken from the U.S. Census Bureau Web site on May 12, Taken from the U.S. Census Bureau Web site on May 12,
28 Appendix I: Texas Business Facts Total Number of Employees Annual Payroll ($1,000) Total Number of Establishments Texas Business Facts for All Industries, ,570,820 7,763,815 8,026,438 8,161,321 7,993,559 8,051,148 8,118,483 8,305,102 8,711,476 9,041,030 9,231,955 $229,185,833 $245,163,283 $269,917,800 $282,315,344 $277,847,486 $281,636,318 $293,572,510 $315,809,126 $347,735,827 $373,037,029 $394,696,044 Number of Establishments by Employment Size 462, , , , , , , , , , , , , , , , , , , , , , ,944 91,627 92,648 93,304 95,293 96,003 97,308 97,495 99, , , ,122 59,622 61,063 61,804 63,242 63,479 64,348 64,869 67,262 69,391 70, ,631 42,432 43,707 44,049 44,241 44,550 44,948 45,386 47,674 49,742 50, ,373 14,600 15,250 15,644 15,405 15,554 15,773 15,889 16,543 16,881 17, , , , , , , , , , , ,193 Source: U.S. Census Bureau, Country Business Patterns Texas Business Facts for All Industries, Total Number of Establishments 462, , , , , , , , , , ,336 Percent of Establishments by Employment Size % 52.87% 52.32% 52.04% 52.27% 52.12% 52.23% 52.53% 52.07% 51.76% 51.03% % 19.62% 19.65% 19.69% 19.76% 19.84% 19.81% 19.59% 19.45% 19.51% 19.74% % 12.76% 12.95% 13.04% 13.12% 13.12% 13.10% 13.03% 13.21% 13.31% 13.49% % 9.08% 9.27% 9.30% 9.18% 9.21% 9.15% 9.12% 9.36% 9.54% 9.72% % 3.13% 3.23% 3.30% 3.19% 3.21% 3.21% 3.19% 3.25% 3.24% 3.31% % 97.46% 97.42% 97.37% 97.52% 97.50% 97.51% 97.46% 97.35% 97.35% 97.29% Source: U.S. Census Bureau, Country Business Patterns
29 Appendix II: San Antonio MSA Business Facts Total Number of Employees Annual Payroll ($1,000) Total Number of Establishments San Antonio MSA Business Facts for All Industries, , , , , , , , , , , ,867 $14,533,151 $15,665,296 $18,120,877 $19,133,837 $18,256,302 $19,304,184 $20,588,163 $21,519,197 $23,958,620 $25,939,804 $26,650,130 33,047 33,375 33,599 33,659 34,479 37,015 37,635 38,623 39,852 40,635 40,535 Number of Establishments by Employment Size ,084 17,201 17,190 17,205 17,597 19,052 19,474 20,014 20,393 20,750 20, ,594 6,647 6,647 6,578 6,803 7,301 7,424 7,503 7,751 7,926 8, ,321 4,279 4,445 4,482 4,612 4,903 4,983 5,156 5,429 5,438 5, ,143 3,263 3,250 3,263 3,340 3,550 3,526 3,648 3,790 3,970 3, ,064 1,118 1,185 1,209 1,203 1,245 1,282 1,306 1,415 1,423 1, ,206 32,508 32,717 32,737 33,555 36,051 36,689 37,627 38,778 39,507 39,403 Source: U.S. Census Bureau, Country Business Patterns Total Number of Establishments Percent of Establishments by Employment Size San Antonio MSA Business Facts for All Industries, ,047 33,375 33,599 33,659 34,479 37,015 37,635 38,623 39,852 40,635 40, % 51.54% 51.16% 51.12% 51.04% 51.47% 51.74% 51.82% 51.17% 51.06% 49.87% % 19.92% 19.78% 19.54% 19.73% 19.72% 19.73% 19.43% 19.45% 19.51% 20.01% % 12.82% 13.23% 13.32% 13.38% 13.25% 13.24% 13.35% 13.62% 13.38% 13.86% % 9.78% 9.67% 9.69% 9.69% 9.59% 9.37% 9.45% 9.51% 9.77% 9.83% % 3.35% 3.53% 3.59% 3.49% 3.36% 3.41% 3.38% 3.55% 3.50% 3.64% % 97.40% 97.37% 97.26% 97.32% 97.40% 97.49% 97.42% 97.31% 97.22% 97.21% Source: U.S. Census Bureau, Country Business Patterns
30 Appendix III: Industry Profiles for Selected Industries Aerospace San Antonio Metropolitan Statistical Area (MSA) Industry Overview The Aerospace Industry (NAICS 33, 42, 48, 49, 61, 62) includes establishments that are engaged in one or more of the following areas: (1) manufacturing complete aircraft, missiles, or space vehicles; (2) manufacturing aerospace engines, propulsion units, auxiliary equipment or parts; (3) developing and making aerospace product prototypes; (4) aircraft conversion; (5) and complete aircraft or propulsion systems overhaul and rebuilding. Please note that all data, except data on industry trends, refer to establishments with less than 100 employees. Industry Facts Selected Major Industry Employers Establishments 204 Allied Aviation Services San Antonio Air Life Transport Employment 2,141 Flight Safety Services Corp. Landmark Aviation Sales Volume $466,487,000 Nayak Aviation Lear Siegler Services Source: InfoUSA, 2011, Calculations by SABÉR Institute Source: InfoUSA, 2011 Number and Percent of Establishments by Employee Size Range in San Antonio MSA, (13.7%) 19 (9.3%) 41 (20.1%) 8 (3.9%) 108 (52.9%) (5.9%) 18 (8.8%) Number and Percent of Establishments by Sales Volume Range in San Antonio MSA, (7.4%) 47 (23.0%) 33 (16.2%) 79 (38.7%) Less than $500,000 $500,000-1 Million $1-2.5 Million $2.5-5 Million $5-10 Million $10-20 Million Source: InfoUSA, 2011, Calculations by SABÉR Institute Source: InfoUSA, 2011, Calculations by SABÉR Institute Industry Trends Texas Aerospace and Aviation industry directly employs about 200,000 workers at over 1,600 companies earning an average annual income of more than $62,700. From 2008 to 2010, Texas was the only U.S. state that added aerospace manufacturing jobs, according to the U.S. Bureau of Labor Statistics. Texas nationally ranks in the top three states in aerospace manufacturing in terms of capital investments, employees, value added per employee, and value of shipments, according to the U.S. Census Bureau. While San Antonio s aerospace industry has earned global recognition for its skills maintaining aging airframes and power plants, much of the industry s recent growth has come in the form of work on the world s most advanced technology. The industry s growth over time has been both dramatic and consistent, growing 440% over 20 years, and almost 75% over the past 10 years. Although there was a slight dip between 2008 and 2010, the industry posted 10% growth over the period. Sources: Office of the Governor Economic Development & Tourism; The Aerospace Industry in San Antonio: Economic Impact in 2010, by Richard V. Butler and Mary E. Stefl, The Greater San Antonio Chamber of Commerce. 29
31 30
32 Health Care & Bioscience San Antonio Metropolitan Statistical Area (MSA) Industry Overview The Health Care industry (NAICS 62) includes establishments primarily engaged in furnishing medical, surgical, and other health services to persons. The bioscience industry (NAICS 32, 33, 42, 44, 45, 54, 62) includes establishments primarily engaged in (1) medical and diagnostic laboratories services, (2) physical, engineering and biological research, and (3) pharmaceutical and medicine manufacturing. Please note that all data, except data on industry trends, refer to establishments with less than 100 employees. Industry Facts Selected Major Industry Employers Establishments 6,055 Acuity Hospital of South Texas Southeast Nursing & Rehab Center Employment 52,361 Mission Trail Baptist Hospital CH2M Hill Sales Volume $8,390,339,000 Fredericksburg Care Center Weston Solutions Source: InfoUSA, 2011, Calculations by SABÉR Institute Source: InfoUSA, 2011 Number and Percent of Establishments by Employee Size Range in San Antonio MSA, (7.7%) 831 (13.7%) 1,389 (22.9%) 155 (2.6%) 3,215 (53.1%) Number and Percent of Establishments by Employee Size Range in San Antonio MSA, % 232 (3.8%) 1, % 56 (0.9%) 1, % 2, % 11 (0.2%) Less than $500,000 $500,000-1 Million $1-2.5 Million $2.5-5 Million $5-10 Million $10-20 Million $20-50 Million Source: InfoUSA, 2011, Calculations by SABÉR Institute Source: InfoUSA, 2011, Calculations by SABÉR Institute Industry Trends The Health Care & Bioscience industry continues to be a dominant force in the San Antonio economy. In 2009, the economic impact of the industry was estimated at $24.5 billion. The industry paid $6.5 billion in wages and salaries to roughly 140,000 employees in One of every six San Antonio employees works in the Health Care & Bioscience industry. Over the past decade, the Health Care & Bioscience industry has added nearly 33,000 net new jobs, an increase of 35%. Within the Health Care sector, Physicians and Hospitals are the two largest provider groups. From 1999 to 2009, both have more than doubled in size: the economic impact of Hospitals increased by 147% and that of Physicians rose by 136%. In 2009, San Antonio landed one of the nation s largest economic development prizes of the year Medtronic s new Diabetes Therapy Management & Education Center. This patient support, education and sales facility is expected to provide at least 1,400 jobs over the next five years. When fully staffed, Medtronic s San Antonio center is projected to generate more than $700 million per year in economic impact for the city and state. In 2009, San Antonio s major biomedical research institutions were awarded more than $393 million in external research grants. Source: San Antonio s Health Care And Bioscience Industry: Economic Impact in 2009, by Richard V. Butler and Mary E. Stefl, The Greater San Antonio Chamber of Commerce. 31
33 32
 transportation; (2) travel arrangements; (3) lodging; (4) food services; and (5) entertainment.")
34 Hospitality San Antonio Metropolitan Statistical Area (MSA) Industry Overview The Hospitality Industry (NAICS 48, 51, 53, 56, 71, 72, 81) includes establishments that are engaged in one or more of the following areas: (1) transportation; (2) travel arrangements; (3) lodging; (4) food services; and (5) entertainment. Please note that all data, except data on industry trends, refer to establishments with less than 100 employees. Industry Facts Selected Major Industry Employers Establishments 5,897 Rita s on the River Canyon Springs Golf Club Employment 80,469 Salsalitos Mexican Restaurant Towne Car San Antonio Sales Volume $4,566,094,000 Elegant Limousine & Charter Catering by Rosemary Inc. Source: InfoUSA, 2011, Calculations by SABÉR Institute Source: InfoUSA, 2011 Number and Percent of Establishments by Employee Size Range in San Antonio MSA, (5.4%) 987 (16.7%) 1,601 (27.1%) 1,951 (33.1%) 1,041 (17.7%) (4.0%) Number and Percent of Establishments by Sales Volume Range in San Antonio MSA, (0.6%) 1,099 (18.6%) 999 (16.9%) 12 (0.2%) 3 (0.1%) 3,513 (59.6%) Less than $500,000 $500,000-1 Million $1-2.5 Million $2.5-5 Million $5-10 Million $10-20 Million $20-50 Million Source: InfoUSA, 2011, Calculations by SABÉR Institute Source: InfoUSA, 2011, Calculations by SABÉR Institute Industry Trends From 1998 to 2008, the economic impact of San Antonio s Hospitality industry grew substantially, from $6.4 billion in 1998 to $11 billion in 2008, an increase of 70%. Employment in the industry increased by 26% over the decade. Total wages rose by 71% in the ten-year period between 1998 and From 1998 to 2008, all of the industry s major sectors experienced growth. The Restaurant sector remained the dominant sector throughout this decade. Between 1998 and 2008, the economic impact of the Restaurant sector increased by 80%, while that of Lodging and Entertainment rose by 67% and 200%, respectively. The Hospitality industry contributed about $150 million in taxes and fees to San Antonio, and more than $280 million to all local governments combined. In 2008, the industry employed one out of every eight workers in the San Antonio metropolitan area. Similarly, the state s hospitality industry has been growing. From August 2010 to August 2011, Texas Hospitality industry gained 36,100 jobs, an annual growth rate of 3.5%. Sources: The Economic Impact of San Antonio s Hospitality Industry, by Richard V. Butler and Mary E. Stefl, The Greater San Antonio Chamber of Commerce; San Antonio Area Tourism Council; Real Estate Center, AT Texas A&M University. 33
35 34
36 Information Technology & Security San Antonio Metropolitan Statistical Area (MSA) Industry Overview The Information Technology & Security industry (NAICS 32, 33, 42, 44, 45, 51, 52, 54, 61, 81) includes establishments primarily engaged in manufacturing (1) electronic computers, (2) computer storage devices, (3) computer terminals, (4) point-of-sale, funds transfer, and automatic teller machines, (5) computer peripheral equipment, (6) electronic audio and video equipment, (7) communications equipment, (8) electronic components and accessories, and (9) magnetic and optical recording media. Please note that all data, except data on industry trends, refer to establishments with less than 100 employees. Industry Facts Selected Major Industry Employers Establishments 787 E.J. Ward, Inc. Photo Telesis Corporation Employment 5,327 Alliance Data Digital Defense Inc. Sales Volume $1,582,281,000 Secure Logix Corporation Computer Solutions Source: InfoUSA, 2011, Calculations by SABÉR Institute Source: InfoUSA, 2011 Number and Percent of Establishments by Employee Size Range in San Antonio MSA, (4.7%) (8.4%) 155 (19.7%) 21 (2.7%) 508 (64.5%) Number and Percent of Establishments by Sales Volume Range in San Antonio MSA, (4.8%) 17 1 (0.9%) (2.2%) (0.1%) 50 (6.4%) 194 (24.7%) 163 (20.7%) 316 (40.2%) 1 (0.1%) Less than $500,000 $500,000-1 Million $1-2.5 Million $2.5-5 Million $5-10 Million $10-20 Million $20-50 Million $ Million $ Million Source: InfoUSA, 2011, Calculations by SABÉR Institute Source: InfoUSA, 2011, Calculations by SABÉR Institute Industry Trends The state of Texas ranked #2 nationwide in the number of high-tech workers, in high-tech employment growth, in the size of high-tech payroll, and in the number of high-tech establishments in In 2008, the average tech industry wage in the state paid 82% more than the average private sector wage. Between 1998 and 2008, the economic impact of the Information Technology industry in San Antonio grew from $4 billion to $8 billion. The number of employees in San Antonio grew by 44%, from 10,870 in 1998 to 15,648 in This is equivalent to a 3.71% annualized growth rate. Annual payroll in the industry in San Antonio rose by 97% during the period , from $447.3 million in 1998 to $881.9 million in This is equivalent to a 7.02% annualized growth rate. Sources: Office of the Governor Economic Development & Tourism, San Antonio Area Tourism Council; Information Technology in San Antonio: Economic Impact in 2008, by Richard V. Butler and Mary E. Stefl, The Greater San Antonio Chamber of Commerce; San Antonio Area Tourism Council; Real Estate Center, AT Texas A&M University. 35
37 36
38 New Energy San Antonio Metropolitan Statistical Area (MSA) Industry Overview The New Energy industry (NAICS 22, 23, 33, 54, 81) includes establishments primarily engaged in operating (1) hydroelectric power generation facilities, (2) fossil fuel powered electric power generation facilities, (3) nuclear electric power generation facilities, (4) electric power generation facilities, (5) gas distribution systems, and (6) water treatment plants. Please note that all data, except data on industry trends, refer to establishments with less than 100 employees. Industry Facts Selected Major Industry Employers Establishments 735 Ella S.A. Contracting Alamo Transformer Supply Co. Employment 6,985 Goetting & Associates, Inc. Central Backhoe-Svc-Utilities Sales Volume $2,100,576,000 Medina Electric Cooperative, Inc. Halff Associates, Inc. Source: InfoUSA, 2011, Calculations by SABÉR Institute Source: InfoUSA, 2011 Number and Percent of Establishments by Employee Size Range in San Antonio MSA, (4.2%) (9.3%) 101 (13.7%) 189 (25.7%) 346 (47.1%) Source: InfoUSA, 2011, Calculations by SABÉR Institute (5.2%) 53 (7.2%) 75 (10.2%) Number and Percent of Establishments by Sales Volume Range in San Antonio MSA, (29.0%) 9 (1.2%) 4 (0.5%) 223 (30.3%) 120 (16.3%) Source: InfoUSA, 2011, Calculations by SABÉR Institute Less than $500,000 $500,000-1 Million $1-2.5 Million $2.5-5 Million $5-10 Million $10-20 Million $20-50 Million $ Million Industry Trends In 2010, the Energy Industry contributed more than $170 billion to the Texas economy. In recent years, the state has built upon its energy experience and trained workforce to take the lead in renewable energy production and services. In 2009, Texas was ranked #2 nationally in the number of renewable energy jobs, with 15% growth between 1998 and Furthermore, it was ranked #3 nationally in clean energy venture capital for the years , attracting more than $716 million. Between now and 2035, the Energy Information Administration (EIA) projects the strongest growth in fuel use to occur in renewable fuels used to generate electricity and to power vehicles. The EIA credits this growth primarily to government programs, including state RPS programs like that in Texas, along with rising fossil fuel prices. Sources: Texas Renewable Energy Industry Report 2010; Office of the Governor Economic Development & Tourism 37
39 38
40 Retail Trade San Antonio Metropolitan Statistical Area (MSA) Industry Overview The Retail Trade industry (NAICS 31, 42, 44, 45, 72, 81) includes establishments engaged in selling merchandise for personal or household consumption and rendering services incidental to the sale of the goods. In general, retail establishments are classified by kind of business according to the principal lines of commodities sold (groceries, hardware, etc.), or the usual trade designation (drug store, cigar store, etc.). Please note that all data, except data on industry trends, refer to establishments with less than 100 employees. Industry Facts Selected Major Industry Employers Establishments 8,585 La Fiesta Supermarkets Freightliner of San Antonio Ltd. Employment 59,596 Save Cleaners & Laundry Optical Dispensary Sales Volume $16,596,033,000 Lambeth Sales & Supply Co. Alamo Aircraft Source: InfoUSA, 2011, Calculations by SABÉR Institute Source: InfoUSA, 2011 Number and Percent of Establishments by Employee Size Range in San Antonio MSA, (10.1%) 527 (6.1%) 1,757 (20.5%) 155 (1.8%) 5,282 (61.5%) (3.9%) 154 (1.8%) 812 (9.5%) Number and Percent of Establishments by Sales Volume Range in San Antonio MSA, (1.0%) 2,136 (24.9%) 2,198 (25.6%) 11 (0.1%) 1 (0.0%) 2,850 (33.2%) Less than $500,000 $500,000-1 Million $1-2.5 Million $2.5-5 Million $5-10 Million $10-20 Million $20-50 Million $ Million $ Million Source: InfoUSA, 2011, Calculations by SABÉR Institute Source: InfoUSA, 2011, Calculations by SABÉR Institute Industry Trends Between 1998 and 2009, the number of employees saw an increasing trend in the Retail Industry in both San Antonio and in the state of Texas. While the total number of employees in Texas grew by 18%, this number rose by 29% in San Antonio. This is equivalent to a 1.48% annualized growth rate and 2.31%, respectively. Retail Trade remained the #2 industry employer in both Texas and San Antonio for the time period Since December 2009, retail trade added 1,500 jobs and gained 2,200 jobs in San Antonio, an annual growth rate of 2.2%. The growth was mainly due to seasonal hiring. Between 1999 and 2009, total gross retail sales in San Antonio increased by 13%, from $21.3 billion in 1999 to $24.1 billion in This is equivalent to a 1.26% annualized growth rate. Retail sales per capita decreased by 8% over the period , from $12,619 in 1999 down to $11,653 in In 2009, the state average retail sales per capita amounted to $14,462. Sources: U.S. Census Bureau, County Business Patterns, Calculations by SABÉR Institute; Market Report 2011: San Antonio-New Braunfels, Real Estate Center at Texas A&M University. 39
41 40
 extracting oil from oil sands and oil shale; (3) producing natural gasoline and cycle condensate; and (4) producing gas and hydrocarbon liquids from coal at the mine site.")
42 Oil & Gas San Antonio Metropolitan Statistical Area (MSA) Industry Overview The Oil & Gas industry (NAICS 21, 23, 33) includes establishments primarily engaged in: (1) producing crude petroleum and natural gas; (2) extracting oil from oil sands and oil shale; (3) producing natural gasoline and cycle condensate; and (4) producing gas and hydrocarbon liquids from coal at the mine site. Types of activities included are exploration, drilling, oil and gas well operation and maintenance, the operation of natural gasoline and cycle plants, and the gasification, liquefaction, and pyrolysis of coal at mine site. Please note that all data, except data on industry trends, refer to establishments with less than 100 employees. Industry Facts Selected Major Industry Employers Establishments 428 Hanson Aggregates Keller Material Inc. Employment 3,580 Abraxas Petroleum Corp. A&L Underground Inc. Sales Volume $1,216,575,000 M&M Contracting Ltd. Midtex Oil L.P. Source: InfoUSA, 2011, Calculations by SABÉR Institute Source: InfoUSA, (15.2%) Number and Percent of Establishments by Employee Size Range in San Antonio MSA, (9.6%) 55 (12.9%) 12 (2.8%) 255 (59.6%) (8.9%) 15 (3.5%) 69 (16.1%) Number and Percent of Establishments by Sales Volume Range in San Antonio MSA, (1.2%) 84 (19.6%) 105 (24.5%) 110 (25.7%) 2 (0.5%) Less than $500,000 $500,000-1 Million $1-2.5 Million $2.5-5 Million $5-10 Million $10-20 Million $20-50 Million $ Million Source: InfoUSA, 2011, Calculations by SABÉR Institute Source: InfoUSA, 2011, Calculations by SABÉR Institute Industry Trends Employment in Texas Oil & Gas industry rebounded to its pre-recession highs, according to the Texas Petro Index (TPI). The state of Texas employed 224,200 workers in oil and gas exploration and production in June 2011, more than the 223,200 at the height of the last energy boom in October 2008 and nearly 15% more than in June Oil production beat out natural gas during the first six months of 2011, reversing a trend that started in 1997 when natural gas began to dominate the state s energy production. In the past 12 months, the oil and gas industry in the state of Texas has added more than 28,600 jobs. This is nearly 13% of all jobs added to the Texas economy. Since 2009, the industry produced about 55% of all new jobs (both directly and indirectly). According to the Energy Information Administration (EIA), Texas is the leading crude oil-producing state in the nation. The state s signature type of crude oil, known as West Texas Intermediate (WTI), remains the major benchmark of crude oil in the Americas. Approximately three-tenths of total U.S. natural gas production occurs in Texas, making it the Nation s leading natural gas producer. Source: Texas Energy Alliance, Petro Index; U.S. Energy Information Administration, U.S. States, Texas. 41
43 42
.")
44 Construction San Antonio Metropolitan Statistical Area (MSA) Industry Overview The Construction industry (NAICS 23) comprises establishments primarily engaged in the construction of buildings or engineering projects (e.g., highways and utility systems). Establishments primarily engaged in the preparation of sites for new construction and establishments primarily engaged in subdividing land for sale as building sites also are included in this industry sector. Industry Facts Selected Major Industry Employers Establishments 4,016 Applied Finish Systems J.E. Travis Painting Inc. Employment 28,356 The Koehler Company Quarter Moon Plumbing Inc. Sales Volume $6,673,606,000 Shadrock & Williams Mason Ltd. Acme Bridge Co. Source: InfoUSA, 2011, Calculations by SABÉR Institute Source: InfoUSA, 2011 Number and Percent of Establishments by Employee Size Range in San Antonio MSA, (10.7%) 245 (6.1%) 627 (15.6%) 96 (2.4%) 2,620 (65.2%) (4.4%) (8.0%) Number and Percent of Establishments by Sales Volume Range in San Antonio MSA, ,118 (27.8%) (2.3%) 12 1 (0.3%) (0.0%) 937 (23.3%) 1,357 (33.8%) Less than $500,000 $500,000-1 Million $1-2.5 Million $2.5-5 Million $5-10 Million $10-20 Million $20-50 Million $ Million Source: InfoUSA, 2011, Calculations by SABÉR Institute Source: InfoUSA, 2011, Calculations by SABÉR Institute Industry Trends According to the Texas Workforce Commission and Real Estate Center at Texas A&M University, Texas Construction industry lost 6,500 jobs from December 2010 to December 2011, a 1% decrease. Although the Texas Construction industry lost jobs in the previous two fiscal years, and lost more than 17% of its workforce during the recession, the industry has recovered almost one-third of the jobs lost since the industry started growing again in the middle of With 4.8% job growth during 2011, most of the construction jobs added have been in heavy and civil construction, and in utility construction work by specialty trade contractors. Only one-fourth of the 27,100 industry jobs added during 2011 have been in the construction of buildings and residences, as single-family residential construction remains depressed. Most sectors of the Construction industry have grown, but highway, street, and bridge construction and building finishing contractors have continued to see declines. The local construction sector appears to be holding stable, according to the recent analysis by the Associated General Contractors of America. The construction employment report shows that the metropolitan market had 42,900 construction jobs as of October This is up 2% from October 2010, when the San Antonio metropolitan area had 42,000 construction jobs. Sources: Monthly Review of the Texas Economy, by Ali Anari and Mark G. Dotzour, January 2012; 2011 Annual Cash Report Review of the Texas Economy, Susan Combs, Texas Comptroller of Public Accounts; The Associated General Contractors of America (AGC). 43
Fort McPherson. Atlanta, GA MSA. Drivers of Economic Growth February 2014. Prepared By: chmuraecon.com
 Fort McPherson Atlanta, GA MSA Drivers of Economic Growth February 2014 Diversified and fast-growing economies are more stable and are less sensitive to external economic shocks. This report examines recent
On March 11, 2010, President Barack
 U.S. Department of Commerce International Trade Administration Introduction Exports Support American Jobs Updated measure will quantify progress as global economy recovers. On March 11, 21, President Barack
Survey of Business Owners Veteran-Owned Firms
 Survey of Business Owners Veteran-Owned Firms Interagency Task Force on Veterans Small Business Development Meeting March 10, 2016 Presented by: Naomi Blackman, US Census Bureau Agenda Survey of Business
HOSPITAL INDUSTRY IN SOUTHERN CALIFORNIA ECONOMIC IMPACT ANALYSIS. Los Angeles County Economic Development Corporation
 HOSPITAL INDUSTRY IN SOUTHERN CALIFORNIA ECONOMIC IMPACT ANALYSIS Los Angeles County Economic Development Corporation Christine Cooper, Ph.D. Myasnik Poghosyan Shannon Sedgwick January 2012 This report
KING COLLEGE SCHOOL OF BUSINESS KING COLLEGE REGIONAL ECONOMIC STUDIES (KCRES) KCRES PAPER NO. 4, May 2012
 KCRES PAPER NO. 4, May 2012") KING COLLEGE SCHOOL OF BUSINESS KING COLLEGE REGIONAL ECONOMIC STUDIES (KCRES) KCRES PAPER NO. 4, May 2012 Economic Impact Multipliers for the Coalfield Region of Southwestern Virginia The Coalfield Region
KING COLLEGE SCHOOL OF BUSINESS KING COLLEGE REGIONAL ECONOMIC STUDIES (KCRES) KCRES PAPER NO. 4, May 2012 Economic Impact Multipliers for the Coalfield Region of Southwestern Virginia The Coalfield Region
Minorities in Business: A Demographic Review of Minority Business Ownership
 Office of Advocacy www.sba.gov/advo Advocacy: the voice of small business in government Minorities in Business: A Demographic Review of Minority Business Ownership Office of Advocacy U.S. Small Business
Industry Sector Analysis
 Industry Sector Analysis Growth, Core, and Competitive-Advantage Industries Southeast Michigan Macomb, Monroe, Oakland, St. Clair and Wayne Counties A Regional Profile Prepared by: Michigan Department
Dynamics of Minority- Owned Employer Establishments, 1997-2001
 A Voice for Small Business Dynamics of Minority- Owned Employer Establishments, 1997-2001 An analysis of employer data from the Survey of Minority-Owned Business Establishments Created by Congress in 1976,
Toronto Employment Survey 2014
 This bulletin summarizes the highlights of the 2014 City of Toronto annual Survey, marking its 32 nd consecutive year. This information resource presents a picture of change in Toronto s economy throughout
Small Business Data Assess Your Competition Define Your Customers
 Small Business Data Assess Your Competition Define Your Customers Census Bureau Data Can Answer Many Questions What Is Census Bureau Data? Economic / business data Economic Census County Business Patterns
Summary of Employment, Demographics, and Commuting Patterns for Marion County, Florida
 FLORIDA DEPARTMENT OF ECONOMIC OPPORTUNITY, BUREAU OF LABOR MARKET STATISTICS Summary of Employment, Demographics, and Commuting Patterns for Marion County, Florida March 2015 Contents Labor Shed Analysis...
HOUSTON-THE WOODLANDS-SUGAR LAND METROPOLITAN STATISTICAL AREA (H-W-S MSA) Visit our website at www.wrksolutions.com
 Visit our website at www.wrksolutions.com") Labor Market Information SEPTEMBER 2015 Employment Data HOUSTON-THE WOODLANDS-SUGAR LAND METROPOLITAN STATISTICAL AREA () Visit our website at www.wrksolutions.com THE RATE OF UNEMPLOYMENT IN THE WAS UNCHANGED
Labor Market Information SEPTEMBER 2015 Employment Data HOUSTON-THE WOODLANDS-SUGAR LAND METROPOLITAN STATISTICAL AREA () Visit our website at www.wrksolutions.com THE RATE OF UNEMPLOYMENT IN THE WAS UNCHANGED
Box 3.1: Business Costs of Singapore s Manufacturing and Services Sectors
 Economic Survey of Singapore 213 Box 3.1: Business Costs of Singapore s Manufacturing and Services Sectors Business costs in the manufacturing and services sectors have increased after a period of decline
Contribution of S ESOPs to participants retirement security
 Contribution of S ESOPs to participants retirement security Prepared for the Employee-Owned S Corporations of America March 2015 Executive summary Since 1998, S corporations have been permitted to maintain
LATEST DATA ON MINORITY BUSINESSES IN MINNESOTA, 2015
 LATEST DATA ON MINORITY BUSINESSES IN MINNESOTA, 2015 This report provides the latest data and analysis on minority owned businesses in Minnesota using data from the Survey of Business Owners, 2012 Bruce
A Labour Economic Profile of New Brunswick
 A Labour Economic Profile of New Brunswick January 2016 Table of Contents New Brunswick Highlights........................... 2 Current Business Environment....................... 3 GDP Snapshot....................................
From Higher Education to Work in West Virginia, 2012
 From Higher Education to Work in West Virginia, 2012 Eric Bowen, Research Associate John Deskins, PhD, Director January 2014 Copyright 2014 WVU Research Corporation Funding for this research was provided
Summary. Abbas P. Grammy 1 Professor of Economics California State University, Bakersfield
 The State of the Economy: Kern County, California Summary Abbas P. Grammy 1 Professor of Economics California State University, Bakersfield Kern County households follow national trends. They turned less
Women-Owned Firms in the U.S. A Review of Important Areas of the 2007 U.S. Census Bureau s Survey of Business Owners
 Women-Owned Firms in the U.S. A Review of Important Areas of the 2007 U.S. Census Bureau s Survey of Business Owners January 2012 1 WOMEN-OWNED FIRMS IN THE U.S. A REVIEW OF IMPORTANT AREAS OF THE 2007
ECONOMIC TRENDS MONTHLY
 ECONOMIC TRENDS MONTHLY ISSUED APRIL 28, 2012 COVERING DATA THRU MARCH 2012 Steve Nivin, Ph.D.; Maya Halebic, M.B.A.; Ramiro Cavazos Please contact Steve Nivin with any questions or comments at snivin@saberinstitute.org
Maryland s Job Growth Continues to Lag in 2014 State behind national growth rates for fourth consecutive year
 Maryland s Job Growth Continues to Lag in 2014 State behind national growth rates for fourth consecutive year Job growth in Maryland continued to lag the U.S. in 2014 for the fourth consecutive year. Moreover,
Economic Development Planning, Summary 7
 Economic Development Planning, Summary 7 Unless otherwise noted, summaries represent findings and analyses by the listed source, not by Morrison Institute for Public Policy or Arizona State University.
2013 YEAR-END ECONOMIC REPORT
 YEAR-END ECONOMIC REPORT YEAR-END ECONOMIC REPORT 1 NATIONAL SMALL BUSINESS ASSOCIATION FOREWORD The National Small Business Association (NSBA) is the nation s first small-business advocacy group celebrating
Wages of Employed Texans Who Attended Texas Public Schools
 Wage Comparision by Educational Attainment for Texans Age 25 to 30 Median 4th Quarter Wages Number Employed Earnings Year 2010 2011 2012 2010 2011 2012 Educational Attainment Advanced Bachelor's Associate
A Portrait of Seattle s Low-Income Working Population
 A Portrait of Seattle s Low-Income Working Population December 2011 Support provided by the City of Seattle Office of Economic Development 1 INTRODUCTION The Great Recession, now over two years gone, has
Startup Business Characteristics and Dynamics: A Data Analysis of the Kauffman Firm Survey
 Startup Business Characteristics and Dynamics: A Data Analysis of the Kauffman Firm Survey A Working Paper by Ying Lowrey Office of Advocacy for Release Date: August 2009 The statements, findings, conclusions,
The Office of Advocacy
 The Office of Advocacy Created by Congress in 1976, the Office of Advocacy of the U.S. Small Business Administration (SBA) is an independent voice for small business within the federal government. Appointed
MBA Forecast Commentary Joel Kan, jkan@mba.org
 MBA Forecast Commentary Joel Kan, jkan@mba.org Weak First Quarter, But Growth Expected to Recover MBA Economic and Mortgage Finance Commentary: May 2015 Broad economic growth in the US got off to a slow
White Paper. Understanding California s Electricity Prices
 White Paper Understanding California s Electricity Prices Executive Summary Most industry experts predict that average electricity prices throughout the U.S. will increase significantly over the next decade.
Changes in Self-Employment: 2010 to 2011
 Changes in Self-Employment: 2010 to 2011 American Community Survey Briefs By China Layne Issued January 2013 ACSBR/11-21 INTRODUCTION From December 2007 to June 2009, the United States experienced an economic
Vigo County, Indiana Economic Overview
 Vigo County, Indiana Economic Overview October 2012 Prepared By: 1 Table of Contents Introduction 3 Demographic Perspective Table 1: Population Change 4 Table 2: Age Breakdown 4 Table 3: Educational Attainment
Veteran-owned Businesses and their Owners Data from the Census Bureau s Survey of Business Owners
 Office of Advocacy www.sba.gov/advocacy Veteran-owned Businesses and their Owners Data from the Census Bureau s Survey of Business Owners Office of Advocacy U.S. Small Business Administration March 22
National Community Reinvestment Coalition Analysis Small Business Lending Deserts and Oases
 S E P T E M B E R 20 1 4 By Archana Pradhan, Senior Research Analyst, National Community Reinvestment Coalition and Josh Silver, Vice President of Research and Policy, About the The is a nonprofit, nonpartisan
Vista. The Texas Mexico border is a fast-growing region, a complex blend of U.S. and Mexican cultures, languages and customs.
 Federal Reserve Bank of Dallas San Antonio Branch South Economic Trends and Issues Issue 2, 2005 Cyclical Differences Emerge in Border City Economies S Vista ince the implementation of NAFTA, the South
Colorado Employment Outlook Summary
 Each year, thousands of Coloradans seek employment while others enroll in educational programs designed to prepare them for various occupations. Without information about future occupational and industry
Economic Forecast OUTPUT AND EMPLOYMENT WHAT THE TABLE SHOWS:
 Economic Forecast OUTPUT AND EMPLOYMENT 7 8 9 1 11 1 13 1 1 United States Real GDP $ billions (fourth quarter) $1,996 $1,7 $1, $1,9 $1, $1, $1,9 $16,1 $17,1 % change over the four quarters 1.9% -.8% -.%.8%.%.%.6%
Professional and Business Services Employment Trends in the Richmond MSA
 Professional and Business Services Trends in the Richmond MSA Prepared for Resource Greater Richmond, Virginia Professional and Business Services Trends in the Richmond MSA Key Findings The Professional
Healthcare Industry Employment Trends in the Richmond MSA. Prepared for Resource s Healthcare Industry Employment Summit
 Healthcare Industry Trends in the Richmond MSA Prepared for Resource s Healthcare Industry Summit Healthcare Industry Trends in the Richmond MSA Key Findings The importance of the healthcare industry to
Regional Competitive Industry Analysis
 Regional Competitive Industry Analysis Clackamas, Multnomah, and Washington Counties May 2014 Washington Multnomah Clackamas Michael Meyers, Economist (503) 229-6179 Michael.Meyers@biz.state.or.us Global
The Economic Impact of Tourism in Ohio. May 2011
 The Economic Impact of Tourism in Ohio May 2011 Key themes for 2010 The Ohio visitor economy rebounded in 2010, recovering about 70% of the losses experienced during the recession Visitor volumes expanded
These data were developed in cooperation with, and partially funded by, the Office of Advocacy of the U.S. Small Business Administration (SBA)
") Introduction Statistics of U.S. Businesses (SUSB) is an annual series that provides national and subnational data on the distribution of economic data by enterprise size and industry. SUSB covers most
Introduction Statistics of U.S. Businesses (SUSB) is an annual series that provides national and subnational data on the distribution of economic data by enterprise size and industry. SUSB covers most
Impact of the recession
 Regional Trends 43 21/11 Impact of the recession By Cecilia Campos, Alistair Dent, Robert Fry and Alice Reid, Office for National Statistics Abstract This report looks at the impact that the most recent
FORMULA FOR ILLINOIS FUTURE IN BIOSCIENCE ILLINOIS SCIENCE + TECHNOLOGY PARK. EXECUTIVE SUMMARY ADDENDUM February 2006
 FORMULA FOR ILLINOIS FUTURE IN BIOSCIENCE ILLINOIS SCIENCE + TECHNOLOGY PARK EXECUTIVE SUMMARY ADDENDUM February 2006 PREPARED BY Applied Real Estate Analysis, Inc. (AREA), a multidisciplinary real estate
THE 2006 LOUISIANA TOURISM SATELLITE ACCOUNT AN UPDATE
 THE 2006 LOUISIANA TOURISM SATELLITE ACCOUNT AN UPDATE Submitted to The Louisiana Department of Culture, Recreation and Tourism And The Office of the Lieutenant Governor By Professor Dek Terrell Director,
REGIONAL QUARTERLY REPORT
 April 2015 1 REGIONAL QUARTERLY REPORT State Personal Income and More... In this report... Fourth-quarter 2014 state personal income statistics, page 1 Acknowledgments, page 3 Annual state personal income
2016 Business Conditions & Indicators Report
 2016 Business Conditions & Indicators Report Since 2002, The Lincoln economic development partners have been facilitating a formal Business Retention & Expansion Program. This program would not be possible
Tim O Neill Twin Cities Regional Analyst Labor Market Information Office
 Twin Cities Labor Market Trends Tim O Neill Twin Cities Regional Analyst Labor Market Information Office Labor Market Information (LMI) Office LMI Office supports state workforce and economic development
The Small Business Share of GDP, 1998-2004
 The Small Business Share of GDP, 1998-2004 by Katherine Kobe Economic Consulting Services, LLC for under contract number SBAHQ-05-M-0413 Release Date: April 2007 The statements, findings, conclusions,
Nevada s 2015 Annual Unemployment Rate Revised Downward to 6.7 Percent
 For Immediate Release February 25, 2016 Nevada s 2015 Annual Unemployment Rate Revised Downward to 6.7 Percent CARSON CITY, NV Nevada s annual unemployment rate for 2015 that was previously estimated at
The goal is to transform data into information, and information into insight. Carly Fiorina
 DEMOGRAPHICS & DATA The goal is to transform data into information, and information into insight. Carly Fiorina 11 MILWAUKEE CITYWIDE POLICY PLAN This chapter presents data and trends in the city s population
2014 Kern County. Economic Forecast. California
 214 Kern County Economic Forecast California Economic Forecast March 26, 214 Bakersfield, California The 214 Kern County Economic Forecast Volume 1 March 214 Prepared for: Kern Economic Development Corporation
Labor Market Report Spring 2014
 Industry Composition (top five by percentage of total industry employment) Retail 12.8% 10,350 workers Manufacturing 18.2% 14,683 workers Labor Market Report Spring 2014 Government 18.2% 14,651 workers
The traditional work schedule for an
 A time to work: recent trends in work and flexible schedules Numerous U.S. workers have work schedules different from the standard 9 a.m.-to-5 p.m., Monday-through-Friday, work ; the demands of the industry
SEMICONDUCTOR INDUSTRY ASSOCIATION FACTBOOK
 SEMICONDUCTOR INDUSTRY ASSOCIATION FACTBOOK The data included in the 2014 SIA Factbook helps demonstrate the strength and promise of the U.S. semiconductor industry and why it is critical for policymakers
How To Help Small Businesses In North Carolina
 STATE SUPPORT FOR SMALL BUSINESS LENDING: A Roadmap for North Carolina October 2014 Introduction Small businesses are the economic engines of our state and local communities. In North Carolina, businesses
THE STATE OF THE ECONOMY
 THE STATE OF THE ECONOMY CARLY HARRISON Portland State University Following data revisions, the economy continues to grow steadily, but slowly, in line with expectations. Gross domestic product has increased,
Liberty County, Florida
 Liberty County, Florida DEMOGRAPHIC PROFILE Year Population 1940 3,752 1950 3,182 1960 3,138 1970 3,379 1980 4,260 1990 5,569 2000 7,021 2001 7,132 Projected 2010 10,100 2020 13,100 2030 16,400 Located
North Bay Industry Sector Rankings (By County) October 2015 Jim Cassio
 October 2015 Jim Cassio") North Bay Rankings (By County) October 2015 Jim Cassio North Bay Rankings (By County) Source: EMSI (Economic Modeling Specialists, Intl.) Contents Lake County... 3 Jobs... 3 Job Growth (Projected)...
North Bay Rankings (By County) October 2015 Jim Cassio North Bay Rankings (By County) Source: EMSI (Economic Modeling Specialists, Intl.) Contents Lake County... 3 Jobs... 3 Job Growth (Projected)...
Supply and Demand Conditions for Electricians. An Update of Labor Market and Electrician Program Data. December 2013
 Supply and Demand Conditions for Electricians An Update of Labor Market and Electrician Program Data December 2013 Prepared by: Mohamed Mourssi-Alfash, Ph.D. Research Analyst (651) 259-7416 Mohamed.mourssi@state.mn.us
ECONOMIC OUTLOOK: TEXAS AND THE AUSTIN REGION. Texas Office of the Governor Economic Development and Tourism Division
 ECONOMIC OUTLOOK: TEXAS AND THE AUSTIN REGION Texas Office of the Governor Economic Development and Tourism Division Market Texas as a leading business location Advertising and business recruitment trips
San Antonio-New Braunfels, Texas
 Goliad C O M P R E H E N S I V E H O U S I N G M A R K E T A N A L Y S I S San Antonio-New Braunfels, Texas U.S. Department of Housing and Urban Development Office of Policy Development and Research As
Economic Forecast OUTPUT AND EMPLOYMENT WHAT THE TABLE SHOWS:
 June, Economic Forecast OUTPUT AND EMPLOYMENT 7 8 9 5 United States Real GDP $ billions (fourth quarter) $,996 $,575 $,5 $,9 $5, $5,5 $5,9 $6,5 $7, % change over the four quarters.9% -.8% -.%.8%.%.%.6%.5%.8%
FIS Mergent Online. Walsh College Library. Select one or more of the databases to search
 Walsh College Library FIS Mergent Online U.S. Company Data Financial information on over 25,000 U.S. public companies (active & inactive) International Company Data Financial information for over 20,000
RegionalReport SUMMARY 09-08 AUGUST 2009 U.S. BUREAU OF LABOR STATISTICS
 RegionalReport SUMMARY 09-08 AUGUST 2009 U.S. BUREAU OF LABOR STATISTICS After the Dot-Com Bubble: Silicon Valley High-Tech Employment and Wages in 2001 and Authors: Amar Mann Regional Economist San Francisco
Calgary Small Businesses: Fact Sheet
 Calgary Small Businesses: Fact Sheet Calgary small businesses account for nearly 95 per cent of all businesses they are a driving force within the city s business community. Small business owners have
College Park Latitude: 28.571156 Edgewater Dr & W Princeton St, Orlando, FL 32804 Longitude: -81.38947 Ring: 1.5 Miles
 Site Map 2010 ESRI 3/03/2011 Page 1 of 1 Traffic Count Map College Park Edgewater Dr & W Princeton St, Orlando, FL 32804 Latitude: 28.571156 Longitude: -81.38947 Source: 2010 MPSI Systems Inc. d.b.a. DataMetrix
Strong Employment Growth in Mountainland
 localinsightssummer mountainland 2015 An economic and labor market analysis of the Area mountainland Summit Wasatch Utah Juab In Depth: Construction's vital role in the economy. Strong Employment Growth
Northeast Minnesota Labor Market Trends Pathways 2 Postsecondary Summit October 10, 2014
 Northeast Minnesota Labor Market Trends Pathways 2 Postsecondary Summit October 10, 2014 Cameron Macht Regional Analysis & Outreach Manager Minnesota Dept. of Employment & Economic Development Labor Market
Hispanic Businesses & Entrepreneurs Drive Growth in the New Economy 3rd Annual Report 2015
 Hispanic Businesses & Entrepreneurs Drive Growth in the New Economy 3rd Annual Report 2015 TM An intelligence briefing presented by: Copyright 2015, Geoscape and/or its affiliates. All rights reserved.
Saskatchewan Small Business Profile 2015
 Saskatchewan Small Business Profile 2015 October 2015 Ministry of the Economy Performance and Strategic Initiatives Division economy.gov.sk.ca Table of Contents INTRODUCTION... 1 KEY FACTS... 3 1. SMALL
By Melissa S. Kearney, Brad Hershbein, and Elisa Jácome The Hamilton Project
 PROFILES OF CHANGE: EMPLOYMENT, EARNINGS, AND OCCUPATIONS FROM 1990-2013 April 20, 2015 By Melissa S. Kearney, Brad Hershbein, and Elisa Jácome The Hamilton Project There has been tremendous focus in recent
SPECIAL QUESTIONS. June 29, 2015
 June 29, 2015 SPECIAL QUESTIONS Data were collected June 1 4, and 195 Texas business executives responded to the surveys. Oil prices today are near $60 per barrel, down from over $100 a year ago. Natural
Wisconsin's Exports A Special Report on Wisconsin's Economy
 Wisconsin's Exports A Special Report on Wisconsin's Economy April 2011 Wisconsin Department of Revenue Division of Research and Policy AT A GLANCE Wisconsin's goods exports increased 18.3% to $19.8 billion
Technical Report No. 1
 [TYPE THE COMPANY ADDRESS] [TYPE THE COMPANY ADDRESS] The Washington Metropolitan Area 2030 Economic Outlook: Standard Forecast Technical Report No. 1 By Stephen S. Fuller, Ph.D. Dwight Schar Faculty Chair
San Antonio, Texas. Summary. Housing Market Area. Market Details. Economy. Rental Market. Sales Market
 COMPREHENSIVE HOUSING MARKET ANALYSIS San Antonio, Texas U.S. Department of Housing and Urban Development Office of Policy Development and Research As of October 1, 2008 Summary Housing Market Area Kerr
Small Business Owners Favor Raising Federal Minimum Wage
 Small Business Owners Favor Raising Federal Minimum Wage RESULTS FROM A SCIENTIFIC NATIONAL PHONE POLL OF SMALL BUSINESS OWNERS WITH EMPLOYEES 2014 Poll report produced by: 1401 new york ave. nw, suite
Private Employer-Sponsored Health Insurance
 Washington State Private Employer-Sponsored Health Insurance Office of Financial Management Forecasting and Research Division October 2014 To accommodate persons with disabilities, this document is available
Hawaii New Business Formation an analysis of business birth, deaths, and survival rates
 an analysis of business birth, deaths, and survival rates November 2014 1 P a g e Table of Contents EXECUTIVE SUMMARY 3 I. INTRODUCTION 7 II. BIRTHS AND DEATHS OF HAWAII BUSINESS ESTABLISHMENTS 10 III.
Characteristics of Minnesota Business, 2007. All Firms Firms with Paid Employees Firms without Paid Employees. Number of Paid Employees
 Open for Business Women own one in four businesses in Minnesota, but the number of womenowned firms in the state grew at a surprisingly slow pace in the five years leading up to the recession. If you follow
Economic Impact of The Charleston International Airport Complex
 Economic Impact of The Charleston International Airport Complex Conducted by: Center for Business Research Charleston Metro Chamber of Commerce PO Box 975, Charleston SC 940 January 05 Economic Impact
ECONOMY OF YUMA. January 2008. Prepared by
 ECONOMY OF YUMA Prepared by January 2008 Center for Competitiveness and Prosperity Research L. William Seidman Research Institute W. P. Carey School of Business Arizona State University Tempe, Arizona
Casino Industry - Factors, Effects and Taxes
 Economic Impact of the US Gaming Industry September 2014 Methods Analysis includes: Commercial casinos Native American casinos Card rooms (California, Florida, Minnesota, Washington) Analysis excludes:
Regional Competitive Industry Analysis
 Regional Competitive Industry Analysis Crook, Deschutes, and Jefferson Counties May 2014 Jefferson Deschutes Crook Michael Meyers, Economist (503) 229-6179 Michael.Meyers@biz.state.or.us Global Strategies
Economic Forecast OUTPUT AND EMPLOYMENT WHAT THE TABLE SHOWS:
 Economic Forecast OUTPUT AND EMPLOYMENT 7 8 9 1 11 1 13 1 United States Real GDP $ billions (fourth quarter) $1,996 $1,575 $1,5 $1,9 $15, $15,5 $15,97 $16,6 % change over the four quarters 1.9% -.8% -.%.8%.%.%.%
Technology Use among Rural Nevada Businesses
 February 2013 Rural Nevada represents a large and vibrant portion of the state and its economy. Rural Nevada counties (those that are not a part of a Metropolitan Statistical Area) encompass just over
Mutual Benefits, Shared Growth: Small and Large Companies Working Together
 Mutual Benefits, Shared Growth: Small and Large Companies Working Together Prepared for Business Roundtable Matthew J. Slaughter Associate Dean of the MBA Program Signal Companies Professor of Management
Understanding California s Electricity Prices Updated April 2011
 White Paper Understanding California s Electricity Prices Updated April 2011 Executive Summary Most industry experts conclude that average electricity prices throughout the U.S. will increase significantly
2011 EMPLOYEE BENEFITS SURVEY REPORT
 2011 EMPLOYEE BENEFITS SURVEY REPORT Medical benefits Health insurance costs Premium coverage Retirement plans Paid leave Washington State Employment Security Department Labor Market and Economic Analysis
Office-Using Employment Growth Across Cities, 2000 to 2015
 Office-Using Employment Growth Across Cities, William Yu Economist, UCLA Anderson Forecast December 2015 In this report, we will discuss the growth of officeusing employment across metropolitan areas in
Think About Energy Summit
 Think About Energy Summit Richard Wobbekind Senior Associate Dean Executive Director Business Research Division Leeds School of Business Mining GDP, Employment, and Wages Share of Colorado Economy GDP
Recovery or Remission?
 San Antonio 2013 REAL ESTATE MARKET UPDATE Recovery or Remission? History of the Growth of San Antonio since 1950s (San Antonio) 91,000 new residents flocked to S.A. in 2 years. San Antonio's
New Mexico. Comparison Profile prepared by the New Mexico Economic Development Department State Data Center. Page 1 of 5
 DEMOGRAPHICS Population estimates, July 1, 2014 2,085,572 Population, percent change - April 1, 2010 to July 1, 2014 1.4% Population estimates, July 1, 2013 2,085,287 Population, percent change - April
Pay Later: The Cost of Inaction
 FACTS NEVADA A M E R I C A N S E C U R I T Y P R O J E C T Pay Now, Pay Later: Nevada Two million people in Nevada depend on Lake Mead for daily water consumption. There is a 50% chance that it will be
Florida Chamber Foundation 50 Florida Facts
 Florida Chamber Foundation 50 Florida Facts Talent Supply & Education 1. There are 459 Charter Schools operating in the state of Florida, which comprise approximately 13% of public schools. Source: Florida
DEUTSCHE ASSET & WEALTH MANAGEMENT REAL ESTATE OUTLOOK
 Research Report DEUTSCHE ASSET & WEALTH MANAGEMENT REAL ESTATE OUTLOOK Second Quarter 2013 Economic Outlook Business and consumer spending to drive recovery Quantitative easing beginning its expected unwinding
CENTER FOR LABOR MARKET STUDIES
 The Complete Breakdown in the High Schoolto Work Transition of Young, Non College Enrolled High School Graduates in the U.S.; The Need for an Immediate National Policy Response Prepared by: Andrew Sum
Economic Snapshot of the Salon and Spa Industry
 Economic Snapshot of the Salon and Spa Industry June 2011 Salon Industry Snapshot The salon and spa industry is a vibrant and growing component of the U.S. economy, with more than 900,000 total establishments
Serving the Community Well:
 Serving the Community Well: The Economic Impact of Wichita s Health Care and Related Industries 2014 Prepared for the Physicians who care for our patients, our community and our profession Economic impact
Immigrant Workers in the U.S. Labor Force
 Immigrant Workers in the U.S. Labor Force By Audrey Singer, March 15, 2012 Debates about illegal immigration, border security, skill levels of workers, unemployment, job growth and competition, and entrepreneurship
Competitive Analysis Economic Vision for the City of Burlington
 Competitive Analysis Economic Vision for the City of Burlington Burlington Economic Development Corporation DRAFT 1 Millier Dickinson Blais ACKNOWLEDGEMENT This report has been supported by the Ministry