Monitoring of Fine Particulate Matter (PM 2.5 )
|
|
|
- Karin Neal
- 8 years ago
- Views:
Transcription
1 Monitoring of Fine Particulate Matter (PM 2.5 ) in the Comox Valley Regional District, BC December, 2009 Prepared by: Karla Poplawski MSc (poplawski@alumni.uvic.ca) Eleanor Setton PhD (elsetton@gmail.com) Spatial Sciences Research Lab, Department of Geography, University of Victoria Phone: (250) Prepared for: The Vancouver Island Health Authority Population Health Surveillance Unit
 Spatial Sciences Research Lab, Department of Geography, University of Victoria Phone: (250)")
2 Acknowledgements This report represents the collective efforts of the following people: Comox Valley Air Quality Group: CVRD staff Beth Rees, Leigh Carter, Karin Albert, Ian Smith VIHA staff Dr Charmaine Enns, Michael Pennock, Christine Bender, Claudette Erdman, Dwayne Stroh Residents Group Paul Horgen Ministry of Environment staff Earle Plain, John Deniseger City of Courtenay staff Kevin Lagan City of Cumberland staff Joanne Pilson, Judy Walker Field Monitoring Group: University of Victoria Spatial Sciences Lab Karla Poplawski and Eleanor Setton (Equipment setup and calibration, data analysis and interpretation) VIHA Staff Dave Cherry (mobile data collection), Fiona Lawson (mobile data processing and mapping), Christine Bender (data interpretation) VIHA Contractors Natasha Guillos and Mark Kelsey (data downloading) Comox Valley Regional District staff Curtis Belsham (fixed site data collection) Ministry of Environment staff Co op student Derek Hall (mobile data collection), Earle Plaine (data interpretation) Additional data were provided by: Comox Valley Regional District Curtis Belsham, Park Steward Notes Ministry of Environment Air quality data from Campbell River and Nanaimo i
 VIHA Staff Dave Cherry (mobile data collection), Fiona Lawson (mobile data processing and mapping), Christine Bender (data interpretation) VIHA Contractors Natasha")
3 Contents Summary... 1 Introduction... 4 Methods... 5 Data Collection Schedule... 5 Equipment... 6 Results... 9 Mobile Monitoring... 9 Stationary Monitoring Appendix I Mobile Monitoring Maps Appendix II Daily Data Graphs and Supporting Information Apendix III Smoke Analysis Apendix IV Park Steward Notes List of Figures Figure 1. Monitoring locations in the Courtenay/Comox region... 6 Figure 2. Radiance Research nephelometer and typical set up scenarios... 7 Figure 3. Stationary monitoring data collection days... 8 Figure 4. Mobile collection route and typical concentration levels Figure hour average levels at the residences and control locations List of Tables Table 1. Summary of mobile monitoring data... 9 Table 2. Maximum measured PM 2.5 concentrations (ug/m 3 ) Table 3. Frequency distributions of average hourly concentration levels (ug/m 3 ) ii

4 Summary Air quality is of interest to residents and local government in the Comox Valley Regional District (CVRD). Currently, there is no regular air quality monitoring being conducted in the region. The Population Health Surveillance Unit of the Vancouver Island Health Authority has a mandate to identify areas where concentrations of air pollutants known to affect peoples health are elevated. Of special concern is fine particulate matter (PM 2.5 ), which can penetrate deep into the respiratory system and often has a range of toxic compounds adhered, for example heavy metals and polycyclic aromatic hydrocarbons. There are numerous sources of PM 2.5 in the CVRD, primarily combustion related, including traffic exhaust, wood burning for residential heating and cooking, beach fires, burning of debris from land clearing and construction, prescribed agricultural burning, forestry related burns and wildfires. In partnership with representatives of local residents, staff of local governments and the Ministry of Environment, and researchers at the University of Victoria, two preliminary monitoring campaigns were conducted to establish general levels of fine particulates (PM 2.5 ) in the CVRD. A mobile monitoring unit was driven on a regular route throughout the CVRD on 5 mornings and 6 evenings between December 2008 and March 2009 to identify areas where PM 2.5 was elevated on those days. Between June 15 th and September 2 nd, 2009, monitoring equipment was set up to run continuously at two sites: one in downtown Courtenay, and one at a residential location near Goose Spit Regional Park. A third monitor was used for several hours on each of 45 evenings at Goose Spit Regional Park to characterize very short term levels of PM 2.5 from wood smoke associated with recreational wood burning. Findings Mobile monitoring between December 2008 and March 2009 recorded PM 2.5 very shortterm (15 second average) concentrations in the range of less than 1 to 123 ug/m 3. In general, foggy conditions with winds from the west were associated with lower mean levels overall (7 and 9 ug/m 3 ) and the highest mean (20 ug/m 3 ) occurred on the coldest day ( 7.4 o c) under clear conditions. Areas with consistently higher PM 2.5 concentrations were western portions of Comox, in and around the denser commercial/residential area of Courtenay, and the denser residential areas of Cumberland. The source of these 1
, which can penetrate deep into the respiratory system and often has a range of toxic compounds adhered, for example heavy metals and polycyclic aromatic hydrocarbons.")
5 elevated levels is most likely wood smoke from residential wood burning, but may also reflect local traffic emissions. One hour average levels of PM 2.5 measured by the stationary monitors at the residential location and the control site (VIHA office) between June and September 2009 ranged from less than 2 ug/m 3 to 70 ug/m 3, with the 95 th percentile levels being 14 and 15 ug/m 3 respectively. There are no air quality guidelines for one hour average PM 2.5. The current Canadian health reference level for 24 hour average PM 2.5 is 15 ug/m hour averages at the residential and control sites ranged from less than 1 ug/m 3 to 10 ug/m 3 when considering only local sources between June and September of These levels were similar to levels measured at fixed site stations operated by the Ministry of Environment in Campbell River and Nanaimo during the same time period. Wildfires on Vancouver Island, in the interior of the province and in Washington State were seen to contribute significantly to higher levels of PM 2.5 in the region, with 24 hour average levels over the Health Reference Level of 15 ug/m 3 on a total of 4 days, the maximums being 20 ug/m 3 (control site) and 24 ug/m 3 (residential site). High levels of PM 2.5 over very short time periods (5 minute averages) were observed at Goose Spit Regional Park (maximum 334 ug/m 3 ) and the nearby residential monitoring location (33 ug/m 3 ); however these were not long enough in duration to impact most one hour or any 24 hour averages. At the residential location, high short term levels were clearly associated with beach fire activity at Goose Spit Regional Park, but the highest short term levels occurred regularly up until July 22 nd between 7am and 8am. The source of the morning peaks at the residential location cannot be confirmed, but may be due to a local diesel vehicle near the monitoring site, or with traffic associated with the HMCS Quadra. Recommendations Long term monitoring at a fixed site in the CVRD would provide useful data on trends in PM 2.5 levels (and other pollutants) seasonally and annually. Some thought should be given to whether such an air quality monitoring station should be located in an area known to be impacted by local sources, or in an area that represents more regional background conditions. 2

6 The CVRD should continue restricting open recreational burning at Goose Spit Regional Park and consider banning this activity. The CVRD should continue to review and develop burning related bylaws that help to reduce preventable air pollution in the region. While there are no existing air quality guidelines for PM 2.5 averaged over less than 24 hours, this may reflect a lack of health studies investigating very short term but high exposures, such as may be experienced when in proximity to smoke plumes from residential chimneys, beach fires and land clearing or forestry related burns. 3

7 Introduction Air quality in the Comox Valley Regional District (CVRD) is of interest to regulators and residents alike. While there are no significant industrial sources of pollution in the region, there are numerous sources of fine particulates (PM 2.5 ). Most types of combustion emit fine particulates, although very high temperature burning emits less PM 2.5 than low temperature or incomplete combustion. Sources include traffic exhaust, wood burning for residential heating and cooking, beach fires, burning of debris from land clearing and construction, prescribed agricultural burning, forestry related burns and wildfires. Residents in the vicinity of Goose Spit Regional Park have complained about the smoke reaching their residences, and are concerned regarding impacts of the beach fires on local air quality. Goose Spit Regional Park is a waterfront recreational site located along Hawkins Rd in Comox. Visitors to the park are permitted to burn small beach fires in 10 designated fire pits throughout the Park between May and September, unless subject to fire bans in the region. Depending on meteorological conditions, wood smoke from beach fires can drift toward nearby residential areas. No existing air quality monitoring stations exist in the CVRD. The objective of this study was to conduct preliminary monitoring of fine particulate levels (PM 2.5 ). In particular, this study aimed to answer the following questions: What are typical levels of PM 2.5 in the CVRD? How do PM 2.5 levels measured in the CVRD compare to levels measured at other sites in the region i.e., Campbell River and Nanaimo? What PM 2.5 levels are people exposed to immediately at Goose Spit Regional Park due to beach fires? What PM 2.5 levels are experienced by residents near to Goose Spit Regional Park? 4

8 Methods Data Collection Schedule Mobile Monitoring: A mobile monitoring unit was used to collect data for several consecutive hours on eleven days (six early mornings and five evenings) between December 2008 and March This monitoring was done by VIHA staff when work schedules allowed, rather than on a regular schedule. Given the preliminary nature of the monitoring, and the intention to capture a range of weather conditions, this approach was considered adequate to establish typical short term levels of PM 2.5 useful for identifying hot spots. This type of monitoring has been used effectively in other areas for monitoring smoke from residential wood burning. Stationary Monitoring: Continuous data were collected between June 15 and September 2, 2009 at two locations in the CVRD. The first location, chosen to represent a control site away from the influence of Goose Spit Regional Park beach fires, was at the Vancouver Island Health Authority office (labeled Control in Figure 1), located at th Street in Courtenay. The second site, representing a residential location in proximity of Goose Spit Regional Park, was located across the bay to the northeast of the spit (labeled Residence in Figure 1). Over the same period, for several consecutive hours on 45 evenings, PM 2.5 levels were monitored directly at Goose Spit Regional Park, with a monitor in the Park Steward s truck (labeled as Source in Figure 1). 5

9 Figure 1. Monitoring locations in the Courtenay/Comox region (Supplementary meteorological data obtained from the Comox Airport) Equipment: Radiance Research M903 nephelometers (Figure 2) were used to measure light scatter from particles in the air, which was then converted to PM 2.5. The light scattering coefficient recorded by the nephelometers was converted to PM 2.5 (µg/m 3 ) using the equation developed by Allen et al. (2003) 1 : PM 2.5 (µg/m 3 ): ((100,000 x light scatter value) 0.01) / Allen, R., Larson, T., Sheppard, L., Wallace, L. and Liu, S. (2003). Use of real time light scattering data to estimate the contribution of infiltrated and indoor generated particles to indoor air. Environmental Science and Technology, 37(16),
 using the equation developed by Allen et al. (2003) 1 : PM 2.5 (µg/m 3 ): ((100,000 x light scatter value) 0.01) / 0.28 1 Allen, R., Larson, T., Sheppard, L., Wallace, L.")
10 This equation was developed using data from operating a nephelometer side by side with TEOM equipment. The equation is based on measurements in one season only, and so may not be the optimal conversion factor; however, converted PM 2.5 levels obtained with this formula have agreed well with PM 2.5 levels measured with TEOM equipment (R 2 =.8 or 80% agreement). The level of agreement will vary based on time, geographical location and PM 2.5 source type. Therefore, when considering PM 2.5 levels provided in this report, it should be noted they may be up to ± 20% different than that which would have been obtained by TEOM equipment. The nephelometers were calibrated according to the manufacturer s instructions prior Radiance Research M903 Nephelometer to use in the field. Typical Stationary Outdoor Set Up Inside Shelter Box Typical Automobile Set Up with Tubing Extending Out Window Figure 2. Radiance Research nephelometer and typical set up scenarios For mobile monitoring, the nephelometer and a global positioning system (GPS) unit were carried in a passenger car, with a funnel and copper/flexible tubing serving as the intake for the nephelometer. Both the nephelometer and the GPS were set to log data every 15 seconds. At the Control and Residence locations, monitors were set to continuously measure and log 5 minute average concentration levels over the entire study period. The Goose Spit Regional Park Source location measured 1 minute average levels, over evening periods on select days when the park steward was present at the spit to provide firewood and perform other routine job activities. Data from Goose Spit Regional Park were converted to 5 minute averages prior to comparison with data from the other two sites. 7

11 Due to equipment logistics, sampling is not complete for every day of the stationary monitoring period between June and September. Figure 3 shows days with data capture at each location. June Residence Control (VIHA) Source (Goose Spit) July S M T W T F S S M T W T F S August S M T W T F S 1 September S M T W T F S Figure 3. Stationary monitoring data collection days 8

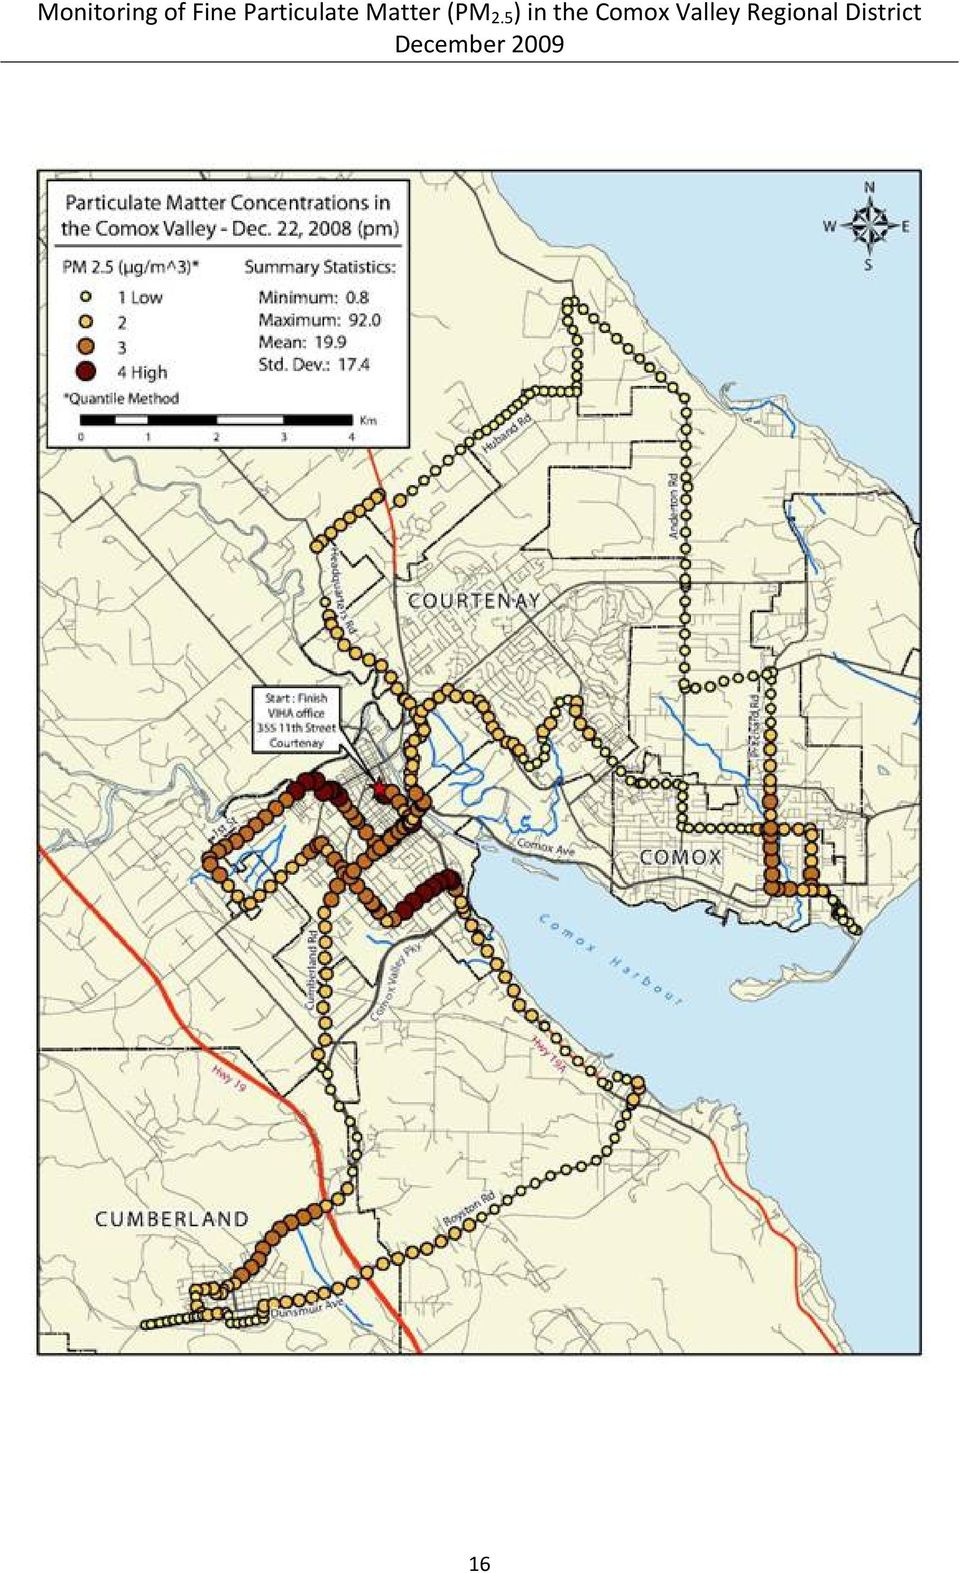
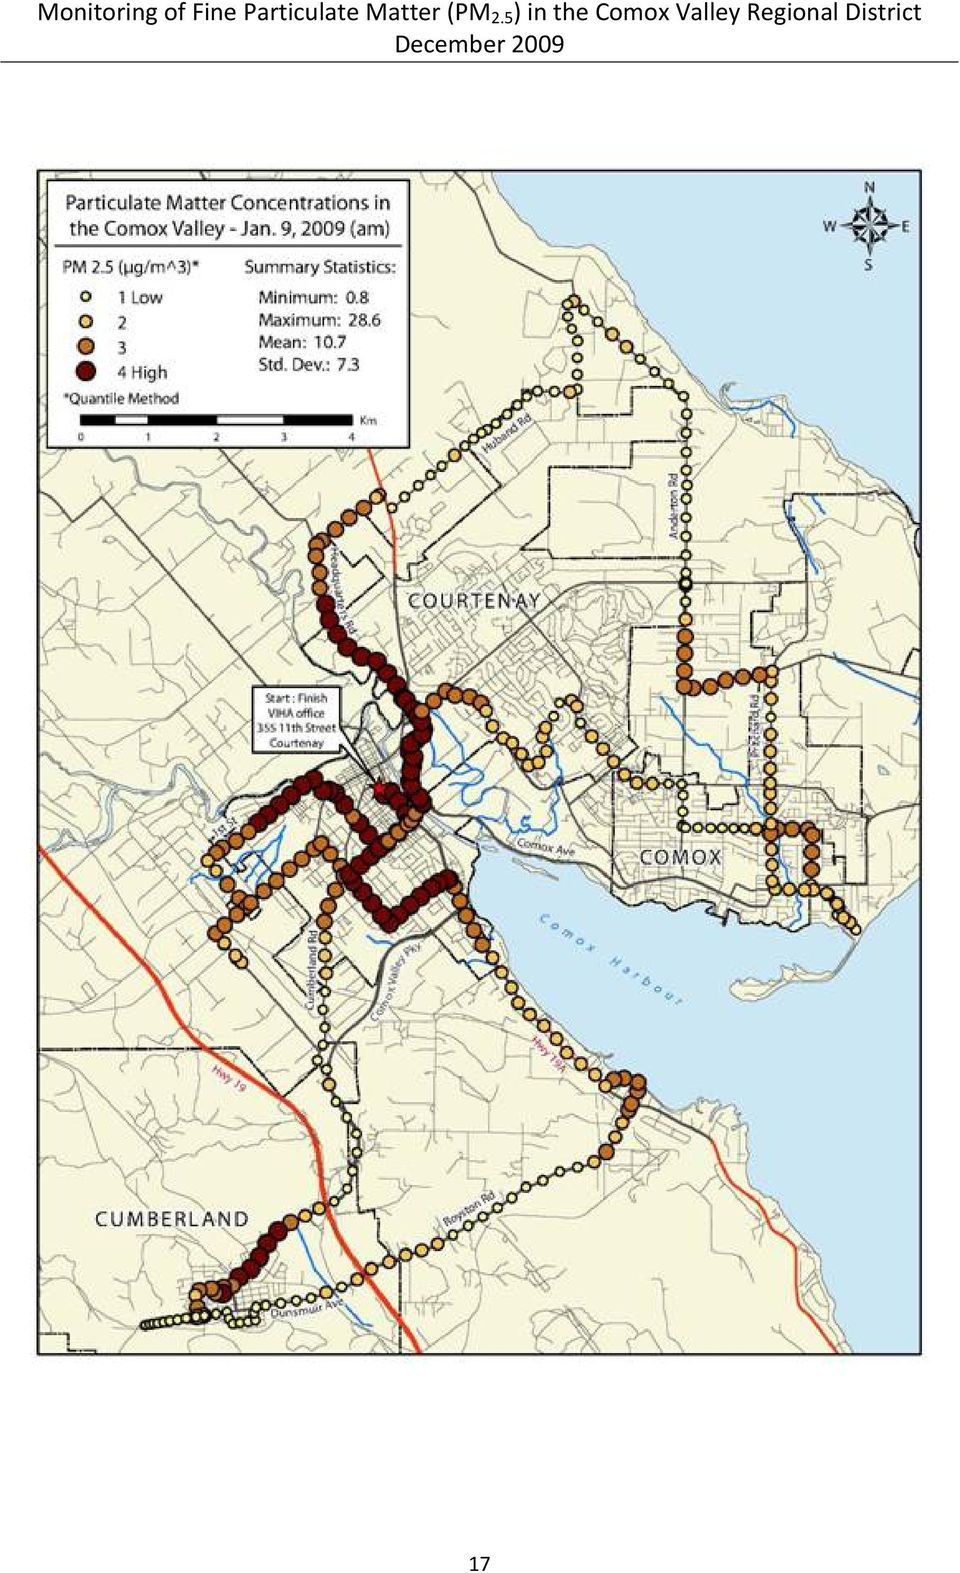
12 Results Mobile Monitoring Mobile monitoring provides measured levels that represent a single location at a specific moment, so do not give an indication of how long the measure level persists at any particular location. The data are not suitable for summarizing to hourly averages for this reason, but do allow for comparisons among different locations during same sampling run. Data for each mobile run are summarized in Table 1. Maps of measured concentrations for all sampling runs are provided in Appendix I; a typical map is shown in Figure 4 below. There were no significant associations between the mean PM 2.5 levels and time of day, wind direction, temperature or general clear sky/cloudy sky conditions. However, the lowest mean levels were recorded on days with foggy conditions, and the highest mean was recorded on the coldest day with clear conditions. Areas with consistently higher PM 2.5 concentrations were western portions of Comox, in and around the denser commercial/residential area of Courtenay, and the denser residential areas of Cumberland. On review of these data, CVRD staff suggested that areas with higher short term levels also have higher densities of older homes, which are more likely to have wood burning fireplaces. The data may also reflect PM 2.5 from traffic exhaust. Table 1. Summary of mobile monitoring data Date Wind Direction Conditions ( o C) Rh Mean (µg/m 3 ) Jan 15 PM from W Fog Jan 22 AM from W Freezing Fog Dec 8 PM from S Cloudy Feb 3 PM from E Mostly Cloudy Mar 6 AM from W Mainly Clear Jan 9 AM from S Cloudy Feb 19 AM from N Mainly Clear Jan 29 AM from S Cloudy Mar 25 PM from NW Mainly Clear Dec 16 AM from W Mostly Cloudy Dec 22 PM from W Mainly Clear Maximum (µg/m 3 ) 9

13 Figure 4. Mobile collection route and typical concentration levels 10

14 Stationary Monitoring Data were obtained on a total of 75 days between June 15 th September 1 st, 2009, 39 of which have simultaneous data capture at all three locations. Daily graphs of the data are included in Appendix II, along with information on weather and wind conditions. During the monitoring period, burning for land clearing and forestry was banned due to dry weather conditions. Beach fires were allowed at Goose Spit Regional Park until July 31 st, after which they were banned. Table 2 summarizes the maximum 5 minute, onehour and 24 hour concentration levels based on all available data. Table 2. Maximum measured PM 2.5 concentrations (ug/m 3 ) 5 Min Max 1 Hour Max 24 Hour Max Residence Control Source na Highest peak 5 minute concentrations occurred at the Source location, and represent levels experienced intermittently by Park visitors when in close proximity to beach fires. The Control site, located at greater distance than the residence location from the beach fires, had higher 5 minute and 1 hour maximum concentration levels than at the Residence location. This indicates that sources other than beach fires also impact measured levels in the region. In fact, peak 5 minute maximum concentration levels measured at the Residence were not from beach fire sources, but from an unidentified source commonly present between 7:00am 7:30 am (see Appendix II). Table 3 summarizes the total number of hours of data collected at each sample site, and provides an indication of the frequency of concentration levels occurring at each site. For instance, to interpret the values in the table below, the 99 th percentile of hourly data measured at the Residence location (24 µg/m 3 ) indicates that at least 1 percent of the total 1,643 hourly observations are above this level. Ninety five percent of the 1,643 hourly observations at this site are below the value of 15 µg/m 3, etc. 11

15 Table 3. Frequency distributions of average hourly concentration levels (ug/m 3 ) # Hours Data 99 th Percentile 98 th Percentile 95 th Percentile Residence Control Source There are no air quality guidelines for PM 2.5 for one hour or shorter averages. The Canadian Health Reference Level 2 for 24 hour average PM 2.5 is 15 µg/m 3, while the World Health Organization guideline is 25 µg/m 3. Figure 5 shows the 24 hour average levels measured at the Residence location and the Control location. Clearly, 24 hour average levels are very similar over time at both sites, and are generally below the Canadian Health Reference Level. Exceedences of the Health Reference Level were associated with wildfires occurring outside the CVRD, particularly between July 28 th and August 9 th. Although daily levels did not exceed 15 µg/m 3 on average, wildfires outside of the CVRD also occurred on July 11 th / 12 th, and August 28 th / August 29 th (see smoke analysis from satellite data in Appendix III). 2 The Health Reference Level is defined as the level above which effects on human health and the environment can be demonstrated For particulate matter and human health effects, the Reference Level is derived statistically from several studies and should be interpreted as a level above which there is confidence (statistical significance) in the dose response relationship and the ability to provide some quantification of adverse endpoints. The Reference Level in this case should not therefore be interpreted as a threshold of effects. On the contrary, there is no clear evidence of a threshold level for the positive associations between particulate matter and both daily mortality and hospitalization rates. ( sc.gc.ca/ewh semt/pubs/air/naaqoonqaa/particulate_matter_matieres_particulaires/summary sommaire/reference_levels_niveaux eng.php) 12

16 24 HOUR AVERAGE PM2.5 (ug/cubic metre) Residence Control 24 houraverage Health Reference Level June 16 June 19 June 22 June 25 June 28 July 1 July 4 July 7 July 10 July 13 July 16 July 19 July 22 July 25 July 28 July 31 August 3 August 6 August 9 August 12 August 15 August 18 August 21 August 24 August 27 August 30 Figure hour average levels at the residences and control locations The remainder of this report provides information on measured levels at each site for each day during the monitoring period where data was captured at 1 more sites. Two types of time series graphs are provided for each day in the monitoring period. The first compares 5 minute average PM 2.5 levels (µg/m 3 ) measured at the three monitoring locations. The second compares hourly averages from each sample site to hourly measurements made at the Ministry of Environment s air quality stations in Campbell River and Nanaimo. Each time series graph represents a 24 hour period, starting and ending at 12:00 am. 13

17 Appendix I Mobile Monitoring Maps 14

18 15

19 16
20 17
21 18
22 19
23 20
24 21
25 22
26 23
27 24
28 Appendix II Daily Data Graphs and Supporting Information This Appendix contains graphs and summary information for all data from the stationary sites and the Goose Spit Regional Park site. In addition to the monitor data, also included are: Information from several local residents kept notes recording when smoke was smelled, and activities at Goose Spit Regional Park. These are summarized on the 5 minute data pages following under the heading NOTES. Detailed notes on activities occurring at Goose Spit Regional Park by the Park Steward while on duty. These are included in Appendix IV, and noted briefly on the 5 minute data pages under the heading GOOSE SPIT FIRES. For June 15 th to July 20 th, hourly average data from fixed site monitors operated by the Ministry of Environment in Campbell River and Nanaimo are provided to facilitate comparisons between the monitoring completed for this study, and to help identify regional events affecting PM 2.5 levels. Supplementary meteorological data (wind speed, wind direction, temperature and precipitation) from the Comox Airport were obtained from Environment Canada s National Climate Data and Information Archive 3. These data are hourly for wind speed, wind direction and temperature, and daily for precipitation. Data are presented in the form of a table, and also a wind rose diagram, and can be used to assist in interpreting PM 2.5 levels and possible attributable sources
29 The following diagram (Figure A1) depicts a compass rose displaying degrees for typical cardinal directions (N, S, E W) and sub directions (NE, NW, SE, SW). Wind direction provided in the tables are in the form of degrees, and this diagram can be referred to for assisting in visualizing the direction winds are coming from. Wind direction, given either by a degree value or through the use of a wind rose, always refers to the direction wind is coming from i.e., a 225 wind is from the southwest blowing towards the northeast. Figure A1. Compass rose displaying 0 to 360 degrees of direction 26
30 Monday June 15, 2009: 5 Minute Averages Monitoring of Fine Particulate Matter (PM 2.5 ) in the Comox Valley Regional District Summary Statistics (5 Min) PM 2.5 (µg/m 3 ) Residence Control Source Min 7 Max 10 Average 8 Median 8 Stdev 0 99 th th 9 Comox Airport Meteorological Data (Hourly) Total Precipitation = 0 mm Mean = 17.9 C GOOSE SPIT FIRES: 3 before 19:30; 4 after. 27
31 Monday June 15, 2009: Hourly Regional Comparison Note: Data from regional sites may be uncorrected and should be used with caution 28
32 Tuesday June 16, 2009: 5 Minute Averages Monitoring of Fine Particulate Matter (PM 2.5 ) in the Comox Valley Regional District Summary Statistics (5 Min) PM 2.5 (µg/m 3 ) Residence Control Source Min 2 2 Max 14 7 Average 4 4 Median 4 4 Stdev th th 8 4 Comox Airport Meteorological Data (Hourly) Total Precipitation = 2.6 mm Mean = 15.7 C GOOSE SPIT FIRES: No fires. 29
33 Tuesday June 16, 2009: Hourly Regional Comparison Note: Data from regional sites may be uncorrected and should be used with caution 30
34 Wednesday June 17, 2009: 5 Minute Averages Monitoring of Fine Particulate Matter (PM 2.5 ) in the Comox Valley Regional District Summary Statistics (5 Min) PM 2.5 (µg/m 3 ) Residence Control Source Min Max Average Median Stdev th th Comox Airport Meteorological Data (Hourly) Total Precipitation = trace Mean = 18.3 C NOTE: Lawn mowing at Residence location 6:00 6:30pm. GOOSE SPIT FIRES: 2 before 19:30; 5 after. 31
35 Wednesday June 17, 2009: Hourly Regional Comparison Note: Data from regional sites may be uncorrected and should be used with caution 32
36 Thursday June 18, 2009: 5 Minute Averages Monitoring of Fine Particulate Matter (PM 2.5 ) in the Comox Valley Regional District Summary Statistics (5 Min) PM 2.5 (µg/m 3 ) Residence Control Source Min Max Average Median Stdev th th Comox Airport Meteorological Data (Hourly) Total Precipitation = 0 mm Mean = 18.9 C GOOSE SPIT FIRES: 1 before 19:30; 0 after. 33
37 Thursday June 18, 2009: Hourly Regional Comparison Note: Data from regional sites may be uncorrected and should be used with caution 34
38 Friday June 19, 2009: 5 Minute Averages Monitoring of Fine Particulate Matter (PM 2.5 ) in the Comox Valley Regional District Summary Statistics (5 Min) PM 2.5 (µg/m 3 ) Residence Control Source Min Max Average Median Stdev th th Comox Airport Meteorological Data (Hourly) Total Precipitation = 3.2 mm Mean = 15.7 C GOOSE SPIT FIRES: 3 before 19:30; 3 after. 35
39 Friday June 19, 2009: Hourly Regional Comparison Note: Data from regional sites may be uncorrected and should be used with caution 36
40 Saturday June 20, 2009: 5 Minute Averages Monitoring of Fine Particulate Matter (PM 2.5 ) in the Comox Valley Regional District Summary Statistics (5 Min) PM 2.5 (µg/m 3 ) Residence Control Source Min Max Average Median Stdev th th Comox Airport Meteorological Data (Hourly) Total Precipitation = 0 mm Mean = 14.7 C NOTE: Residents near Goose Spit Regional Park reported smoky smell in evening. GOOSE SPIT FIRES: 7 before 19:30; 10 after. 37
41 Saturday June 20, 2009: Hourly Regional Comparison Note: Data from regional sites may be uncorrected and should be used with caution 38
42 Sunday June 21, 2009: 5 Minute Averages Monitoring of Fine Particulate Matter (PM 2.5 ) in the Comox Valley Regional District Summary Statistics (5 Min) PM 2.5 (µg/m 3 ) Residence Control Source Min Max Average Median Stdev th th Comox Airport Meteorological Data (Hourly) Total Precipitation = 0 mm Mean = 15.6 C GOOSE SPIT FIRES: 7 before 19:30; 9 after. 39
43 Sunday June 21, 2009: Hourly Regional Comparison Note: Data from regional sites may be uncorrected and should be used with caution 40
44 Monday June 22, 2009: 5 Minute Averages Monitoring of Fine Particulate Matter (PM 2.5 ) in the Comox Valley Regional District Summary Statistics (5 Min) PM 2.5 (µg/m 3 ) Residence Control Source Min Max Average Median Stdev th th Comox Airport Meteorological Data (Hourly) Total Precipitation = 0 mm Mean = 15.2 C GOOSE SPIT FIRES: 1 before 19:30; 5 after. 41
45 Monday June 22, 2009: Hourly Regional Comparison Note: Data from regional sites may be uncorrected and should be used with caution 42
46 Tuesday June 23, 2009: 5 Minute Averages Monitoring of Fine Particulate Matter (PM 2.5 ) in the Comox Valley Regional District Summary Statistics (5 Min) PM 2.5 (µg/m 3 ) Residence Control Source Min 2 2 Max 18 6 Average 3 2 Median 3 3 Stdev th th 4 3 Comox Airport Meteorological Data (Hourly) Total Precipitation = trace Mean = 15.8 C GOOSE SPIT FIRES: 1 before 19:30; 4 after. 43
47 Tuesday June 23, 2009: Hourly Regional Comparison Note: Data from regional sites may be uncorrected and should be used with caution 44
48 Thursday June 25, 2009: 5 Minute Averages Monitoring of Fine Particulate Matter (PM 2.5 ) in the Comox Valley Regional District Summary Statistics (5 Min) PM 2.5 (µg/m 3 ) Residence Control Source Min 5 Max 10 Average 6 Median 6 Stdev 2 99 th th 9 Comox Airport Meteorological Data (Hourly) Total Precipitation = 6.0 mm Mean = 15.7 C GOOSE SPIT FIRES: 0 before 19:30; 1 after. 45
49 Friday June 26, 2009: 5 Minute Averages Monitoring of Fine Particulate Matter (PM 2.5 ) in the Comox Valley Regional District Summary Statistics (5 Min) PM 2.5 (µg/m 3 ) Residence Control Source Min 4 Max 126 Average 6 Median 17 Stdev th th 89 Comox Airport Meteorological Data (Hourly) Total Precipitation = 0 mm Mean = 14.3 C GOOSE SPIT FIRES: 7 before 19:30; 6 after. 46
50 Friday June 26, 2009: Hourly Regional Comparison Note: Data from regional sites may be uncorrected and should be used with caution 47
51 Saturday June 27, 2009: 5 Minute Averages Monitoring of Fine Particulate Matter (PM 2.5 ) in the Comox Valley Regional District Summary Statistics (5 Min) PM 2.5 (µg/m 3 ) Residence Control Source Min 3 Max 17 Average 4 Median 5 Stdev 3 99 th th 9 Comox Airport Meteorological Data (Hourly) Total Precipitation = 4.6 mm Mean = 13.5 C GOOSE SPIT FIRES: 0 before 19:30; 0 after. 48
52 Saturday June 27, 2009: Hourly Regional Comparison Note: Data from regional sites may be uncorrected and should be used with caution 49
53 Sunday June 28, 2009: 5 Minute Averages Monitoring of Fine Particulate Matter (PM 2.5 ) in the Comox Valley Regional District Summary Statistics (5 Min) PM 2.5 (µg/m 3 ) Residence Control Source Min Max Average Median Stdev th th Comox Airport Meteorological Data (Hourly) Total Precipitation = 0 mm Mean = 14.5 C GOOSE SPIT FIRES: 9 before 19:30; 8 after. 50
54 Sunday June 28, 2009: Hourly Regional Comparison Note: Data from regional sites may be uncorrected and should be used with caution 51
55 Monday June 29, 2009: 5 Minute Averages Monitoring of Fine Particulate Matter (PM 2.5 ) in the Comox Valley Regional District Summary Statistics (5 Min) PM 2.5 (µg/m 3 ) Residence Control Source Min Max Average Median Stdev th th Comox Airport Meteorological Data (Hourly) Total Precipitation = 0 mm Mean = 15.8 C NOTE: Residents near Goose Spit Regional Park reported smelling smoke at 8:30pm. GOOSE SPIT FIRES: 5 before 19:30; 10 after. 52
56 Monday June 29, 2009: Hourly Regional Comparison Note: Data from regional sites may be uncorrected and should be used with caution 53
57 Tuesday June 30, 2009: 5 Minute Averages Monitoring of Fine Particulate Matter (PM 2.5 ) in the Comox Valley Regional District Summary Statistics (5 Min) PM 2.5 (µg/m 3 ) Residence Control Source Min Max Average Median Stdev th th Comox Airport Meteorological Data (Hourly) Total Precipitation = 0 mm Mean = 16.3 C GOOSE SPIT FIRES: 10 before 19:30; 10 after. 54
58 Tuesday June 30, 2009: Hourly Regional Comparison Note: Data from regional sites may be uncorrected and should be used with caution 55
59 Wednesday July 1, 2009: 5 Minute Averages Monitoring of Fine Particulate Matter (PM 2.5 ) in the Comox Valley Regional District Summary Statistics (5 Min) PM 2.5 (µg/m 3 ) Residence Control Source Min Max Average Median Stdev th th Comox Airport Meteorological Data (Hourly) Total Precipitation = 0 mm Mean = 16.9 C GOOSE SPIT FIRES: 8 before 19:30; 9 after. 56
60 Wednesday July 1, 2009: Hourly Regional Comparison Note: Data from regional sites may be uncorrected and should be used with caution 57
61 Thursday July 2, 2009: 5 Minute Averages Monitoring of Fine Particulate Matter (PM 2.5 ) in the Comox Valley Regional District Summary Statistics PM 2.5 (µg/m 3 ) Residence Control Source Min 4 3 Max 14 7 Average 5 5 Median 5 5 Stdev th th 6 6 Comox Airport Meteorological Data (Hourly) Total Precipitation = 0 mm Mean = 18.7 C NOTE: Residents near Goose Spit Regional Park reported smelling smoke at 2:00 pm and 10:45 pm. GOOSE SPIT FIRES: 8 before 19:30; 8 after. 58
62 Thursday July 2, 2009: Hourly Regional Comparison Note: Data from regional sites may be uncorrected and should be used with caution 59
63 Friday July 3, 2009: 5 Minute Averages Monitoring of Fine Particulate Matter (PM 2.5 ) in the Comox Valley Regional District Summary Statistics (5 Min) PM 2.5 (µg/m 3 ) Residence Control Source Min 5 4 Max 24 8 Average 6 5 Median 6 5 Stdev th th 7 7 Comox Airport Meteorological Data (Hourly) Total Precipitation = 0 mm Mean = 20.0 C GOOSE SPIT FIRES: 7 before 19:30; 10 after. 60
64 Friday July 3, 2009: Hourly Regional Comparison Monitoring of Fine Particulate Matter (PM 2.5 ) in the Comox Valley Regional District Note: Data from regional sites may be uncorrected and should be used with caution 61
65 Saturday July 4, 2009: 5 Minute Averages Monitoring of Fine Particulate Matter (PM 2.5 ) in the Comox Valley Regional District Summary Statistics (5 Min) PM 2.5 (µg/m 3 ) Residence Control Source Min 4 3 Max 24 8 Average 5 5 Median 5 5 Stdev th th 6 7 Comox Airport Meteorological Data (Hourly) Total Precipitation = 0 mm Mean = 20.1 C GOOSE SPIT FIRES: 10 before 19:30; 8 after. 62
66 Saturday July 4, 2009: Hourly Regional Comparison Note: Data from regional sites may be uncorrected and should be used with caution 63
67 Sunday July 5, 2009: 5 Minute Averages Monitoring of Fine Particulate Matter (PM 2.5 ) in the Comox Valley Regional District Summary Statistics (5 Min) PM 2.5 (µg/m 3 ) Residence Control Source Min 4 3 Max 16 8 Average 5 5 Median 5 5 Stdev th th 8 7 Comox Airport Meteorological Data (Hourly) Total Precipitation = 0 mm Mean = 17.5 C GOOSE SPIT FIRES: 8 before 19:30; 6 after. 64
68 Sunday July 5, 2009: Hourly Regional Comparison Note: Data from regional sites may be uncorrected and should be used with caution 65
69 Monday July 6, 2009: 5 Minute Averages Monitoring of Fine Particulate Matter (PM 2.5 ) in the Comox Valley Regional District Summary Statistics (5 Min) PM 2.5 (µg/m 3 ) Residence Control Source Min 1 0 Max 11 7 Average 3 3 Median 4 3 Stdev th th 8 6 Comox Airport Meteorological Data (Hourly) Total Precipitation = 41.2 mm Mean = 16.1 C NOTE: Residents reported a lot of activity July 6 th 13 th, with fires burning after 11pm. GOOSE SPIT FIRES: 0 before 19:30; 1 after. 66
70 Monday July 6, 2009: Hourly Regional Comparison Note: Data from regional sites may be uncorrected and should be used with caution 67
71 Tuesday July 7, 2009: 5 Minute Averages Monitoring of Fine Particulate Matter (PM 2.5 ) in the Comox Valley Regional District Summary Statistics (5 Min) PM 2.5 (µg/m 3 ) Residence Control Source Min Max Average Median Stdev th th Comox Airport Meteorological Data (Hourly) Total Precipitation = 8.8 mm Mean = 12.4 C NOTE: Residents reported a lot of activity July 6 th 13 th, with fires burning after 11pm. GOOSE SPIT FIRES: 0 before 19:30; 0 after. 68
72 Tuesday July 7, 2009: Hourly Regional Comparison Note: Data from regional sites may be uncorrected and should be used with caution 69
73 Wednesday July 8, 2009: 5 Minute Averages Monitoring of Fine Particulate Matter (PM 2.5 ) in the Comox Valley Regional District Summary Statistics (5 Min) PM 2.5 (µg/m 3 ) Residence Control Source Min Max Average Median Stdev th th Comox Airport Meteorological Data (Hourly) Total Precipitation = 1.2 mm Mean = 14.7 C NOTE: Residents reported a lot of activity July 6 th 13 th, with fires burning after 11pm. GOOSE SPIT FIRES: 0 before 19:30; 4 after. 70
74 Wednesday July 8, 2009: Hourly Regional Comparison Note: Data from regional sites may be uncorrected and should be used with caution 71
75 Thursday July 9, 2009: 5 Minute Averages Monitoring of Fine Particulate Matter (PM 2.5 ) in the Comox Valley Regional District Summary Statistics (5 Min) PM 2.5 (µg/m 3 ) Residence Control Source Min Max Average Median Stdev th th Comox Airport Meteorological Data (Hourly) Total Precipitation = 0 mm Mean = 16.9 C NOTE: Residents reported a lot of activity July 6 th 13 th, with fires burning after 11pm. GOOSE SPIT FIRES: 7 before 19:30; 10 after. 72
76 Thursday July 9, 2009: Hourly Regional Comparison Note: Data from regional sites may be uncorrected and should be used with caution 73
77 Friday July 10, 2009: 5 Minute Averages Monitoring of Fine Particulate Matter (PM 2.5 ) in the Comox Valley Regional District Summary Statistics (5 Min) PM 2.5 (µg/m 3 ) Residence Control Source Min Max Average Median Stdev th th Comox Airport Meteorological Data (Hourly) Total Precipitation = 0 mm Mean = 18.2 C NOTE: Residents reported a lot of activity July 6 th 13 th, with fires burning after 11pm. GOOSE SPIT FIRES: 7 before 19:30; 8 after. 74
78 Friday July 10, 2009: Hourly Regional Comparison Note: Data from regional sites may be uncorrected and should be used with caution 75
79 Saturday July 11, 2009: 5 Minute Averages Monitoring of Fine Particulate Matter (PM 2.5 ) in the Comox Valley Regional District Summary Statistics (5 Min) PM 2.5 (µg/m 3 ) Residence Control Source Min Max Average Median Stdev th th Comox Airport Meteorological Data (Hourly) Total Precipitation = 0 mm Mean = 20.5 C NOTE: Residents near Goose Spit Regional Park reported smelling smoke at 8:00 pm and 11:00 pm. GOOSE SPIT FIRES: 8 before 19:30; 9 after. 76
80 Saturday July 11, 2009: Hourly Regional Comparison Note: Data from regional sites may be uncorrected and should be used with caution 77
81 Sunday July 12, 2009: 5 Minute Averages Monitoring of Fine Particulate Matter (PM 2.5 ) in the Comox Valley Regional District Summary Statistics (5 Min) PM 2.5 Residence Control Source (µg/m 3 ) Min Max Average Median Stdev th th Comox Airport Meteorological Data (Hourly) Total Precipitation = 0 mm Mean = 19.1 C NOTE: Residents reported a lot of activity July 6 th 13 th, with fires burning after 11pm. GOOSE SPIT FIRES: 4 before 19:30; 5 after. 78
82 Sunday July 12, 2009: Hourly Regional Comparison Note: Data from regional sites may be uncorrected and should be used with caution 79
83 Monday July 13, 2009: 5 Minute Averages Monitoring of Fine Particulate Matter (PM 2.5 ) in the Comox Valley Regional District Summary Statistics (5 Min) PM 2.5 (µg/m 3 ) Residence Control Source Min 2 2 Max 15 8 Average 5 6 Median 5 5 Stdev th th 7 7 Comox Airport Meteorological Data (Hourly) Total Precipitation = 0 mm Mean = 16.2 C NOTE: Residents reported a lot of activity July 6 th 13 th, with fires burning after 11pm. GOOSE SPIT FIRES: 6 before 19:30; 5 after. 80
84 Monday July 13, 2009: Hourly Regional Comparison Note: Data from regional sites may be uncorrected and should be used with caution 81
85 Tuesday July 14, 2009: 5 Minute Averages Monitoring of Fine Particulate Matter (PM 2.5 ) in the Comox Valley Regional District Summary Statistics (5 Min) PM 2.5 (µg/m 3 ) Residence Control Source Min 2 2 Max Average 8 8 Median 7 7 Stdev th th Comox Airport Meteorological Data (Hourly) Total Precipitation = 0 mm Mean = 17.6 C GOOSE SPIT FIRES: 8 before 19:30; 7 after. 82
86 Tuesday July 14, 2009: Hourly Regional Comparison Note: Data from regional sites may be uncorrected and should be used with caution 83
87 Wednesday July 15, 2009: 5 Minute Averages Monitoring of Fine Particulate Matter (PM 2.5 ) in the Comox Valley Regional District Summary Statistics (5 Min) PM 2.5 (µg/m 3 ) Residence Control Source Min 6 6 Max Average 9 8 Median 10 9 Stdev th th Comox Airport Meteorological Data (Hourly) Total Precipitation = 0 mm Mean = 17.9 C NOTE: Lawn mowing at Residential location between 7:00 and 7:30pm. GOOSE SPIT FIRES: 10 before 19:30; 10 after. 84
MOBILE AIR QUALITY MONITORING: TARGETING LOCAL ISSUES
 MOBILE AIR QUALITY MONITORING: TARGETING LOCAL ISSUES Eleanor Setton, PhD elsetton@uvic.ca eleanor@carexcanada.ca Adjunct Assistant Professor University of Victoria Geography Lead Environmental Scientist
Technical Support Document For The May 2, 2008 Exceptional Event
 Technical Support Document For The May 2, 2008 Exceptional Event Prepared by the Technical Services Program Air Pollution Control Division June 9, 2009 2 Table of Contents: 1.0 Introduction... 4 2.0 Ambient
Deliverable D_O-INT_3.8 Protocol for personal and microenvironment monitoring surveys
 MACC Monitoring Atmospheric Composition and Climate Deliverable D_O-INT_3.8 Protocol for personal and microenvironment monitoring surveys Lead Beneficiary Imperial College London Introduction Monitoring
Clear the Air. What s in the air? Mix & match. Make a pie chart. The shape of the land. Exploring our winter weather. How PM 10.
 Waikato Clear the Air This is your workbook on air pollution. As you work through it, tick off the activities you have completed on the list below. Have fun! Activity 1 Activity 2 Activity 3 Activity 4
Measurement of particle concentrations in Piacenza urban area: Ambient air levels and personal exposure concentrations
 Measurement of particle concentrations in Piacenza urban area: Ambient air levels and personal exposure concentrations Giovanna RIPAMONTI- PhD student Environmental and infrastructural Eng.- -Politecnico
Smoke Management Plan
 Smoke Management Plan December 2007 TABLE OF CONTENTS 1.0 Introduction 3 2.0 Background 6 3.0 Smoke Management Plan 7 3.1 Authorization to Burn 10 3.2 Minimizing Air Pollutant Emissions 11 3.3 Smoke Management
Energy from Waste Combined Heat and Power Facility, North Yard, Devonport. Community Ambient Air Quality Monitoring Programme Report Quarter 4, 2015
 Energy from Waste Combined Heat and Power Facility, North Yard, Devonport Community Ambient Air Quality Monitoring Programme Report Quarter 4, 2015 Overview of Monitoring Programme MVV started ambient
The Public Health Management of Chemical Incidents Case Study
 The Public Health Management of Chemical Incidents Case Study Professor David Russell, The WHO Collaborating Centre for Chemical Incidents, Cardiff, Wales, UK Location http://www.wales-calling.com/wales-buttons-maps/wales-town-map.gif
Air Pollution in Ulaanbaatar: Public Health Impacts and Research Opportunities
 Air Pollution in Ulaanbaatar: Public Health Impacts and Research Opportunities Ryan W. Allen, PhD Associate Professor Faculty of Health Sciences Simon Fraser University Burnaby, BC, Canada allenr@sfu.ca
Caution: Children Breathing An overview of air pollution and idling vehicles at Colorado schools
 Caution: Children Breathing An overview of air pollution and idling vehicles at Colorado schools Mothers for Clean Air - Colorado Clean Air at Schools: Engines Off (CASEO) is a partnership between federal
WHITE PAPER CONTINUOUS AIR MONITORING USING GRIFFIN 460 MOBILE GC/MS. HEADINGS: ALL CAPS, 12 PT TREBUCHET FONT, ICx BLUE
 WHITE PAPER CONTINUOUS AIR MONITORING USING GRIFFIN 460 MOBILE GC/MS HEADINGS: ALL CAPS, 12 PT TREBUCHET FONT, ICx BLUE Body text is 11 pt Cynthia Georgia Liu, with 1.5 Ph.D., line spacing. Paul Dreier
Iowa Fine Particulate Monitoring Network Design Values 2011-2013. Iowa DNR Ambient Air Monitoring Group
 Iowa Fine Particulate Monitoring Network Design Values 2011-2013 Iowa DNR Ambient Air Monitoring Group What is Fine Particulate Matter (PM 2.5 )? The term particulate matter (PM) includes both solid particles
AP ENVIRONMENTAL SCIENCE 2007 SCORING GUIDELINES
 AP ENVIRONMENTAL SCIENCE 2007 SCORING GUIDELINES Question 4 Some scientists estimate that by 2025 over 60 percent of the global human population will live in urban areas. Urban residents experience a variety
2011 2015 Financial Plan
 2011 2015 Financial Plan Committee of the Whole March 8, 2011 Service Budgets Review AIM for Results Review of Budget Process Proposed budget overview presented to the Committee of the Whole January 25
Environment Situation in Timor-Leste
 Environment Situation in Timor-Leste Historically; 1. East-Timor or Timor-Leste, the Portuguese name of the country. 2. It was colonialised by Portuguese 450 years and Occupied by Indonesian 24 years.
INDOOR AIR QUALITY ASSESSMENT INCIDENT RESPONSE. Sgt. William H. Carney Memorial Academy 247 Elm Street New Bedford, Massachusetts
 INDOOR AIR QUALITY ASSESSMENT INCIDENT RESPONSE Sgt. William H. Carney Memorial Academy 247 Elm Street New Bedford, Massachusetts Prepared by: Massachusetts Department of Public Health Bureau of Environmental
DISCOVER AQ OUTLOOK Thursday January 31, 2013
 DISCOVER AQ OUTLOOK Thursday January 31, 2013 PODEX coastal leg (LA) Oxnard NWS forecasted narrow patch of stratus within 50 miles of the coast, but the main lower level cloud deck would be out past 125+
PROPOSAL AIR POLLUTION: A PROJECT MONITORING CURRENT AIR POLLUTION LEVELS AND PROVIDING EDUCATION IN AND AROUND SCHOOLS IN CAMDEN
 PROPOSAL AIR POLLUTION: A PROJECT MONITORING CURRENT AIR POLLUTION LEVELS AND PROVIDING EDUCATION IN AND AROUND SCHOOLS IN CAMDEN Vivek Deva Supervisors: Dr Audrey de Nazelle, Dr Joanna Laurson- Doube
SAT Initiative: The Ohio Valley Education Center (Marietta, OH), Warren Elementary School (Marietta, OH), and Neale Elementary School (Vienna, WV)
, Warren Elementary School (Marietta, OH), and Neale Elementary School (Vienna, WV)") SAT Initiative: The Ohio Valley Education Center (Marietta, OH), Warren Elementary School (Marietta, OH), and Neale Elementary School (Vienna, WV) This document describes the analysis of air monitoring
SAT Initiative: The Ohio Valley Education Center (Marietta, OH), Warren Elementary School (Marietta, OH), and Neale Elementary School (Vienna, WV) This document describes the analysis of air monitoring
North Island 9-1-1 Corporation
 North Island 9-1-1 Corporation 1 2 2014-2018 Directors Alberni Clayoquot John McNabb Comox Valley Bob Wells Mt. Waddington Phil Wainwright Nanaimo (SD 69) Joe Stanhope Powell River Sandy McCormick Strathcona
MATCHDAY 1 7-9 September 2014
 MATCHDAY 1 7-9 September 2014 7 September Sunday 18:00 Group D 7 September Sunday 20:45 Group D 7 September Sunday 20:45 Group D 7 September Sunday 18:00 Group F 7 September Sunday 20:45 Group F 7 September
MAC-ENC-PRO-057 AIR QUALITY MONITORING PROGRAM
 MAC-ENC-PRO-057 AIR QUALITY MONITORING Document Owner Donna McLaughlin, Environment Superintendent Document Approver Rob Hayes, Manager Environment Revision History Version No. Date Published Details 1.2
POLICY ACTIONS INVESTING IN INNOVATION
 The BC Energy Plan ALTERNATIVE ENERGY Government will work with other agencies to maximize opportunities to develop, deploy and export British Columbia clean and alternative energy technologies. POLICY
Tracking Wildfire Smoke During the 2012 Idaho Smokepocalypse: Techniques and Lessons Learned
 Tracking Wildfire Smoke During the 2012 Idaho Smokepocalypse: Techniques and Lessons Learned } NW-AIRQUEST Annual Meeting, } June 7, 2013 Featherville, Idaho, during the Trinity Ridge fire, Summer 2012
The design of the Romanian national air quality monitoring network
 The design of the Romanian national air quality monitoring network Ecaterina SZABO NRC Air Quality Romania Senior Councilor Pollution Control and Air Quality Department Ministry of Environment and Forestry
GUIDANCE DOCUMENT ON AIR ZONE MANAGEMENT PN 1481 978-1-896997-89-6 PDF
 GUIDANCE DOCUMENT ON AIR ZONE MANAGEMENT PN 1481 978-1-896997-89-6 PDF Canadian Council of Ministers of the Environment, 2012 The Canadian Council of Ministers of the Environment (CCME) is the primary,
Traffic Signal Priority (TSP) and Automatic Vehicle Tracking System (AVTS) For Calgary Transit Buses
 and Automatic Vehicle Tracking System (AVTS) For Calgary Transit Buses") Traffic Signal Priority (TSP) and Automatic Vehicle Tracking System (AVTS) For Calgary Transit Buses (Project #2001-06) Calgary Transit Transit Planning 2004 July Introduction The purpose of this report
Traffic Signal Priority (TSP) and Automatic Vehicle Tracking System (AVTS) For Calgary Transit Buses (Project #2001-06) Calgary Transit Transit Planning 2004 July Introduction The purpose of this report
Alberta Health Services Speakers Series
 The Montréal Public Health Department s approach to reducing public health impacts of the built environment Alberta Health Services Speakers Series Direction de santé publique Richard Lessard, director
Published in "Official Gazette of the Republic of Macedonia" No. 67/2004 LAW ON AMBIENT AIR QUALITY I. GENERAL PROVISIONS
 Published in "Official Gazette of the Republic of Macedonia" No. 67/2004 LAW ON AMBIENT AIR QUALITY I. GENERAL PROVISIONS Article 1 Subject of regulation (1) This Law shall regulate the measures for avoidance,
Comparison of PM10 and SO 2 Concentrations in the Cities Located at the Mediterranean Coast of Turkey
 Comparison of PM10 and SO 2 Concentrations in the Cities Located at the Mediterranean Coast of Turkey *Güray Doğan, Ahmet Tepe and Çiğdem Moral Akdeniz University, Department of Environmental Engineering,
Winter Air Quality in Yellowstone National Park 2006-2007
 National Park Service U.S. Department of the Interior Natural Resource Program Center Winter Air Quality in Yellowstone National Park 26-27 Natural Resource Report NPS/NRPC/ARD/NRTR--27/65 ON THE COVER
SUBCHAPTER 2D - AIR POLLUTION CONTROL REQUIREMENTS SECTION 2D.0100 - DEFINITIONS AND REFERENCES
 2D1-1 SUBCHAPTER 2D - AIR POLLUTION CONTROL REQUIREMENTS SECTION 2D.0100 - DEFINITIONS AND REFERENCES.0101 DEFINITIONS The definition of any word or phrase used in Regulations of this Subchapter is the
Smoke Monitoring Network on 2006 Northern California Fires. Introduction. Smoke Monitoring Network. Brenda Belongie 1 and Suraj Ahuja 2
 Smoke Monitoring Network on 2006 Northern California Fires Brenda Belongie 1 and Suraj Ahuja 2 Abstract Long-duration fire activity during the 2006 northern California fire season presented an excellent
Climatography of the United States No. 20 1971-2000
 Climate Division: CA 4 NWS Call Sign: Month (1) Min (2) Month(1) Extremes Lowest (2) Temperature ( F) Lowest Month(1) Degree s (1) Base Temp 65 Heating Cooling 1 Number of s (3) Jan 59.3 41.7 5.5 79 1962
Robichaud K., and Gordon, M. 1
 Robichaud K., and Gordon, M. 1 AN ASSESSMENT OF DATA COLLECTION TECHNIQUES FOR HIGHWAY AGENCIES Karen Robichaud, M.Sc.Eng, P.Eng Research Associate University of New Brunswick Fredericton, NB, Canada,
Reducing Traffic-Related Air Pollution Exposure in Smart Growth Development
 Reducing Traffic-Related Air Pollution Exposure in Smart Growth Development Ashley Russell, Doug Eisinger, Steve Brown Sonoma Technology, Inc. Dahlia Chazan Arup North America Ltd. Rich Baldauf U.S. EPA
Cumulative dispersion modeling of diesel engine emissions from numerous backup generators in Quincy, WA
 Cumulative dispersion modeling of diesel engine emissions from numerous backup generators in Quincy, WA Gary Palcisko Science & Engineering Section Air Quality Program November 7, 2012 PNWIS 2012 A datacenter
Climatography of the United States No. 20 1971-2000
 Climate Division: CA 6 NWS Call Sign: SAN Month (1) Min (2) Month(1) Extremes Lowest (2) Temperature ( F) Lowest Month(1) Degree s (1) Base Temp 65 Heating Cooling 100 Number of s (3) Jan 65.8 49.7 57.8
The characteristics of fatal road accidents during the end of year festive period
 The characteristics of fatal road accidents during the end of year festive period 1994-2003 March 2004 Traffic Management and Road Safety Unit Ministry of Public Infrastructure, Land Transport and Shipping
Issues/Concerns With Ambient Air Monitoring
 Issues/Concerns With Ambient Air Monitoring By Wendy Bracken Please find listed comments below that pertain to the Final Report on Ambient Air Monitoring of the Courtice Road Station, June 2009. They are
NOVEL STRATEGIES FOR ASSESSMENT OF AMBIENT AIR QUALITY USING GIS AND ONLINE POLLUTION MONITORING TOOLS I. Jaykumar 2, V. Hima Bindu 2, P.
 NOVEL STRATEGIES FOR ASSESSMENT OF AMBIENT AIR QUALITY USING GIS AND ONLINE POLLUTION MONITORING TOOLS I. Jaykumar 2, V. Hima Bindu 2, P.V Mukunda Rao 2, G. Sagareshwar 2 K.V. Ramani 3, & Y. Anjaneyulu
WHY IS BREATHING SO IMPORTANT?
 You need to breathe to stay alive. But how clean is the air you breathe? If you breathe dirty air, you are more likely to develop health problems and become ill. Plants and animals need clean air too.
 SCHEDULE 1 ROUTE OVERVIEW ROUTE OVERVIEW - TABLE OF CONTENTS DESIGNATED FERRY ROUTE GROUP ROUTE 1 SWARTZ BAY TO TSAWWASSEN... 2 ROUTE 2 HORSESHOE BAY TO NANAIMO... 4 ROUTE 3 HORSESHOE BAY TO LANGDALE...
MUNICIPALITY OF CHATHAM-KENT FIRE AND EMERGENCY SERVICES FIRE DEPARTMENT. A by-law to regulate open air burning in the Municipality of Chatham-Kent
 MUNICIPALITY OF CHATHAM-KENT FIRE AND EMERGENCY SERVICES FIRE DEPARTMENT TO: FROM: Mayor and Members of Council Ray Stone, Assistant Fire Chief DATE: October 20, 2009 SUBJECT: A by-law to regulate open
Safe Operating Procedure
 Safe Operating Procedure (Revised 11/11) OPACITY OF EMISSIONS FROM COMBUSTION SOURCES (For assistance, please contact EHS at (402) 472-4925, or visit our web site at http://ehs.unl.edu/) The University
Academic Calendar for Faculty
 Summer 2013 Term June 3, 2013 (Monday) June 3-4, 2013 (Monday Tuesday) June 5, 2013 (Wednesday) June 5-6, 2013 (Wednesday Thursday) June 6, 2013 (Thursday) July 3, 2013 (Wednesday) July 4, 2013 (Thursday)
2014 Aamjiwnaang Air Monitoring Station Results. Ministry of the Environment and Climate Change April 19, 2016
 2014 Aamjiwnaang Air Monitoring Station Results Ministry of the Environment and Climate Change April 19, 2016 Outline Key Results Parameters Measured Benchmarks 2014 Report Results Mobile Monitoring Results
Needs Analysis. Long Beach Bicycle Master Plan. Bicycle Commuter Needs. LONG BEACH BICYCLE MASTER PLAN Needs Analysis
 Long Beach Bicycle Master Plan Needs Analysis The purpose of reviewing the needs of commuter and recreational bicyclists is twofold: (1) it is instrumental when planning a system which must serve both
Experimental study on atmospheric pollutant emissions from heating systems, in Italy
 Experimental study on atmospheric pollutant emissions from heating systems, in Italy Promoted by the Italian Ministry for the Environment, in coperation with : The Lombardy Region, the Piedmont Region,
The Regulatory Role of Chemical Mechanisms and Future Needs
 The Regulatory Role of Chemical Mechanisms and Future Needs Ajith Kaduwela Planning and Technical Support Division Air Resources Board California Environmental Protection Agency Department of Land, Air
DEVELOPMENT OF NEEDS ASSESSMENT AND DESIGN OF AIR QUALITY MONITORING NETWORK
 Terms of Reference DEVELOPMENT OF NEEDS ASSESSMENT AND DESIGN OF AIR QUALITY MONITORING NETWORK (Contract ID No: PPCR/DHM/S/CQS-36) August 2015 1. Introduction This Terms of Reference (ToR) is for an international
Air Quality: Public Health Impacts and Local Actions
 Air Quality: Public Health Impacts and Local Actions This briefing is to inform public health professionals of the public health impacts of air pollution, the sources of air pollution and measures available
SAT Initiative: Young Scholars Academy (Houston, TX)
") SAT Initiative: Young Scholars Academy (Houston, TX) This document describes the analysis of air monitoring and other data collected under EPA s initiative to assess potentially elevated air toxics levels
SAT Initiative: Young Scholars Academy (Houston, TX) This document describes the analysis of air monitoring and other data collected under EPA s initiative to assess potentially elevated air toxics levels
Preliminary advances in Climate Risk Management in China Meteorological Administration
 Preliminary advances in Climate Risk Management in China Meteorological Administration Gao Ge Guayaquil,Ecuador, Oct.2011 Contents China Framework of Climate Service Experience in Climate/disaster risk
Which filter class for supply air is required in a typical HVAC system?
 Which filter class for supply air is required in a typical HVAC system? Thomas Carlsson, Technical Director, Magnus Johnsson, Vokes Air Table of Contents: Background 2 Energy Demand 2 Air Quality and PM
E-1. Appendix E CONCENTRATION-RESPONSE RELATIONSHIPS FOR MODEL SENSITIVITY ANALYSIS IN RISK ASSESSMENT
 E-1 Appendix E CONCENTRATION-RESPONSE RELATIONSHIPS FOR MODEL SENSITIVITY ANALYSIS IN RISK ASSESSMENT The interpretation of specific concentration-response relationships is understood to be one of the
2) Relevance for environmental policy... 2. 4) Data sources and reporting... 5 5) References at the international level... 6
 Relevance for environmental policy... 2. 4) Data sources and reporting... 5 5) References at the international level... 6") A- 2: Ambient air quality in urban areas 1) General description... 2 1.1) Brief definition... 2 1.2) Units of measurement... 2 1.3) Context...2 2) Relevance for environmental policy... 2 2.1) Purpose...
A- 2: Ambient air quality in urban areas 1) General description... 2 1.1) Brief definition... 2 1.2) Units of measurement... 2 1.3) Context...2 2) Relevance for environmental policy... 2 2.1) Purpose...
Food Security Funding Opportunities for Island Businesses and Communities
 Food Security Funding Opportunities for Island Businesses and Communities The following is a list of grants available for food security related projects in the Islands Trust Area. As grant deadlines can
Cobb County School District: Reducing School Bus Fleet Diesel Emissions and Idling
 Cobb County School District: Reducing School Bus Fleet Diesel Emissions and Idling Chris Rome, Randall Guensler Vetri Elango, and Sara Khoeini http://transportation.ce.gatech.edu/busemissions Outline Project
THE CORPORATION OF THE TOWN OF AURORA. By-law Number 4787-06.P
 THE CORPORATION OF THE TOWN OF AURORA By-law Number 4787-06.P BEING A BY-LAW to regulate and prohibit the causing of noise in the Town of Aurora. WHEREAS Subsection 129 (1) of the Municipal Act 2001, S.O.
Leigh Park Area Safety Scheme, Havant, Hampshire
 Traffic Advisory Leaflet 2/99 April 1999 Leigh Park Area Safety Scheme, Havant, Hampshire The scheme The Leigh Park Area Safety Scheme includes the area in the Leigh Park Estate bounded by Middle Park
Proposed Terms of Reference for EIA studies
 1 Proposed Terms of Reference for EIA studies Base line data collection will be collected for the Post-Monsoon season 2016 (September to November 2016) in study area and 10 kms radius from project site.
Preparedness in the Southwest
 Preparedness in the Southwest Risk Assessment and Hazard Vulnerability Developed by The Arizona Center for Public Health Preparedness Cover Art www.azcphp.publichealth.arizona.edu Chapter 1 Importance
FACT SHEET PROPOSED REVISIONS TO THE NATIONAL AMBIENT AIR QUALITY STANDARDS FOR SULFUR DIOXIDE
 FACT SHEET PROPOSED REVISIONS TO THE NATIONAL AMBIENT AIR QUALITY STANDARDS FOR SULFUR DIOXIDE SUMMARY OF ACTION o On November 16, 2009, EPA proposed to strengthen the National Ambient Air Quality Standard
Revised Health Impact Assessment Recommendation Document for
 Revised Health Impact Assessment Recommendation Document for Quincy, Washington Prepared by Department of Ecology Air Quality Program Olympia, Washington Second Tier Review Recommendation Page 2 of 16
Climatography of the United States No. 20 1971-2000
 Climate Division: CA 2 NWS Call Sign: SAC Month (1) Min (2) Month(1) Extremes Lowest (2) Temperature ( F) Lowest Month(1) Degree s (1) Base Temp 65 Heating Cooling 100 Number of s (3) Jan 53.8 38.8 46.3
Emissions Testing and the EPA in Washington State
 Preliminary Cost-Benefit and Least Burdensome Alternative Analyses Chapter 173-422A WAC Motor Vehicle Emissions Inspection February 2011 Publication no. 11-02-003 Publication and Contact Information This
Air pollution impact of Buncefield Oil Depot Fire Measurements from the London, Sussex and Herts. & Beds air quality monitoring networks
 Air pollution impact of Buncefield Oil Depot Fire Measurements from the London, Sussex and Herts. & Beds air quality monitoring networks Gary Fuller and Timothy Baker King s College London June 2006 Contents
Particulate matter sources in Helsinki area and effects on air quality - an overview
 Particulate matter sources in Helsinki area and effects on air quality - an overview Risto Hillamo 1, Topi Rönkkö 2 and Liisa Pirjola 3 1 Research and Development, Finnish Meteorological Institute 2 Department
Source Apportionment Strategies for Atmospheric Particulate Matter in Mega-Cities
 Source Apportionment Strategies for Atmospheric Particulate Matter in Mega-Cities James J. Schauer, PhD, PE, MBA Professor jjschauer@wisc.edu Motivation As global populations are moving toward megacities
Abstract. 1 Introduction. 2 Sampling locations
 Air Pollution XV 363 Ambient air quality monitoring in southern Kuwait A. A. Ramadan, A. Khan & S. Al-Hajraf Coastal and Air Pollution Department, Institute for Scientific Research, Kuwait Abstract Ambient
EURACHEM Workshop on Quality Assurance of Measurements from Field to Laboratory MIKES, Espoo Finland, 20-21 May 2013
 EURACHEM Workshop on Quality Assurance of Measurements from Field to Laboratory MIKES, Espoo Finland, 20-21 May 2013 Spatial and temporal characterization of exhaust emissions with a mobile laboratory
FLORIDA S OZONE AND PARTICULATE MATTER AIR QUALITY TRENDS
 FLORIDA S OZONE AND PARTICULATE MATTER AIR QUALITY TRENDS Florida Department of Environmental Protection Division of Air Resource Management December 2012 Various pollutants are found in the air throughout
WE LOVE EDMONTON. Your ideas to upgrade our city! Energy. City of Edmonton Response
 2015 During the We Love Cities campaign, you were asked for ideas to make Edmonton even better. Here are summaries of your comments and our responses. Thanks everyone, for helping to make our city more
NZDF Temporary Military Training Activities. Palmerston North City Council
 NZDF Temporary Military Training Activities for Palmerston North City Council File No. N1447TMT Version 22 nd June 2014 Nigel Lloyd Director of Acoustic Services E-mail: nigel@acousafe.co.nz 98 NZDF Temporary
VEHICLE IDLING AT SCHOOLS
 VEHICLE IDLING AT SCHOOLS OVERVIEW OF STATE LAWS Environmental Law Institute Part of the ELI Series Topics in School Environmental Health: Overview of State Laws www.eli.org/buildings/tseh.cfm Why is this
VERMONT TRAFFIC MONITORING STANDARDS
 VERMONT TRAFFIC MONITORING STANDARDS FOR CONTRACTUAL AGREEMENTS Vermont Agency of Transportation Traffic Research January 2001 Introduction This document presents the traffic monitoring standards in effect
Child Road Safety Audit for South Gloucestershire 2009-2011
 Child Road Safety Audit for South Gloucestershire 9 - August 9 Contents Page Foreword Executive Summary. Introduction. Review of the Action Plan. Summary of Casualty Statistics 9. Child Casualty Trends.
Large exposure measurement databases: experiences from CAREX Canada
 Large exposure measurement databases: experiences from CAREX Canada Cheryl Peters 1,2, MSc, PhD Candidate Occupational Exposures Advisor www.carexcanada.ca Co-authors: Hugh Davies 2, Paul Demers 3,4 1.
TORONTO MUNICIPAL CODE CHAPTER 423, ENVIRONMENTAL REPORTING AND DISCLOSURE. Chapter 423 ENVIRONMENTAL REPORTING AND DISCLOSURE
 423-1. Definitions. TORONTO MUNICIPAL CODE 423-2. Duty to report. Chapter 423 ENVIRONMENTAL REPORTING AND DISCLOSURE ARTICLE I Interpretation ARTICLE II Duty to Report 423-3. Exemptions from reporting
Introduction to PATS Data Quality
 /7/ Introduction to PATS Data Quality October 7, PATSAC Meeting DEQ PATSAC 9 5 & 7 Modeled Concentrations Review 7 Growth Factors Learn about EI, modeling and monitoring data PATSAC Formation Charter,
MONITORING SCHOOL ENERGY CONSUMPTION
 MONITORING SCHOOL ENERGY CONSUMPTION Goal(s): The mains goal of the energy monitoring activity are: To make the pupils and all school staff aware of school energy consumption; and To show how changes in
The population health impacts of heat. Key learnings from the Victorian Heat Health Information Surveillance System
 The population health impacts of heat Key learnings from the Victorian Heat Health Information Surveillance System The population health impacts of heat Key learnings from the Victorian Heat Health Information
REGULATION 6 PARTICULATE MATTER AND VISIBLE EMISSIONS RULE 3 WOOD-BURNING DEVICES INDEX
 6-3-100 GENERAL REGULATION 6 PARTICULATE MATTER AND VISIBLE EMISSIONS RULE 3 WOOD-BURNING DEVICES INDEX 6-3-101 Description 6-3-110 Limited Exemption, Natural Gas Service Unavailability 6-3-111 Limited
Request for Quotation
 The Comox Valley Regional District (CVRD) is seeking quotations for the services of a business continuity and emergency planner contractor. The services required under this request for quotation (RFQ)
Anyone Else Notice That Its Been Windy Lately?
 National Weather Service Aberdeen, South Dakota January 2014 Inside this issue: Has it Been Windy Lately or What? 2013 Year in Review 2013 Year in Review (cont.) 1 2 3 Has it Been Windy Lately or What?
Attended Noise Monitoring - Quarter Ending December 2013
 Big Island Mining Pty Ltd Majors Creek Road Majors Creek Version: Page 2 PREPARED BY: ABN 29 001 584 612 Units 7-8, 26-28 Napier Close Deakin ACT 2600 Australia (PO Box 9344 Deakin ACT 2600 Australia)
LESSON PLAN 1. Fire Science. Key Terms and Concepts. ash chemical reaction combustion Consumer Product Safety Commission endothermic exothermic
 LESSON PLAN 1 Fire Prevention Fire and Fire Prevention Combustion occurs when the three elements of the fire triangle heat, fuel and oxygen are present. Understanding this basic chemical reaction can help
Carbon monoxide. General information
 Carbon monoxide General information Key Points Fire Flammable gas May react violently with other substances Use fine water spray with normal fire-fighting clothing and breathing apparatus Health Toxic
Bioenergy. A sustainable energy source.
 Bioenergy. A sustainable energy source. The natural energy cycle Skellefteå Kraft strongly believes that bioenergy will play an important role in future Swedish energy production. Its raw material consists
International University of Monaco 12/04/2012 12:50 - Page 1. Monday 30/01 Tuesday 31/01 Wednesday 01/02 Thursday 02/02 Friday 03/02 Saturday 04/02
 International University of Monaco 12/04/2012 12:50 - Page 1 Master in Finance - Private Banking and International - from 30/01/12 to 04/02/12 Monday 30/01 Tuesday 31/01 Wednesday 01/02 Thursday 02/02
How To Reduce No 2 Emissions In Nordic Cities
 Summary: NO 2 emission from the fleet of vehicles in major Norwegian cities Challenges and possibilities towards 2025 TØI Report 1168/2011 Author(s): Rolf Hagman, Karl Idar Gjerstad and Astrid H. Amundsen
What are the causes of air Pollution
 What are the causes of air Pollution Pollutant Particulate Matter (PM-PM 10 and PM 2.5 ) Description and main UK sources Particulate Matter is generally categorised on the basis of the size of the particles
DUBLIN CITY COUNCIL AMBIENT SOUND MONITORING NETWORK Annual Report For 2011
 DUBLIN CITY COUNCIL AMBIENT SOUND MONITORING NETWORK Annual Report For 2011 Produced by Traffic Noise & Air Quality Unit Roads and Traffic Department, Dublin City Council Contact: Ph. 01 2223847; E-mail:
Health effects of particulate matter and implications for policy in Europe
 Health effects of particulate matter and implications for policy in Europe Marie-Eve Héroux Technical Officer, Air Quality and Noise WHO European Centre for Environment and Health Bonn, Germany Presentation
THE CITY OF COURTENAY:
 City of Courtenay THE CITY OF COURTENAY: CHANGING FOR OUR CLIMATE CITY OF COURTENAY STANDS UP AGAINST CLIMATE CHANGE IN BRITISH COLUMBIA WRITTEN BY SASHA ORMAN PRODUCED BY XAN WYNNE-JONES Photo: Boomer
PROPOSED TERMS OF REFERENCE
 Annexure-IV PROPOSED TERMS OF REFERENCE 1.0 Proposed Scope of Work for EIA Study The components of the EIA study include: Detailed description of all elements of the project activities (existing and proposed
Environmental Management System
 Environmental Management System Heron Island Research Station (HIRS) Environmental Noise Program 1. Scope The Environmental Noise Program is limited to the following noise sources: Machinery owned by the
MIAMI-SOUTH FLORIDA National Weather Service Forecast Office http://www.weather.gov/miami
 MIAMI-SOUTH FLORIDA National Weather Service Forecast Office http://www.weather.gov/miami January Summary: Warm and Dry Winter Rolls On February 1, 2013: South Florida s warm and dry winter pattern of
Projections, Predictions, or Trends?
 Projections, Predictions, or Trends? The challenges of projecting changes to fire regimes under climate change Bec Harris 9-11 th October, 2013 What are we looking for? Aims differ, and are more or less