State of Hawaii 2015 Ambient Air Monitoring Network 5-Year Assessment
|
|
|
- Samson Page
- 8 years ago
- Views:
Transcription
1 State of Hawaii 2015 Ambient Air Monitoring Network 5-Year Assessment Prepared by: State of Hawaii Department of Health Environmental Management Division Clean Air Branch July 1, 2015 Document No. CABMA-5YRA-2015-v01

2 Table of Contents List of Tables... iii List of Figures... iii Abbreviations and Definitions... iv I. Executive Summary... 1 A. Purpose of Assessment... 1 B. Ambient Air Monitoring Networks... 1 C. Summary of 2015 Findings... 1 II. Introduction... 3 III. Current Air Monitoring in the State of Hawaii... 4 IV. Climate, Population and Emission Source Characteristics... 7 A. Climate and Topography... 7 B. Population C. Emission Sources V. Data Assessment VI. New NAAQS VII. Technology VIII Assessment Findings ii

3 List of Tables Table 1. Air Monitoring in the State of Hawaii Table 2. State of Hawaii Population Summary Table NEI Table Assessment Implementation List of Figures Figure 1. Air Monitoring Stations in the State of Hawaii Figure 2. Climate and Topography... 9 Figure 3. State of Hawaii Population by County: 2010 Census Figure 4. Kauai: % Poverty, Emission Sources, Childhood Asthma Figure 5. Honolulu MSA: % Poverty, Emission Sources, Childhood Asthma Figure 6. Maui: % Poverty, Emission Sources, Childhood Asthma Figure 7. Hawaii County: % Poverty, Emission Sources, Childhood Asthma Figure 8. CO: 2011 NEI (including airports) Figure 9. NOx: 2011 NEI (including airports) Figure 10. SO2: 2011 NEI (including airports) Figure 11. PM10: 2011 NEI (including airports) Figure 12. PM2.5: 2011 NEI (including airports) Figure 13. Statewide Trend: Average 99 th Percentile 1-Hr SO Figure 14. Statewide Trend: Average 98 th Percentile 24-Hr PM Figure 15. Statewide Trend: 4 th Highest 8-Hr O Figure 16. Statewide Trend: Average 98 th Percentile 1-Hr NO Figure 17. Statewide Trend: Statewide Trend: Maximum 24-Hr PM Figure 18. Statewide Trend: Maximum 8-Hr CO Figure 19. Maximum 1-Hr H2S Trend at Puna E Figure 20. SO2 Data Requirements Rule: HECO Kahe Proposed Monitoring Location Figure 21. SO2 Data Requirements Rule: HECO Waiau Proposed Monitoring Location iii
... 18 Figure 9.")
4 Abbreviations and Definitions AADT Annual Average Daily Traffic BAM Met-One Beta-Attenuation Monitor CBSA Core-based Statistical Area CFR Code of Federal Regulations CIP Campbell Industrial Park (Oahu) CO Carbon monoxide gas DBEDT State of Hawaii Department of Economic Development and Tourism DoH Hawaii State Department of Health ECA Emissions Control Area (MARPOL) EPA (R9) United States Environmental Protection Agency (Region 9) FEM Federal Equivalent Method FRM Federal Reference Method H2S Hydrogen sulfide gas HECO Hawaiian Electric Company HVNP Hawaii Volcanoes National Park IMPROVE Integrated Monitoring of Protected Visual Environments MARPOL International Convention for the Prevention of Pollution from Ships MSA U. S. Census Bureau, Metropolitan Statistical Area NAAQS National Ambient Air Quality Standards NCore National Core Multi-pollutant Monitoring Stations NEI National Emissions Inventory (2011) NO2 Nitrogen dioxide gas NPS U. S. National Park Service O3 Ozone OMB U. S. Office of Management and Budget Pb Lead PM2.5 Particulate matter less than or equal to 2.5 microns in aerodynamic diameter PM10 Particulate matter less than or equal to 10 microns in aerodynamic diameter PGV Puna Geothermal Venture PSD Prevention of Significant Deterioration ppb Parts per billion, a measurement unit for gases ppm Parts per million; a measurement unit for gases PWEI Population Weighted Emissions Index, an EPA calculation that triggers SO2 monitoring SLAMS State and Local Air Monitoring Stations SO2 Sulfur dioxide gas SPMS Special Purpose Monitoring Stations TPD Tons per day TPY Tons per year vog Haze due to volcanic emissions WD Wind direction WS Wind speed µg/m 3 micrograms per cubic meter of air; a measurement unit for particulate matter iv

5 I. Executive Summary A. Purpose of Assessment 40 Code of Federal Regulations (CFR) Part 58 requires that a network assessment of the air quality surveillance system be conducted once every five years to determine if the network is effective and efficient in meeting monitoring objectives, whether new sites are needed or existing sites or monitors can be terminated and whether there are new technologies that can be incorporated. Conducted once every five years, with the first one completed in 2010, the assessment provides a more robust and comprehensive conceptualization of the current and future needs of the state s air surveillance network. The annual network plan consequently applies, resources allowing, the recommendations and decisions resulting from the assessment. B. Ambient Air Monitoring Networks The State of Hawaii Department of Health (DoH) currently operates 14 ambient air monitoring stations on four of the major islands. The Kahului, Maui station currently operates one PM2.5 monitor with the gas monitors coming online by the summer of 2015 (Table 1). The NCore station became fully operational in January 2011 with lead (Pb) monitoring beginning in January Ambient air monitoring is also being conducted by private industry and the U.S. National Park Service (NPS). Data from these networks are publically available and supplements the data being collected by the DoH. The main air surveillance concerns in the state include: Sulfur dioxide (SO2) and sulfate aerosols (PM2.5) from the ongoing Kilauea volcano eruption; Hydrogen sulfide (H2S) emissions from geothermal energy production and exploration; Cane-burning on the island of Maui; Implementing new monitoring as required by revisions or additions to the National Ambient Air Quality Standards (NAAQS) as well as revisions and additions to 40 CFR 58; Cruise ship emissions on the island of Kauai C. Summary of 2015 Findings The biggest challenge for the program is that compliance with new monitoring requirements as well as meeting the state s monitoring priorities are outpacing funding and resources. The necessity of doing more with less was one of the principal considerations when planning the future of the state s air monitoring network. Where allowed, DoH will partner with the private sector to accomplish monitoring goals. 1 P a g e

6 Prioritization of Pollutants DoH analyzed historical data from the monitoring network on a pollutant-by-pollutant basis to determine a priority ranking of each of the criteria pollutants. The ranking was based on each pollutant s average percentage of the NAAQS, whether the trend increased or decreased and its relative importance in meeting the state s monitoring objectives and goals. Based on those factors, the priority ranking was determined to be: 1. SO2 2. PM Nitrogen dioxide (NO2) 4. Ozone (O3) 5. Coarse particles (PM10) 6. Carbon Monoxide (CO) Findings DoH also considered the effects of climate and topography, population characteristics and location of emission sources before conceptualizing the future of the air monitoring network. Generally, the current network is effectively meeting the state s monitoring objectives and minimum federal requirements; Other than fulfilling the requirements for new U.S. Environmental Protection Agency (EPA) initiatives (e.g. near-road NO2 and the SO2 Data Requirements Rule), no new monitoring is needed; Specific recommendations: o To efficiently use resources, merge the Kapolei State and Local Air Monitoring Station (SLAMS) and National Core Multi-pollutant Monitoring Station (NCore). These stations are currently located sideby-side duplicating monitoring for CO and SO2. The recommendations are to discontinue the SLAMS CO monitor and investigate the possibility of operating a dual-range SO2 monitor at NCore to capture both the low and high range values. o Closely track population estimates for the Urban Honolulu Metropolitan Statistical Area (MSA). Should the population reach one million, monitoring for CO and PM2.5 at the near-road site would need to be included. o Install a 10-meter meteorological tower for collection of wind speed and direction information to assist in the determination of sources contributing to the formation of O3 at the Sand Island station. o The maximum sulfur content of marine fuel was reduced in August 2012 for ships operating within the Emissions Control Area (ECA) around the Hawaiian Islands. After the fuel sulfur reduction became effective, there was a correlated reduction in ambient concentrations of SO2 at the Niumalu monitoring station. The second fuel sulfur reduction became effective January 2015 and SO2 data at the Niumalu station will be analyzed for one-year post-reduction to determine the ambient effects, if any, of the fuel sulfur limits placed on cruise ships. 2 P a g e
 Findings DoH also considered the effects of climate and topography, population characteristics and location of emission sources before conceptualizing the future of the air")
7 If there is a substantial decrease in ambient SO2, the station may either be closed or moved to the population centers of Lihue or Kapaa. o Establish two new SO2 monitoring stations by January 1, 2017 to satisfy the Data Requirements Rule. To demonstrate compliance with the 1-hour SO2 NAAQS, DoH is anticipating source-monitoring of three to four facilities within the Urban Honolulu MSA that exceed the minimum SO2 emission threshold proposed by EPA. o The cost of consumables for the 13 PM2.5 Beta-Attenuation continuous monitors (BAM) is becoming prohibitive. Other Federal Equivalent Method (FEM) continuous PM2.5 monitors that do not have as much consumable costs will be explored to replace the BAM units as needed. DoH will ensure that collocation requirements are met should there be a change in the sampling method. II. Introduction In the CFR, EPA promulgated a requirement for all states to conduct and submit a network assessment once every five years [40 CFR 58.10(e)]. The state, or where applicable local, agency shall perform and submit to the EPA Regional Administrator an assessment of the air quality surveillance system every 5 years to determine, at a minimum, if the network meets the monitoring objectives defined in appendix D to this part, whether new sites are needed, whether existing sites are no longer needed and can be terminated, and whether new technologies are appropriate for incorporation into the ambient air monitoring network. The network assessment must consider the ability of existing and proposed sites to support air quality characterization for areas with relatively high populations of susceptible individuals (e.g., children with asthma), and, for any sites that are being proposed for discontinuance, the effect on data users other than the agency itself, such as nearby States and Tribes or health effects studies. For PM2.5, the assessment also must identify needed changes to population-oriented sites. The State, or where applicable local, agency must submit a copy of this 5-year assessment, along with a revised annual network plan, to the Regional Administrator. The first assessment is due July 1, Elements evaluated in the assessment include environmental justice concerns, location of asthma corridors, population shifts and emissions inventory. The assessment allows decision-makers to ensure that the current and future air surveillance network is established and operated efficiently and effectively to meet the state s environmental goals. Ambient air data is used for a variety of purposes including: NAAQS compliance; Providing near real-time air quality information to the public; Permit modeling; Pollutant trend analysis; Health studies; 3 P a g e
 is becoming prohibitive. Other Federal Equivalent Method (FEM) continuous PM2.")
8 Forecasting; Source monitoring; and, Evaluating the effects of emissions controls Questions asked during the assessment included: Are the current monitoring objectives being met or should the objectives be modified? Based on trend evaluation, what is the priority ranking by pollutant and by station? Are there areas that are underserved based on population and health statistics? Are there monitors or stations that could/should be discontinued or moved? Are there new technologies that can be used to optimize, streamline, or enable the network to operate more efficiently? Are there hot spot areas that would benefit from the deployment of temporary or mobile monitoring? How can resources be used most efficiently and effectively? III. Current Air Monitoring in the State of Hawaii The DoH currently operates 14 monitoring stations on four islands. There are two Metropolitan Statistical Areas (MSA) in the state: Urban Honolulu (hereafter called Oahu), which encompasses the island of Oahu; and the newly designated (as of February 28, 2013) Kahului-Wailuku-Lahaina MSA (hereafter called Maui) covering the County of Maui. There are also two Micropolitan Statistical Areas: Hilo (Hawaii County) and Kapaa (Kauai County). The state s network meets or exceeds the minimum monitoring requirements in 40 CFR 58 Appendix D. In addition to DoH ambient air monitoring stations, there are other private as well as federal air monitoring stations operating within the state. These include: Hawaiian Electric Company (HECO) West Oahu Air Monitoring Network In April 2009, HECO (Oahu s only electrical utility provider) began operating three ambient air monitoring stations along the Waianae coast of Oahu. This was part of a commitment to the west Oahu communities for the development and operation of a new power generation station in the nearby Campbell Industrial Park (CIP). All three stations monitor for CO, SO2, NO2, O3 and PM2.5 as well as wind speed (WS), wind direction (WD), ambient temperature and precipitation. Data from the three stations are publicly available on their website at Puna Geothermal Ventures (PGV) PGV operates a geothermal energy production facility on the island of Hawaii. As a condition of their non-covered source permit, the facility is required to operate and maintain three perimeter stations for the continuous monitoring of 4 P a g e

9 hydrogen sulfide gas (H2S) as well as wind speed and direction. The most recent 5-minute H2S data is publically available on the PGV webpage. National Park Service (NPS) The NPS operates and maintains the two Integrated Monitoring of Protected Visual Environments (IMPROVE) stations in the state. Hawaii has two Class I visibility areas: Haleakala National Park on Maui and Volcanoes National Park on Hawaii (HVNP). Additionally, there are two stations in HVNP that continuously monitor the SO2 emissions from the Kilauea volcano. This data is publically available at Table 1 lists the various monitoring stations in the state and the Figure 1 map shows the location of each station listed in the table. Table 1. Air Monitoring in the State of Hawaii 2015 Entity Location of Monitoring Program Parameters DoH Honolulu, Oahu SLAMS SO2, CO, PM2.5, PM10 Kapolei, Oahu SLAMS/NCore SO2, CO, NO2, PM2.5, PM10, PM10-2.5, O3, NOy, PM2.5 spec., Pb Pearl City, Oahu SLAMS PM2.5, PM10 Sand Island, Oahu SLAMS PM2.5, O3 Kihei, Maui SLAMS PM2.5 Paia, Maui SPMS PM2.5 Kahului, Maui 1 SPMS PM2.5 (SO2, NO2, CO) Niumalu, Kauai SPMS SO2, NO2, PM2.5 Hilo, Hawaii SLAMS/SPMS SO2, PM2.5 Kona, Hawaii SLAMS/SPMS SO2, PM2.5 Mt. View, Hawaii SPMS SO2, PM2.5 Ocean View, Hawaii SPMS SO2, PM2.5 Pahala, Hawaii SPMS SO2, PM2.5 Puna, Hawaii SPMS SO2, H2S HECO Waianae, Oahu West Oahu Air SO2, CO, NO2, O3, PM2.5 Lualualei, Oahu West Oahu Air SO2, CO, NO2, O3, PM2.5 Timberline, Oahu West Oahu Air SO2, CO, NO2, O3, PM2.5 PGV Pahoa, Hawaii (A) PGV H2S Pahoa, Hawaii (B) PGV H2S Pahoa, Hawaii (C) PGV H2S NPS Haleakala National Park, Maui IMPROVE PM2.5 spec. HVNP IMPROVE PM2.5 spec. HVNP Observatory Volcano alert SO2 HVNP Visitor s Center Volcano alert SO2 1 Kahului station will be fully operational by the summer of P a g e

10 Figure 1. Air Monitoring Stations in the State of Hawaii P a g e

11 IV. Climate, Population and Emission Source Characteristics A. Climate and Topography 1 Climate The Hawaiian archipelago is the most isolated populated area in the world. The closest landmass is California, approximately 2,400 miles to the northeast. The climate is predominantly influenced by the surrounding ocean and its tropical latitude location producing relatively mild temperatures and moderate humidity. There are basically two seasons: summer from May through October, and winter from October through April. The islands are actually the summits of a volcanic mountain range. The mountain and valley landscapes produce a complex air flow system with wide variability in wind speeds, rainfalls and temperatures. Strong diurnal wind patterns can be found on the southern and western leeward coasts of the islands. This diurnal pattern consists of sea breezes during the afternoon and early evening hours and land breezes at night. The most dominant climatic attribute affecting the dispersion of air pollutants and allowing for the normally clean air is the nearly persistent trade-wind or northeasterly winds. During the summer months, the trades are prevalent 80 to 95 percent of the time, decreasing in the winter months as cold fronts move through the islands bringing with them southerly winds. Emissions from the active Kilauea volcano on the island of Hawaii can travel up the island chain with these southerly or Kona winds. The volcanic emissions, also called vog create hazy conditions sometimes as far north as Kauai. Some of the major climatic regions are: 1. Windward lowlands Less than 2,000 feet on the northern to northeastern sides of the islands, these lowlands lie perpendicular to the prevailing trade-winds, is often cloudy with frequent trade showers (see Figure 2) and mild temperature fluctuations. 2. Leeward lowlands: Dryer, warmer weather prevail in these areas often with afternoon sea breezes. The exception is the Kona coast on the island of Hawaii which has its own distinctive climate. 3. Kona coast on the island of Hawaii: This is the only region where the rainfall is higher in the summer than in the winter. An eddy off the coast caused by the two large mountain peaks of Mauna Kea to the north and Mauna Loa to the south results in the volcanic plume circling back onto land and allowing the vog to be nearly constant during trade-wind weather. 1 Sources for climate information from Western Regional Climate Center ( and the National Weather Service, Honolulu ( 7 P a g e

12 Topography Each island has unique topographical influences: 4. Oahu The most significant factor influencing Oahu s environment is the urban Honolulu setting where tall, dense building structures tend to cause warmer temperatures and turbulent winds within the city center. The impact of city pollution is minimized by the trade-winds that normally blow them out to sea. 5. Kauai Being the northern-most major island, Kauai is largely exposed to the northwest frontal systems that bring rain during the winter months. Mt. Waialeale in the center of the island is one of the wettest spots in the world. 6. Maui The Maui MSA lies in the interior lowland between the two peaks of Haleakala and the West Maui mountains. The flat valley terrain can result in a nighttime inversion layer that may restrict vertical transport of air pollutants. 7. Hawaii The largest geographical influences are the two mountain peaks of Mauna Kea (13,796 ft.) and Mauna Loa (13,678 ft.) as well as the 32-year eruption of the Kilauea volcano. The mountain peaks create an eddy effect along the Kona coast that brings the volcanic plume, which would normally be moved off shore by the trade-winds, back onto land in the form of sulfate aerosols. When the winds turn southerly, as occurs during the winter months with the more frequent cold fronts, the plume travels directly to the Hilo coast on the eastern side of the island. Because of the relatively short distance between the volcano vents and Hilo, the volcanic plume is mainly detected as SO2. Monitoring Assessment Findings based on Climate and Topography 1. The majority of the monitoring stations are located on the downwind side of the islands where most of the air pollution is expected. 2. The new Kahului station is located in the interior lowland of central Maui where there is a potential for restricted transport of air pollutants. 3. The Kona air monitoring station is located to detect sulfate aerosols as PM2.5 and the Hilo and Mt. View stations are located to monitor for SO2 from the volcano when the winds come from a non-prevalent direction. 4. No new or relocated stations or monitors are proposed. 8 P a g e

13 Figure 2. Climate and Topography 9 P a g e

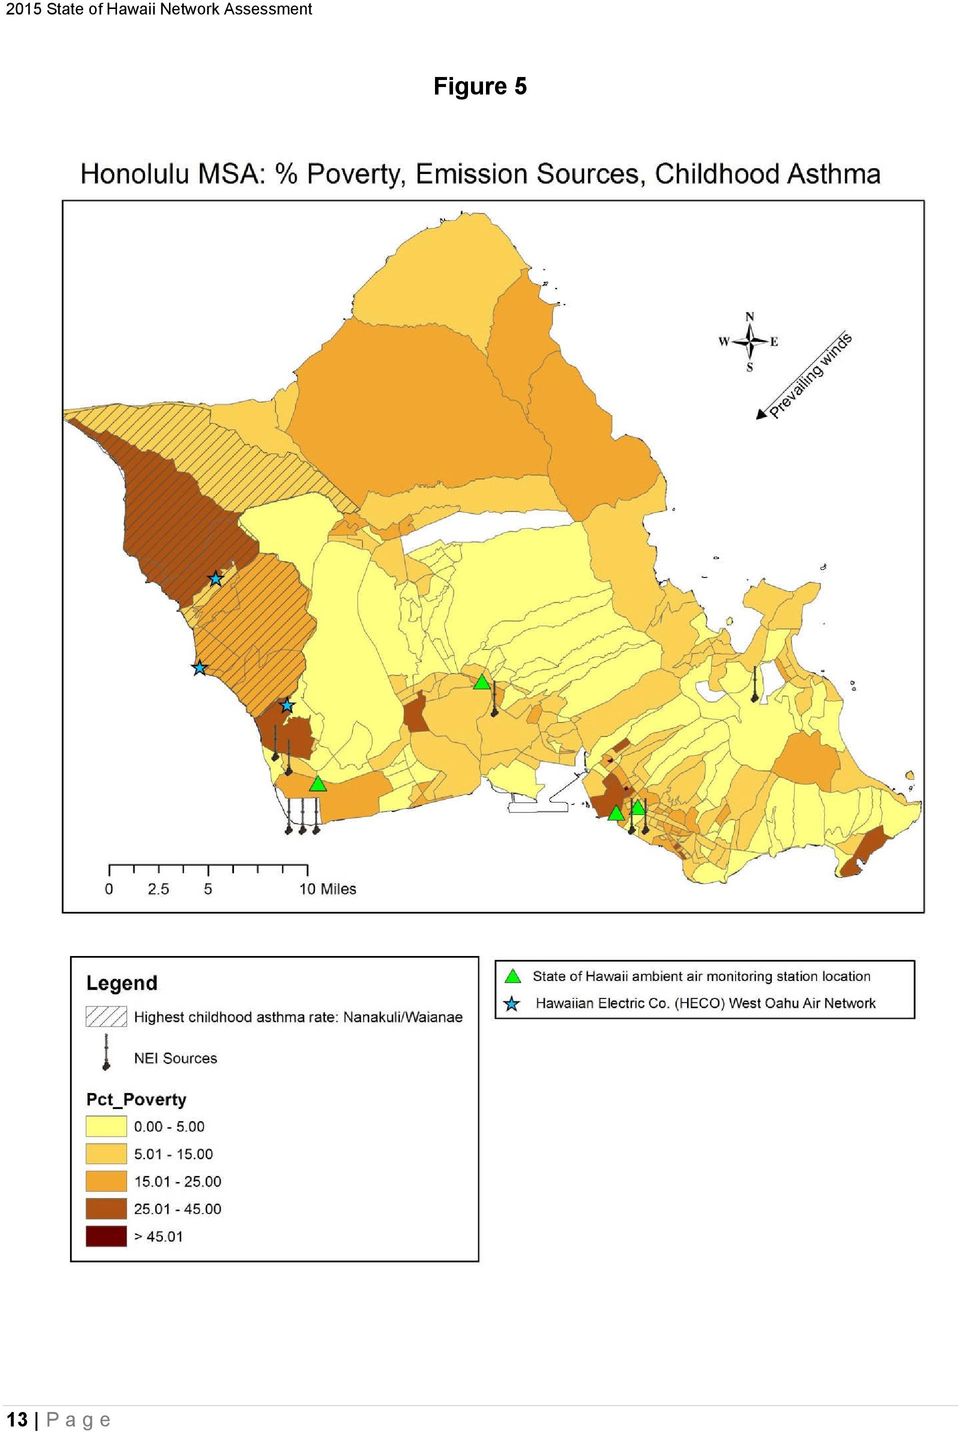
14 B. Population There are two MSAs in the state: Oahu, and the newly designated Maui MSA. The two Micropolitan Statistical Areas are Hilo (island of Hawaii) and Kapaa (island of Kauai). The state s population increased 12.3% from 2000 to 2010 with an estimated increase of 1% from 2010 to Table 2 summarizes the population totals on each island. The areas with higher poverty rates remained unchanged from the 2000 to the 2010 census. Similarly, the areas of highest childhood asthma were unchanged since Table 2. State of Hawaii Population Summary 2010 Population % Change % Share of Population Population (2013 est.) State 1,360, ,404,054 Oahu 953, ,429 Hawaii 185, ,821 Maui 144, ,292 Kauai 66, ,512 Monitoring Assessment Findings based on Population 1. The population of the Oahu MSA is approaching one million. If it reaches or exceeds one million, more monitoring would be required. CO and PM2.5 will need to be added to the near-road monitoring station and an area-wide NO2 monitor with expected highest concentration may be required. See Section VI for a description of additional monitoring requirements for the SO2 Data Requirements Rule should the population of the Oahu MSA exceed one million. 2. The poverty and asthma corridor areas on all islands have not changed since the 2000 census or the 2010 assessment (Figures 4 to 7). 3. The urbanized areas on each island remain unchanged from the 2000 to the 2010 census (Figure 3). 4. The three community monitoring stations owned and operated by HECO are all located along the Waianae coast of Oahu, which is also the area of highest poverty in the Oahu MSA. To conserve resources and prevent duplication of efforts, these three stations will be utilized to meet environmental justice concerns for Oahu. 5. No other new or relocated stations or monitors are proposed. 2 Hawaii Health Data Warehouse; Hawaii State Department of Health, Behavioral Risk Factor Surveillance System, Current Asthma Among Children and Adolescents in Hawaii, by State, County, Island, and Community, for the Years Report created 3/25/ P a g e
 State 1,360,301 +12.3 1,404,054 Oahu 953,207 +8.8 70.1 983,429 Hawaii 185,079 +24.")
15 Figure 3 11 P a g e

16 Figure 4 12 P a g e

17 Figure 5 13 P a g e
18 Figure 6 14 P a g e

19 Figure 7 15 P a g e

20 C. Emission Sources There have not been a significant number of new or relocated major emission sources in the past five years since the 2010 assessment was conducted. Summary of Emission Sources by Island Kauai The predominant air pollution concern on this island has been cruise ship emissions from Nawiliwili harbor. The harbor is located in Lihue on the eastern side of the island and the prevailing trade-winds carry the emissions on-shore impacting nearby residential communities. An important consideration will be the MARPOL (International Convention for the Prevention of Pollution from Ships) Annex VI treaty. This treaty requires ships to use fuel with lower sulfur content when entering any ECA, which includes a 200 mile radius around the Hawaiian islands. In August 2012, ships were required to use fuel with a sulfur content of not more than 10,000 ppm (1%) when operating within the ECA. Data from the DoH Niumalu station showed a correlating decrease in ambient levels of SO2. Beginning January 2015, the fuel sulfur limit was further reduced to 1,000 ppm (0.1%). Oahu Most of the major anthropogenic sources are located on Oahu and concentrated in the CIP area on the southwest side of the island. With 70% of the population residing on 602 square miles of land, mobile source pollution is the greatest on Oahu and will be the site of the near-road NO2 station. Additionally, there are two electrical generating facilities (HECO Kahe and HECO Waiau) that will exceed the SO2 annual emissions threshold in the proposed SO2 Data Requirements Rule. Maui The main concern for residents on Maui is smoke impacts from cane-burning. There are approximately 36,000 acres in the central valley planted in sugar cane. Each year, from March to early December, about 15,000 acres of the sugar cane is burned prior to harvesting the cane stalks for processing. Hawaii The largest emission source in the state is from the active Kilauea volcano. The U.S. Geological Survey estimates the SO2 output at between 4,000 to 6,000 tons per day. This source by far generates the greatest air pollution impact statewide. Additionally, there are concerns of H2S emissions as a result of geothermal energy exploration and production, especially for residents in the Puna area. 16 P a g e
 Annex VI treaty.")
21 Summary of Emissions by Pollutant A summary of the criteria pollutant emissions from the 2011 National Emissions Inventory (NEI) is provided in Table 3. As expected, the majority of anthropogenic emissions occur on the island of Oahu where most of the industrial and mobile sources are located. When only major source emissions are considered, the Hawaiian Commercial & Sugar facility in Maui County is the largest CO emitter. However when all sources are included, Oahu by far has the most CO, primarily from mobile sources. Increases in PM10 and PM2.5 emissions on Oahu when all sources are considered are primarily due to construction dust. Table NEI County Major sources Kauai All sources Kauai Major sources Oahu All sources Oahu Major sources Maui All sources Maui Major sources Hawaii All sources - Hawaii Major sources State All sources State CO (tpy) ,076 4, ,250 7,053 36,374 1,311 36,264 13, ,963 NOx (tpy) 1,827 3,746 20,474 34,851 5,346 9,941 1,336 6,737 28,983 55,276 SO2 (tpy) ,336 19,034 3,291 4,537 3,347 3,833 22,046 27,740 PM10 (tpy) 178 4,547 1,970 16, , ,764 2,813 41,229 PM2.5 (tpy) 145 1,039 1,705 4, , ,989 2,441 10,079 Monitoring Assessment Findings based on Emission Sources 1. Continue monitoring for cruise ship emissions at the Niumalu, Kauai station a minimum of one year (until January 2016). If the data shows a significant reduction in ambient SO2, with community input, either close the station or move it to a population based area within Lihue or Kapaa. 2. Establish the near-road NO2 station on Oahu by the end of 2015 or early 2016 as a SPM to gather background information and ensure that the equipment is operating properly prior to the required start date of January 1, Establish two new source-oriented SO2 monitoring sites on Oahu by January 1, 2017 to satisfy the proposed SO2 emissions threshold in the Data Requirements Rule. 4. Continue to operate the three PM2.5 monitoring stations in Kihei, Paia and Kahului with the Kahului station becoming fully operational by the summer of 2015 adding continuous monitoring for CO, NO2, and SO2. 5. Continue the six SO2 and five PM2.5 volcanic emissions monitoring stations on the island of Hawaii. 6. Continue monitoring for H2S in Puna for emissions from geothermal energy production and exploration. 7. No other new or relocated stations or monitors are proposed. 17 P a g e
22 Figure P a g e
23 Figure P a g e
24 Figure P a g e
25 Figure P a g e
26 Figure P a g e
27 V. Data Assessment Trends Data from the past 10 years (2004 through 2013) was analyzed to determine trends and pollutants of significance for the state. As expected, the upward trending for SO2 and PM2.5 were due to the increase in volcanic emissions after a second vent opened in March NO2 concentrations have increased, although remaining well below the NAAQS. O3 has increased slightly in the past 10 years, however concentrations are still about 60% of the NAAQS. On Oahu, PM10 was a concern due to the New Year s fireworks celebrations but concentrations have steadily decreased since the City and County began regulating its use. CO levels have remained relatively unchanged and well below any of the NAAQS. Figure 13. Statewide Trend: Average 99th Percentile 1-Hr SO ppb NAAQS eff. June sites sites sites 157% increase (volcanic emissions) 270.3% of 1-hour NAAQS averaged over 10 years 23 P a g e sites 2013
28 Figure Statewide Trend: Average 98th Percentile 24-Hr PM2.5 NAAQS eff. Dec ug/m sites sites 9 sites % increase (volcanic events) 42.5% of 24-hr NAAQS averaged over 10 years Figure 15. Statewide Trend: 4th Highest 8-Hr O NAAQS eff. March ppm site % increase for 8-hr O3 58.6% of 8-hr NAAQS 24 P a g e sites sites 11 sites 2013
29 Figure Statewide Trend: Average 98th Percentile 1-Hr NO2 NAAQS eff. February 100 ppb site sites 19.6% increase for 1-hr NO2 25.3% of 1-hr NAAQS Figure Statewide Trend: Maximum 24-Hr PM consumer fireworks ban ug/m % decrease 38.9% of 24-hr NAAQS averaged over 10 years 25 P a g e
30 Figure 18. Statewide Trend: Maximum 8-Hr CO ppm % increase for 8-hr CO -19.4% decrease for 1-hr CO 10.3% of 8-hr NAAQS and 5.3% of 1-hr NAAQS Figure 19. Maximum 1-Hr H2S Trend at Puna E SAAQS (no federal standard) ppb P a g e
31 Monitoring Assessment Findings Based on Data and Trends 1. Criteria pollutant prioritization: SO2, PM2.5, NO2, O3, PM10, CO a. The primary pollutants of concern for the state are SO2 and PM2.5 mainly due to volcanic events. i. Except for the new Kahului station, no new SO2 monitors are required, but communication with EPA is ongoing regarding the SO2 data requirement rule and possible placement of any monitors for designation purposes. ii. Maintain the Kapolei NCore low-range SO2 monitor as required but investigate the option of operating a dual-range monitor to capture possible higher values from the nearby CIP. If it is a feasible option, discontinue the Kapolei SLAMS SO2 monitor. iii. Since 13 of the state s 14 stations monitor for PM2.5, no new or relocated PM2.5 monitors are needed. b. Other than the near-road NO2 station and new NO2 monitoring at Kahului, data trends do no indicate a need for any new monitoring. c. Although there is only a slight upward trend for O3, EPA is considering lowering the current 8-hour O3 NAAQS and the data collected at the two O3 sites will be closely monitored. To better characterize the formation of O3 at the Sand Island station, a 10 meter meteorological tower for WS and WD should be installed. d. PM10 values have decreased on Oahu since the City & County began regulating the use of fireworks for the New Year s celebrations. The state currently meets the minimum PM10 monitoring requirements in 40 CFR 58, no new or relocated monitors are needed. e. CO values have been consistently low at all monitors with no indication of an increase in CO emission sources. Discontinue the redundant CO monitor at the Kapolei SLAMS station since CO is being monitored at Kapolei NCore. VI. New NAAQS In June 2010, EPA promulgated a new 1-hour SO2 NAAQS, replacing the 24-hour and annual standards. EPA also proposed a new approach for implementing the standard by allowing states to use either monitoring or refined dispersion modeling to demonstrate compliance with the new 1-hour NAAQS. As part of the implementation strategy, EPA is finalizing a Data Requirements Rule that will provide the requirements and guidance for SO2 source-oriented monitoring and modeling. The expected timeline for the state to identify their compliance method is January At that time, the state will also be required to identify sources that are at or above the SO2 threshold levels within and outside of the Core-based Statistical Area (CBSA). EPA is proposing a threshold of 1,000 tons per year (TPY) of SO2 for sources located inside CBSAs with populations greater than one million and 2,000 TPY of SO2 for sources outside of CBSAs with populations greater than one million. 27 P a g e
32 Although the actual Oahu MSA population is still less than one million, the total is quickly approaching that milestone with the OMB estimating the 2014 population at 991,788. Currently, EPA has not indicated the basis for the population count, therefore, in anticipation of the Oahu MSA population exceeding one million within the SO2 NAAQS compliance timeline, DoH is beginning analysis and planning for additional SO2 monitoring. However, even if the Oahu population remains below one million, there are facilities with SO2 emissions above 2,000 TPY. Currently, DoH prefers monitoring to modeling. Using the proposed threshold of 1,000 TPY SO2 emissions inside the CBSA, Oahu has four facilities that would require monitoring based on the 2013 annual emissions. They are: HECO Kahe electrical generating facility with 6,268 TPY; HECO Waiau electrical generating facility with 2,659 TPY; Kalaeloa Partners with 2,416 TPY and AES Hawaii at 1,504 TPY. There are no anthropogenic sources of SO2 outside the Oahu MSA with SO2 emissions at or above the proposed 2,000 TPY threshold. Preliminary SO2 modeling of these facilities indicate that none of the current DoH stations would be suitable for SO2 source monitoring. Since there are budgetary, staff and time constraints, DoH is looking to partner with HECO to establish monitoring stations before the January 1, 2017 deadline. The majority of the time, prevailing northeasterly winds transport the emissions from all affected facilities out to sea. As discussed earlier, HECO operates three monitoring stations in west Oahu, and preliminary modeling shows that one of those stations (Timberline) is in an impact area for the Kahe facility (Figure 20) during non-prevalent wind conditions. The Timberline station was also used for pre-construction monitoring for the Prevention of Significant Deterioration (PSD) permit for the new HECO electrical generating station located near Kalaeloa and AES. Preliminary modeling for HECO Waiau shows an impact area during non-prevalent wind directions near the Waiau facility within HECO s easement property (Figure 21). DoH will be discussing these monitoring options with both EPA and HECO. Monitoring Assessment Findings Based on New NAAQS Requirements 1. Establish two new SO2 monitoring stations by January 1, 2017: Locate one station in or near the area of maximum SO2 emissions impact from the HECO Kahe facility well as for Kalaeloa and AES located in Campbell Industrial Park. Explore the possibility of partnering with HECO to utilize their established Timberline air monitoring station for this purpose. Locate one station in or near the area of maximum SO2 emissions impact from the HECO Waiau facility in Central Oahu. Explore the possibility of partnering with HECO in establishing, operating and maintaining this station on HECO s easement property north of the facility. 28 P a g e
33 Figure P a g e
34 Figure 21. HECO Waiau 30 P a g e
35 VII. Technology In 2009, shortly after the Met-One Beta-Attenuation continuous PM2.5 monitor (BAM) received Federal Equivalent Method (FEM) designation, the state completed the migration of all of its manual PM2.5 monitors to the continuous method. Most of the monitors have been operating for eight or nine years and are breaking down. Additionally, the associated cost of the consumables for this instrument is becoming prohibitive. Operating all continuous PM2.5 instruments continues to be the state s objective. However, to reduce the cost burden of operating and maintaining the BAM instruments, the DoH will begin investigating other FEM instruments with little or no consumables. If acceptable equipment is found, collocation with a BAM instrument will be required and data compared prior to any purchase commitment. Any conversion should occur on an as-needed basis to allow for the distribution of costs over a period of time. VIII Assessment Findings Implementation of the 2010 Assessment Findings Most of the network proposals resulting from the 2010 assessment were implemented within the past five years. One lesson learned from the first assessment was that there should be equal consideration given to monitor or station closures as well as additions and relocations to ensure effective resource management. The major obstacles to the monitoring program as a whole have been and continue to be inadequate funding and resources. As more unfunded federally mandated programs become effective, such as NCore and NO2 near-road monitoring, the funding and staffing resources are being persistently challenged. However, despite these issues, the DoH managed to establish four new monitoring stations as proposed in the 2010 assessment (Table 4). Table Assessment Implementation 2010 Assessment Recommendation Implementation Establish a new Waikoloa station on the island of Hawaii to determine what impacts there may be from volcanic emissions. Establish the NCore station. Establish a Kahului, Maui station Establish a Lihue, Kauai station to monitor for cruise ship emissions 31 P a g e The Waikoloa station was established on July 1, 2012 monitoring for PM2.5 and SO2. The data showed that there were no measurable impacts from volcanic emissions and the station was closed on March 31, The NCore station began operating at Kapolei on January 1, 2011 with Pb monitoring beginning January 1, The Kahului station began PM2.5 monitoring in January 2015 with SO2, NO2, and CO monitoring anticipated to begin by summer The Niumalu station began operating on April 1, 2011, monitoring for PM2.5, SO2 and NO2.
36 2010 Assessment Recommendation Establish a station on the Waianae coast of Oahu for environmental justice concerns Establish a new Kailua, Oahu station monitoring for PM2.5 Close the West Beach, Oahu station Move the Kihei, Maui station due to potential development of the area. Close the Sand Island, Oahu station. Implementation DoH decided not to establish a new station on the Waianae coast but instead rely on three existing ambient air monitoring stations operated by HECO, Oahu s utility company. These stations began operating in April 2009 and the data is publicly available on the internet. The three stations monitor for CO, SO2, NO2, O3 and PM2.5. Due to resource and budget limitations, a new PM2.5 site will not be established. PM2.5 is the most monitored pollutant in the state with 13 monitors statewide and it was decided that another PM2.5 site was not currently required. The station was closed on 3/31/2011. Development plans have not progressed. The Kihei station will remain at its current location. Originally, the idea to close the station was due to its close proximity to a large source of NO2 and a large body of water, potentially providing O3 interference. Also, since the NCore station would monitor for O3, and the MSA only requires one O3 monitor, Sand Island s O3 monitor would not be needed. However, since then, several things have happened: the nearby HECO Honolulu facility has been deactivated; the O3 monitor at the NCore station has been very unreliable; and, the O3 NAAQS is being reviewed, so it is an inadvisable time to be closing monitors. Summary of 2015 Assessment Findings 1. Merge the Kapolei SLAMS and Kapolei NCore stations: The SLAMS station began operating at the current location in 2002 monitoring for CO, SO2, NO2, PM10 and PM2.5; In 2011, the state s required NCore station began operating at this site monitoring for the NCore parameters CO (trace), SO2 (trace), NO/NOy, O3, PM2.5, PM10, PM10-2.5, WS/WD, ambient temperature, relative humidity and Pb (beginning in 2012); These stations operate side-by-side and CO monitoring at the SLAMS station can be discontinued after ensuring that all requirements in 40 CFR are met; Discussions will be initiated with EPA on merging the SLAMS with the NCore stations provided the following are incorporated: o SO2 monitoring must be able to capture any potential releases from the nearby industrial park. Since the NCore station monitor is spanned for trace SO2, either a dual-range monitor or two SO2 monitors will be required; o Continue NO2 monitoring. 2. Establish the near-road NO2 station: The site has been selected near the roadway on Oahu with the highest Annual Average Daily Traffic (AADT); Establish the station by the end of 2015 or early 2016 prior to the required start date of January 1, 2017 as a SPMS to gather preliminary data and ensure that the monitor is operating properly; Include details of the station in the 2015 Annual Network Plan; 32 P a g e
37 Continue to track the population of the Oahu MSA as it approaches one million residents. If the population reaches or exceeds one million, CO and PM2.5 monitoring will need to be added. Install a 10 meter meteorological tower at the Sand Island station to better characterize the formation of O3 from sources originating in downtown Honolulu. Continue cruise ship monitoring on Kauai for at least one year: When monitoring began at the Niumalu station, there were exceedances of the 1hour SO2 NAAQS and increased concentrations when ships were in port; In August 2012, the first reduction in fuel sulfur content became effective for ocean going ships operating within the ECA. This sulfur limit was established at 10,000 ppm (1%). There was a corresponding decrease in ambient SO2 concentrations and no exceedances; In January 2015, the second fuel sulfur reduction became effective. Ocean going vessels operating within the ECA are now required to use fuel with a sulfur content of no more than 1,000 ppm (0.1%); Continue to collect and analyze data from the Niumalu station for a minimum of one-year. If the data shows significant reduction in SO2, consult with the community on closing or moving the station; If resources allow, consider moving the station to the population centers of Lihue or Kapaa which is listed as a micropolitan statistical area. Establish two new stations to monitor for SO2 to satisfy the requirements of the Data Requirement Rule: The affected facilities are anticipated to be the HECO Kahe electrical generating facility, Kalaeloa Power Partners and AES Hawaii all located in West Oahu and HECO Waiau electrical generating facility in Central Oahu; Utilize a private/public partnership with HECO in establishing, operating, and maintaining these two stations; Preliminary SO2 modeling indicate suitable monitoring sites are located in areas that already have a HECO operated monitoring station or is on their easement property; Start discussions with EPA to ensure that the anticipated timeline for the Data Requirements Rule is met. Research alternative continuous PM2.5 monitors having little consumable costs and if one is found that meets monitoring needs, begin replacing the Met-One BAMS as they breakdown while ensuring that all collocation requirements are met. 33 P a g e
State of Hawaii 2015 Air Monitoring Network Plan
 State of Hawaii 205 Air Monitoring Network Plan Submitted to the U.S. EPA Region 9 July, 205 Prepared by: State of Hawaii Department of Health Environmental Management Division Clean Air Branch and State
1 Excluding Native American and Pueblo Lands within the County.
 Albuquerque Environmental Health Department (EHD) Air Quality Programs (AQP) Ambient Air Monitoring Section 2016 Annual Network Review for Ambient Air Monitoring Under 40 CFR, Part 58, Subpart B, The City
2015 Annual Monitoring Network Plan
 Texas Commission on Environmental Quality 2015 Annual Monitoring Network Plan P.O. Box 13087, Austin, Texas 78711-3087 Table of Contents List of Appendices... 2 List of Tables... 2 2015 ANNUAL MONITORING
Massachusetts 2014 Air Monitoring Network Plan
 Massachusetts 2014 Air Monitoring Network Plan Air Assessment Branch Bureau of Waste Prevention August 28, 2014 This information is available in alternate format. Call Michelle Waters-Ekanem, Diversity
Ambient Air Monitoring Work plan For National Core (NCore) Monitoring Station
 Monitoring Station") Ambient Air Monitoring Work plan For National Core (NCore) Monitoring Station CBSA Louisville-Jefferson County KY-IN MSA Louisville Metro Air Pollution Control District 850 Barret Avenue Louisville, KY
Ambient Air Monitoring Work plan For National Core (NCore) Monitoring Station CBSA Louisville-Jefferson County KY-IN MSA Louisville Metro Air Pollution Control District 850 Barret Avenue Louisville, KY
Annual Air Monitoring Network Plan. For. Santa Barbara County. July 2012
 Annual Air Monitoring Network Plan For Santa Barbara July 2012 Prepared by the Santa Barbara Air Pollution Control District Section Annual Air Monitoring Network Plan for Santa Barbara Table of Contents
2015 Ambient Air Monitoring Network Plan
 2015 Ambient Air Monitoring Network Plan Planning, Monitoring and Outreach Division July 2015 Final Draft Table of Contents Introduction... 4 General Information on Air Monitoring Networks... 5 SLAMS Air
AIR QUALITY MONITORING NETWORK PLAN
 STATE OF MONTANA AIR QUALITY MONITORING NETWORK PLAN May 2015 Montana Department of Environmental Quality Air Quality Bureau 1520 East 6 th Ave Helena, MT 59601 Contents Introduction... 3 I. Ambient Air
525 Camino de los Marquez, Suite I Santa Fe, New Mexico, 87505 Phone (505) 476-4300 Fax (505) 476-4375. www.nmenv.state.nm.us
 476-4300 Fax (505) 476-4375. www.nmenv.state.nm.us") SUSANA MARTINEZ Governor JOHN A. SANCHEZ Lieutenant Governor 525 Camino de los Marquez, Suite I Santa Fe, New Mexico, 87505 Phone (505) 476-4300 Fax (505) 476-4375 www.nmenv.state.nm.us RYAN FLYNN Cabinet
SUSANA MARTINEZ Governor JOHN A. SANCHEZ Lieutenant Governor 525 Camino de los Marquez, Suite I Santa Fe, New Mexico, 87505 Phone (505) 476-4300 Fax (505) 476-4375 www.nmenv.state.nm.us RYAN FLYNN Cabinet
State of Arizona Air Monitoring Network Plan
 State of Arizona Air Monitoring Network Plan For the Year 22 Arizona Department of Environmental Quality Air Quality Division Air Assessment Section Final August, 22 Table of Contents. INTRODUCTION...4
2016 Delaware Ambient Air Monitoring Network Description for Criteria Pollutants
 2016 Delaware Ambient Air Monitoring Network Description for Criteria Pollutants Division of Air Quality Department of Natural Resources and Environmental Control 715 Grantham Lane New Castle, DE 19720
Annual Monitoring Network Plan Report
 Annual Monitoring Network Plan Report June 2015 Clark County Department of Air Quality 4701 W. Russell Road, Suite 200 Las Vegas, Nevada 89118 Executive Summary This document reports the status of the
Connecticut Department of Energy and Environmental Protection
 Connecticut Department of Energy and Environmental Protection Connecticut s 1-Hour Sulfur Dioxide (SO 2 ) NAAQS Analysis and Management Strategy April 24, 2013 R/S/L Modelers Work Shop Dallas, TX Sam Sampieri
Iowa Ambient Air Monitoring 2013 Network Plan. Air Quality Bureau Iowa Department of Natural Resources
 Iowa Ambient Air Monitoring 2013 Network Plan Air Quality Bureau Iowa Department of Natural Resources Table of Contents Table of Contents 2 Introduction 3 Ozone Monitoring Network Analysis 3 PM 2.5 Monitoring
Ambient Air Monitoring Work Plan National Core (NCore) Monitoring Station
 Monitoring Station") Ambient Air Monitoring Work Plan National Core (NCore) Monitoring Station Hamilton County, Ohio MSA Hamilton County Department of Environmental Services 250 William Howard Taft Rd Cincinnati, OH 45219
Ambient Air Monitoring Work Plan National Core (NCore) Monitoring Station Hamilton County, Ohio MSA Hamilton County Department of Environmental Services 250 William Howard Taft Rd Cincinnati, OH 45219
Smoke Management Plan
 Smoke Management Plan December 2007 TABLE OF CONTENTS 1.0 Introduction 3 2.0 Background 6 3.0 Smoke Management Plan 7 3.1 Authorization to Burn 10 3.2 Minimizing Air Pollutant Emissions 11 3.3 Smoke Management
2014 Annual Monitoring Network Plan
 Texas Commission on Environmental Quality 2014 Annual Monitoring Network Plan P.O. Box 13087, Austin, Texas 78711-3087 Table of Contents 2014 ANNUAL MONITORING NETWORK PLAN... 3 INTRODUCTION... 3 TCEQ
2015 Annual Network Plan and Assessment For Ambient Air Monitoring
 North Coast Unified Air Quality Management District 2015 Annual Network Plan and Assessment For Ambient Air Monitoring July 1, 2015 North Coast Unified Air Quality Management District 707 L Street, Eureka,
STATE OF NEW HAMPSHIRE STATE IMPLEMENTATION PLAN REVISION
 STATE OF NEW HAMPSHIRE STATE IMPLEMENTATION PLAN REVISION CARBON MONOXIDE LIMITED MAINTENANCE PLAN for the THE CITY OF MANCHESTER AND THE CITY OF NASHUA CARBON MONOXIDE MAINTENANCE AREAS August 1, 2012
Commonwealth of Puerto Rico/ Office of the Governor Puerto Rico Environmental Quality Board. Puerto Rico Air Monitoring Network Plan
 Commonwealth of Puerto Rico/ Office of the Governor Puerto Rico Environmental Quality Board Puerto Rico Air Network Plan Puerto Rico Air Network Plan 2014 Table of Contents LIST OF FIGURES... 4 ACRONYMS
--------------------------------------------------------------------------------------------------------------------- Technical Support Document
 --------------------------------------------------------------------------------------------------------------------- ---------------------------------------------------------------------------------------------------------------------
Missouri Department of Natural Resources Air Pollution Control Program 2015 Monitoring Network Plan
 Missouri Department of Natural Resources Air Pollution Control Program 2015 Monitoring Network Plan July 27, 2015 TABLE OF CONTENTS SUMMARY OF PROPOSED CHANGES... 3 HOW TO MAKE PUBLIC COMMENTS CONCERNING
Pinal County Air Quality Control District. 2015 Ambient Monitoring Network 5-Year Assessment
 Pinal County Air Quality Control District 2015 Ambient Monitoring Network 5-Year Assessment June, 2015 Pinal County Air Quality 31 N. Pinal St., Bldg. F P.O. Box 987 Florence AZ, 85132 (520) 866-6929 www.pinalcountyaz.gov
Rhode Island 2015 Annual Monitoring Network Plan. And. Five-Year Network Assessment
 STATE OF RHODE ISLAND AND PROVIDENCE PLANTATIONS DEPARTMENT OF ENVIRONMENTAL MANAGEMENT OFFICE OF AIR RESOURCES Rhode Island 2015 Annual Monitoring Network Plan And Five-Year Network Assessment Posted
Air Quality Monitoring Group. 2015 Annual Monitoring Network Plan Mecklenburg County Air Quality
 Air Quality Monitoring Group 2015 Annual Monitoring Network Plan Mecklenburg County Air Quality Mecklenburg County Air Quality A Division of the Mecklenburg County Land Use and Environmental Services Agency
Input welcomed on District of Columbia s 2008 Ambient Air Monitoring Network Plan
 Input welcomed on District of Columbia s 2008 Ambient Air Monitoring Network Plan The U.S. Environmental Protection Agency (EPA) revised ambient air monitoring regulations in 2006. The requirements are
2012 Annual Monitoring Network Plan for Mississippi
 2012 Annual Monitoring Network Plan for Mississippi The MDEQ Air Division is receiving comments on the 2012 Annual Monitoring Network Plan until June 30 th. Please address comments to: Michael_Jordan@deq.state.ms.us
FLORIDA S OZONE AND PARTICULATE MATTER AIR QUALITY TRENDS
 FLORIDA S OZONE AND PARTICULATE MATTER AIR QUALITY TRENDS Florida Department of Environmental Protection Division of Air Resource Management December 2012 Various pollutants are found in the air throughout
OFR-15-05 State of Arizona Air Monitoring Network Plan
 OFR-15-05 State of Arizona Air Monitoring Network Plan For the Year 2015 Arizona Department of Environmental Quality Air Quality Division Air Assessment Section July 1, 2015 Final State of Arizona Air
Technical Support Document For The May 2, 2008 Exceptional Event
 Technical Support Document For The May 2, 2008 Exceptional Event Prepared by the Technical Services Program Air Pollution Control Division June 9, 2009 2 Table of Contents: 1.0 Introduction... 4 2.0 Ambient
FACT SHEET PROPOSED REVISIONS TO THE NATIONAL AMBIENT AIR QUALITY STANDARDS FOR SULFUR DIOXIDE
 FACT SHEET PROPOSED REVISIONS TO THE NATIONAL AMBIENT AIR QUALITY STANDARDS FOR SULFUR DIOXIDE SUMMARY OF ACTION o On November 16, 2009, EPA proposed to strengthen the National Ambient Air Quality Standard
Rhode Island 2014 Annual Monitoring Network Plan
 STATE OF RHODE ISLAND AND PROVIDENCE PLANTATIONS DEPARTMENT OF ENVIRONMENTAL MANAGEMENT OFFICE OF AIR RESOURCES Rhode Island 2014 Annual Monitoring Network Plan Posted for Public Review on June 25, 2014
EPA Can Strengthen Its Reviews of Small Particle Monitoring in Region 6 to Better Ensure Effectiveness of Air Monitoring Network
 U.S. ENVIRONMENTAL PROTECTION AGENCY OFFICE OF INSPECTOR GENERAL Air Quality EPA Can Strengthen Its Reviews of Small Particle Monitoring in Region 6 to Better Ensure Effectiveness of Air Monitoring Network
Geothermal: The Clean Energy Secret May 7, 2008
 Geothermal: The Clean Energy Secret May 7, 2008 Published by Dr. Patrick Moore in conjunction with the New York Affordable Reliable Electricity Alliance (New York AREA) Geothermal: The Clean Energy Secret
Exhaust Emissions from Ship Engines in Australian Waters Including Ports
 Exhaust Emissions from Ship Engines in Australian Waters Including Ports Laurie Goldsworthy Honorary Research Fellow National Centre for Maritime Engineering and Hydrodynamics Australian Maritime College
UTAH STATE IMPLEMENTATION PLAN SECTION IV AMBIENT AIR MONITORING PROGRAM
 UTAH STATE IMPLEMENTATION PLAN SECTION IV AMBIENT AIR MONITORING PROGRAM Adopted by the Utah Air Quality Board December 18, 1992 UTAH STATE IMPLEMENTATION PLAN SECTION IV AMBIENT AIR MONITORING PROGRAM
California Standards Grades 9 12 Boardworks 2009 Science Contents Standards Mapping
 California Standards Grades 912 Boardworks 2009 Science Contents Standards Mapping Earth Sciences Earth s Place in the Universe 1. Astronomy and planetary exploration reveal the solar system s structure,
Missouri Department of Natural Resources Air Pollution Control Program 2013 Monitoring Network Plan
 Missouri Department of Natural Resources Air Pollution Control Program 2013 Monitoring Network Plan May 23, 2013 TABLE OF CONTENTS SUMMARY OF PROPOSED CHANGES... 3 INTRODUCTION... 4 CURRENT AMBIENT AIR
Annual Report on the Air Resources Board s Fine Particulate Matter Monitoring Program
 Annual Report on the Air Resources Board s Fine Particulate Matter Monitoring Program January 2014 California Environmental Protection Agency Air Resources Board State of California California Environmental
Climate of Illinois Narrative Jim Angel, state climatologist. Introduction. Climatic controls
 Climate of Illinois Narrative Jim Angel, state climatologist Introduction Illinois lies midway between the Continental Divide and the Atlantic Ocean, and the state's southern tip is 500 miles north of
Winter Air Quality in Yellowstone National Park 2006-2007
 National Park Service U.S. Department of the Interior Natural Resource Program Center Winter Air Quality in Yellowstone National Park 26-27 Natural Resource Report NPS/NRPC/ARD/NRTR--27/65 ON THE COVER
AMBIENT AIR MONITORING NETWORK PLAN STATE OF NEVADA DIVISION OF ENVIRONMENTAL PROTECTION BUREAU OF AIR QUALITY PLANNING
 AMBIENT AIR MONITORING NETWORK PLAN 2015 STATE OF NEVADA DIVISION OF ENVIRONMENTAL PROTECTION BUREAU OF AIR QUALITY PLANNING Contact: Daren Winkelman Ambient Monitoring Program Bureau of Air Quality Planning
NEW YORK STATE IMPLEMENTATION PLAN FOR THE INFRASTRUCTURE ASSESSMENT FOR NITROGEN DIOXIDE UNDER SECTIONS 110(a)(1) AND (2) OF THE CLEAN AIR ACT
(1) AND (2) OF THE CLEAN AIR ACT") Department of Environmental Conservation Division of Air Resources Joe Martens Commissioner NEW YORK STATE IMPLEMENTATION PLAN FOR THE INFRASTRUCTURE ASSESSMENT FOR NITROGEN DIOXIDE UNDER SECTIONS 110(a)(1)
Department of Environmental Conservation Division of Air Resources Joe Martens Commissioner NEW YORK STATE IMPLEMENTATION PLAN FOR THE INFRASTRUCTURE ASSESSMENT FOR NITROGEN DIOXIDE UNDER SECTIONS 110(a)(1)
Population Density, Traffic Density and Nitrogen Oxides (NOx) Emission Air Pollution Density in Major Metropolitan Areas of the United States
 Emission Air Pollution Density in Major Metropolitan Areas of the United States") Population Density, Traffic Density and Nitrogen Oxides (NOx) Emission Air Pollution Density in Major Metropolitan Areas of the United States This report summarizes the latest Environmental Protection
Population Density, Traffic Density and Nitrogen Oxides (NOx) Emission Air Pollution Density in Major Metropolitan Areas of the United States This report summarizes the latest Environmental Protection
GUIDANCE DOCUMENT ON AIR ZONE MANAGEMENT PN 1481 978-1-896997-89-6 PDF
 GUIDANCE DOCUMENT ON AIR ZONE MANAGEMENT PN 1481 978-1-896997-89-6 PDF Canadian Council of Ministers of the Environment, 2012 The Canadian Council of Ministers of the Environment (CCME) is the primary,
Oil and Gas Air Quality Regulations and Permitting
 Oil and Gas Air Quality Regulations and Permitting Adam Berig Olsson Associates Colorado Springs Oil and Gas Committee Presentation February 2012 Who Regulates Air Quality? United States Environmental
Great Basin Unified Air Pollution Control District DRAFT. 2010 Ambient Air Monitoring Network Plan
 Great Basin Unified Air Pollution Control District DRAFT 2010 Ambient Air Monitoring Network Plan April 16, 2010 Prepared by Christopher Lanane Air Monitoring Specialist Great Basin Unified Air Pollution
State of Kansas. 2012 2013 Ambient Air Monitoring Network Plan
 State of Kansas 2012 2013 Ambient Air Monitoring Network Plan Department of Health and Environment Division of Environment Bureau of Air (785) 296-6024 TABLE OF CONTENTS Air Monitoring... 3 National Monitoring
Assessment of Air Emissions Martin Marietta Materials Facilities on Highway 34, Weld County, Colorado Project No.: 4572.003
 April 1, 2015 Mr. James Sharn 10170 Church Ranch Way, Suite 201 Westminster, Colorado 80021 Subject: Assessment of Air Emissions Facilities on Highway 34, Weld County, Colorado Project No.: 4572.003 Dear
FAC 7.1: Generators. EPA Impacts on Emergency Gensets for 2015 Installations
 FAC 7.1: Generators EPA Impacts on Emergency Gensets for 2015 Installations Speaker: Bob Stelzer, CTO Safety Power Inc bob.stelzer@safetypower.ca Speaker: Randy Sadler, SME, Safety Power Inc. randy.sadler@safetypower.ca
The Regulatory Role of Chemical Mechanisms and Future Needs
 The Regulatory Role of Chemical Mechanisms and Future Needs Ajith Kaduwela Planning and Technical Support Division Air Resources Board California Environmental Protection Agency Department of Land, Air
How To Monitor A Site
 Division of Air Quality 601 57 th Street, SE Charleston, WV 25304 Earl Ray Tomblin, Governor Randy C. Huffman, Cabinet Secretary www.wvdep.org 2013 Ambient Air Monitoring Network Design On 17, 2006, the
CLIMATE, WATER & LIVING PATTERNS THINGS
 CLIMATE, WATER & LIVING PATTERNS NAME THE SIX MAJOR CLIMATE REGIONS DESCRIBE EACH CLIMATE REGION TELL THE FIVE FACTORS THAT AFFECT CLIMATE EXPLAIN HOW THOSE FACTORS AFFECT CLIMATE DESCRIBE HOW CLIMATES
Rationale for Development of Mobile Monitoring Technologies for Paved Roads
 Rationale for Development of Mobile Monitoring Technologies for Paved Roads Workshop on Standardization of Open Source Test Methods November 17, 2010 Rodney Langston Clark County, Nevada 1 Open Sources
Great Basin Unified Air Pollution Control District. 2015 Annual Air Quality Monitoring Network Plan
 Great Basin Unified Air Pollution Control District 2015 Annual Air Quality Monitoring Network Plan February 13, 2015 Prepared by Christopher Lanane Air Monitoring Specialist Great Basin Unified Air Pollution
2014 Ambient Air Monitoring Five Year Network Assessment & Plan
 2014 Ambient Air Monitoring Five Year Network Assessment & Plan Pima County Department of Environmental Quality 30 North Stone, Suite 700 Tucson, Arizona 85701 AQ 388 2014 Ambient Air Monitoring Five Year
MAC-ENC-PRO-057 AIR QUALITY MONITORING PROGRAM
 MAC-ENC-PRO-057 AIR QUALITY MONITORING Document Owner Donna McLaughlin, Environment Superintendent Document Approver Rob Hayes, Manager Environment Revision History Version No. Date Published Details 1.2
EPA Requirements for Diesel Standby Engines In Data Centers. Bob Stelzer / CTO / Safety Power Inc. For 7x24 Fall 2014 Conference. 1.
 EPA Requirements for Diesel Standby Engines In Data Centers Bob Stelzer / CTO / Safety Power Inc For 7x24 Fall 2014 Conference 1.0 Introduction In order to get the Air Emissions Permit for facilities that
National Environment Protection (Ambient Air Quality) Measure
 Measure") National Environment Protection (Ambient Air Quality) as amended made under section 20 of the National Environment Protection Council Act 1994 (Cwlth), National Environment Protection Council (New South
National Environment Protection (Ambient Air Quality) as amended made under section 20 of the National Environment Protection Council Act 1994 (Cwlth), National Environment Protection Council (New South
Wyoming Ambient Air Monitoring Annual Network Plan 2015. Photo from Website Camera at Wamsutter Monitoring Site
 Wyoming Ambient Air Monitoring Annual Network Plan 2015 Photo from Website Camera at Wamsutter Monitoring Site TABLE OF CONTENTS 1.0 Introduction... 2 1.1 The AQD Monitoring History... 2 1.2 General Monitoring
Alaska Department of Environmental Conservation. Annual Air Quality Monitoring Network Plan. May 2015 Public Notice Draft. Air Quality Division
 Alaska Department of Environmental Conservation Air Quality Division Air Monitoring & Quality Assurance Program 619 E. Ship Creek Ave. #249 Anchorage, AK 99501 Phone: (907) 269-7577 Fax: (907) 269-7508
Network Monitoring Plan. Executive Summary
 Network Monitoring Plan Executive Summary January, 2014 BACKGROUND Historically, Fort Air Partnership s (FAP) primary monitoring objective was to ensure compliance with regulatory monitoring requirements
AIR QUALITY TECHNICAL MEMORANDUM
 AIR QUALITY TECHNICAL MEMORANDUM AIR QUALITY TECHNICAL MEMORANDUM GOLDEN GLADES INTERCHANGE PD&E STUDY Miami-Dade County, Florida Financial Management Number: 428358-1-22-01 Efficient Transportation Decision
The Benefits and Costs of the Clean Air Act from 1990 to 2020
 The Benefits and Costs of the Clean Air Act from 1990 to 2020 U.S. Environmental Protection Agency Office of Air and Radiation March 2011 S U M M A R Y R E P O R T Acknowledgements The study was led by
The Pennsylvania Observer
 The Pennsylvania Observer August 3, 2009 July 2009 - Pennsylvania Weather Recap Written by: Dan DePodwin After a cool month of June, some hoped July would bring usual summertime warmth to the state of
August 2, 2012 RESPONSES TO FREQUENTLY ASKED QUESTIONS CONCERNING ELECTRICITY RATES AND OIL PRICES
 NEIL ABERCROMBIE GOVERNOR HERMINA M. MORITA CHAIR MICHAELE. CHAMPLEY COMMISSIONER LORRAINE H. AKIBA COMMISSIONER Telephone: (808) 586-2020 Facsimile: (808) 586-2066 e-mail: Hawaii.PUC@hawaii.gov STATE
Connecticut 2013 Annual Air Monitoring Network Plan
 Connecticut 2013 Annual Air Monitoring Network Plan Connecticut Department of Energy and Environmental Protection Bureau of Air Management August 5, 2013 The Department of Energy and Environmental Protection
2014-2015 Air Monitoring Network Plan. City of Philadelphia Department of Public Health Air Management Services
 2014-2015 Air Monitoring Network Plan City of Philadelphia Department of Public Health Air Management Services July 1, 2014 Executive Summary Philadelphia has an air monitoring network of ten air monitoring
What Causes Climate? Use Target Reading Skills
 Climate and Climate Change Name Date Class Climate and Climate Change Guided Reading and Study What Causes Climate? This section describes factors that determine climate, or the average weather conditions
Utah Air Quality Monitoring Network Five-year Network Assessment
 Utah Air Quality Monitoring Network Five-year Network Assessment State of Utah GARY R. HERBERT Governor SPENCER J. COX Lieutenant Governor Utah Division of Air Quality Air Monitoring Section June 2015
How to Achieve improvements in GHG Regulation
 1 Cost effective, common sense approaches to GHG regulation, leading to technology improvements. Implementation and measurement will happen at the regional level, especially for stationary sources and
AIR TRAFFIC INITIAL ENVIRONMENTAL REVIEW
 AIR TRAFFIC INITIAL ENVIRONMENTAL REVIEW Operational Test Period #2 to Evaluate the Feasibility of Changing Runway Configurations at Two Times during the Day at Boston-Logan Airport FAA Order 7400.2 Appendix
Comparison of PM10 and SO 2 Concentrations in the Cities Located at the Mediterranean Coast of Turkey
 Comparison of PM10 and SO 2 Concentrations in the Cities Located at the Mediterranean Coast of Turkey *Güray Doğan, Ahmet Tepe and Çiğdem Moral Akdeniz University, Department of Environmental Engineering,
Vermont Annual Air Monitoring Network Plan 2014
 Vermont Annual Air Monitoring Network Plan 2014 Vermont Department of Environmental Conservation Air Quality & Climate Division December 31, 2014 Page 2 of 45 Table of Contents Section Page Number Table
Review 1. Multiple Choice Identify the choice that best completes the statement or answers the question.
 Review 1 Multiple Choice Identify the choice that best completes the statement or answers the question. 1. When hydrogen nuclei fuse into helium nuclei a. the nuclei die. c. particles collide. b. energy
7613-1 - Page 1. Weather Unit Exam Pre-Test Questions
 Weather Unit Exam Pre-Test Questions 7613-1 - Page 1 Name: 1) Equal quantities of water are placed in four uncovered containers with different shapes and left on a table at room temperature. From which
AMBIENT AIR MONITORING NETWORK PLAN STATE OF NEVADA DIVISION OF ENVIRONMENTAL PROTECTION BUREAU OF AIR QUALITY PLANNING
 AMBIENT AIR MONITORING NETWORK PLAN 2013 STATE OF NEVADA DIVISION OF ENVIRONMENTAL PROTECTION BUREAU OF AIR QUALITY PLANNING Contact: Daren Winkelman Ambient Monitoring Program Bureau of Air Quality Planning
Earth Sciences -- Grades 9, 10, 11, and 12. California State Science Content Standards. Mobile Climate Science Labs
 Earth Sciences -- Grades 9, 10, 11, and 12 California State Science Content Standards Covered in: Hands-on science labs, demonstrations, & activities. Investigation and Experimentation. Lesson Plans. Presented
Alaska Department of Environmental Conservation. Annual Air Quality Monitoring Network Plan. May 21, 2013 Public Comment Draft. Air Quality Division
 Alaska Department of Environmental Conservation Air Quality Division Air Monitoring & Quality Assurance Program 619 E. Ship Creek Ave. #249 Anchorage, AK 99501 Phone: (907) 269-7577 Fax: (907) 269-7508
Louisville, Kentucky-Indiana Area Designations for the 2012 Primary Annual PM2.5 National Ambient Air Quality Standards Technical Support Document
 Louisville, Kentucky-Indiana Area Designations for the 2012 Primary Annual PM2.5 National Ambient Air Quality Standards Technical Support Document 1.0 Summary In accordance with section 107(d) of the Clean
Site Identification No.: 197809AAO Application No.: 15030051
 Project Summary for a Construction Permit Application from Midwest Generation for a Natural Gas Conversion Project for the Joliet Electric Generating Station Joliet, Illinois Site Identification No.: 197809AAO
Natural Resources. Air and Water Resources
 Natural Resources Key Concepts Why is it important to manage air and water resources wisely? How can individuals help manage air and water resources wisely? Air and Water Resources What do you think? Read
Climate Change on the Prairie:
 Climate Change on the Prairie: A Basic Guide to Climate Change in the High Plains Region - UPDATE Global Climate Change Why does the climate change? The Earth s climate has changed throughout history and
Iowa Fine Particulate Monitoring Network Design Values 2011-2013. Iowa DNR Ambient Air Monitoring Group
 Iowa Fine Particulate Monitoring Network Design Values 2011-2013 Iowa DNR Ambient Air Monitoring Group What is Fine Particulate Matter (PM 2.5 )? The term particulate matter (PM) includes both solid particles
Arizona Climate Summary February 2015 Summary of conditions for January 2015
 Arizona Climate Summary February 2015 Summary of conditions for January 2015 January 2015 Temperature and Precipitation Summary January 1 st 14 th : January started off with a very strong low pressure
ATTAINMENT PROJECTIONS
 ATTAINMENT PROJECTIONS Modeling is required to assess monitored exceedances of the PM10 NAAQS at all sites that cause the District to be classified as nonattainment for the 24-hour standard. Modeling is
Changing Clouds in a Changing Climate: Anthropogenic Influences
 Changing Clouds in a Changing Climate: Anthropogenic Influences Joel Norris Assistant Professor of Climate and Atmospheric Sciences Scripps Institution of Oceanography Global mean radiative forcing of
Regents Questions: Plate Tectonics
 Earth Science Regents Questions: Plate Tectonics Name: Date: Period: August 2013 Due Date: 17 Compared to the oceanic crust, the continental crust is (1) less dense and more basaltic (3) more dense and
3.0 THE 2002 BASE-YEAR INVENTORY. 3.1 Background and requirements
 3.0 THE 2002 BASE-YEAR INVENTORY 3.1 Background and requirements The 2002 Base-Year Inventory is documented in details in Appendix B (2002 Base Year Emissions Inventory of PM2.5 Precursor Emissions for
2013 Ambient Air Monitoring Network Report
 2013 Ambient Air Monitoring Network Report Washington State Department of Ecology 300 Desmond Drive/PO Box 47600 Olympia, Washington 98504-7600 May 2013 Publication no. 13-02-007 Publication and Contact
Air Quality in San Diego 2013 Annual Report
 Air Pollution Control Board Greg Cox District 1 Dianne Jacob District 2 Dave Roberts District 3 Ron Roberts District 4 Bill Horn District 5 Air Quality in San Diego 2013 Annual Report Protecting and improving
PM Fine Database and Associated Visualization Tool
 PM Fine Database and Associated Visualization Tool Steven Boone Director of Information Technology E. H. Pechan and Associates, Inc. 3622 Lyckan Parkway, Suite 2002; Durham, North Carolina 27707; 919-493-3144
GEOTHERMAL HEAT PUMP SYSTEMS ARE RED HOT BUT ARE THEY REALLY GREEN?
 GEOTHERMAL HEAT PUMP SYSTEMS ARE RED HOT BUT ARE THEY REALLY GREEN? Richard C. Niess 1 Gilbert & Associates / Apogee Interactive, Inc., Gloucester Point, Virginia 23062 Phone & Fax (804) 642 0400 ABSTRACT
Geography affects climate.
 KEY CONCEPT Climate is a long-term weather pattern. BEFORE, you learned The Sun s energy heats Earth s surface unevenly The atmosphere s temperature changes with altitude Oceans affect wind flow NOW, you
Finding Ways to Postpone Climate Tipping Points Using Updated Metrics
 Finding Ways to Postpone Climate Tipping Points Using Updated Metrics Tobias Schultz, Manager of Environmental Sustainability Services Sustainable Silicon Valley Meet-Up July 7, 2015 SCS Global Services
AIR POLLUTION CONTROL PROGRAM MISSOURI AIR MONITORING NETWORK ASSESSMENT 2015
 AIR POLLUTION CONTROL PROGRAM MISSOURI AIR MONITORING NETWORK ASSESSMENT 2015 June 2015 1 2 CONTENTS EXECUTIVE SUMMARY...5 1.0 BACKGROUND AND INTRODUCTION...13 1.1 Regulatory Requirements...13 1.2 Assessment
Tracking Wildfire Smoke During the 2012 Idaho Smokepocalypse: Techniques and Lessons Learned
 Tracking Wildfire Smoke During the 2012 Idaho Smokepocalypse: Techniques and Lessons Learned } NW-AIRQUEST Annual Meeting, } June 7, 2013 Featherville, Idaho, during the Trinity Ridge fire, Summer 2012
A GUIDANCE NOTE ON THE BEST PRACTICABLE MEANS FOR ELECTRICITY WORKS BPM 7/1 (2014)
") A GUIDANCE NOTE ON THE BEST PRACTICABLE MEANS FOR ELECTRICITY WORKS (COAL-FIRED PLANT, GAS-FIRED GAS TURBINE, AND OIL-FIRED GAS TURBINE (PEAK LOPPING PLANT)) BPM 7/1 (2014) Environmental Protection Department
A GUIDANCE NOTE ON THE BEST PRACTICABLE MEANS FOR ELECTRICITY WORKS (COAL-FIRED PLANT, GAS-FIRED GAS TURBINE, AND OIL-FIRED GAS TURBINE (PEAK LOPPING PLANT)) BPM 7/1 (2014) Environmental Protection Department
Evaluating Ozone Control Programs in the Eastern United States: Focus on the NOx Budget Trading Program, 2004
 Evaluating Ozone Control Programs in the Eastern United States: Focus on the NOx Budget Trading Program, 2004 State and Local Information for EPA Region 6 Arkansas Louisiana U.S. Environmental Protection
Washington State Department of Ecology. Ambient Air Monitoring Network Report
 Washington State Department of Ecology 2009 Ambient Air Monitoring Network Report Washington State Department of Ecology 300 Desmond Drive/PO Box 47600 Olympia, Washington 98504-7600 Publication number: