Brocade Network Advisor Features Brief for Data Center Networks
|
|
|
- Benedict Richard
- 9 years ago
- Views:
Transcription
1 Brocade Network Advisor Features Brief for Data Center Networks Brocade Network Advisor is the industry s first unified management solution across data, storage, and converged networks. This document highlights Data Center management features within Brocade Network Advisor that simplify infrastructure management with the performance and scalability required in the world's leading data centers.

2 CONTENTS Contents... 2 Introduction... 5 What is Brocade Network Advisor?... 5 Brocade Network Advisor Highlights... 6 Brocade Network Advisor for the Data Center... 7 Brocade Network Advisor for Data Center SAN Networks... 7 Data Center Management Highlights... 7 Simplified Management for SAN and IP Networks... 8 Intelligent Dashboard and Easy-to-Use Interface... 8 Dashboard Tab Discovery SAN Tab Connectivity Map Master Log Performance Legend Minimap Views IP Tab IP Topology, L2 Topology, and VLAN Topology Connectivity Maps User Management Add/Modify User User Profile User Policies Roles and Privilege Management Areas of Responsibility (AORs) Event Management Master Log Event Actions Edit Event Actions SNMP Trap and Syslog Event Registration SNMP Trap Event Forwarding Syslog Event Forwarding Advanced Call Home Data Center SAN Management Performance Monitoring and Management Real-Time Performance Monitoring Historical Performance Monitoring Top Talkers End-to-End Monitor Support Brocade Network Advisor for Data Center Networks 2 of 80

3 User-Defined Performance Thresholds Marching Ants Zoning Zoning Impact Analysis Multiuser Zoning LSAN Zoning Configuration Management Virtual Fabrics Port Groups FCIP Management Support for Extension Platforms Virtualization Support Simplified HBA and CNA Management Fibre Channel over Ethernet (FCoE) Troubleshooting and Diagnostics Device Connectivity Troubleshooting Wizard Device Sharing Diagnosis Wizard Trace Route Wizard Failure Resolution for a FICON Merge (Cascaded FICON) Security and Encryption Secure Copy/Secure FTP Third-Party Key Management Support Integration with Leading Partner Orchestration and Management Tools Microsoft SCOM Management Pack Management Plug-In for VMware vcenter Deep Integration Between Brocade Network Advisor and IBM Management Products IBM Systems Director Integration IBM Tivoli Storage Productivity Center (TPC) Integration Data Center IP Management Discovery Discovered Tab Global Settings Tab Profiles Tab Group Management Product Group Examples Port Group Example Configuration Configuration Wizard Step 1 Configuration Step 2 Deployment Step 3 Summary Brocade Network Advisor for Data Center Networks 3 of 80
... 47 Security and Encryption... 47 Secure Copy/Secure FTP... 47 Third-Party Key Management Support.")
4 CLI Configuration Manager VLAN Manager Port VLAN Configuration (L2 VLAN) Protocol VLAN Configuration (L3 VLAN) STP and RSTP Configuration Virtual Interface IP Assignment MPLS Manager VLL Manager VPLS Manager Change Management Configuration Repository Product Configuration Tab Change Tracking Tab Configuration Snapshots Tab Configuration Policy Management Performance Monitoring and Management Adding Dashboard Monitors from Graphs SNMP-Based Monitoring SNMP Expression Troubleshooting Drill-Down sflow-based Monitoring Management Plug-In for VMware vcenter Brocade ADX Series Management VIP Server Manager GSLB Manager SSL Certificate Manager Appendix Brocade Network Advisor SAN Package Offerings Brocade Network Advisor IP Package Offerings Upgrade Paths System Requirements How to Obtain Brocade Network Advisor Maximizing Investments Brocade Network Advisor for Data Center Networks 4 of 80

5 INTRODUCTION What is Brocade Network Advisor? Today s IT organizations are under pressure to reduce costs, free up resources, and accelerate the introduction of private, public, and hybrid clouds for service delivery. Many are standardizing their operational processes and policies and are seeking ways to more proactively address availability and performance issues. During this transition, the network is increasingly becoming a focus area for reducing unexpected downtimes and ongoing operational costs, while also enabling greater IT and business agility. Brocade Network Advisor greatly simplifies daily operations while improving the performance and reliability of the overall Storage Area Network (SAN) and IP networking environment. This software management tool offers flexible and proactive SAN/IP network performance analysis, in addition to IP network configuration change deployment and monitoring for compliance. Brocade Network Advisor supports Fibre Channel SANs, including 16 Gbps platforms, Layer 2/3 IP networks (including those running Brocade VCS Fabric technology), wireless networks, application delivery networks, and Multiprotocol Label Switching (MPLS) networks for service providers. Brocade Network Advisor is the next-generation management platform, designed to address the current technology trends in the data center, such as virtualization, convergence, and cloud computing. With Brocade Network Advisor, organizations can reduce operational expenditures by leveraging the same management solution across different environments, including data center, enterprise campus, and service provider networks. This enables better coordination between storage and data networking administrators for provisioning, troubleshooting, and reporting. Similarly, organizations can manage wired and wireless enterprise campus networks within a single management application propagating security and access policies across the entire enterprise and immediately quarantining any malicious activity. Brocade Network Advisor is built upon the existing Brocade management solutions, leveraging the best of Brocade Data Center Fabric Manager (DCFM ) and Brocade IronView Network Manager (INM). This enables Brocade to protect customer investments with a smooth migration to Brocade Network Advisor from their current products. Brocade Network Advisor provides several key capabilities: Presents a customizable at-a-glance summary of all discovered Brocade devices and third-party IP devices, including inventory and event summary information used to proactively identify problem areas and help prevent network downtime (see Figure 1). Enables performance management by providing customizable dashboards and historical data visibility. Supports the needs of different network teams by providing full Role-Based Access Control (RBAC). Supports troubleshooting use cases with rapid navigation to identify problem areas. Provides VMware vcenter and Microsoft System Center Operations Manager (SCOM) virtual infrastructure administrators with visibility into SAN and IP networks. Provides network administrators with visibility into VMware Virtual Machines (VMs). Provides comprehensive SAN management features, such as firmware management and technical supportsave via Secure File Transfer Protocol (SFTP)/Secure Copy (SCP), bottleneck detection, increased scale per Brocade Network Advisor instance, SFP historical trending support, FICON Port Decommissioning Boot Logical Unit Number (LUN) zoning, bulk port configuration, and reporting for adapters. Provides comprehensive IP management features, such as VCS fabric management, CLI Manager parameterization, customizable configuration policy management, IP telemetry configuration support for Brocade MLX Policy-Based Routing (PBR), and unified management for campus wired and wireless networks. Enables management of MPLS services. Manages Brocade application delivery switches, Virtual IP (VIP), Secure Sockets Layer (SSL) certificates, and Global Server Load Balancing (GSLB). Brocade Network Advisor for Data Center Networks 5 of 80

6 Brocade Network Advisor Highlights Reduces Total Cost of Ownership (TCO) by providing proactive performance and troubleshooting capabilities across SANs and IP networks. Simplifies operations by enabling standardized network configuration policies. Accelerates data center automation through enhanced support for Brocade VCS Fabric technology. Centralizes campus network management of both wired and wireless networks by providing a unified management interface. Integrates seamlessly with industry-leading hypervisors and management solutions from Microsoft, VMware, EMC, HP, and IBM, maximizing the value of IT investments. Brocade Network Advisor simplifies virtual, cloud, and physical infrastructure management with the performance and scalability required in the world s leading dynamic data centers. This document highlights some of the key features that help users easily manage their SAN IP data center network environment. Brocade Network Advisor for Data Center Networks 6 of 80

7 Brocade Network Advisor for the Data Center As a trusted data center infrastructure partner, Brocade is helping organizations worldwide transform their data centers to reach the next level of performance, scalability, end-to-end connectivity, and ease of use. Our products and services help organizations scale their infrastructure to manage and protect their digital data assets, improve the performance of the applications that create business value, and ensure that users and applications are always connected to their data. From this vantage point in the data center environment, it is our mission and responsibility to build and support a data center fabric connecting users and applications to their data. For data center administrators looking to simplify their network management and to consolidate tools for their virtual, cloud, or physical infrastructure, Brocade Network Advisor delivers the industry s only comprehensive unified easy-to-use management application across Brocade SAN and IP networks with end-to-end network visibility from a single application. The Brocade data center architecture provides a blueprint for building a costeffective data center with products, services, and partner alliances that reduce the complexity of connecting, accessing, protecting, migrating, and storing data for applications and users. As demand for administrative resources continues to rise, Brocade Network Advisor provides time-saving tools that help automate repetitive tasks through the use of intuitive wizards. Using Brocade Network Advisor, organizations can automatically discover Brocade IP switches and routers, application delivery switches, and SAN and Fibre Channel over Ethernet (FCoE) switches. In addition, IT administrators can easily configure and deploy group policies and archive configurations, all of which greatly reduce administration overhead and simplify management. Brocade Network Advisor for Data Center SAN Networks The comprehensive data center SAN fabric management features of Brocade Network Advisor include configuring, monitoring, and managing the Brocade DCX Backbone, as well as Brocade directors, routers, switches, Host Bus Adapters (HBAs), and Converged Network Adapters (CNAs). Brocade Network Advisor also helps organizations discover, monitor, and manage converged FCoE network environments. In addition, Brocade Network Advisor provides comprehensive Layer 2 configuration, with easy-to-use Data Center Bridging (DCB) interface administration, FCoE port and trunk configurations, and Quality of Service (QoS). Data Center Management Highlights Configuration, monitoring, and optimization of Fibre Channel over IP (FCIP) tunnels across WAN links, including support for the Brocade 7800 Extension Switch and Brocade FX8-24 Extension Blade Comprehensive support for Fibre Channel routing, including configuration, zoning, visualization, analysis, and troubleshooting tools Unified data center fabric management, which extends scope of management from individual switches and directors to pools of physical servers and storage that leverage data center virtualization technologies An intuitive interface to help manage virtualized network environments Simplified management of physical and virtual data center infrastructure, to expose policy-based fabric services such as Adaptive Networking and data-at-rest encryption services Open standards interfaces that simplify integration with Brocade server, storage, and infrastructure management partner frameworks: VMware vcenter, Microsoft SCOM, and IBM Tivoli/Systems Director Advanced replication capabilities that enable organizations to capture, back up, and compare switch configuration profiles The ability to edit zone information and preview its impact without affecting production fabrics FICON and cascaded FICON environment configuration and management along with powerful analysis and diagnostic facilities Brocade Network Advisor for Data Center Networks 7 of 80

8 SIMPLIFIED MANAGEMENT FOR SAN AND IP NETWORKS Built on a standards-based architecture, Brocade Network Advisor manages thousands of devices across different types of environments. Organizations can reduce operational expenditures by leveraging the same tool in different deployment scenarios or for future network expansion needs in other parts of the enterprise. The Brocade Network Advisor unified management features for both storage and IP networks include: Intelligent, customizable dashboard and easy-to-use interface. The dashboard presents an at-a-glance summary of all discovered Brocade devices and third-party IP devices, including inventory and event summary information used to identify problem areas and help prevent network downtime. In addition to the dashboard, the Brocade User Interface (UI) team delivered a consistent and intuitive user experience across the entire interface. User management. Allows flexible definitions of administrator roles and responsibilities with RBAC for both SAN and IP management. Event management. The powerful Event Manager helps troubleshoot network-related issues. It receives Simple Network Management Protocol (SNMP) traps and syslog events messages for reporting, analysis, monitoring, and remediation. The trap forwarding feature allows Brocade Network Advisor to filter SNMP traps and send them to third-party applications that are capable of managing events from multiple vendors. Automated Call Home. The Call Home feature automatically collects diagnostic information in response to predefined and user-defined events and sends notifications to technical support organizations for faster fault diagnosis, isolation, and remote support operations. Intelligent Dashboard and Easy-to-Use Interface The main desktop consists of three tabs, each of which contains its own menu structure and toolbar: Dashboard. SAN, IP, Host and Events Summary Widgets SAN. Fabric and Host Management IP. IP Products and Host Management Figure 1. Brocade Network Advisor tabs. Brocade Network Advisor for Data Center Networks 8 of 80

9 Visibility of the SAN and IP tabs are controlled by the active licensing option, which determines if the product displays all three tabs, the Dashboard and SAN tabs only, or the Dashboard and IP tabs only. Figure 2. Brocade Network Advisor main dashboard. Figure 3. Dashboard drill-down. Right mouse clicking on a product or port Dashboard widget items are selectable. Just double- or right-click the widget item, and additional information and options are displayed within the dashboard. You can access graphs, tables, reports, network properties, and topology information for devices or ports without having to go back to the main file menu. Brocade Network Advisor for Data Center Networks 9 of 80

10 The Server menu and Help menu are the same, regardless of the active tab being displayed (Dashboard, SAN, or IP). Additional menu options are dependent on the active tab. Access to various main menus in the Brocade Network Advisor main window is dictated by RBAC privileges and product licenses. Figure 4. Common menus. Dashboard Tab The Dashboard presents an at-a-glance summary of all discovered Brocade devices and third-party IP devices, including the performance, inventory, and event summary information used to identify and debug problem areas and help prevent network downtime. The network visibility that the Dashboard provides to all administrators helps reduce operation silos. The Dashboard also provides several features that help administrators quickly access reports, device configurations, and system logs. For reference, these dashboard snapshots can be printed or exported as a PNG file. As soon as the Brocade Network Advisor server is fully started, system-defined collectors begin collecting information for predetermined product and port level measures for all the discovered devices. The information collected by these collectors can be displayed in the main Dashboard. Also, there is a performance Dashboard that can be configured to provide customized views of specific parameters used for performance troubleshooting or proactive monitoring use cases. The Dashboard is accessible by all users, but users can only view devices that they are authorized to manage. The widgets that appear in the Dashboard are determined by software license, and the information that populates in the widgets is determined by a user s permissions and Areas of Responsibility (AORs). Widgets The Dashboard contains over forty different widgets covering various network device and port measures across SAN, IP, and wireless networks. The widgets are customizable, and users configure them to show Top/Bottom N Monitors, Time Series Monitors, Distribution Monitors, or Performance Monitors. Most widgets allow users to drill down on specific aspects of the widget to reveal additional information. Users can leverage out-of-box, default dashboard configurations or create customized views of specific widgets. Brocade Network Advisor for Data Center Networks 10 of 80

11 Figure 5. Performance dashboard widget selection. Figure 6. Widget display options. Brocade Network Advisor for Data Center Networks 11 of 80

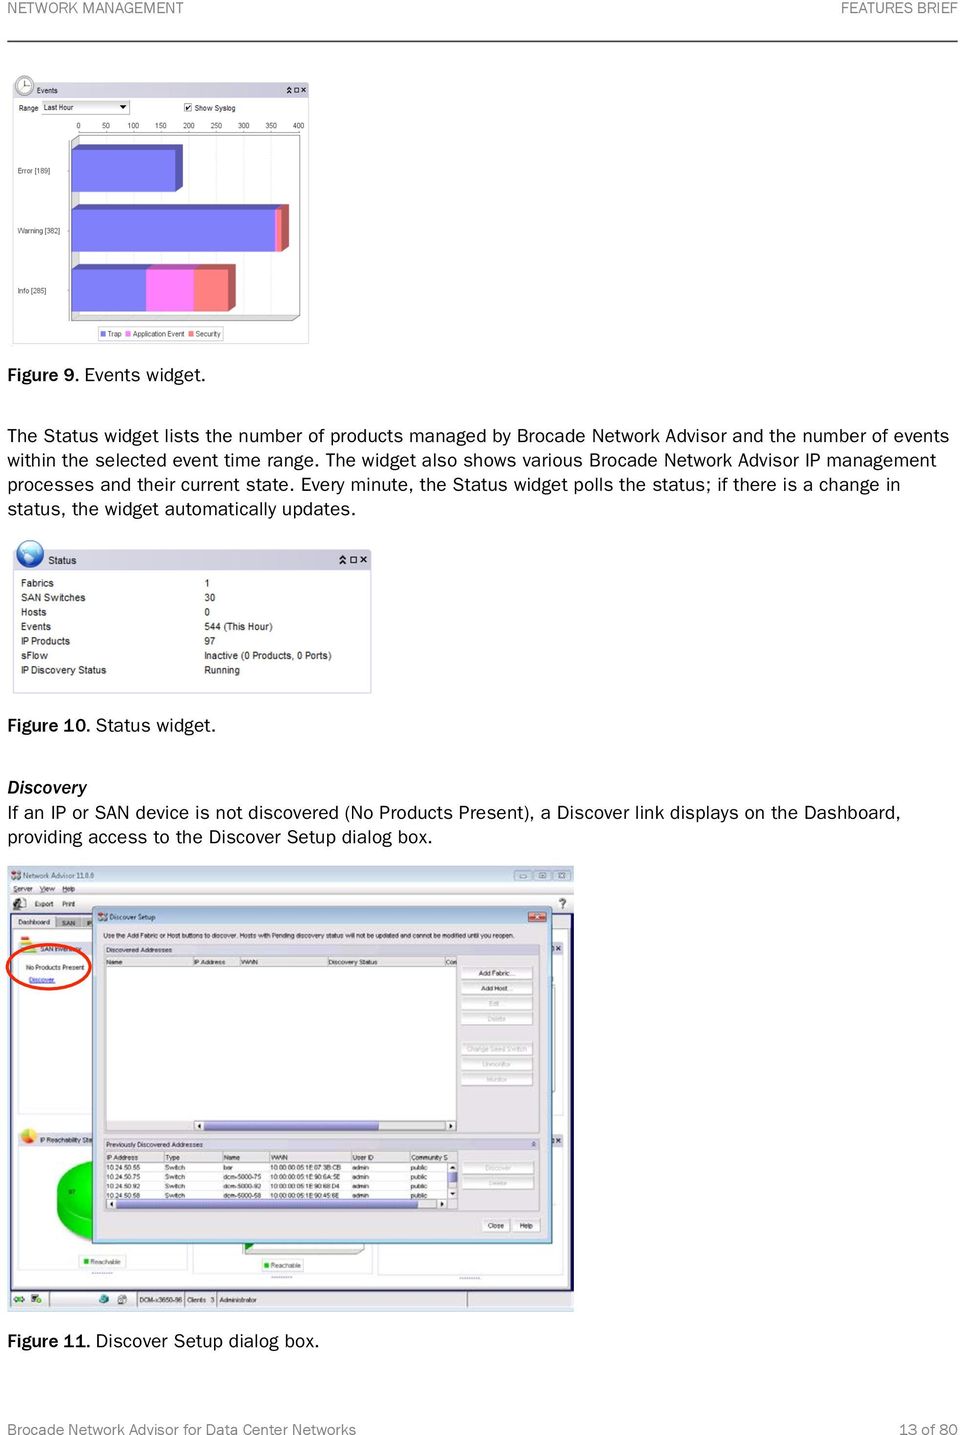
12 The product status widget, SAN Operational Status, and IP Reachability Status display a pie chart representing the status of the products. The status is color-coded, and a color legend displays below the pie chart. For example, if no offline devices are detected, the color red (representing unreachable) does not display in the chart or in the legend. When a user scrolls over a section of the pie chart, a tooltip is displayed that contains the name of the category, number of items in the category, and the percentage of items in that specific category. Users can also double-click a pie wedge in the IP Reachability Status widget to display a filtered view of the selected devices in the Network Objects view of the IP tab. Figure 7. SAN Operational Status widget. The inventory widgets, SAN Inventory and IP Inventory, display a bar graph that depicts the current state of all discovered products. A color legend displays at the bottom of the bar graph. The product inventory shown is grouped by product family. Users can double-click a bar in the IP Inventory widget to display a filtered view of the selected devices in the Network Objects view of the IP tab. Figure 8. SAN and IP inventory widgets. The Event widget displays a stacked bar graph to indicate the number of events, by severity level, for the following time ranges: This Hour, Last Hour, Last 24 Hours, Last 7 Days, or Last 30 Days. Users can change the time range for the events to include in the display. Users can double-click a bar in the Events widget to review a pop-up HTML report (using the user s default browser) that displays corresponding events for the selected category. Brocade Network Advisor for Data Center Networks 12 of 80

13
14 SAN Tab The SAN tab is a portal to application functionality. The SAN tab displays a product list on the left, a Connectivity Map in the center, and a Master Log, legend, and Minimap at the bottom. Status icons are overlaid on product icons; the worst-case status is rolled up to closed objects on the product list to ensure that they are flagged. NOTE: Access to main menus in the Brocade Network Advisor main window is dictated by RBAC privileges and product licenses. When no SAN devices are discovered, the SAN topology is left blank. Figure 12. SAN tab (no discovered devices). When SAN devices are discovered, the SAN topology is populated. Figure 13. SAN tab (discovered devices). Brocade Network Advisor for Data Center Networks 14 of 80

15 Connectivity Map The look and feel of the Connectivity Map is user-configurable and scrollable, and it: Displays physical and some logical connectivity of SAN products Includes fabrics, switches, hosts, and storage groups Displays connection and product flyovers with additional user-configurable information Streamlines icon display: one for switches and one for directors/backbone platforms The toolbar (to the right of the map) contains global map zooming and group collapsing functions. Master Log The Master Log displays at the bottom of the SAN and IP tabs. By default, the corresponding area, SAN or IP, displays in the log. Show all (SAN + IP) is an option that users can enable. When enabled, the Master Log displays SAN and IP event output. The Master Log is a single location for all events. The log can be filtered to display events by category, severity, or user-entered event content. For more details on event management via the Master Log, see the Master Log section under Event Management. The user can also: Hide or show selected events Display event details Figure 14. Master Log. Performance Legend Users can specify the ranges used in the Connectivity Map marching ants display. Figure 15. Performance legend customization. Brocade Network Advisor for Data Center Networks 15 of 80
 is an option that users can enable. When enabled, the Master Log displays SAN and IP event output.")
16 Minimap The Minimap at the bottom right of the main window displays the entire Connectivity Map, with the current Connectivity Map outlined in green. Users can drag or click to reposition the current view. Figure 16. Minimap. Views Users can create named views; for example, collections of one or more fabrics and/or hosts can be defined as named views in the Create View dialog box. Figure 17. Create View dialog box. Brocade Network Advisor for Data Center Networks 16 of 80

17 IP Tab The IP tab is a portal to application functionality. The IP tab displays a product list on the left, a Connectivity Map in the center for the selected topology (IP Topology, L2 Topology, Ethernet, or VLAN Topology), and a Master Log and Minimap at the bottom. When Network Objects are selected, only a product list and Master Log display; this option does not include a Connectivity Map or Minimap. Status icons are overlaid on product icons; the worst-case status is rolled up to closed objects on the product list to ensure that they are flagged. NOTE: Access to main menus in the Brocade Network Advisor main window is dictated by RBAC privileges and product licenses. Figure 18. IP tab. IP Topology, L2 Topology, Ethernet and VLAN Topology Connectivity Maps The look and feel of the Connectivity Map is user-configurable and scrollable. These maps are capable of the following: Displays physical and logical connectivity of IP products Displays connection and product flyovers with additional user-configurable information Streamlines icon display for different products The toolbar (to the top right of the map) contains global map zooming and group collapsing functions. Multiple automatic layout methods are available, as well as manual placement and background maps. Users can right-click a product in the topology map or product tree to display a menu of shortcuts to commonly used features. The Network Object manager provides both automatic system groups and manually created groups of products or ports. Groups allow a user to quickly monitor or configure multiple similar items at one time. Brocade Network Advisor for Data Center Networks 17 of 80

18 The L2 Topology map displays Layer 2 connectivity for all Brocade devices on the network. The links on the map show physical links between physical ports on devices. Users must have the Main Display L2 privilege to access the L2 Topology map. Figure 19. L2 Topology on IP tab. The IP Topology map displays IP subnets, with products as child nodes. Users must click the IP subnet to display the devices within the subnet on the map. Users must have the Main Display IP privilege to access the IP Topology map. Figure 20. IP Topology on IP tab. Brocade Network Advisor for Data Center Networks 18 of 80

19 The VLAN Topology map displays all VLANs known to the system. The known VLANs and the products that belong to each VLAN are listed in the left-hand column. Users must have the Main Display VLAN privilege to access the VLAN Topology map. From this screen, users can also choose to display topology maps for Spanning Tree Protocol (STP) and Rapid STP (RSTP) configurations. Figure 21. VLAN Topology on IP tab. User Management Brocade Network Advisor provides administrators with a robust RBAC feature to define granular roles and privileges for both SAN and IP administrators. It provides the following key features: Current authentication and authorization configuration details Consolidated list of user profiles, roles, and areas of responsibility (AORs) Provisions to add, modify, or duplicate user profiles, roles, and AORs Account State column showing active or lock-out reasons Provision to launch Event Notification configuration dialog Default user credential, which is Administrator/password Default user, which has access to all devices in the IP and SAN environment Access that is restricted to users assigned with User Management privilege with Read-Only/Read-Write permission. Modification/deletion of default user allowed only if another user with User Management privilege exists No limit for number of users added to Brocade Network Advisor, and the number of users is dependent on the database storage limit When a logged in user is deleted, the respective user is informed, and the action triggers a forceful logout from Brocade Network Advisor. When a User Manager performs any update/delete on the Role/AOR assigned to a user, and the user is already logged in, then the respective user is informed, and the action triggers a forceful logout from Brocade Network Advisor. Brocade Network Advisor for Data Center Networks 19 of 80

20 Local authentication (local password database), Windows domain login, Lightweight Directory Access Protocol (LDAP), RADIUS, and TACACS+ are supported. You can configure automatic failover to a secondary authentication method, in case a remote primary authentication method becomes unavailable. Figure 22. User management dialog box. Add/Modify User New users are enabled shortly after creation. The Add User dialog box contains many user properties, such as Full Name, Phone, Account Status, and Account State. Available roles and AORs are easy to select and apply to a user account. Figure 23. Add User dialog box. Brocade Network Advisor for Data Center Networks 20 of 80

21 User Profile Users are allowed to change password and other profile information without triggering a forceful logout. Figure 24. User Profile dialog box. User Policies User password behaviors are defined through user policy settings. Brocade Network Advisor provides administrators with the ability to define the following user policies: Password Expiration o Expiration enforces users to change their passwords periodically. o The password expiry changes a local user account state to Password expired. o Notifies users during login when the password is in the expiry/warning period. o Policy is applied only when a user is authenticated through the local database. Password History and Format o Defines password strength level. o Policy violations set the account states to Password history policy violated/password format policy violated. Lockout Support o Ensures high security. o Is applied to all users, except for the last active user with User Management privileges and Read-Write permission. o The policy is applied only when the user is authenticated through the local database. o When invalid credential entries reach the configured lockout threshold, the user account is locked out, and the state is changed to Locked out threshold reached. o After the set policy lockout duration is completed, the invalid login attempts with respect to the particular user are reset to zero. Brocade Network Advisor for Data Center Networks 21 of 80
22 Figure 25. Defining user policies. Roles and Privilege Management All privileges are classified as Application, SAN, or IP. There are default roles in place, and roles can be created, modified, duplicated, or deleted. Assigning a defined role with its associated privileges directly to a user does not happen on this dialog box. Roles must be assigned to a user from the Add User dialog box. Figure 26. Defining roles. Brocade Network Advisor for Data Center Networks 22 of 80
23 Areas of Responsibility (AORs) AORs are used to define device access permission to a user. AORs have the ability to group fabrics, hosts, and IP products. System level AORs are defined in Brocade Network Advisor and include: All Fabrics This is the system AOR for SAN environments, and it includes all discovered SAN devices. All IP Products This is the system AOR for IP environments, and it includes all discovered IP products. Except for system level AORs, all other AORs can be modified, deleted, or duplicated. The existence of an empty AOR is allowed, and a user can be assigned an empty AOR. Figure 27. User AORs. Event Management The powerful Event Manager helps troubleshoot network-related issues. It can receive SNMP traps and syslog events. The trap forwarding feature allows Brocade Network Advisor to filter SNMP traps and send them to thirdparty applications that are capable of managing events from multiple vendors. Brocade Network Advisor supports the following event management features, allowing administrators to manage storage and IP network failures: Unified Master Log for IP and SAN devices Common filtering mechanism for IP and SAN devices Common registration UI for SNMP and syslog Common SNMP and syslog forwarding UI Common Event Policy and Event Action UI Support for Custom Reports Call Home support for both IP and SAN events Common aging and purging policies The following sections highlight some of these unified event management features. Brocade Network Advisor for Data Center Networks 23 of 80
24 Master Log The Master Log displays at the bottom of the SAN tab or IP tab and contains the following default columns: Severity, Acknowledged, Area (SAN/IP/SAN + IP), Source Name, Source Address, Origin, Category, Description, Last Event Server Time, Count, Module Name, and Message ID. By default, the Master Log displays context-specific (SAN or IP) events and Application events (non-contextsensitive). Enabling Show all (SAN + IP) instructs the Master Log to display both SAN and IP events. The Master Log displays a maximum of 5000 events, and the events viewable by the user are limited by the user s AOR. In the case of IP events, the Master Log displays syslog events by default. Figure 28. Event display in the Master Log. Brocade Network Advisor allows events to be acknowledged. By default, acknowledged events are not shown. When Show acknowledged is enabled, the Master Log displays acknowledged events along with other events. Event Actions Event Actions can be associated with one or multiple events of the following types: o SNMP Trap o Application Event o Pseudo Event o Custom Event Event Actions can be associated to one or more Event Sources. SNMP trap selection includes preloaded IP or SAN trap types (Non-SWEvent) based on the launching context. You can define additional varbind-based filter(s). SAN only SW Events shows all the RAS log message types to which the Event Action can be associated. An additional message field allows users to specify message patterns to match against. SW Event choices do not display for IP. Brocade Network Advisor for Data Center Networks 24 of 80
25 Figure 29. Event Actions dialog box. Edit Event Actions Users can add, edit, duplicate, delete, enable, and disable event actions from the Event Actions dialog box. The Event Actions Edit button launches the Edit Event Actions dialog box. From this dialog box, users can edit and configure event actions, which is a six-step process: 1. The Identification step of the Edit Event Action dialog box allows users to configure Event Names and enable Event Actions. 2. The Events step of the Edit Event Action dialog box allows users to configure Traps and Varbind Filters, Application Events, Pseudo Events, and Custom Events. 3. The Sources step of the Edit Event Action dialog box allows users to configure Event Sources using a list of sources, using a legacy approach, or by configuring ports as Events Sources. 4. The Policy step of the Edit Event Action dialog box allows users to configure an Event Action Policy to act on all occurrences or based on specified rules. 5. The Action Group step of the Edit Event Action dialog box allows users to configure Event actions. 6. The Summary step of the Edit Event Action dialog box provides users with a summary of the configured Event Action. Figure 30. Edit Event Action dialog box. Brocade Network Advisor for Data Center Networks 25 of 80
26 SNMP Trap and Syslog Event Registration Users can automatically register the Brocade Network Advisor server as an SNMP trap recipient and as a syslog recipient. SNMP trap and syslog auto registration is available in the Options dialog box as a global setting. Figure 31. SNMP trap and syslog event registration. You can connect a simple SNMB trap receiver to switches in the Brocade fabric, as shown in Figure 32. Figure 32. SNMP trap receiver connected to switches in the Brocade fabric. Brocade Network Advisor for Data Center Networks 26 of 80
27 Adding additional recipients is available as a separate menu option under Monitor > SNMP Setup or Monitor > Syslog. These dialogs also support adding additional recipients on IP switches; users can add one recipient at a time, but they can apply the recipient to multiple switches at once. Figure 33. SNMP trap and syslog recipients. SNMP Trap Event Forwarding The SNMP Trap Forwarding dialog box is available as a separate menu option under Monitor > SNMP Setup. The SNMP Trap Forwarding dialog box allows users to configure forwarding destinations and filters. Figure 34. SNMP Trap Forwarding dialog box. The Add Trap Filter dialog box allows users to set the following filters: forward Application events as traps, and forward traps as v1, v2c, or v3. For SAN events, filtering is done at fabric level. For IP events, filtering can be done up to the product level. Brocade Network Advisor for Data Center Networks 27 of 80
28 SNMP trap destinations can be configured as follows: Destinations can be configured without filters, in which case all the traps are forwarded. This is the default behavior. Enabling SNMP Trap Repeater forwards the traps without filters. Traps can be forwarded as v1, v2c, or v3 traps. You can configure SNMP v3 credentials of the forwarding recipient using the Options dialog box as a global setting. Figure 35. Trap Destination Forwarding credentials. Syslog Event Forwarding The Syslog Forwarding dialog box is available as a separate menu option under Monitor > Syslog. The Syslog Forwarding dialog box allows users to configure forwarding destinations and filters. You can configure syslog destinations without filters, in which case all the syslogs are forwarded. This is the default behavior. Enabling Syslog Repeater forwards the syslog messages without filters. Users can define syslog filters from the Edit Syslog Filter dialog box. For SAN events, filtering is done at fabric level. For IP events, filtering can be done up to the product level. Brocade Network Advisor for Data Center Networks 28 of 80
29 Figure 36. Syslog Forwarding dialog box. Advanced Call Home The Advanced Call Home feature allows users to configure Brocade Network Advisor to automatically call into their OEM Service Center when specified triggering conditions are met. This enables the service center to be configured on a per-switch basis. This is important, since SAN infrastructure devices are usually procured from more than one vendor, therefore the service contracts for those switches are tied to the respective vendor service centers. Depending on which Call Home center is supported by a vendor, an appropriate underlying mechanism is used ( , modem, LAN, and so on). Customers have access to fine-grained control over: Which events trigger a Call Home What Brocade Network Advisor does in response to those Call Home events, including automatically capturing diagnostic information from the switches as part of the Call Home event Table 1. Call Home Supported Platforms Call Center Windows Linux EMC ü û IBM ü û HP LAN ü û Brocade ü ü IBM ü ü Oracle ü ü NetApp ü ü Brocade Network Advisor for Data Center Networks 29 of 80
30 DATA CENTER SAN MANAGEMENT Brocade Network Advisor provides several key features to maximize administrative productivity by enabling the automation of repetitive tasks. IT organizations can analyze performance trends over time to maximize asset utilization and aid in proactive capacity planning. Brocade Network Advisor provides practical features that enable holistic visibility across a global infrastructure to avoid unintended manual errors the type of error that could be catastrophic to businesses. For example, zoning information might be overwritten by two or more users on the same zone set. A wizard-driven approach streamlines configuration activities (setting up cascaded FICON fabrics or FCIP tunnels) and troubleshooting/diagnostic activities (determining why two devices cannot communicate with each other or why sharing of devices between routed fabrics is not working). You can now perform these common tasks across groups of switches in a single operation: Firmware download Fabric configuration setup Backup and restoration of critical configuration and performance data Collection of diagnostic data for troubleshooting Automation of repetitive tasks enables IT organizations to ensure configuration consistency on a global basis across multiple fabrics and geographically dispersed data centers. For a more comprehensive explanation of Brocade Network Advisor features and how to use them, see the Brocade Network Advisor User Guide for your version of software. Performance Monitoring and Management Brocade Network Advisor enables IT organizations to monitor fabrics on both a real-time and historical basis. Brocade Network Advisor uses a policy-driven approach to set thresholds for individual ports, as well as end-toend between source (application) and target (disk). This allows users to address performance issues proactively, rapidly diagnose the underlying causes, and quickly resolve them before the SAN becomes the bottleneck for critical applications. Furthermore, IT organizations can use analytical and reporting features to study performance trends over time and make changes to maximize asset utilization and plan for future c apacity needs. Some performance monitoring and management capabilities are: Real-time performance data collection, monitoring, and graphical display (across FC, FCIP, and Gigabit Ethernet [GbE] ports and connections); includes support for both performance data (Tx/Rx) and error counters (CRC/sync loss errors, signal losses, and link failures) Historical performance data collection, monitoring, and graphical displays (across FC, FCIP, and Fibre Channel Routing [FCR] ports and connections); includes support for both performance data (Tx/Rx) and error counters End-to-end monitors (both real-time and historical) from source (application) to target (disk) Top Talker monitors determine the data flows that are the major users of bandwidth; bandwidth usage is measured in real time relative to the port on which the monitor is installed. Policy-based, user-defined performance thresholds Color-coded marching ants on the topology to show traffic status Out-of-box reports (Top N ISLs, Top N Device Ports) Brocade Network Advisor for Data Center Networks 30 of 80
31 You can monitor the performance of these objects: Switches and FC, GbE, Inter-Switch Link (ISL), and device ports; customize the device tree to show only ISL ports or only device ports Active FCIP tunnels Trunks End-to end-monitors Managed HBA ports Real-Time Performance Monitoring The Brocade Network Advisor supports multiple open instances of real-time performance monitoring. Figure 37. Real-time performance graphs. Historical Performance Monitoring You can easily enable historical data collection for the entire SAN or a selected set of fabrics. Historical performance graphs display the Top N performers for a selected object type. You can monitor the historical performance of these objects: FC, ISL, and device ports FCIP tunnels FCIP statistics, including timeout retransmits, duplicate ack. retransmits, window-size Round-Trip Time (RTT), and TCP out-of-order segments End-to-end monitors These are characteristics of the historical performance capability: Data is persisted at each polling cycle of 5 minutes. A Round-Robin Database (RRD) style-aging scheme is used. You can configure reporting for these intervals of time: 5 minutes, 30 minutes, 2 hours, or 1 day. You can also generate historical tabular reports. NOTE: Approximately 12 GB of disk space is required for 9,000 ports. Brocade Network Advisor for Data Center Networks 31 of 80
32 Top Talkers The Top Talkers dialog box displays real-time (top) and historical (bottom) lists of top conversations for a selected switch (Fabric Mode) or F_Port (F_Port Mode). (Multiple open instances of the Top Talker dialog are supported.) Figure 38. Top Talkers dialog box. End-to-End Monitor Support End-to-End (EE) monitors are user-configurable. For example, in Figure 39, a user selects a fabric from the dropdown menu at the top left, selects an initiator port from the list, selects a target from the list, and adds a new EE monitor to the table on the right. Brocade Fabric OS (FOS) supports a maximum of 4,000 EE monitors. EE monitors must be provisioned to view statistics for both real-time and historical performance. Figure 39. Set End-to-End Monitors dialog box. Brocade Network Advisor for Data Center Networks 32 of 80
33 User-Defined Performance Thresholds You can create threshold policies and apply them to entire fabrics and/or individual switches. Figure 40. New Threshold Policy and Set Threshold Policies dialog boxes. Marching Ants Marching ants are colored animated dashed lines in the View Utilization view, which display utilization for FC and FCIP. The range displayed is user-configurable, and if no data parties are available, a gray line is used. For example, if the data is between 0 and T1, where T1 is the first threshold, a blue dashed line is displayed. Figure 41. View Utilization on the Toolbar menu. Brocade Network Advisor for Data Center Networks 33 of 80
34 Zoning You can configure policies to control the number of Zone database changes. Administrators can: Set limits on the number of editing operations (add/remove/modify) that can be performed in zones, zone configurations, aliases, or zone members before activation Set policies on a per-fabric basis, for example, different policies for disk versus tape storage Warn users when a policy is exceeded and prevent further changes Additional Zoning features are described in the following sections. Zoning Impact Analysis Brocade Network Advisor supports the concept of an offline Zone database, so that users can make zoning changes offline without affecting the production fabric. This feature helps SAN administrators, who receive storage provisioning requests throughout the day and need to make the required configuration changes. Typically there is a very small change window each day during which changes can actually be pushed to the production fabric. The offline zoning feature provides precisely this ability. Brocade Network Advisor compares the selected offline database with the online database to see which source devices have gained or lost access to which target devices. Brocade Network Advisor provides both host-to-storage and storage-to-host connectivity views. Figure 42. Zoning impact analysis: Host-to-storage connectivity view. Additionally, whenever a new zoning configuration is activated, a comprehensive change impact analysis window is displayed, detailing all of the changes that occur in the fabric when the configuration is activated. Users can review those changes and make sure they are in line with expectations. Users can also chose to compare the applied configuration with the current fabric configuration, as described above. Brocade Network Advisor for Data Center Networks 34 of 80
35 Figure 43. Activate Zone Configuration dialog box. Multiuser Zoning Brocade Network Advisor detects when more than one user is working on the same zone set and provides a notification to these users. Users can then choose to either configure these changes serially or to continue to work in parallel. Brocade Network Advisor provides a compare-merge capability when the users are ready to commit the changes. Users can compare their own changes to the changes of other users to ensure that they do not accidentally overwrite zone configurations. In data center environments where zoning changes to production fabrics are constantly made, this is an efficient collaboration tool. Figure 44. Multiuser zoning Compare-and-merge capability. Brocade Network Advisor for Data Center Networks 35 of 80
36 LSAN Zoning Brocade Network Advisor has several features for performing Logical SAN (LSAN) zoning, which allows multiple fabrics, whether local or remote, to connect with each other without merging. Only devices that have been specifically zoned within these fabrics can communicate with each other, rather than having complete unrestricted access. Brocade Network Advisor consolidates LSAN zoning into the regular Zoning dialog box, but it provides a different zoning scope based on the backbone fabrics that have been discovered. It displays potential zoning members based on the backbone fabric and its connected edge fabrics. Brocade Network Advisor allows LSAN zones to be created, edited, and activated in the fabric zoning scope for both backbone and edge fabrics. The Brocade Network Advisor topology supports comprehensive MetaSAN features, which include visualization of backbone and edge fabrics and display of Inter-Fabric Links (IFLs) in the topology. Figure 45. Backbone and edge fabrics showing IFLs. Brocade Network Advisor for Data Center Networks 36 of 80
37 Figure 46. LSAN zoning configuration. Configuration Management Configuration management features provide several benefits. For example, if a switch that is performing successfully seems to be misbehaving due to an accidental configuration, you can quickly restore it to the last known good configuration. Similarly, a user can remove a switch whose lease has expired and replace it with a new switch of the same model without having to manually reconfigure the new switch; it can be provisioned through Brocade Network Advisor. An enterprise may have global corporate standards for switch configuration and requirements. With Brocade Network Advisor, ensuring configuration consistency is easy: you can configure replications from a golden master switch to all other switches. Save Switch Configurations. Brocade Network Advisor allows you to choose one or more switches from the discovered fabrics and to back up configurations to a repository, either manually on demand or automatically on a scheduled basis. Restore Switch Configuration. Brocade Network Advisor allows you to view configurations that have been backed up to the configuration repository, using a configuration viewer. Replicate Master Configuration to Multiple Other Switches. The Replicate Switch Configuration wizard allows you to select a golden master configuration and to replicate it to multiple other selected switches. Options are provided to selectively replicate any or all of the following: SNMP settings, Brocade Fabric Watch settings, trace destinations, and the entire configuration. Replicate Switch Security Policy Configuration. The Replicate Switch Security Policy Configuration wizard allows you to replicate security policies: AD/LDAP Authentication Servers, RADUIS Authentication Servers, Switch Connection Control (SCC) policies, Device Connection Control (DCC) policies, and IP policies. Brocade Network Advisor for Data Center Networks 37 of 80
38 Virtual Fabrics Brocade Network Advisor understands the new Brocade FOS concept of Virtual Fabric (VF) and Logical Switch (LS). Brocade Network Advisor allows users to enable VFs on switches, create LSs, and use them in fabrics. (See the Brocade Fabric OS Administrator s Guide for details about Virtual Fabrics and Logical Switches.) In the Virtual Fabrics Connectivity Map, shown in Figure 47, Logical Switches are displayed with V-tagged icons. Logical ISLs are displayed as logical (blue). Figure 47. Virtual Fabrics Connectivity map. The Logical Switches dialog box provides an intuitive interface for creating new LSs and assigning available ports. Figure 48. Logical Switches dialog box. Brocade Network Advisor for Data Center Networks 38 of 80
39 Port Groups Port groups allow users to configure, name, and save a logical group of ports as a way to administer them. A port group can include one or more ports on more than one switch in a single fabric. Figure 49. Port Groups dialog box. Port groups have been extended to the FICON environment. Used with multiple Prohibit Dynamic Connectivity Masks (PDCM, a method to define port connectivity), port groups are equivalent to zoning for enabling and disabling traffic on a per-port group basis. Figure 50. Configure Allow/Prohibit Matrix window. The following PDCM enhancements apply in a FICON environment and are available in Brocade Network Advisor: User warning when E-E and E-F port connections are prohibited The ability to provision the same PDCM updates to multiple switches Direct entry of rows and columns in the PDCM Matrix in the Allow/Prohibit Matrix for enhanced usability Brocade Network Advisor for Data Center Networks 39 of 80
40 FCIP Management Support for Extension Platforms Brocade Network Advisor simplifies configuration and deployment of Extension/FCIP switches and supports the following Brocade extension platforms: Brocade 7800 Extension Switch Brocade FX8-24 Extension Blade The supported features include: Comprehensive FCIP Tunnels configuration window (replaces the FCIP Tunnel wizard and also supports legacy extension platforms, the Brocade 7500 Extension Switch, and the Brocade FR4-18i Blade) Enhancements for connection properties, switch properties, flyovers, and the Topology view Ability to view all tunnels discovered by Brocade Network Advisor across all fabrics Figure 51. FCIP Tunnels window. The Brocade Network Advisor FCIP Tunnel configuration wizard streamlines the configuration of IP interfaces, routes, and other parameters that are required to set up FCIP tunnels with both Brocade legacy platforms and the new generation of extension platforms. This greatly reduces the amount of time required to set up these complex scenarios. Brocade Network Advisor for Data Center Networks 40 of 80
41 Figure 52. FCIP Tunnel/Circuit Configuration Report window. Virtualization Support As more and more components of the data center are virtualized (from storage all the way to the server), the ability to manage virtual resources becomes increasingly necessary. Through the use of N_Port ID Virtualization (NPIV) in the server virtualization hypervisor, Brocade Network Advisor can identify virtual machines running in the fabric. These are represented with a V-tagged icon similar to the one used to designate Logical Switches: Figure 53. VM machines running in the fabric. Once these devices are visible in the fabric, Brocade Network Advisor can assign policies such as QoS or fabric services such as encryption to them just as if they were physical servers. In addition, and in order to improve visibility of the virtual server infrastructure for storage administrators, the following features are included in Brocade Network Advisor: Discovery of VMware virtual machines via VMware ESX Server APIs Figure 54. Add VM Manager dialog box. Brocade Network Advisor for Data Center Networks 41 of 80
42 Identifying which physical servers are running VMs Figure 55. Host group with two physical servers running virtualization (VMware) in the Topology view. Display of VM properties as part of the host properties, including end-to-end path from VM to LUN. You can view the details of VMs and VM LUN path information online. Figure 56. Virtual Machines Properties dialog box. Brocade Network Advisor for Data Center Networks 42 of 80
43 Simplified HBA and CNA Management Brocade Network Advisor simplifies management of FC HBAs and FCoE/DCB CNAs and provides integration with Brocade Host Connectivity Manager (HCM). The following features are supported in Brocade Network Advisor: Host-based Discovery and Topology views include discovery of Brocade HBAs/CNAs. Figure 57. Host-based Topology view. Automatic server-to-hba mapping Properties display Events integration Statistics collection and display, including Real-Time Performance Monitoring. Figure 58. Real Time Port Selector window. Brocade Network Advisor for Data Center Networks 43 of 80
44 End-to-end switch and HBA configuration operations o Instead of having to go to the HBA element manager first to configure Fibre Channel Security Protocol (FCSP) and then to the switch element manager to configure the same parameters on the switch port, you can configure both ends of the connection (HBA port and its corresponding switch port) in a single operation from Brocade Network Advisor. Figure 59. FCSP Authentication dialog box. HBA supportsave: Host management supports capturing support information for managed Brocade HBAs, which are discovered in the management application. You can trigger supportsave for multiple HBAs at the same time. Deep element management HCM Launch-in-Context from Brocade Network Advisor With a single user interface to manage all HBAs, storage and server administrators can manage local HBAs (HBAs installed on same machine as GUI) as well as remote HBAs (HBA installed on distributed servers). Fibre Channel over Ethernet (FCoE) Brocade Network Advisor provides unified management for a wide range of protocols supporting data, storage and converged networks, which support Fibre Channel, FCR, FCIP, FCoE, and DCB. Brocade Network Advisor fully supports FCoE and DCB protocols, as well group management for Brocade FCoE products, such as the Brocade 8000 Switch and the Brocade FCOE10-24 Blade for the Brocade DCX Backbone family. Additionally, Brocade Network Advisor discovers third-party CNAs connected to Brocade fabrics, including the QLogic QLE8042 and Emulex LP21000-M CNAs. Brocade Network Advisor provides comprehensive Layer 2 configuration options, such as: DCB interface administration Data Center Bridging Exchange (DCBX) FCoE port and trunk configurations Link Aggregation Group (LAG) configuration Link Level Discovery Protocol (LLDP) Quality of Service (QoS) Spanning Tree Protocol (STP) DCB configuration replication Brocade Network Advisor for Data Center Networks 44 of 80
45 Troubleshooting and Diagnostics Brocade Network Advisor provides powerful wizards to perform troubleshooting and diagnostic activities and to aid in rapid problem resolution. This in turn helps IT organizations minimize their Time to Resolution (TTR) and maintain Service-Level Agreements (SLAs). Device Connectivity Troubleshooting Wizard This wizard checks for a number of conditions (listed below), which, if present, might prevent devices from communicating with each other. Once complete, the wizard displays the results of these checks and the recommended next steps: Device port status (online/offline) Switch port health status Zone configuration Active ACL DCC policy check LSAN zone configuration Device moved to a new fabric Fabric segmentation FC Router physical connection status Figure 60. Device Connectivity Troubleshooting Results dialog box. Device Sharing Diagnosis Wizard This wizard verifies whether two selected fabrics are configured properly to share devices. Execution of the wizard results in a report that outlines whether or not it is possible to share devices between the selected fabrics. Brocade Network Advisor for Data Center Networks 45 of 80
46 Figure 61. Fabric Device Sharing Diagnosis Result window. Trace Route Wizard Brocade Network Advisor provides a wizard to assist with, first, performing a trace route check from a source port on a local switch to a destination port on another switch and, second, determining detailed routing information between the switches. The routing information describes the full path that a data stream takes to go from the source path to the destination path, including all the intermediate switches it traverses. Both the forward and reverse path information is made available. Trace route also shows the traffic path through routed environments. The wizard provides an FC ping option, which performs a zoning check between the selected device port World Wide Names (WWNs). It also provides the maximum, minimum, and average RTT for the frames between the device port WWNs and the domain controller. Users can determine the path and latency between given ISL ports and device WWNs, information that is helpful for diagnostic and troubleshooting purposes. Figure 62. Trace Route wizard window. Brocade Network Advisor for Data Center Networks 46 of 80
47 Failure Resolution for a FICON Merge (Cascaded FICON) Brocade Network Advisor provides a wizard to help resolve merge conflicts in a cascaded FICON environment in the following switch configuration areas: DomainID Timeout Value (TOV) Buffer-to-Buffer Credit DisableDeviceProbe RoutePriority Per Frame SeqLevelSwitching SuppressClassF LongDistance Setting Data Field Size VC Priority Security and Encryption Security management in Brocade Network Advisor includes the following capabilities: Multiple levels of user access and views with flexible definitions Read-write, Read only, and No privileges of administrator roles and responsibilities Consistent security settings RADIUS, Active Directory, LDAP, and SNMP configuration across multiple switches by leveraging the Security Replication wizard Configuration, settings, and ongoing management of Brocade fabric-based data-at-rest encryption products Standards-based security features for access controls, including support for IPv6 Dashboard-level status and wizards to enable security mode, policy editors, and end-to-end HTTPS secure connectivity Integration with leading authentication, authorization, and accounting solutions, such as RADIUS, AD/LDAP, Network Information Service (NIS), and NIS+ Security management via Brocade Network Advisor protects physical and virtual access to data at rest. Secure Copy/Secure FTP To support Technical Support data collection and firmware download via Secure Shell (SSH), you can utilize an internal or external Secure Copy Protocol (SCP) or Secure File Transfer Protocol (SFTP) server. Securityconscious customers should use the SCP or SFTP option for firmware download and for collecting Technical Support files. Third-Party Key Management Support Brocade Network Advisor supports the NetApp License Key Manager, RSA Data Protection Manager (DPM) for the Datacenter, HP StorageWorks Secure Key Manager (SKM), and Thales Encryption Manager for Storage. Integration with Leading Partner Orchestration and Management Tools Brocade Network Advisor is designed with an open-standard interface to simplify integration with management solutions from server, storage, and infrastructure management partners. The Brocade Network Advisor architecture has the following characteristics: Brocade Network Advisor for Data Center Networks 47 of 80
48 Simplifies partner integration using open-standard interfaces (SNMP, Storage Management Initiative Specification [SMI-S]) Improves customer management of virtualized resources (server, fabric, storage) Reduces management complexity of virtualized data centers by providing end-to-end network visibility Improves administrator productivity, so that human resources scale efficiently with the growth of storage and virtual server workloads Brocade Network Advisor provides customers with options to integrate with existing tools through standard interfaces and through seamless integration with key partners, such as VMware vcenter, Microsoft SCOM, IBM Tivoli, and IBM Systems Director. Microsoft SCOM Management Pack Brocade Network Advisor populates Microsoft SCOM with fabric details, switch details, statistics, and Call Home events. Integration with Microsoft SCOM was developed to provide additional visibility into the health of the SAN. Server administrators can quickly identify if the SAN is causing poor application performance or other issues by viewing statistics. Access to this statistical information helps administrators improve troubleshooting and resolution, as well as communications between the SAN/storage administrator and the server administrator. Key benefits of the integrated solution include: Displays dynamic HTML pages with fabric inventory data and EE-Monitor statistics (which are collected by Brocade Network Advisor) in the Microsoft SCOM console Retrieves Call Home events from the Brocade Network Advisor Server and periodically checks the health of Brocade Network Advisor Management Plug-In for VMware vcenter The management plug-in for VMware vcenter is a plug-in for a vcenter server that displays SAN connectivity information for managed ESX hosts and switch port statistics in the vsphere client. The current plug-in supports CNA and HBA connectivity. The VMware vcenter plug-in enables proactive SAN monitoring in the following ways: Provides VM-to-storage LUN visibility Enables VM-to-storage proactive port monitoring Provides visibility to SAN performance statistics Enables forwarding of SAN performance and fault events Empowers vcenter administrators with bottleneck identification Deep Integration Between Brocade Network Advisor and IBM Management Products Brocade is firmly committed to unifying the network management experience across different network types within Brocade Network Advisor. That commitment extends to providing a deep integration experience with industry-leading management products from Brocade partners. An example of this deep integration experience is showcased with IBM management products, both for Storage Resource Management (SRM) with IBM Tivoli Storage Productivity Center (TPC) and for Server/VM management with IBM Systems Director. IBM Systems Director Integration This integration is focused on administrators across different domains, in this instance, Server/VM and SAN management. The IBM Systems Director product is an integrated management platform that focuses on lifecycle management of servers and virtual machines. It performs basic network management activities, such as VLAN configuration, performance monitoring, and more. Brocade Network Advisor for Data Center Networks 48 of 80
49 The deep integration between Systems Director and Brocade Network Advisor is programmatic (API-driven) in nature. The objective is that a Server/VM administrator can provision networking resources within the context of a server provisioning operation. Traditionally, server administrators have to wait for the networking team to perform certain tasks (such as provisioning network ports, and so forth) before they can bring a server or VM online. This can often take hours or days, since the change management activity, including coordination through the ticketing system, workflow approvals, and so forth, can take some time. With this deep integration, IBM and Brocade now provide server administrators with the ability to provision FCoE networking ports in the context of a Server/VM provisioning operation via a template-driven approach. The Systems Director end user configures networking parameters (such as VLANs, ACLs, QoS, LLDP, and so forth) without any deep knowledge of networking. The templates typically are created once by a higher-level architect who understands the data center layout well and is able to capture best practices around server/network configuration within these templates. Once the templates are defined, the task of provisioning the network options within Systems Director is simplified dramatically, behind the scenes; Systems Director makes advanced API calls into Brocade Network Advisor to perform these networking operations. Besides provisioning, this deep integration also supports the monitoring of networking health, the ability to send up alerts to the Systems Director end user when its Hosts/VMs/applications are impacted by network issues (such as network congestion or crossing user-defined performance thresholds), and the ability to then proactively respond to those incidents and resolve them before they affect service. This deep integration dramatically simplifies the coordination between server and network administrators, thereby significantly reducing Operating Expenses (OpEx) and helping with application SLA management. IBM Tivoli Storage Productivity Center (TPC) Integration This integration is focused on administrators within the same domain, in this instance, storage and SAN management. The IBM TPC is an industry-leading SRM solution that helps customers manage storage environments by simplifying tasks related to LUN provisioning, capacity planning, replication, reporting, and so forth The IBM TPC also performs basic SAN management activities for Brocade Fibre Channel infrastructure via the Brocade standards-based SMI-S interface. The deep integration between TPC and Brocade Network Advisor is GUI-centric and is focused on two aspects: Launch-in-Context (LIC) and Single Sign-On (SSO). LIC is the ability for an end user, from within TPC, to directly invoke specific functionality from Brocade Network Advisor (for instance, zoning, fault management, reporting, performance management, and so forth). The user is able, for example, to launch the relevant Brocade Network Advisor UI panel from within TPC, instead of launching the main Brocade Network Advisor UI separately and then searching for where the action needs to be performed. As part of this launch invocation, the context of the SAN object also gets passed (for instance, the WWN of the FC switch, port, and so forth) and is automatically preselected in the Brocade Network Advisor UI. SSO lets the TPC user be automatically authenticated and authorized against Brocade Network Advisor, which ensures that the user has permissions to perform the activity on the resource the user is operating. All activities the user performs are logged into the Brocade Network Advisor event log. Both tools are kept in synchronization with each other, so a task performed in either tool automatically updates the state information regarding the SAN resources in the other tool. Typical tasks associated with this deep integration include configuration (for example, zoning, QoS), monitoring (for example, port and fabric statistics, network congestion, CRC errors, performance counters), diagnostics (for example, why two end points cannot talk to each other or why devices cannot talk within a routed fabric), reporting (for example, various fabric reports), and so forth This deep integration enables storage/san administrators to avoid unnecessary clicks and steps between the two products in order to perform day-to-day activities, thus reducing the OpEx associated with those tasks. Brocade Network Advisor for Data Center Networks 49 of 80
50 DATA CENTER IP MANAGEMENT Brocade Network Advisor provides robust functionality to manage IP and MPLS switches and routers. Discovery From the IP tab, users can access the Discovery Setup IP dialog box: IP Tab > Discover > Setup. The Discovery Setup dialog box allows users to access detailed and flexible discovery management features. The Discovery Setup dialog includes three tabs: Discovered, Global Settings, and Profiles. Users with IP Discovery Setup privileges can perform the following from each tab: Discovered Tab Add or discover new products Edit product properties Delete products Rediscover products Figure 63. Discover Setup IP dialog box, Discovered tab. Global Settings Tab Configure global discovery settings: o SNMP Users can configure one or more SNMP credentials to be used during discovery; SNMP v1, v2, and v3 are supported. The credentials specified are candidate credentials; the first candidate credential that works for a device is recorded for future use. o Default Passwords Users can configure one or more password credentials to be validated during discovery; read/write login, read/write enable passwords, and enable super user passwords are supported. o OID (Object ID) Filter Users can configure which third-party devices are discovered and included in the topology and network objects list by including or excluding sysobjectids or sysobjectid prefixes. o Preferences Users can configure properties that are used during discovery: ping type, ping port, retry count, discovery log size, adaptive discovery options, enabling password validation on rediscover, address to name lookups, loopback address preference, and whether or not to discard the topology information before the new discovery for the product. Brocade Network Advisor for Data Center Networks 50 of 80
51 Figure 64. Discover Setup IP dialog box, Global Settings tab. Profiles Tab Discovery profiles are an easy way to save a set of discovery parameters, including ranges of addresses to be included or excluded from the discovery process. Profiles can be scheduled to run periodically to discover new devices added to the network. The Profiles tab allows users to: Manage Discovery profiles Generate Discovery reports Display Discovery status log Figure 65. Discover Setup IP dialog box, Profiles tab. Brocade Network Advisor for Data Center Networks 51 of 80
52 Group Management The group management feature within Brocade Network Advisor allows users to create user-defined product groups or port groups. The ability to create a user-defined group allows administrators to perform quick searches and create groups based on their specified search criteria. For instance, a user can search for all Brocade FastIron devices, all routers, or all devices with a specific firmware version and then create a group based on the returned search results. Administrators can also create user-defined groups by manually selecting devices to include in the group. The product group and port group management features include: edit group, duplicate group, delete group, and properties. Brocade Network Advisor also includes predefined system groups that cannot be edited. System groups automatically group devices of the same type together. Groups can be used for multiple purposes, such as for deploying a configuration to multiple products at one time, for selecting products for performance monitoring, for event or inventory reports, or for event policies. In addition to using groups for these purposes, the following modules within Brocade Network Advisor use product grouping features: AOR Configuration Wizard CLI Configuration Configuration Repository Event Action VLAN Configuration Performance Monitor sflow SNMP Trap Recipients Syslog Recipients Event Custom Reports Product Group Management Here are a few helpful examples of product group and port group use cases. Product Group Examples Useful for large topologies. Allows users to narrow search results based on specific criteria and divide a large topology into smaller subgroups. Allows users to group by product and firmware version and then perform a bulk deployment for software upgrades to the group Brocade Network Advisor for Data Center Networks 52 of 80
53 Figure 66. Add Product Group dialog box. Port Group Example A port group can be used to group all ports on telephones. An administrator can then schedule the ports to turn on and off at specific times, reducing power and saving costs during non-business hours. Figure 67. Add Port Group dialog box. Brocade Network Advisor for Data Center Networks 53 of 80
54 Configuration The Configuration Wizard allows users to create and deploy configurations for Brocade IP products. Configuration Wizard Users can launch the Configuration Wizard in one of two ways: 1. From the main menu: Configure > Configuration Wizard. 2. From the toolbar on main desktop: Configuration Wizard icon. The Configuration Wizard dialog box displays all the configurations created by different users. From this dialog box users can add, edit, duplicate, delete, and deploy configurations. Figure 68. Configuration Wizard dialog box. Step 1 Configuration When users select Add or Edit from the Configuration Wizard dialog box, the Configuration dialog box launches. The Configuration dialog box allows users to select a payload for the configuration. A payload is a configuration of product properties (attributes), such as SNMP settings, user account information, software image, ACLs, and more. Configurations applicable to the product are grouped under Product Payloads, and port configurations are grouped under Interface Payloads. Users can create and update configurations using the Configuration dialog box. Figure 69. Configuration dialog box, Step 1 Select Payload. Brocade Network Advisor for Data Center Networks 54 of 80
55 Step 2 Deployment Deployment, which is Step 2 of the Configuration dialog box, is broken out into multiple phases: Deployment Targets. This displays discovered IP products that are visible to the logged-in user. These products/interfaces display based on the payload group selection. Users can select the products, product groups, and IP subnets to which the payloads are deployed. Figure 70. Configuration dialog box, Step 2 Deployment Targets. Deployment Properties. Users can select various options that determine the save, reboot, and deployment properties for the configuration. Deployment Schedule. Users can deploy configurations to selected IP products (targets) immediately or at a scheduled time. Figure 71. Configuration dialog box, Step 2 Deployment Schedule. Brocade Network Advisor for Data Center Networks 55 of 80
56 Step 3 Summary The Configuration Wizard provides a Summary page at the end of the configuration process for administrators to review. Figure 72. Configuration dialog box, Step 3 Summary. CLI Configuration Manager Users with the CLI Configuration privilege can launch the CLI Configuration Manager in one of two ways: 1. From the main menu: Configure > CLI Configuration Wizard. 2. From the toolbar on main desktop: CLI Configuration Wizard icon. The CLI Configuration Manager provides a text-based interface that allows users to enter CLI commands to create configurations and monitoring templates. From this dialog box users can add, edit, duplicate, delete, verify, and deploy the product monitoring/global configurations. Users can deploy these configurations on one or more devices at a time. Verify. Users can test the configuration without deploying it to devices. Deploy. This deploys a device configuration from the CLI Configuration Manager on demand. Required authentication and authorization have to be enabled on the device for deployment. Figure 73. CLI Configuration Manager dialog box. Brocade Network Advisor for Data Center Networks 56 of 80
57 CLI Global Configuration Template From the CLI Configuration Manager, users can access the CLI Global Configuration Template through the Global Configuration tab or the Product Monitoring tab. The template dialog is the same for both global and product monitoring configurations; however, Product Monitoring templates allow read-only commands, while Global Configuration templates allow configuration commands. You can apply these templates to groups of devices and schedule deployment. Figure 74. CLI Global Configuration Template dialog box. VLAN Manager Users can configure L2 VLANs, L3 VLANs, and STP/RSTP, and users can assign Virtual Routing Interface (VRI) addresses using the VLAN Manager. Users can launch the VLAN Manager from the main menu: Configure > VLANs. Figure 75. VLAN Manager dialog box. Brocade Network Advisor for Data Center Networks 57 of 80
58 The VLAN Manager displays existing VLAN configurations and saved VLAN deployments. Selecting the Global View or Product View tab determines how the user views the information by grouped global VLANs products or port groups. The buttons on the right-hand side allow users to access dialog boxes that provide the ability to configure ports, add protocol VLANs, edit existing VLANs, delete VLANs, assign IP addresses to a VRI, and configure different variants of STP/RSTP. Port VLAN Configuration (L2 VLAN) The VLAN Manager Configure Port button launches the Port VLAN Configuration dialog box. From this dialog box, you can add or remove products, add or remove ports and LAGs from corresponding VLANs, and configure tagged, untagged, and dual-mode port operations. Figure 76. Port VLAN Configuration dialog box Add/Remove Ports. Brocade Network Advisor for Data Center Networks 58 of 80
59 Once ports are configured, users can configure VLAN properties and assign a router interface. Figure 77. Port VLAN Configuration dialog box VLAN Properties. Protocol VLAN Configuration (L3 VLAN) The VLAN Manager Add Protocol button launches the Protocol VLAN Configuration dialog box. From this dialog box, users can configure protocol VLANs. Brocade Network Advisor supports IP, IPv6, and IP Subnet protocols. Figure 78. Protocol VLAN Configuration dialog box. STP and RSTP Configuration The VLAN Manager STP button launches the STP/RSTP Configuration dialog box. From this dialog box, users can configure properties for different variants of spanning tree and rapid spanning tree. STP and RSTP (802.1w) parameters are supported. Brocade Network Advisor for Data Center Networks 59 of 80
60 Figure 79. STP/RSTP Configuration dialog box. Virtual Interface IP Assignment The VLAN Manager IP button launches the IP Address for vxxx dialog box (vxxx represents the name of the Virtual Ethernet [VE] Interface or the name of the VRI). From this dialog box, users can assign an IP address to a VRI. Figure 80. Protocol VLAN Configuration dialog box. Brocade Network Advisor for Data Center Networks 60 of 80
61 MPLS Manager Multiprotocol Label Switching (MPLS) provides efficient designation, routing, forwarding, and switching of traffic flow in a network. Brocade Network Advisor allows users to configure and monitor the following MPLS services: Virtual Leased Line (VLL) o VLL Manager: Manages the VLL configuration o VLL Monitor: Fetches VLL statistics in real time Virtual Private LAN Services (VPLS) o VPLS Manager: Manages the VPLS configuration o VPLS Monitor: Fetches VPLS statistics in real time Label-Switched Path (LSP) Configuration o LSP Manager: Configures admin groups, paths, and RSVP LSPs LSP Monitoring o LSP Topology: Users can view and troubleshoot (ping/traceroute) LSPs LDP Configuration o Allows deployment of ad-hoc LDP configuration at the product and interface levels MPLS can be configured in Brocade Network Advisor by launching one of the MPLS management dialog boxes from the main menu: Configure > MPLS > Respective Configuration (VLL, VPLS, VCID Pool, and LSP Manager). VLL Manager The VLL Manager allows users to perform the following tasks: view current VLL instances, view VLL configurations, and add, edit, duplicate, or delete VLL instances. Figure 81. VLL Manager dialog box. Brocade Network Advisor for Data Center Networks 61 of 80
62 VPLS Manager The VPLS Manager allows users to perform the following tasks: view current VPLS instances and peer topologies, view VPLS configurations, and add, edit, duplicate, or delete VPLS instances. Figure 82. VPLS Manager dialog box. LSP Manager The LSP Manager allows users to manage admin groups, paths, and RSVP LSPs. Users can view the topology maps for configured LDP and RSVP LSPs using the LSP Topology view. Figure 83. LSP Topology View dialog box. Brocade Network Advisor for Data Center Networks 62 of 80
63 Change Management Brocade Network Advisor change management features include: Configuration Repository o Displays the configurations for all Brocade IP products o Retrieves the current configuration from the selected device o Sets baselines o Compares different configurations of one product or configurations across different products o Restores a configuration to a product o Deletes the configuration(s) of a product o Exports configurations to a text file o Searches for products with a specific configuration Image Repository o Firmware Image files that are required to run Brocade products can include boot, diagnostics, and management images, depending on the product. For wired products, these image files are imported into the Management Server either automatically, once they are discovered, or manually from Image Repository. o Multiple versions of files can be stored for a product in the Management Server s repository, and these stored images can be deployed to appropriate products through the Configuration Wizard dialog. Scheduled Backup o Users can copy the configuration and software image files from Brocade IP devices on a regularly scheduled basis to the Management Server. o The configurations and images that are backed up are placed in the server repository. The change management icon on the Client Status bar indicates a configuration deviation for DCB, Brocade Network OS, and IOS products within the user s AOR. Figure 84. Status bar with Configuration Deviation Notification icon. The Audit trail information for a Product s config backup is displayed in the Configuration Compare Dialog. Brocade Network Advisor for Data Center Networks 63 of 80
64 Configuration Repository The Configuration Repository dialog box includes three tabs: Product Configuration, Change Tracking, and Configuration Snapshots. Figure 85. Configuration Repository dialog box. Brocade Network Advisor for Data Center Networks 64 of 80
65 Product Configuration Tab From the Product Configuration tab, users can back up, save, restore, compare, view, delete, and export configuration files. Table 2. Available Backup Options Backup Options Discovery Backup Manual Backup Pre-deployment Backup Post-deployment Backup Re-sync Backup Schedule Backup Description Configurations from IP devices are copied into the Management Server s repository during the time of discovery. Retrieve the current configurations from the device manually through the Save Configuration option. When enabled, backups are taken for the device before deploying any payload, using the Configuration Wizard. Since the value for the dopostdeploymentbackup property is set to true in a fresh installation, by default a backup is taken whenever any configuration change is made through Brocade Network Advisor. The backup captured through manual re-synch of the device Automatic backup will occur on a daily schedule. You can also modify the schedule times using the Configure > Product > Schedule Backup option. By default, the scheduled backup occurs every morning at 1:.00 AM. Change Tracking Tab Change Tracking compares the latest backup configuration with the baseline configuration for each product. If the baseline is not specified for a particular product, then the version previous to the latest backup configuration becomes the baseline. If only one version of the configuration file exists in the Management Server s repository, then that version is considered to be the baseline. Figure 86. Change Tracking tab. Configuration Snapshots Tab Output product monitoring commands are available as configuration snapshots in Brocade Network Advisor. To view these snapshots, users can select multiple products from the product tree to display the configuration snapshots that are available for that product. Brocade Network Advisor provides users with the ability to grab the following configuration snapshots: Post-Snapshot Generated after the new configuration is deployed to the device Pre-Snapshot Generated before the new configuration is deployed to the device Brocade Network Advisor for Data Center Networks 65 of 80
66 Manual Generated manually by clicking the Save Snapshot button Snapshot status types: Change Difference between pre- and post-snapshot configurations Error An error was encountered in one or more product(s) during the deployment of the snapshots Not Applicable The product configuration deployment included only a pre-snapshot option No Change No difference between pre- and post-snapshot configurations Figure 87. Configuration Snapshots tab. Figure 88. Configuration Compare Dialog with audit trail. Brocade Network Advisor for Data Center Networks 66 of 80
67 When comparing snapshots, an audit trail panel called Events Associated with Differences shows the Master Log events that occurred between the single product configurations selected. Configuration Policy Management Brocade Network Advisor supports compliance and policy monitoring of configuration changes. Policy monitoring features include: A report that history users can explore Flexibility to specify dynamic targets Best-practice monitors for IP side Monitoring triggered based on events Reporting through Customizable policy for configuration compliance checks Policy Monitor dialog can be launched from both the SAN and IP tabs. On either tab, a user can launch the Policy Monitor dialog from the main menu: select Monitor > Policy Monitor. Figure 89. Policy Monitor dialog box. The monitoring categories are: 1. Fabric Checks 2. Switch/Router Checks 3. Host Checks 4. Management Checks Brocade Network Advisor for Data Center Networks 67 of 80
68 Figure 90. Add Monitor dialog Switch/Router Checks tab. Brocade Network Advisor for Data Center Networks 68 of 80
69 Predefined policy checks are defined for fabrics and VLAN configuration matches (IP only). You can set up customized configuration rules. A configuration rule is a set of logical expressions constructed on the combination of Blocks/Conditions that are run against the latest configuration of the device available in the configuration repository. Performance Monitoring and Management Brocade Network Advisor enables IT organizations to monitor IP networks and fabrics on both a real-time and historical basis. Brocade Network Advisor uses dashboards to reflect thresholds for both individual ports. This allows users to address performance issues proactively, rapidly diagnose the underlying causes, and quickly resolve the issues before the network becomes a bottleneck for critical applications. Furthermore, IT organizations can use analytical and reporting features to study performance trends over time and make changes to maximize asset utilization and plan for future capacity needs. Figure 91. Example IP Performance Dashboard. Here are some performance monitoring and management capabilities: Historical and real-time performance data collection, monitoring, and graphical display; includes support for both performance data (Tx/Rx) and error counters (CRC/sync loss errors, signal losses, and link failures) Top Talker Flow monitors at MAC, IP, and VM levels that determine data flows, which are the major users of bandwidth Policy-based, user-defined performance threshold visibility via performance dashboards Easy navigation drill-down to topology and performance reporting for troubleshooting Multiple open instances of real-time performance monitoring supported by Brocade Network Advisor Brocade Network Advisor for Data Center Networks 69 of 80
70 Adding Dashboard Monitors from Graphs If the user has already defined historical or real-time charts for any products or port measures, those charts can be created as time series monitors and displayed in the Dashboard. Figure 92. Publishing from a real-time graph. SNMP-Based Monitoring Brocade Network Advisor allows users to monitor the performance of IP products through SNMP Polling: Generic and flexible collector framework for polling Management Information Base (MIB) objects Collection of single SNMP MIB or SNMP Expressions Historical and real-time data collection: o User-defined historical collectors (1- to 30-minute interval) o Pre-canned real-time collectors (20-second interval) Dynamic walking capability Retain historical data for up to two years Interactive charting capability and customizable reports and exporting capability (.csv or.png) Brocade Network Advisor for Data Center Networks 70 of 80
71 SNMP Expression Brocade Network Advisor ships with predefined expressions, but users can add, edit, duplicate, and delete expressions. Figure 93. SNMP Expression dialog box. Troubleshooting Drill-Down Users can launch the historical performance dialog box from the dashboard widgets. Figure 94. Drill-down action from Top N or Bottom N Monitor (IP). Brocade Network Advisor for Data Center Networks 71 of 80
72 sflow-based Monitoring sflow-based performance dashboards are supported for IP, VLAN, MAC, and VM flows. Users can launch the Monitor sflow dialog box from the main menu: Monitor >Traffic Analysis > Monitor sflow. sflow is used to capture traffic data in switched or routed networks. It uses sampling technology to collect statistics from the devices. In sflow Monitoring, Brocade Network Advisor collects sflow data from the products discovered through Brocade Network Advisor. It shows detailed user-traffic information, identifies top talkers and in/out ports used by end devices, and performs traffic control on the in/out ports. Users can see the top reports based on different L2/L3/L4 protocols. Users can see group-level and device-level reports, and they can export the report data. The Monitor sflow dialog box displays products with their sflow report availability. Users can select the product or group and launch the report by clicking the View button. Figure 95. Monitor sflow dialog box. Brocade Network Advisor for Data Center Networks 72 of 80
73 Figure 96. Drilldown action to an sflow report from a Top flow monitor. Brocade Network Advisor for Data Center Networks 73 of 80
74 Management Plug-In for VMware vcenter The management plug-in for VMware vcenter is a plug-in for a vcenter server that displays IP connectivity information for managed ESX hosts and network port statistics in the vsphere client. The VMware vcenter plugin enables proactive IP monitoring in the following ways: Provides Brocade Network Advisor users with: o Visibility into the virtual environment with VM, vswitch, and vnetwork connectivity properties o Enables VM flow proactive port monitoring Figure 97. VM storage and datastore properties. Visibility into vcenter generates VM alarms and performance Figure 98. VM Troubleshooting VM Performance tab. Brocade Network Advisor for Data Center Networks 74 of 80
75 Provides vcenter users with: o Visibility into network inventory and IP performance statistics and events Figure 99. Connectivity View. Brocade ADX Series Management All IP management features discussed in the previous sections of this document are supported on the Brocade ADX Series. In addition to these IP management features, Brocade Network Advisor includes Application Delivery management features specific to the Brocade ADX Series only. These features include: VIP Server Manager GSLB Manager SSL Certificate Manager Users can launch Application Delivery management features from the main menu: Configure > Application Delivery > VIP Server Manager/GSLB Manager/SSL Certificates. VIP Server Manager The VIP Server Manager provides the following features: Administrators can view mapping between virtual servers and real servers. Status, statistics, and monitoring capabilities are provided. Users can enable or disable real servers/ports and virtual servers/ports. Figure 100. VIP Server Manager dialog box. Brocade Network Advisor for Data Center Networks 75 of 80
76 GSLB Manager The GSLB Manager provides the following features: Users can efficiently manage policies, sites, and zones by defining them once and reusing them across various controllers. Users can manage all of their GSLB configurations. Figure 101. GSLB Manager dialog box. SSL Certificate Manager The SSL Certificate Manager provides the following features: Provides a centralized management of SSL certificates and keys for Brocade products that are SSL capable (Brocade ADX Series). Allows users to back up certificates and keys by importing them from SSL-capable products. SSL certificates and keys in Brocade Network Advisor can be deployed to SSL-capable products. Provides the option to generate Certificate Signing Requests (CSRs) and to view detailed certificate information, certificate expiry notification, and chaining support, and supports deletion of certificates from the product. Figure 102. SSL Certificate Manager dialog box. Brocade Network Advisor for Data Center Networks 76 of 80
77 APPENDIX Brocade Network Advisor is available with flexible package and licensing options for a wide range of network deployments and for future network expansion. The no-cost Brocade Network Advisor Professional offering is included with any Brocade hardware purchase. Brocade Network Advisor SAN Package Offerings Features SAN Professional SAN Professional Plus (Licensed) SAN Enterprise (Licensed) Max # of Fabrics Type of Fabrics Brocade FOS Brocade FOS Brocade FOS Max # of Ports 1,000 2,560 9,000 (Brocade FOS) 4, 8, & 16 Gbps Switches Brocade 8000/FCOE10-24 Brocade 7800/FX8-24 Brocade Director Brocade DCX-4S Backbone HBA Management Virtualization Support Encryption (BES/FS8-18) Real-Time Performance Historical Performance X DBMS (ODBC & JDBC) X Partner Software Integration X RBAC X Call Home Support X Brocade DCX Backbone X X FICON X X Fully supported X Not supported Brocade Network Advisor for Data Center Networks 77 of 80
78 Brocade Network Advisor IP Package Offerings Features IP Professional IP Enterprise (Licensed Configurable) Max # of Devices 20 5,000 Max # of Ports 1, ,000 Max # of MPLS 0 5,000 Dashboard Discovery of IP Products Topology Manager Fault Management l Change Manager l Performance Manager l Reports l Configuration Manager l MPLS Manager X Traffic Analyzer X MLX Manager X ADP Manager X Third-Party Device Support X Call Home Support X Administration/RBAC X l X Fully supported Partial support Not supported Upgrade Paths In addition to supporting Brocade Network Advisor version upgrades, Brocade Network Advisor provides a nondisruptive path and functional continuity for organizations that are upgrading from Brocade IronView Network Manager (INM) or Brocade Data Center Fabric Manager (DCFM). Refer to one of the following migration briefs for complete details on supported upgrade paths and migration options: Migrating from Brocade Data Center Fabric Manager to Brocade Network Advisor Migrating from Brocade IronView Network Manager to Brocade Network Advisor System Requirements Brocade Network Advisor software and documentation are available via download. The software may run on the following operating systems on a supported host system. For details about the required host systems, consult the Brocade Network Advisor Installation Guide. Brocade Network Advisor for Data Center Networks 78 of 80
79 Table 3. Supported Server OS and Supported Packages in Each OS OPERATING SYSTEM (64-bit) / SUPPORT PROFESSIONAL EDITION PROFESSIONAL PLUS / ENTERPRISE EDITION SAN IP SAN+IP SAN IP SAN+IP SMIA ONLY Windows Server 2003 Std SP2 Yes Yes No Yes Yes No Yes Windows 2008 Std Yes Yes No Yes Yes No Yes Windows XP Pro SP3 Yes Yes No Yes Yes No Yes Windows 7 Professional Yes Yes No Yes Yes No Yes RedHat Enterprise Linux 6.1 Adv Yes Yes Yes Yes Yes Yes Yes SUSE Linux Enterprise Server 11 Yes Yes Yes Yes Yes Yes Yes Oracle Enterprise Linux 6.1 Yes Yes Yes Yes Yes Yes Yes OPERATING SYSTEM (64-bit) / SUPPORT PROFESSIONAL EDITION PROFESSIONAL PLUS / ENTERPRISE EDITION SAN IP SAN+IP SAN IP SAN+IP SMIA ONLY Windows Server 2008 R2 DC, SE, and EE Yes Yes Yes Yes Yes Yes Yes RedHat Enterprise Linux 6.1 Adv Yes Yes Yes Yes Yes Yes Yes How to Obtain Brocade Network Advisor Visit the Brocade Network Management Software page for software information and downloads: The no-cost Brocade Network Advisor Professional offering is included with any Brocade hardware purchase. You can download it from Users can upgrade from a Professional offering by adding a new license key. Users can upgrade from SAN Professional to SAN Professional Plus or SAN Enterprise, or users can upgrade from IP Professional to IP Enterprise. Maximizing Investments To help optimize technology investments, Brocade and its partners offer complete solutions that include education, support, and services. For more information, contact a Brocade sales partner or visit Brocade Network Advisor for Data Center Networks 79 of 80
80 2013 Brocade Communications Systems, Inc. All Rights Reserved. 03/13 GA-FB ADX, AnyIO, Brocade, Brocade Assurance, the B-wing symbol, DCX, Fabric OS, ICX, MLX, MyBrocade, OpenScript, VCS, VDX, and Vyatta are registered trademarks, and HyperEdge, The Effortless Network, and The On-Demand Data Center are trademarks of Brocade Communications Systems, Inc., in the United States and/or in other countries. Other brands, products, or service names mentioned may be trademarks of their respective owners. Notice: This document is for informational purposes only and does not set forth any warranty, expressed or implied, concerning any equipment, equipment feature, or service offered or to be offered by Brocade. Brocade reserves the right to make changes to this document at any time, without notice, and assumes no responsibility for its use. This informational document describes features that may not be currently available. Contact a Brocade sales office for information on feature and product availability. Export of technical data contained in this document may require an export license from the United States government. Brocade Network Advisor for Data Center Networks 80 of 80