Acknowledgement: We would like to thank the following individuals for their assistance.
|
|
|
- Peregrine Johns
- 8 years ago
- Views:
Transcription

1

2 This report was prepared for the Texas Clean Energy Coalition with the support of the Mitchell Foundation. All results and any errors are the responsibility of the authors and do not represent the opinion of The Brattle Group, Inc. or its clients. Acknowledgement: We would like to thank the following individuals for their assistance. ERCOT: Warren Lasher, Julia Matevosyan and Doug Murray NEG: Alex Rudkevich, Evgeniy Goldis GE Energy Management: Mark Schroder and Elizabeth LaRose MISO: Jenell Katheiser (formerly of ERCOT) PSO: Russ Philbrick Xcel Energy: Drake Bartlett TCEC and Vianovo: Blaine Bull, Elizabeth Lippincott, Julie Hillrich, and Kip Averitt Mandell and Associates: Missy Mandell Cynthia and George Mitchell Foundation: Marilu Hastings Connections Consulting: Lyda Molanphy The Lantau Group: Michael Thomas, Tom Parkinson, and Xinmin Hu The Brattle Group: Frank Graves, Sam Newell, Kathleen Spees, Johannes Pfeifenberger, Heidi Bishop, Brendan McVeigh, Marianne Gray, and Metin Celebi. Copyright 2013 The Brattle Group, Inc. i brattle.com
 PSO:")
3 Table of Contents I. INTRODUCTION AND SUMMARY... 1 Overview of Our Results... 3 Important Study Considerations... 4 Guide to This Report... 5 II. MODELING THE FUTURE ERCOT SYSTEM: CONCEPTUAL OVERVIEW... 6 Simplified Steps in the ERCOT Expansion Cycle... 6 Modeling the Impacts of Wind and Solar Variability The Impact of Fuel Price Uncertainty and Quantity Risk III. DISCUSSION OF KEY INPUTS AND SCENARIOS Load Growth, Demand Response, and Energy Efficiency Fuel Prices Generation Options ERCOT Market Rules Wind and Solar -- Costs and Policy Treatment Transmission System Assumptions Storage Technologies Market Rules and the Required Reserve Margin Emission Rules and Carbon Emissions Scenarios IV. RESULTS AND DISCUSSION Reference Case without Required Reserves Reference Case with Required Reserves High Gas Price Scenario ii brattle.com

4 High Gas Prices and Low Renewables Costs Moderate Federal Carbon Rule Stronger Federal Carbon Rule Prices and Emissions Across Scenarios Air Pollution Emissions Demand Response Resources Concluding Observations APPENDIX A - LIST OF RECENT RELEVANT REPORTS APPENDIX B - ADDITIONAL MODEL AND SCENARIO INFORMATION APPENDIX C - MAXIMUM LIKELY ANNUAL WIND AND SOLAR CAPACITY iii brattle.com

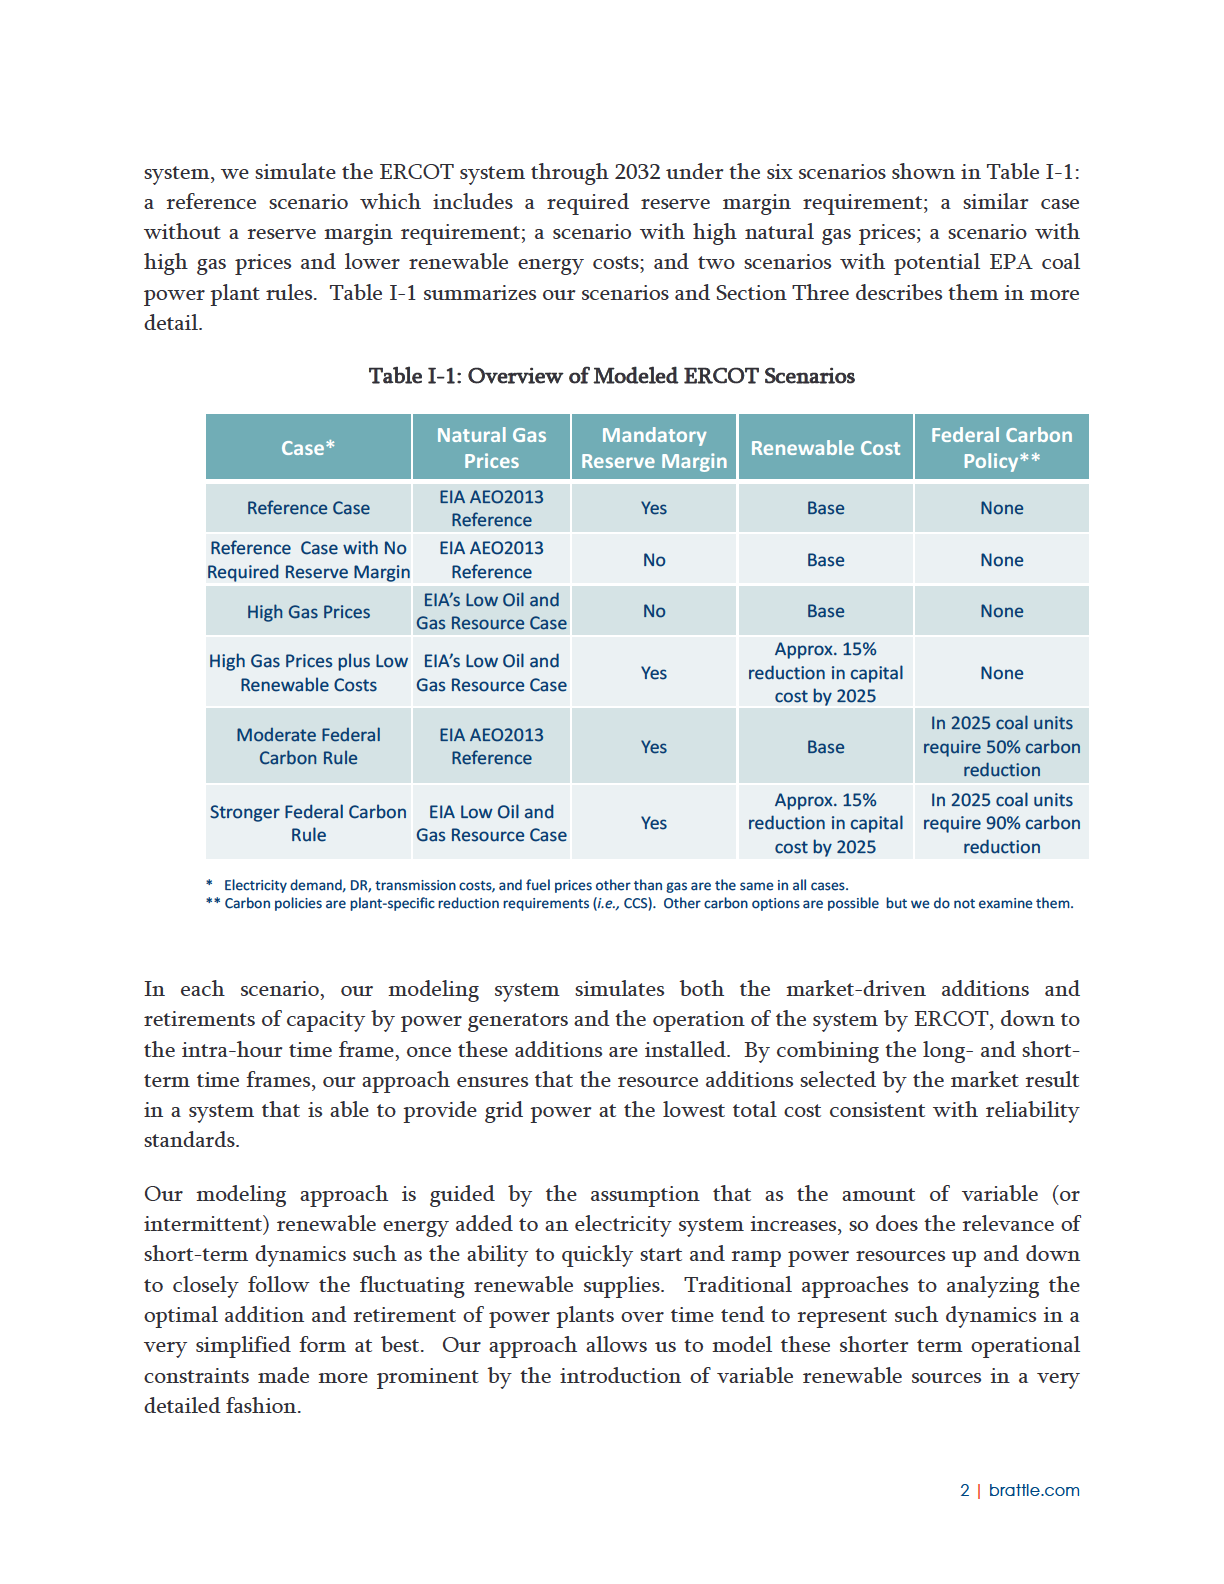
5 I. INTRODUCTION AND SUMMARY All over the world, electric power systems are experiencing the impacts of cheaper renewable energy, expanded unconventional natural gas and oil, new policies to address global climate change risk, and dramatic technical progress on the many facets of electricity control, efficiency, and pricing. These and other factors are prompting large changes in the expansion and management of the electric power grid. In the electrically-independent power system of Texas known as ERCOT, the evolution of the power sector is especially related to the development path for renewable energy and natural gasfired power. With over 12,000 MW of installed capacity, Texas is the largest state producer of wind-powered electricity in the U.S. 1 Wind resources in Texas are more than double the next two largest wind capacity states combined. 2 At the same time, Texas is the leading U.S. producer of natural gas, and the state generates nearly half its electricity from natural gas plants, substantially more than it generates from coal or nuclear power. 3 Texas also has abundant, highquality wind resources and solar energy potential. In June of this year, we produced a white paper for the Texas Clean Energy Coalition (TCEC) exploring qualitatively the short- and long-run interaction between natural gas and renewables in Texas energy future. 4 This preliminary review found that the relationship between natural gas and renewables had aspects that were both complementary and, in some cases, substitutive. We found that over the next two decades the degree to which natural gas or renewables crowd out the other source, as opposed to develop together, was a function of future policies and market design features, technological developments, and the price of electric fuels and resources of all types. In this report, we examine the future of gas and renewable power in Texas analytically through the simulation of several future grid expansion scenarios. Using a state-of-the-art modeling 1 Trip Dogget, ERCOT A Strategic View of the Future, Presented at the GCPA Fall Annual Conference, October 2, AWEA U.S. Wind Industry Third Quarter 2013 Market Report, American Wind Energy Association, October 31, Sam Newell, Bruce Tsuchida, and Anul Thapa, Gas-Electric Reliability Challenges and Possible Solutions in Various ISOs, The Brattle Group, September 30, Dr. Jurgen Weiss, Heidi Bishop, Dr. Peter Fox-Penner, Dr. Ira Shavel, Partnering Natural Gas and Renewables in ERCOT, prepared by The Brattle Group for the Texas Clean Energy Coalition, June 11, In addition, Brattle principals have created several additional reports on ERCOT and other power markets. A partial list of relevant reports is attached as Appendix A. 1 brattle.com

6

7 Our models were run using data on generating units and fuel prices primarily from ERCOT, the U.S. Energy Information Administration, and the Electric Power Research Institute. We supplemented these data with our own analysis and calculations regarding renewable energy costs and installation rates, environmental retrofits, and other specialized assumptions. Our sources are discussed in more detail in Sections II and III. OVERVIEW OF OUR RESULTS For the six scenarios we examined, we found that natural gas and renewables both play substantial roles in ERCOT and together provide all new generation. In the absence of continued or enhanced policy supports, we did find that natural gas generation would be the primary addition of choice though 2032, even with significant declines in the price of wind and solar power. If gas prices remain very low and current wind plants retire, the share of energy from renewables in Texas might decline slightly by However, across the more likely scenarios we analyzed, wind and solar grow from their current 10% generation share to levels between 25 and 43%. Natural gas-fired generation provides all of the remaining incremental generation, adding 12 to 25 GW of new combined-cycle capacity. As expected, the mix of new gas and renewables generation is sensitive to the price of natural gas, cost declines in wind and solar power, and tax and transmission policies. Changes in these factors can cause significant shifts in the mix of future installations, leading to a wide range of plausible generation shares for wind, solar, and natural gas. In addition, our modeling did not incorporate the impacts of gas price uncertainty, slightly overstating future levels of gas plant investment. There has been much discussion concerning the ability of power systems to integrate larger amounts of variable renewable energy sources. Our models found no technical difficulties accommodating much higher levels of variable wind and solar energy, while fully preserving reliability. However, a new ancillary service product was used to integrate larger amounts of variable renewable energy sources. Finally, we found that existing coal units in ERCOT remain profitable and are not retired unless a relatively stringent federal carbon rule is adopted. No new coal plants are built in any scenario. A federal carbon rule requiring 90% capture and storage of carbon would prompt the retirement of most ERCOT coal units, while a 50% capture and storage rule reduces coal plant margins but does not force retirements. Under the Strong Federal Carbon Rule scenario, gas and renewable generation would together replace the energy formerly supplied by coal plants, resulting in almost half (43%) of all 2032 ERCOT energy from renewable generation in this scenario. Our results appear in more detail in Section Four. 3 brattle.com

8 IMPORTANT STUDY CONSIDERATIONS As noted, the purpose of this study is to examine broad patterns of interaction between natural gas and renewable resources over the next twenty years. Our analysis is largely limited to interactions in the wholesale power markets and the large-scale transmission system, with limited representation of the distribution system and the retail sector. Moreover, our results are based on a set of scenarios that are necessarily smaller and narrower than the range of possible price and policy outcomes in the ERCOT region. To process a manageable number of scenarios, we necessarily made a number of assumptions and limited the options evaluated. First, we do not model scenarios with potential major technical breakthroughs, such as the development of significantly cheaper power storage or substantially cheaper carbon capture and sequestration (CCS). While we are certain that the future holds many technological surprises, we did not incorporate any of them into our limited set of scenarios. Second, increases in electric vehicle use or other new sources of demand or customer-sited supply are limited to those embedded within ERCOT s most current net load and sales forecast. Texas utilities have continued to exceed their state energy efficiency goals for almost a decade now and are likely to have surpassed their 2013 goal of 30% reduction in demand growth. 5 A study of efficiency efforts potential has not been conducted since 2008 but there it is likely great additional energy efficiency potential. Greater energy efficiency would reduce the rate of overall energy use as well as peak load growth below the current 1.7% average rate, reducing the need for resources of all types. While strong efficiency policies are certain to have an impact on total new generator additions, and are a fruitful area for further research and policymaking, it is not obvious how these improvements would affect the proportionate balance between gas and renewable resources. Third, the solar PV in our scenarios is best interpreted as utility-scale installations located at a set of sites at which solar irradiation approximately equals the ERCOT average we employ. These PV plants are also assumed to require transmission roughly equivalent to that needed for new fossil generation sited in the same regions. 6 This omits any consideration of the unique impacts of large-scale deployment of rooftop or community-scale PV, which could reduce transmission import requirements, reduce or increase distribution system costs, and significantly change the pattern of distribution system loads and flows. We have also not examined in detail the possibility of co-locating PV with wind in the areas connected through the new CREZ lines. It is 5 Energy Efficiency Accomplishments of Texas Investor-Owned Utilities Calendar Year 2011, Texas Energy Efficiency, prepared by Frontier Associates LLC for the Electric Marketing Managers of Texas (EUMMOT), Interconnection costs are, however, technology specific see Section III. 4 brattle.com

9 possible that locating PV systems there would lead to lower overall transmission costs relative to separate solar and wind sites. Fourth, our examination of demand response (DR) is limited to the large-scale approximations currently employed by ERCOT in its modeling efforts. Research in Texas and other markets suggests that there is substantial additional potential for price-responsive demand using an array of pricing, market, and policy measures. In particular, in the future some portion of rapidlycontrollable DR could substitute for some of the gas-fired combustion turbines added in our scenario results. This remains an area for further study. Fifth, within the bulk power market, we assume that transmission costs do not vary between resources scenarios. Large wind build-outs in West Texas (including the panhandle region) are assumed to require an expansion of the CREZ system when new builds reach a threshold that renders the CREZ expansion economic. For modeling purposes, however, we assume that transmission additions throughout ERCOT are rolled in to statewide postage-stamp transmission tariffs, and are not a factor in generation developers decisions. Sixth, we have not considered the potential addition of concentrated solar power resources to the Texas energy mix. At present, we are unaware of any concrete plans for new CSP projects in ERCOT. Nonetheless, depending on the evolution of its cost as more and more CSP projects go online across the world, it is possible that CSP could play a role in the future ERCOT energy mix, given its ability to integrate some amount of storage and hence achieve a better coincidence with peak demand in electricity systems with heavy air conditioning load such as Texas. Finally, our modeling system does not formally include the impact of uncertainty in the future price of natural gas, nor does it reflect all of the time-variability of solar-electric output. We discuss the effect of these two directionally offsetting considerations further in the final results section below. In a later phase of this research, we hope to use our modeling system to explore the impacts of additional solar and demand response technologies together and in more detail, thus addressing some of the limitations in the present work. GUIDE TO THIS REPORT The remainder of this report is in three major sections. Section II provides a conceptual overview of our approach to projecting power system development. Section III describes the input data and models we employ in more detail. Section IV provides a more in-depth description of the six scenarios we forecast and presents our results and conclusions. 5 brattle.com

10 II. MODELING THE FUTURE ERCOT SYSTEM: CONCEPTUAL OVERVIEW As noted, the project s goal is to simulate, as accurately as possible, the interaction between renewable and gas generators on the ERCOT system through More concretely, this means estimating the amount of power plant capacity by type (gas, solar, wind, coal, etc.) that is either added or retired within ERCOT over the study period. Since capacity additions in ERCOT are primarily driven by competitive forces that yield the prices earned by generators, our challenge is to simulate the behavior of a multitude of competitive generation developers active across the potentially viable fuel and technology options. At the same time, we assume that ERCOT continues to be responsible for ensuring that its grid operates reliably and in conformance with NERC standards. The real-world interaction between the price-deregulated generation market and ERCOT s grid management responsibilities is exceedingly complex, especially over a study period spanning twenty years. The interaction can be abstracted into a repeated series of cycles of the expansion of the ERCOT system. Each cycle can be thought of as the period over which generators look at the current market and decide the next group of plants they are going to build or retire. The system responds by adding new transmission lines (if needed) and ERCOT adjusts its operations to accommodate the new plants, retiring units, and new load growth. The cycle can be further disaggregated into a series of steps explained as follows: SIMPLIFIED STEPS IN THE ERCOT EXPANSION CYCLE At the start of the cycle all the generators and transmission system are existing facilities. ERCOT conducts the market processes and all other operating procedures that together yield hourly and sub-hourly prices for all market products and also ensure reliability is maintained. Generation developers look at power market prices and form their own predictions as to how these prices will change in the coming twenty years (since most new plant investments last twenty years or more, a developer typically forecasts over this period). This incorporates the developers own predictions of how fuel and technology costs will change, how ERCOT market rules will change and their effect on prices, how environmental or tax rules might change, and other factors that influence their predicted revenues. Note that there is substantial uncertainty around many of these factors, yielding a highly uncertain future revenue prediction that is usually reduced to an expected value and either some high and low cases or a formal analysis of the impact of uncertainty. Based on these predictions and uncertainties, generators of all types indicate to ERCOT that they plan to add their chosen amount and type of new capacity at their chosen location. 6 brattle.com

11 ERCOT uses generators indications of future capacity to run simulations of the operation of its power system with these new resources. These simulations indicate to ERCOT where new transmission lines or other facilities to ensure reliable service are needed. Other simulations tell ERCOT whether it must change its operating procedures to ensure reliability. For example, when additional wind is added to the system in a future year, there is more variability in generation from all wind resources than in prior years. This might prompt ERCOT to change its procedures to purchase larger amounts of ancillary services (AS) and/or change the rules in the AS markets. These changes are complex, but could have substantial impacts on the revenues earned by generators who sell ancillary services. Thus, ERCOT s changes to its procedures may result in subsequent significant changes in predicted market price outcomes for many future years. It is worth noting that some of the simulations ERCOT conducts in response to generators announced plans, and some of the changes they implement that affect market prices, don t occur far in advance of the new additions being added. This is due in part to the fact that as market outcomes evolve, the regulatory process may cause ERCOT to determine that new transmission is needed or adjust operation actions. Thus, the best way for generation developers to understand the full impact of all of ERCOT s adaptive responses to the most recent round of generation additions is to observe market price outcomes once the new generators have been added to the grid and ERCOT has adapted. Generators observations of the new market price and revenue outcomes give them an updated basis for looking forward to their next cycle of competitive additions. If their private forecasts predict that they can profitably build and operate one particular type of power plant over its economic life they will probably try to build it; conversely they will stay out of the market. In reality, the expansion cycle in ERCOT and all other markets occurs in several overlapping time frames that span two to three years, not a discrete series of sequential steps. For modeling purposes, however, we abstract the cycle into two concurrent activities, each of which can be modeled as if a full cycle takes one year. These steps are illustrated in flow-chart fashion in Figure II-1 and explained as follows. 7 brattle.com


12
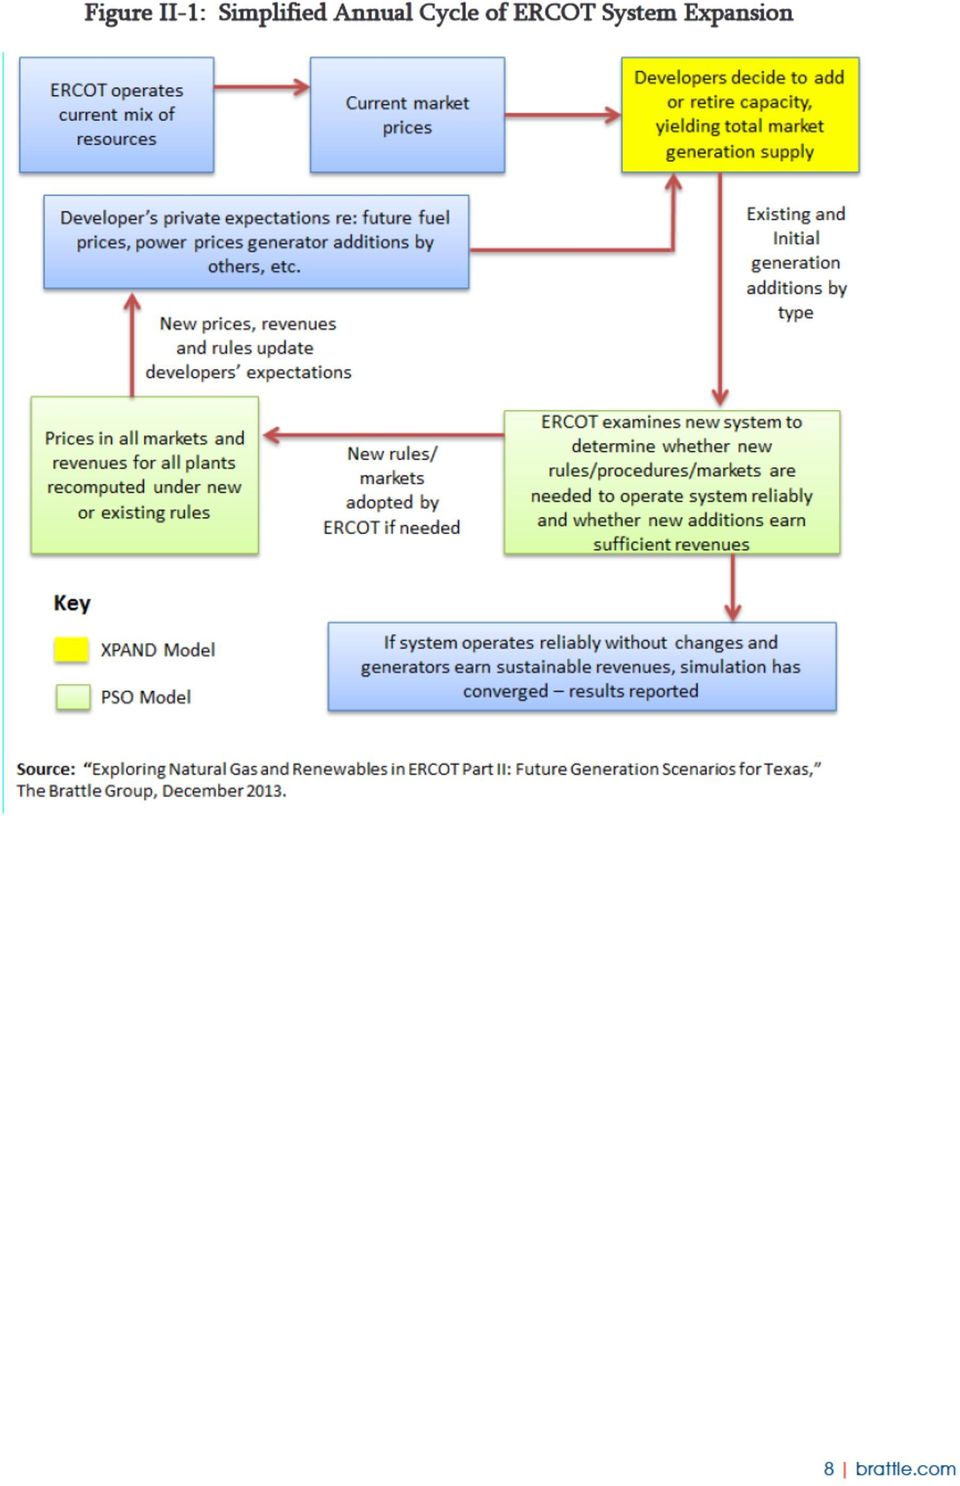
13 The first of these activities is developers annual choices of additions and retirements by location and type. We use a model known as Xpand to simulate the totality of the market s decisions to build and/or retire plants each year. Xpand s underlying logic mimics the market-price-driven decisions of developers for each type of generating plant. Specifically, for a list of new power plant options, Xpand examines the cost of building and operating the plant over its prospective life span with the current and predicted future revenues each plant will earn. (The plant options, including demand response, are discussed in Section III). In any annual cycle, Xpand adds ( builds ) all plants for which the forecasted present value of revenues equals or exceeds present value capital and operating costs over the economic life of the plant. Xpand also checks the profitability of all existing plants and retires any plant whose future predicted revenues do not cover the sum of its future operating costs and required capital outlays. 7 Although plants are often built based on long-term contracts, Xpand assumes that all plants earn revenues equivalent to the spot prices for energy, ancillary services, and (in required reserve margin scenarios) the capacity market. The respective prices are the result of supply and demand bids in the spot markets operated continuously by ERCOT. Xpand contains a simplified market price calculator that balances total supply (existing plus new units) with each year s demand. However, these prices are modified by the second half of the simulation system, the Power Systems Optimizer ( PSO ) model. PSO is a model that simulates the operation of ERCOT s reliability maintenance and market operations on a very detailed basis. When given a level of momentary power demand within ERCOT, forecasted levels of wind and solar energy, and a set of new and existing ERCOT power plants, the model simulates ERCOT s dispatch of all plants and its market-clearing prices in all markets for each intra-hour period 8 within each annual cycle. These detailed simulations are used to check and modify Xpand s annual generation additions and retirements. In effect, PSO asks How well can I operate the system reliably if I add all the generators that Xpand thinks are profitable to add? If I can t operate reliably, what must I do to make the system reliable? When I finish taking actions to make the system operate reliably, what are the resulting series of spot prices in all the markets I operate, and do the various resources on the system earn enough to justify continued operation? PSO provides simulation results that allow the modeler to study these questions and experiment with modifications that eliminate any observed reliability problems and reduce system inefficiencies. To use one purely illustrative example, Xpand may have found that 1,000 MW of 7 As explained earlier, Xpand employs expected value prices over the forecast horizon and therefore does not explicitly account for the impact of price uncertainty on investment decisions. We discuss the impact of uncertainty further in Section III. 8 In this study, the intra-hour period duration used is 10 minutes. 9 brattle.com

14 additional solar resources may be profitable to install in a future year. PSO then may identify problems with maintaining reliability with this level of new solar installations because there is not enough capacity in the system to ramp up with sufficient speed to protect against a blackout at the end of the day when solar output declines rapidly just as residential air conditioning load surges. By examining the PSO results and determining why the reliability criteria are violated, we judiciously alter the need for reserves, either by increasing an existing reserve requirement or perhaps even creating a new type of reserve, which in turn impact the mix of new capacity added by Xpand in a second iteration. For example, we might add an additional 150 MW of fastramping combustion turbines and find that this corrected all reliability problems. If the 150 MW of combustion turbines noted above were not added originally by Xpand, it was because they were less profitable than the other additions found by Xpand at the prices forecasted by Xpand in the absence of combustion turbines. However, if combustion turbines are required to preserve reliability, both models are instructed to require that they be built. Once this occurs, both models will forecast different future price paths, since the set of generators bidding into the markets now includes the new required CTs. Each model is then re-solved to determine the most profitable set of system additions in light of the new prices and presence of the CTs. Xpand s decisions to add and retire plants, once required to include the new reserve requirement, could change significantly. Again for illustration, Xpand may find that the presence of the CTs may have reduced the market-clearing energy spot price during the peak periods of the day for many years to come. This could reduce the profitability of some of the solar additions, since they tend to generate power during the midday peak period. Thus, Xpand may now determine that only 500 MW of solar is now profitable. In theory, the addition of the CTs following the addition of solar plants could also yield another quite different result. The combination of new CTs and new solar could lower energy prices to the point where coal-fired power plants (that must also install new pollution control devices) are no longer profitable to operate. This can occur because these plants are generally expensive to start up and shut down but are also not profitable to operate continuously at the new lower level of prices. When this occurs, Xpand would make the decision to retire these units. This is the kind of interaction between longer and shorter term market dynamics that guided our choice of modeling infrastructure. The overall process of running PSO, modifying the ERCOT system to ensure reliability, recalculating prices, re-choosing generation additions, and re-checking the simulated system dispatch, prices and energy margins (profits) to ensure reliable operations is illustrated in Figure II-1. We refer to this overall process as converging the two models and the final result as a converged simulation of future grid additions and prices. This converged solution mimics the ultimate outcome of the true cyclical interaction of ERCOT and its generation market in the presence of reliability requirements. 10 brattle.com

15 Although Xpand computes generation changes for every year of the study period, for the purposes of our analysis it is not practical to run PSO and converge the two models for every year of the study period. Instead, for each of the scenarios we converge the two models by running PSO for the years 2017, 2022, and 2032 and comparing the results of Xpand and PSO in these three years. The results of each converged year are fed forward into the next convergence cycle. For each scenario, the final result is an evolution of system additions and retirements found to be most profitable, given forecasted prices and policies, consistent with reliable system operation the conceptual equivalent of the outcome a competitive market managed by ERCOT should yield over time. With respect to transmission costs, it should be noted that our modeling system does include many important transmission limits in the current ERCOT grid, but does not ascribe differences in transmission costs between any generation options. 9 In other words, to the extent generation additions require new transmission, this expansion does not influence generators decisions. Similarly, with the exception of one possible increase in CREZ capacity, we do not add or subtract any new transmission constraints. One final implication of this treatment is that the additional cost of new transmission lines is not calculated. While all of these assumptions are simplifications, we believe they are reasonable in the context of this analysis. MODELING THE IMPACTS OF WIND AND SOLAR VARIABILITY, AND UNCERTAINTY The natural variability of wind and solar energy introduces special challenges into our simulation effort. These sources of energy can vary significantly and unexpectedly within a matter of minutes, requiring ERCOT to respond via some combination of new prices (if the changes can be reflected in bids and offers in ERCOT s very short-term markets) and/or other actions, such as ramping fast-response generators up or down. Our simulation of the short-term ERCOT market operates on a period of ten minutes, which does not fully capture the second-by-second variation, and ERCOT s responses to these variations. We were fortunate to be able to access multiple sources that allowed us to incorporate wind variability and uncertainty in a detailed manner. In brief, we drew on actual one-minute 2012 wind production for all of ERCOT as well as hourly forecasted and average actual wind generation for each region of the system (Southern and Northwestern ERCOT). For wind resources in the Texas panhandle, we received similar data from SPS applicable to this region. These data were sufficiently detailed so as to allow our models to reflect the impacts of wind 9 See Appendix B for further details on the transmission constraints modeled in PSO. 11 brattle.com

16 variability and uncertainty. To provide a realistic albeit conservative 10 representation of the wind resource geographic diversity in ERCOT, new wind capacity developed by the Xpand model was allocated to the three wind regions (Southern, Northwestern and Panhandle) following rules that aim at increasing resource diversity while maintaining high capacity factors. Basically, in the three scenarios with high levels of renewable penetration we assumed that total Northwestern and Panhandle wind capacity would have similar magnitude, and that Southern wind capacity would not exceed 5,400 MW. For all years of the study we made the conservative assumption that wind forecasts would have the same accuracy level that they exhibited in While forecasts have significantly improved over the past few years, and we expect the trend to continue, we did not account for further improvements, which means we may overstate future forecast error. As detailed in the rest of the report, the ERCOT system with wind, solar and gas expansion was able to cope with the increased wind uncertainty without any reliability issues, even under very high renewable penetration levels and with a potential overstatement of wind forecast error. In contrast to wind data, the solar data we received from ERCOT provides only the average hourly output across 34 locations within ERCOT for one representative year. 11 Regardless of the periodicity of our model, this hourly average data for a year homogenizes significant inter-year and intra-hourly variation and therefore induces our model to require less in the way of ERCOT system response. This translates into a possible reduction in the additions of fast-ramping resources primarily natural gas generators in our results for scenarios that show significant PV additions in the future. Conversely, where PV additions are not substantial the impact of this data homogenization is insignificant. THE IMPACT OF FUEL PRICE UNCERTAINTY AND QUANTITY RISK Xpand (and PSO) assumes that all revenues (and associated costs) are known with certainty at the time a decision is made to build or retire a plant. This likely creates some bias in favor of plants with more variable costs relative to fixed upfront capital costs, since in reality variable operating costs are subject to substantial uncertainty. In the present context, this translates into a small inherent boost to new gas-fired generation. In reality, gas-fired power plant developers assume the risks that fuel and power prices will change so as to make their plant no longer economic, and therefore no longer able to sell in deregulated power markets. Since most plant developers are risk-averse, i.e., attach a cost to the possibility that their plant may not earn profits during 10 The representation of geographic diversity is probably understated since in modeling the wind resource we scaled 2012 generation levels, effectively assuming that new wind capacity would not increase resource diversity within the region. 11 More precisely, we used one average solar output profile based on 34 different hourly profiles compiled by ERCOT, to capture the benefits of geographic diversity in the solar resources. 12 brattle.com

17 future years, this hidden cost causes some developers to forego adding new units even when their new unit is forecasted to be profitable at the average, or expected, future level of prices. 12 Xpand does not incorporate this risk aversion into its capacity additions logic. Instead, it behaves as if developers have no risk aversion, and adds capacity whenever expected revenues exceed expected costs. These expected costs are determined by the expected levels of gas prices and other input variables and the calculations of power prices by our models. The omission of this risk premium creates a bias in our results in favor of greater natural gas plant additions than would be the case in a market where developers are significantly risk-averse. There is a similar, and directionally offsetting, output risk associated with renewable energy. Just as conventionally-fueled power plants bear the risk that fuel prices will rise, wind and solar developers bear the risk that wind speeds or solar radiation will be below-average for significant time periods (and gain when the converse occurs). If production is significantly below average, the plant developer, off-taker, or other third party bears a substantial risk that they will have to procure additional power from the marketplace at prices much higher than their own cost of production. In sum, there are several uncertainty costs that our models simply do not capture. Because these are somewhat offsetting, and are themselves of uncertain size and impact, we believe our results remain useful and reasonably accurate. Moreover, when individual scenario results are provided later in this report, these considerations can be factored in qualitatively. However, in view of these uncertainties it is appropriate to view our results as illustrating a point within a range of outcomes that slightly disfavors natural gas additions if the cost of fuel price uncertainty is large at the time of investment commitment and wind or solar if it is the cost of output uncertainty that is large at that time. The obvious corollary is that financial market products or conditions that lead to lower-cost hedges for fuel prices or renewable outputs, or technological changes that lower renewable output uncertainties, reduce the cost of uncertainty for their respective generator types and therefore the band of uncertainty around our results. 12 It is possible that the power plant developers have hedged against fuel price increases and/or hedged against changes in market prices. These hedges may be purely financial instruments or long-term physical contracts. Regardless of their form, hedges have a cost. The cost of these hedges may be thought of as the cost of removing uncertainty or risk aversion. Either way, this cost is not included in our models. 13 brattle.com

18 III. DISCUSSION OF KEY INPUTS AND SCENARIOS Our scenarios revolve around changes in technology and fuel costs, market rules, and changes in federal environmental policies. To better understand these scenarios, it is first helpful to examine some of the options and data we have analyzed and made a part of our reference case. LOAD GROWTH, DEMAND RESPONSE, AND ENERGY EFFICIENCY All our scenarios begin with ERCOT s most recent load forecast from its 2013 Long-Term Demand and Energy Forecast (LTDEF), which shows growth of approximately 1.71% in peak load and 1.68% in sales through We extend the forecast through 2032 at a rate of 0.95% and 0.98% for peak load and sales, respectively, based on a 5-year compound average growth rate of for both energy and peak. Among other things, this approach is equivalent to assuming that no significant new energy efficiency or demand response policies affect ERCOT s load and sales growth during the study period, nor that upward price increases reduce demand via market forces. While this may not be the most likely outcome over the study period, the main focus of our work is on the distribution of supply-side additions rather than the division of growth between supply and demand measures. Consistent with this approach, we begin all scenarios with an assumed constant 500 MW of existing price-based demand response (activated at $557 per MWh) and 1,222 MW of interruptible load activated at the System-Wide Cap price. We allow a limited amount of new demand response to compete equally with new generation additions. Specifically, we allow the market to add 1,500 MW of industrial demand response and 2,000 MW of residential/commercial demand response each year as an alternative or complement to other resources. To be deemed economic, new demand response must run between 75 and 100 hours per year at a price of $530 per MWh for industrial DR and $1,100 per MWh for industrial and commercial loads. Demand response may participate in any market for which it is qualified, which excludes the real-time energy market at present. 14 FUEL PRICES We have generally adopted the most recent fuel price forecasts from the U.S. Energy Information Administration (EIA) and our assumption for coal, gas, oil, and nuclear fuels. These forecasts are summarized in Table III-1. As can be seen, coal and nuclear prices are expected to be essentially constant in real terms in all our scenarios, but real natural gas prices increase at an average annual rate of 2.9% and 4.0% in the reference and high gas cases respectively. EIA s forecasted ERCOT Planning Long-Term Hourly Peak Demand and Energy Forecast, ERCOT, December 31, See Load Participation in the ERCOT Nodal Market, ERCOT 6/27/ brattle.com

19 gas prices at Henry Hub are adjusted to reflect Texas delivery locations using historical basis differences for a sample of ERCOT delivery locations. Table III-1: Overview of Fuel Price Assumptions Fuel 2012 Price ($2012) Real Average Compound Growth Rate, Source Coal Natural Gas $1.85 (Lignite) $1.99 (PRB) $1.67 (Petroleum Coke) Constant Real Prices $ $3.49 (Monthly) Reference: 2.9% High: 4% SNL Energy Delivered Fuel Prices and 2013 AEO SNL Energy 2012 Historical Texas Hub Prices and EIA 2013 AEO Biomass $2.50 Constant Real Prices Authors assumption Nuclear Fuels $0.45 Constant Real Prices Authors assumption As shown in Figure III-1 below, our reference case natural gas prices are quite similar to ERCOT s, except that ERCOT s current reference prices are higher than current market prices. Nonetheless, the differences between our reference prices and ERCOT s are unlikely to introduce significant differences in our results. Our high-price scenario is significantly below ERCOT s high price case, but still represents more than a doubling of real natural gas prices over the study period. The high-priced gas case in Figure III-1 is used to create the high-gas-price scenarios we simulate. 15 brattle.com

20 Figure III-1 GENERATION OPTIONS Table III-2 lists the technology options we assume the market uses to select new capacity additions. The attributes for each capacity option are derived from a variety of sources, including ERCOT, EIA, and other sources. Note that advanced CC units are assumed to become available in 2020 and that all capital and operating costs are assumed to decline slightly over time to reflect learning curve effects and other technological improvements. With a few exceptions described below, the performance and cost attributes of existing and planned generating units was based on ERCOT s Interconnection: Long-Term Transmission Analysis, which was performed with the support of the U.S. Department of Energy (DOE LTS) LONG TERM STUDY - _Draft_V_1_0.pdf. 16 brattle.com

21 With regard to fixed operations and maintenance (FOM) costs for existing steam units, in place of ERCOT assumptions we assumed that FOM rises by $600 per MW per year of operation based on EPA estimates. 16 As noted in Section III, increased FOM and variable O&M (VOM) due to the cost of environmental retrofit installations are based on Brattle s internal analysis. Table III-2: Summary of New Generation Option Attributes In addition to the capital costs specified in Table III-2, generating units must also face electrical interconnection costs. Fossil-fueled generating units are charged $30 per kw while renewable generators are charged $100 per kw for interconnection costs. These costs remain constant over the modeling horizon in real terms. 16 Adapted from IPM 2006 Base Case Assumptions, Section brattle.com
22 Existing non-nuclear units are retired as specified in ERCOT s data files, with the exception of wind power generators. Nuclear units are forced to retire after 60 years of operations, based on a 40 year lifetime plus 20 year life extension. The physical lives of solar PV and wind plants were assumed to be 30 and 20 years, respectively. Natural gas-fired simple and combined cycle units were not given a fixed life, but are assumed to require a turbine overhaul with a cost equal to 45% of the unit s initial capital cost, adjusted for inflation, to continue operating past 30 years. If the simulation system finds this upgrade to be uneconomic, the unit is retired. New nuclear were allowed to be added with 2025 as their earliest commercial operation date, but this option was also never selected. New hydroelectric plants were not considered. ERCOT MARKET RULES Our models reflected ERCOT s current energy market, with the current PBPC approach to scarcity pricing. The system s real time price caps are set at $5,000/MWh until 2014, $7,000/MWh until 2015, and then $9,000/MWh. 17 The initial level of required ancillary services are: Regulation reserves assumed to be 600 MW for regulation up and 600 MW for regulation down Responsive reserves are 2,800 MW, of which 1,400 MW can be met by demand-side resources, so only model 1,400 MW of responsive reserves from generating units Non-spin reserves are assumed to be 1,500 MW. In scenarios with high levels of wind and solar penetration, 18 the ancillary service requirements were adjusted to maintain reliable system operation under increased variability and uncertainty. Moreover, we found that to ensure reliable intra-day operations the system would have to set aside a certain amount of capacity that can be committed intra-day to cover for day-ahead renewable forecast errors. We modeled this as a day-ahead requirement for a new ancillary service we term Intra-day Commitment Option ( ICO ). The requirement is a function of dayahead forecast uncertainty, and can be met by spinning capacity as well as the capacity of offline units that can be started intra-day CC, CT or IC. While we modeled the ICO requirement, we note that potentially a similar effect may be attained in practice without an explicit ancillary service requirement. For example, market participants may set aside capacity from the dayahead market to offer it into the real-time markets in situations of high day-ahead renewable 17 PBPC dummy units are able to meet the responsive reserve and allow real generating units to meet energy needs. This mimics the process used by the SCED system in ERCOT. 18 These are the High Gas Prices, the High Gas Prices and Low Renewables Costs, and the Stronger Federal Carbon Rule scenarios. 18 brattle.com
23 forecast levels (which may lead to scarcity and high real-time prices if the high day-ahead forecast do not materialize). Also, forecast improvements, increased resource diversity and changes to the day-ahead timing may help reduce the impacts of renewable forecast errors. A more detailed discussion of operational assumptions is provided in Appendix B. WIND AND SOLAR -- COSTS AND POLICY TREATMENT Our scenario with lower renewables costs creates a lower overall capital cost trajectory for wind and solar energy, as shown in Figure III-2. This trajectory is based on recent cost projections by the Electric Power Research Institute (EPRI) as well as the authors analysis of wind and solar cost trends. From the range of future costs estimated by EPRI, we employ a 2015 value towards the low end of the range and reduce costs by 0.25% per year. based on EIA s most recent estimates. We employ a 2015 PV cost near the high end of EPRI s range and reduce costs 2.6% per year, much less than recent history but a reasonable going-forward forecast. As the figure shows, the low-cost scenario represents about a fifteen percent reduction in solar and wind capital costs in 2032, which isless than the cost declines embedded in the reference case between now and 2032 for solar. Nevertheless, as shown in the results section, even this relatively modest change in cost is impactful. The policy treatment of renewable energy resources is also a significant factor in expansion decisions. We first assume that the Texas renewable portfolio standard (RPS) rule currently in place remains unchanged through 2032, treating its goals as a firm requirement. Our models also assume that the current wind PTC is available to units online by the end of 2015 based on recent IRS guidance. Purely to create a mid-course assumption regarding the continuation of the wind PTC, we assume the tax credit will continue in its present form at a reduced rate over a four-year phase-out period, declining 25% per year Similarly, we assume that the current 30% investment tax credit for PV plants is available to all Texas additions through 2016 and then decreases to 10% for the remainder of the period. As noted in the introduction, our models do not implement any distribution-system-related changes or costs related to PV. As a result, our PV additions are best interpreted as utility-scale solar installations rather than rooftop systems. We assume these solar PV units are located across the ERCOT footprint. New wind units could be constructed in the Southern ERCOT region, the Northwestern Texas CREZ region, and the Panhandle, but total wind installed in the Southern region was limited to 5 GW total based on ERCOT s guidance. Finally, the relatively new supply chains installing wind and solar plants and the requirements to adjust market processes as variable resources grow prompted us to place limits on the maximum amount of wind or solar the market could add in one year. Based on our own analysis of wind and solar growth patterns, reproduced in Appendix C, we limit solar additions to a maximum rate 19 brattle.com
24 of growth of 3000% during their first year of installation and 300% all subsequent years. 19 In addition, aggregate solar installations are limited to 50% of maximum coincident hourly load, a limit of 24.3 GW which is not reached in any of our scenarios through Wind additions are similarly limited to 3,000 MW/year statewide. Figure III-2 TRANSMISSION SYSTEM ASSUMPTIONS ERCOT was simulated as four interconnected subregions: Central ERCOT, the South Region, the Northwestern Texas CREZ Region, and the Panhandle. In PSO we also model the import limits into the major metropolitan areas: Houston, DFW, San Antonio and Austin. 19 Although 3000% may sound like a large addition, it is operating off a small base of MW as of Q2 2013, according to the SEIA/GTM Research Solar Market Insight. A 3000% increase would amount to approximate 4,000 MW, an amount that large solar markets have been able to add in some markets around the world. 20 brattle.com
25 It is important to note that we assumed a CREZ-like rate treatment for the recovery of transmission expansion costs in our analysis. We assumed that transmission expansion costs were recovered via a system-wide equal volumetric tariff on all transmission in ERCOT. Under this treatment, the costs of these transmission upgrades were not charged to the new generation sources seen as the primary cause of the upgrade. Were we to change this treatment, it is likely that the new sources required to pay for these upgrades (primarily new wind plants) would be built significantly less frequently in our simulations, tilting new construction towards the next cheapest alternatives, primarily gas and solar additions close to loads. STORAGE TECHNOLOGIES We have not modeled storage as an available large-scale energy option for ERCOT developers. This decision does not reflect a view that storage has no near-term future in the power industry. Instead, our preliminary research simply found that, in the range of [deterministic] natural gas prices contained in our scenarios, large-scale storage was unlikely to be a market-selected option through We believe it is much more likely that certain storage technologies may provide competitive ancillary services during the study period, including regulation. This creates a slight bias in favor of natural gas technologies, which are the primary alternative source of fast-acting regulation. However, the difference is limited to about 1300 MW in regulation, which is the largest amount of this service required in any of our scenarios. MARKET RULES AND THE REQUIRED RESERVE MARGIN Our simulation of ERCOT s market represents an attempt to capture market outcomes in a series of complex, interconnected markets, all operated in accordance with many state and federal policies. We begin the simulation with the Reference Case with No Required Reserve Margin where all market rules and structures as they are today and modify them in future years only if the models indicate that changes are necessary to preserve reliability. We note that ERCOT continues to improve its market structure, and is now planning to retool its ancillary services (AS) market, among other changes. We believe our modeling approach is consistent with periodic market-driven incremental improvements made by ERCOT, such as the planned AS market updates. Almost all other scenarios deviate from the above by including a required reserve margin. In these simulations, our models are programmed to require that capacity sufficient to maintain a 13.75% reserve margin operates in every year. Although there are a variety of mechanisms for ensuring required reserves, we employ the following simplified approach: when (in the absence of a capacity market) revenues in the energy and ancillary services markets are not sufficient to 20 In addition, most forms of pumped storage and compressed air energy storage require a type of geographic site that is not commonly found in Texas. 21 brattle.com
26 induce this reserve margin, Xpand implements the lowest-cost solution to adding the required level of capacity resources. This approach does not in any way constitute an endorsement of this particular means of increasing the reserve margin relative to other options; it is merely the approach most easily modeled in our framework. EMISSION RULES AND CARBON EMISSIONS SCENARIOS In all scenarios we assume that state and federal environmental rules pertaining to power generators remain in place. In particular, the EPA Mercury and Air Toxics Rule (MATS) is enforced by 2016, so that by that date all coal and oil units must install or have installed some combination of scrubbers, active carbon injection (ACI) or particulate controls ( Baghouses or upgraded ESPs) as well as some form of NOx controls (SCR or SNCR). The costs of these pollution controls are in addition to unit-specific base case O&M costs provided to us by ERCOT and impact both the fixed and variable O&M costs of coal units. Actual estimates of the incremental costs of adding these pollution controls are based on a separate Brattle Group analysis of the impact of the EPA MATS rule on coal-fired generators. This analysis begins with retrofit technology cost assumptions from EPA s Integrated Planning Model (IPM) and a 2011 EEI study and examines each Texas plant s expected cost of compliance with the MATS rule. 21 In all our scenarios, these compliance outlays alone are not significant enough to trigger any economic retirements of the existing ERCOT coal fleet. Our final two scenarios examine two possible forms of an EPA rule requiring Carbon Capture and Sequestration (CCS) on all new and existing ERCOT coal-fired plants. In Scenario 5, we apply all reference case assumptions as well as a rule requiring coal plants to capture and sequester 50% of their CO2 output by the year Scenario 6 is the reference case plus an assume rule requiring 90% CO2 capture. The costs of adding CCS to plants at both levels is derived from Department of Energy s ( DOE ) National Energy Technology Laboratory (NETL) report 22 and is assumed identical across all ERCOT plants. 21 EPA IPM Base case V4.10 (Aug 2010). 22 DOE/NETL-401/110907, Carbon Dioxide Capture from Existing Coal-Fired Power Plants. 22 brattle.com
27 IV. RESULTS AND DISCUSSION We begin this section by discussing the main features of each of the six scenarios. Because the primary focus of our work is the pattern of capacity additions and the interaction of fuels, we devote most of this discussion to new installations and the generation mix. Following these individual discussions, we compare certain key scenario metrics, such as prices and carbon emissions, across all six scenarios and offer concluding observations. REFERENCE CASE WITHOUT REQUIRED RESERVES Our Reference Case without a required reserve margin is the scenario that reflects all current practices and policies, including the absence of a required reserve margin in ERCOT. 23 Although we label this scenario reference, it is not designed to represent our predicted or most likely scenario only a starting point for our analysis. It is also worth noting that all scenarios have identical sales, peak loads, and baseline DR, so that all differences between scenarios are almost entirely the result of differences in the mix and operation of market resources. Table IV-1 and Figure IV-1 show the evolution of installed capacity from the present until On this and all other charts in this section, current (2012) installed capacity by type is shown in solid colors and new additions ( ) are in shaded colors, all indicated in the legend on the right side of the figure. In this scenario, a total 17.2 GW of older steam turbine as well as northwestern Texas wind retires through Meanwhile, total net capacity grows by about 13.3 GW (16%), to 96.9 GW, meaning that 30.4 GW of total new construction occurs. 23 As a reminder, we treat the Texas RPS goals as firm requirements, not optional renewables levels. However, in most scenarios and most years the RPS targets, which begin at 5 GW total installed renewables in 2015 and increases to 10 GW total in 2025, are rarely binding constraints. In other words, our projections indicate that the market would install at least these levels of total renewables even without a requirement. 23 brattle.com
28 Table IV-1 Existing and New Generating Resources Reference Case without Required Reserve Margin (MW) Growth, Existing Cumulative Cumulative Cumulative Cumulative Cumulative Cumulative Total Total Retirements New Builds Retirements New Builds Retirements New Builds Total MW % Nuclear 5, , , , % Coal 18, , , , % Steam Oil/Gas 12,616 1, ,275 1, ,811 7, ,578-7,038-56% Combined-Cycle Gas 31, ,482 35, ,470 41, ,302 50,945 19,302 61% Combustion Turbine Gas 4, , , , % Internal Combustion Gas % Hydro % Biomass % Wind - Northwest 8, ,681 1, ,713 8, ,621-93% Wind - Coastal 1, , ,986 1, ,186-75% Wind - Panhandle 0 0 3,000 3, ,000 3, ,000 3,000 3,000 N/A Solar ,867 5,897 5, % TOTAL 83,650 1,776 8,757 90,631 3,208 14,745 95,187 17,190 30,444 96,903 13,254 16% 24 brattle.com
29 Figure IV-1 Installed Capacity by Type Reference Case without Required Reserve Margin As shown most clearly in the table, about two-thirds this new capacity over 19 GW is gas combined cycle, with only a handful of new gas combustion turbines constructed. Almost 4 GW of additional wind is added, nearly all of it in the Panhandle, where onshore wind resources are especially strong and better correlated with ERCOT s peak loads. Meanwhile, nearly all of the existing wind capacity reaches the end of its assumed 20-year life and in this scenario the market does not find it economical to replace this wind capacity right away. Interestingly, total PV additions through 2032 are almost 6 GW, exceeding wind additions but 100% of these additions occur starting in 2028, when our forecasts show that these resources become economic with only a 10% ITC at then-projected wholesale power prices. The simulation s selection of gas, PV and Panhandle Wind reflects relatively low gas prices and PV prices that have declined to become competitive at wholesale price levels. In addition, Texas PV plants have a peak output that more closely matches the load and price patterns in ERCOT than Northwest wind. Under these conditions, as the unit cost of solar capacity approaches the unit cost of Northwest wind turbines the simulated market tends to choose PV. 25 brattle.com
30 In this scenario there are no significant new additions or retirements of coal-fired capacity. The one coal plant addition shown in our results is the Sandy Creek station, a 925-MW plant that became operational during Obviously, this is now an actual unit, and no other coal additions are projected in this scenario. Foreshadowing our remaining findings, this is true in all six scenarios. Only one coal unit, at 395 MW, is retired in this case. One of the largest changes in the market is the retirement of 7 GW of oil and gas steam turbine power plants, all of which are effectively replaced by gas CCs. However, as we show in the next scenario, many of these retirements do not occur with a reserve margin requirement. The results of this capacity addition pattern on the percentage of energy supplied to the market by type is shown in Figure IV-2. Starting from the bottom of the chart, nuclear generation is essentially constant through a common feature in all our scenarios since the total size of the market increases each year, this means that its share declines slowly as total generation grows. Following the 2013 increment from Sandy Creek, the same is true of coal generation; only one small coal unit retirement in this scenario and a lower market share over time. Figure IV-2 Generation Mix by Type Reference Case without Required Reserve Margin 26 brattle.com
31 Total estimated renewable generation predominantly wind declines about 2,600 GWh (about 9%) between 2012 and Within this decline, however, new solar rises quickly from and biomass power rises steadily throughout the period, from only 68 GWh of generation in 2012 to over 13,000 GWh in As the market grows, renewables share declines and gas generation takes virtually all growth in generation, particularly prior to 2027, ending at a roughly 50% energy share. Representative unit margins are shown in Table IV brattle.com
32 Table IV-2 Average Simulated Unit Margins Reference Case without Required Reserve Margin Results Results Results Unit Energy Margins (2012$/kW-year) Unit Energy Margins (2012$/kW-year) Unit Energy Margins (2012$/kW-year) Energy-only Energy and Ancillary Services Energy-only Energy and Ancillary Services Energy-only Energy and Ancillary Services Coal $ $ Coal $ $ Coal $ $ ST $28.96 $66.90 ST $1.36 $13.77 ST -$2.23 $32.87 CC $60.88 $62.59 CC $21.32 $22.83 CC $7.15 $11.69 CT $35.34 $56.48 CT $9.87 $17.71 CT $1.67 $50.95 IC $63.38 $66.32 IC $25.75 $27.13 IC $6.22 $10.70 WT $ $ WT $ $ WT $0.00 $0.00 PV $ $ PV $ $ PV $ $ New Coal $ $ New Coal $ $ New Coal $ $ New CC $97.58 $97.91 New CC $72.61 $72.93 New CC $61.31 $61.60 New CT $48.45 $70.22 New CT $8.64 $30.32 New CT -$0.76 $63.26 New WT $ $ New WT $ $ New WT $ $ New PV $0.00 $0.00 New PV $0.00 $0.00 New PV $ $ brattle.com
33 The unit margins shown in this table are all capacity-weighted average dollars per kilowatt-year by type and distinguish between new and existing units. The distinction between new and existing units is important because the two classes have different heat rates and operating characteristics and therefore different earnings. Unlike Table IV-1, however, the wind lines in this table are the capacity-weighted average of all new and installed units in all locations. The energy market revenues units earn as computed by PSO are shown in two columns for each year, energy market margins and ancillary services margins. The margin results help illustrate the reasons why capacity installations follow the pattern shown in Figure IV-1. CTs earn essentially all of their margins in the ancillary services markets, as expected. Wind turbines are shown as having zero margins in 2032 simply because all wind units in existence in 2012 have retired. REFERENCE CASE WITH REQUIRED RESERVES The results of our reference case with required reserves are shown in Table IV-3 and Figure IV- 3. As expected, the addition of a required reserve margin makes a few significant changes to the results of the first reference case, but the basic character of our findings is quite similar. Most significantly, about 2,700 MW of the older steam turbine units no longer retire, as the capacity payments they receive are sufficient to keep them operating even when they receive virtually no energy or ancillary services margins. In addition, about 2,000 MW of additional combined cycle plants, 260 MW more CTs, and 500 MW more Panhandle wind is constructed by Net total 2032 installed capacity increases by 18.2 GW, 5 GW more than the reference scenario, indicating the intended effect of the reserve margin policy. 29 brattle.com
34 Table IV-3 Existing and New Generating Resources Reference Case with Required Reserve Margin (MW) Growth, Existing Cumulative Cumulative Cumulative Cumulative Cumulative Cumulative Total Total Retirements New Builds Retirements New Builds Retirements New Builds Total MW % Nuclear 5, , , , % Coal 18, , , , % Steam Oil/Gas 12, , ,703 4, ,265-4,351-34% Combined-Cycle Gas 31, ,363 35, ,962 41, ,328 52,972 21,328 67% Combustion Turbine Gas 4, , , , % Internal Combustion Gas % Hydro % Biomass % Wind - Northwest 8, ,681 1, ,713 8, ,621-93% Wind - Coastal 1, , ,986 1, ,186-75% Wind - Panhandle 0 0 3,000 3, ,000 3, ,502 3,502 3,502 N/A Solar ,365 5,395 5, % TOTAL 83,650 1,034 8,899 91,515 2,316 15,498 96,832 14,503 32, ,877 18,228 22% 30 brattle.com
35 Figure IV-3 Installed Capacity by Type Reference Case With Required Reserve Margin There are several interesting aspects of the incremental expansion and retirements triggered by the required reserve margin. In contrast to the common assumption that reserve requirements tend to favor new CT construction, this requirement causes existing steam units to remain in operation and additional Panhandle wind to be built. This outcome is obviously sensitive to the cost of maintaining old Texas steam turbines versus the cost of new CTs and Panhandle wind. Conversely, cumulative installed PV capacity declines by 500 MW versus the reference case. This is due to the fact that a required reserve margin reduces prices during the peak period when PV generates most of its energy. Annual generation percentages, shown in Figure IV-4, are extremely similar to those shown in Figure IV-2. The addition of a mandatory reserve margin causes additional capacity to be made available to the market but does relatively little to change the sources of energy until after the 2032 forecast horizon. Natural gas continues to have a total generation share of about 50% by 2032 and renewables evenly divided between wind and solar each have about 4% of the market. The required reserve margin provides a slight boost to Panhandle wind, which has a 31 brattle.com
36 relatively high capacity while slightly disfavoring PV due to the reductions in peak period energy prices. Figure IV-4 Generation Mix by Type Reference Case with Required Reserve Margin 32 brattle.com
37 Table IV-4 Average Simulated Unit Margins Reference Case with Required Reserve Margin Results Results Results Unit Energy Margins (2012$/kW-year) Unit Energy Margins (2012$/kW-year) Unit Energy Margins (2012$/kW-year) Energy-only Energy and Ancillary Services Energy-only Energy and Ancillary Services Energy-only Energy and Ancillary Services Coal $91.71 $91.72 Coal $ $ Coal $ $ ST $9.19 $35.41 ST -$1.07 $8.51 ST -$1.11 $0.75 CC $35.34 $36.66 CC $15.78 $17.64 CC $6.52 $8.97 CT $17.59 $33.45 CT $6.06 $12.08 CT $2.23 $6.96 IC $38.94 $41.01 IC $17.05 $17.73 IC $7.31 $8.31 WT $98.55 $98.55 WT $ $ WT $0.00 $0.00 PV $96.55 $96.55 PV $96.85 $96.85 PV $ $ New Coal $ $ New Coal $ $ New Coal $ $ New CC $73.09 $73.34 New CC $65.92 $66.22 New CC $55.40 $55.72 New CT $23.47 $40.20 New CT $4.07 $24.50 New CT -$0.89 $21.02 New WT $ $ New WT $ $ New WT $ $ New PV $0.00 $0.00 New PV $0.00 $0.00 New PV $ $ brattle.com
38 HIGH GAS PRICE SCENARIO As shown in Figure III-1, our high gas price scenario shows natural gas prices rising by about 4% real per year, more than doubling by 2032 in real terms. Apart from these higher gas prices, all other features of our original reference scenario are preserved, including the absence of a required reserve margin. Renewables support policies phase out (other than a 10% for solar PV) and renewable installation costs decline moderately. Table IV-5 and Figure IV-5 show that higher gas prices reduce the attractiveness of new and existing gas plants relative to wind and solar installations significantly. From 2014 to 2023, nameplate wind capacity in the Texas panhandle is added more rapidly than natural gas capacity. Panhandle wind reaches 10 GW, by 2017; following this all wind additions are Northwest and Coastal. Gas CC capacity rises in increments throughout the period, adding a total of 12,950 MW, while CT additions are only 660 MW. More than half of older steam gas units retire by 2032, leaving 5,953 MW in service. Overall net total gas 24 capacity tops out at 57.8 GW in 2027 and ends the period at 56.2 GW, 6 GW larger and a much more efficient and flexible fleet. By 2032, almost 10 GW of PV, 4.4 GW of coastal wind, and 10 GW of Northwestern wind capacity are added, the latter replacing the original northwestern units that retire in the 2020s. 24 In ERCOT, these units all use gas. 34 brattle.com
39 Table IV-5 Existing and New Generating Resources High Gas Prices No Required Reserve Margin (MW) Growth, Existing Cumulative Cumulative Cumulative Cumulative Cumulative Cumulative Total Total Retirements New Builds Retirements New Builds Retirements New Builds Total MW % Nuclear 5, , , , % Coal 18, , , , % Steam Oil/Gas 12,616 2, ,591 2, ,591 6, ,953-6,663-53% Combined-Cycle Gas 31, ,882 35, ,650 39, ,950 44,515 12,871 41% Combustion Turbine Gas 4, , , , % Internal Combustion Gas % Hydro % Biomass % Wind - Northwest 8, ,815 1, ,847 8,171 9,974 9,974 1,803 22% Wind - Coastal 1, ,266 3, ,266 3,852 1,586 4,407 4,407 2, % Wind - Panhandle ,000 10, ,000 10, ,000 10,000 10,000 N/A Solar ,641 9,671 9, % TOTAL 83,650 2,460 17,907 99,097 3,428 21, ,107 16,894 48, ,313 31,663 38% 35 brattle.com
40 Figure IV-5 Installed Capacity by Type High Gas Prices No Required Reserve Margin Figure IV-6 shows the generation mix for the High Gas Scenario. The gradual declines in coal s and nuclear s share of generation mirrors the previous scenario. Although absolute gas generation increases by about 87 BCF (about 11%) between 2017 and 2032, gas share of the mix trends downward through 2017 and again starting in 2028, when renewables cost advantage becomes especially clear. By 2032, renewables are supplying 25.8% of all ERCOT energy and gas is providing 29.7%. 36 brattle.com
41 Figure IV-6 Generation Mix by Type High Gas Prices No Required Reserve Margin Table IV-6 shows generator margins in the three converged years. Even without a required reserve margin payment stream, the table also shows that coal and renewable generators enjoy much higher margins than in prior scenarios. This is because higher gas prices create higher energy market prices, while fuel costs do not change for coal and renewable generators. The few steam turbines that do not retire earn essentially all their revenues from ancillary services in both 2017 and Similarly, new CTs do not earn enough to warrant construction but existing CTs remain, and by the end of the period CCs are no longer earning adequate margins in the absence of a capacity-like payment. No new coal plants are built in this scenario, but only 395 MW of small coal-fired generators retire in this scenario. Note that new CTs exhibit lower margins than existing CTs in this scenario. This is because the margins in Table IV-6 do not include out-of-market payments, such as start-up cost payments. The new CTs are significantly more efficient than existing CTs and as a result cycle much more frequently, many times not recovering the start-up costs with energy and ancillary service revenues. With out-of-market payments covering start-up cost shortfalls, new CTs would have 37 brattle.com
42 higher margins than existing CTs, as expected. The same phenomenon occurs in the other scenario with high renewable penetration and new CT capacity, the Stronger Federal Carbon Rule scenario. Scenarios with lower renewable penetration levels require less CT cycling, and so the new CT margins are higher than the existing CT margins even without accounting for any out-of-market revenues. 38 brattle.com
43 Table IV-6 Average Simulated Unit Margins High Gas Prices No Required Reserve Margin Results Results Results Unit Energy Margins (2012$/kW-year) Unit Energy Margins (2012$/kW-year) Unit Energy Margins (2012$/kW-year) Energy-only Energy and Ancillary Services Energy-only Energy and Ancillary Services Energy-only Energy and Ancillary Services Coal $ $ Coal $ $ Coal $ $ ST $6 34 $20.56 ST $31 04 $48.34 ST -$1.38 $7.91 CC $24 03 $25.55 CC $60.46 $61.72 CC $7.97 $9.45 CT $8.65 $51.53 CT $38 99 $91.86 CT $1.46 $44.09 IC $18 87 $41.35 IC $56.65 $74.91 IC $0.58 $21.04 WT $ $ WT $ $ WT $0.00 $0.00 PV $ $ PV $ $ PV $ $ New Coal $ $ New Coal $ $ New Coal $ $ New CC $45 90 $47.29 New CC $ $ New CC $65.36 $65.95 New CT $1 03 $26.17 New CT $43 06 $65.24 New CT -$17.62 $40.08 New WT $ $ New WT $ $ New WT $ $ New PV $0 00 $0.00 New PV $0 00 $0.00 New PV $ $ brattle.com
44 HIGH GAS PRICES AND LOW RENEWABLES COSTS This scenario includes the high gas prices examined above, a required reserve margin, and slightly more rapid reductions in the cost of wind and solar plants than in the Reference case. The results for this scenario are shown Table IV-7 and Figure IV-7. As one would expect, this scenario is similar to the High Gas No Required Reserves Case, with the (somewhat offsetting) additions of lower-cost renewables and a required reserve margin. 40 brattle.com
45 Table IV-7 Existing and New Generating Resources High Gas Prices and Low Renewables Costs (MW) Growth, Existing Cumulative Cumulative Cumulative Cumulative Cumulative Cumulative Total Total Retirements New Builds Retirements New Builds Retirements New Builds Total MW % Nuclear 5, , , , % Coal 18, , , , % Steam Oil/Gas 12, , ,703 1, ,307-1,309-10% Combined-Cycle Gas 31, ,882 35, ,262 40, ,310 43,954 12,310 39% Combustion Turbine Gas 4, , , , % Internal Combustion Gas % Hydro % Biomass % Wind - Northwest 8, ,855 1, ,887 8,171 14,633 14,633 6,462 79% Wind - Coastal 1, ,226 3, ,226 3,812 1,586 3,959 3,959 2, % Wind - Panhandle ,000 10, ,000 10, ,000 15,000 15,000 N/A Solar ,670 9,700 9, % TOTAL 83,650 1,348 17, ,209 2,316 23, ,621 11,461 56, ,835 45,186 54% 41 brattle.com
46 Figure IV-7 Installed Capacity by Type High Gas Prices and Low Renewables Costs High gas prices and their attendant high energy market margins, along with a required reserve margin payment, yield the same 395 MW of coal plant retirements as in all prior scenarios. Similarly, in spite of high gas prices and low renewables costs, steam gas retirements decline from 6,663 MW in the high-gas-no- required reserve to 1,309 MW in this scenario, and over 12 GW of new CCs are constructed. However, renewable capacity reaches a slightly higher level than in any prior scenario: 15 GW of new panhandle wind, 6.4 GW of net new Northwestern wind, 2.4 GW of net new coastal wind and 9.7 GW of new PV by The main difference between these capacity builds and the high gas no required reserves are an incremental 10 GW of wind, evenly split between Northwest and the Panhandle. This creates net total nameplate installations of GW in 2032, about 13 GW higher than total installations in the high gas no reserve margin scenario. Despite the greater installed renewable capacity in this scenario, total energy production is quite similar to the high gas case. The generation mix (Figure IV-8) shows natural gas generation 42 brattle.com
47 declining to 24.5%, less than the 33% share for renewables and also below coal s 2032 share results quite similar to the high gas price scenario alone. With respect to energy production and within the bounds of our scenarios, this suggests that lower renewable prices are a much smaller driver of energy sales results than are changes in the price of natural gas. Figure IV-8 Generation Mix by Type High Gas Prices and Low Renewables Costs Generator margin computations for this scenario appear in Table IV-8. The main differences between these results and the comparable data for the High Gas price scenario alone are due to the required reserve margin, which is not part of the High Gas scenario. Required reserve margin lowers steam gas plants margins since there are fewer very high priced hours to support these units. Similarly, margins for renewable plants with high peak coincidence decline due to lower on-peak energy prices. 43 brattle.com
48 Table IV-8 Average Simulated Unit Margins High Gas Prices and Low Renewables Costs Results Results Results Unit Energy Margins (2012$/kW-year) Unit Energy Margins (2012$/kW-year) Unit Energy Margins (2012$/kW-year) Energy-only Energy and Ancillary Services Energy-only Energy and Ancillary Services Energy-only Energy and Ancillary Services Coal $ $ Coal $ $ Coal $ $ ST $3.10 $11.64 ST -$0.67 $5.31 ST -$1.66 $2.20 CC $20.07 $21.17 CC $9.27 $10.46 CC $1.75 $4.47 CT $4.85 $32.51 CT $1.28 $31.71 CT -$0.72 $30.14 IC $13.50 $26.10 IC $2.04 $16.06 IC -$3.42 $23.79 WT $ $ WT $ $ WT $0.00 $0.00 PV $ $ PV $ $ PV $ $ New Coal $ $ New Coal $ $ New Coal $ $ New CC $39.89 $41.12 New CC $54.93 $55.45 New CC $40.65 $40.76 New CT $0.00 $0.00 New CT $0.00 $0.00 New CT $0.00 $0.00 New WT $ $ New WT $ $ New WT $ $ New PV $0.00 $0.00 New PV $0.00 $0.00 New PV $ $ brattle.com
49 MODERATE FEDERAL CARBON RULE This scenario is identical to the reference scenario with required reserves, with the sole exception that a rule is added that requires all existing coal plants to capture and sequester 50% of their CO2 output. Based on U.S. Department of Energy data we estimate that the cost of CCS technology that meets this requirement is $773/kW at 2012 prices. The interesting conclusion emerging from this analysis is that the capacity outcomes of this scenario are substantially the same as the Reference case, 25 though carbon emissions are significantly reduced. 26 Capacity additions and generation mix, and most other attributes of the scenario are quite similar. This can be seen by comparing Figures IV-9 and IV-10, installed capacity and generation mix for this scenario, to Figures IV-1 and IV-2 for the Reference case. Table IV-9, showing installations is also quite similar, with two exceptions we turn to in a moment. 25 Due to the similarities between this scenario and the Reference case we did not iterate between Xpand and PSO for this scenario. 26 Carbon emissions are documented in a separate subsection below. 45 brattle.com
50 Table IV-9 Existing and New Generating Resources Moderate Federal Carbon Rule with Required Reserve Margin (MW) Growth, Existing Cumulative Cumulative Cumulative Cumulative Cumulative Cumulative Total Total Retirements New Builds Retirements New Builds Retirements New Builds Total MW % Nuclear 5, , , , % Coal 18, , , , % Steam Oil/Gas 12, , ,703 3, ,989-3,627-29% Combined-Cycle Gas 31, ,176 34, ,775 41, ,419 56,062 24,419 77% Combustion Turbine Gas 4, , , , % Internal Combustion Gas % Hydro % Biomass % Wind - Northwest 8, ,681 1, ,713 8, ,621-93% Wind - Coastal 1, , ,986 1, ,186-75% Wind - Panhandle 0 0 3,000 3, ,000 3, ,502 3,502 3,502 N/A Solar ,365 5,395 5, % TOTAL 83,650 1,034 8,900 91,516 2,316 15,499 96,833 14,095 36, ,565 21,915 26% 46 brattle.com
51 Figure IV-9 Installed Capacity by Type Moderate Federal Carbon Rule with Require Reserve Margin The reason this case is so similar to the Reference case with required reserves is that this particular form of a possible federal carbon rule does not trigger any retirements of existing Texas coal plants at the assumed level of CCS cost. By 2025 natural gas prices reach approximately $5/per million BTU, approximately 80% higher than they were in At those levels, coal unit energy margins are sufficiently high that it makes economic sense to retrofit these units with carbon capture. Although this level of CCS is assumed to require each plant to supply much more energy for its own operation, increasing its heat rate by 19% (reducing its efficiency), the fuel cost of coal per megawatt hour is still about 25% less than the cost of gas in a new 2025 combined cycle plant. This advantage improves over time as gas prices increase relative to coal prices 47 brattle.com
52 Figure IV-10 Generation Mix by Type Moderate Federal Carbon Rule with Required Reserve Margin This points to the two significant differences between this scenario and the Reference case mentioned above. First, compared to the reference case, energy margins in 2025 for the coal fleet are down approximately 42% percent. In simple terms, the high margins coal plants earned in the absence of a CCS requirement are reduced, but not eliminated, by the need to invest in 50% CCS. Similarly, coal capacity factors are reduced by the amount of electrical energy they must now devote to operating the CCS technology in their own plant. This reduces the capacity factor, and the net energy obtained from coal, by about 16%. 48 brattle.com
53 STRONGER FEDERAL CARBON RULE Our scenario with a strong federal carbon rule requires existing coal plants to capture and sequester 90% of their CO2 output. In addition, this scenario uses our high gas prices, slightly lowered renewable energy costs (identical to those in Scenario 4), and a required reserve margin policy. In other words, this scenario is equivalent to our high gas/low cost renewables case with an added stronger carbon rule. As one would expect, this case shows that most of the ERCOT coal plant fleet retires in 2025, the year we assume the carbon rule goes into effect. At this point, 16 GW of coal capacity providing more than 30% of all ERCOT energy rapidly shifts to gas and renewable supply sources: 6 GW of new CC capacity and 3 GW of new wind capacity. In the next several years, another 3 GW of CC capacity is added, along with another 19 GW of wind. Solar becomes rapidly cost-effective in this scenario and quickly rises to over 8 GW installed by For the remainder of the scenario horizon, all additional load growth is met by solar and wind additions. These results are reported in detail in Table IV-10 and Figure IV brattle.com
54 Table IV-10 Existing and New Generating Resources Stronger Federal Carbon Rule (MW) Growth, Existing Cumulative Cumulative Cumulative Cumulative Cumulative Cumulative Total Total Retirements New Builds Retirements New Builds Retirements New Builds Total MW % Nuclear 5, , , , % Coal 18, , ,224 16, ,495-15,199-81% Steam Oil/Gas 12, , , , % Combined-Cycle Gas 31, ,882 34, ,522 40, ,342 56,986 25,342 80% Combustion Turbine Gas 4, , , , % Internal Combustion Gas % Hydro % Biomass % Wind - Northwest 8, ,855 1,008 2,724 9,887 8,171 20,550 20,550 12, % Wind - Coastal 1, ,226 3, ,226 4,812 1,586 5,400 5,400 3, % Wind - Panhandle ,000 10, ,000 12, ,000 20,000 20,000 N/A Solar ,581 12,611 12, % TOTAL 83,650 1,274 16,967 99,343 2,242 27, ,015 26,793 85, ,864 58,215 70% 50 brattle.com
55 Figure IV-11 Installed Capacity by Type Stronger Federal Carbon Rule This pattern of additions is reflected in the generation mix shown in Figure IV-12. Natural gas share of generation jumps from about 25% of total energy to over 50% in 2025 and then declines slowly back to about 25% by During the period, wind s share of energy production rises to almost 40% of the ERCOT total and solar energy rises to about 5%, yielding a scenario in which variable renewables provide roughly 43% of all ERCOT energy by Remarkable as it may seem, our modeling indicates that this level of variable generation can be integrated with full reliability with properly structured ancillary services markets and a fleet of about 57 GW of CC capacity, 25 GW of which are newer, faster-ramping units, plus 12 GW of conventional steam gas plants. 51 brattle.com
56 Figure IV-12 Generation Mix by Type Stronger Federal Carbon Rule Generator margins in this scenario are shown in Table IV-11. An interesting pattern emerges across time for each of the new resource options. Coal plants earn consistently high margins, but not high enough to cover the cost of 90% CCS. Combined cycle plants earn significant revenues from all these markets (energy and ancillaries) through 2022, but by 2032 the margin streams are weakened greatly by cheap renewables and expensive gas. The same phenomenon affects CTs even more strongly. In contrast, wind s energy margin is substantial in 2017 and grows steadily, while solar enters the market by As observed in the High Gas scenario, new CT margins are lower than existing CT margins because the margins in Table IV-11 do not include out-of-market payments, such as start-up cost payments. 52 brattle.com
57 Table IV-11 Average Simulated Unit Margins Stronger Federal Carbon Rule Results Results Results Unit Energy Margins (2012$/kW-year) Unit Energy Margins (2012$/kW-year) Unit Energy Margins (2012$/kW-year) Energy-only Energy and Ancillary Services Energy-only Energy and Ancillary Services Energy-only Energy and Ancillary Services Coal $ $ Coal $ $ Coal $ $ ST $3.19 $22.64 ST -$1.73 $9.39 ST -$3.90 $10.12 CC $13.79 $14.90 CC $3.87 $5.01 CC $28.40 $29.37 CT $3.29 $26.27 CT -$1.19 $18.93 CT -$0.31 $22.44 IC $3.41 $18.53 IC -$6.63 $3.60 IC -$3.26 $12.55 WT $ $ WT $ $ WT $0.00 $0.00 PV $97.78 $97.78 PV $ $ PV $ $ New Coal $ $ New Coal $ $ New Coal $ $ New CC $39.79 $41.52 New CC $41.22 $42.33 New CC $4.28 $5.77 New CT -$6.99 $16.53 New CT -$16.70 $1.80 New CT -$18.00 $1.30 New WT $ $ New WT $ $ New WT $ $ New PV $0.00 $0.00 New PV $0.00 $0.00 New PV $ $ brattle.com
58 PRICES AND EMISSIONS ACROSS SCENARIOS Figure IV-13 shows average annual energy market prices calculated during the years our model are converged and interpolated between them. These all-in prices demonstrate that real energy prices in all scenarios rise above the extremely low levels experienced in 2012 in all scenarios, but generally do not significantly exceed 2010 or 2011 real energy prices. As expected, higher gas price scenarios are the most significant price driver, followed by carbon rules and the required reserve margin, which reduces average energy prices. Figure IV-13 Annual Average Wholesale Power Prices by Scenario Of course, energy prices are only part of the total cost of wholesale power in ERCOT. To form a complete picture of average bulk power costs, it is necessary to add in the costs of ancillary services and payments to guarantee the required reserve margin. Two factors make it difficult to report and compare the total cost of wholesale power in our modeling system. First, we do not know the form of the mechanism by which a required reserve margin will be achieved. Because we do not know this, we essentially back out a required 54 brattle.com
59 payment needed to induce the market to build capacity required to maintain the required reserve margin. We calculate the payments to generators required to make up for the revenue shortfall that some generators may experience in the presence of a required reserve margin. If the require reserve margin results in capacity added over and above what would have been added based solely on energy and ancillary services payments alone, some units will experience a revenue shortfall. We calculate that revenue shortfall for each unit. These payments are then added to the market revenues for each unit experiencing a shortfall. We also calculate all-in prices assuming that those costs are passed through to ratepayers. Figure IV-13 displays the approximate path of total wholesale market prices, i.e., the combination of energy, ancillary services, and reserve margin payments, for five of the six scenarios. 27 Figure IV-14 shows the same information in a bar chart, allowing each of the components of average total price to be separately displayed. The first figure shows that prices in the two Reference scenarios (with and without required reserves) are the lowest in total price, differing only by about $5.68/MWh in 2032 and less in earlier years. In fact, energy prices decline more under the required reserve margin scenario in 2017 than the reserve margin payment in that year ($2.52/MWh) adds in, yielding overall lower prices with a required reserve in that year. This figure also shows the effect of higher gas prices quite clearly. All three of the remaining scenarios have high gas prices. The blue and purple dashed lines on the figure differ by having no required reserves and higher renewables costs (purple) versus low renewables costs and required reserves (blue); in total, the price effect of the differences are not large and both scenarios yield 2032 prices around $60/MWh, a growth rate of %/year. The highest price scenario is the strong carbon rule, which includes high gas prices, a required reserve margin, and the costs of supporting the replacement of most of the ERCOT coal fleet, ending at $69.75/MWh, a growth rate of 2.5%. Figure IV-14 decomposes these total price increases into their components. Broadly speaking, the chart shows that energy prices in all but the high gas scenarios remain moderate, with the effects of higher gas prices growing steadily over time. Ancillary service prices remain modest and fully in keeping with historic norms in all scenarios, never exceeding $1.89/MWh. The required reserve margin payments are in the range of $ $5.18 in 2017, with higher payments needed in the High Gas/Low Renewables/Reserve Margin and Strong Carbon Rule scenarios. These two scenarios continue to account for the highest required reserve margin payments in later years. 27 As noted earlier, the Moderate Carbon Rule Scenario had results so close to the Reference Case with Required Reserves that we did not run our complete modeling system for this case. 55 brattle.com
60 Figure IV-14 Average Annual Wholesale Prices by Component by Scenario AIR POLLUTION EMISSIONS Table IV-12 displays the emissions of carbon dioxide, nitrogen oxides, and sulfur dioxide in each of the six scenarios and Figure IV-15 shows the paths of carbon emissions. The required reserve margin has a very small overall effect on the generation mix or emissions in ERCOT through 2032; the difference in cumulative CO2 emissions from 2012 through 2032 in the two scenarios amounts to less than 1 MMT. Similarly, the 2032 NOX emissions differ by about 1% between the two scenarios and SO2 are not significantly different. 56 brattle.com
61 Table IV-12 Environmental Performance Metrics by Scenario Scenarios 2032 Renewable Generation Gas Generation CO2 Emissions 2032 NOX Emissions 2032 SO2 Emissions MWh % MWh % Cumulative MMT % Change vs Metric Tons % Change vs Metric Tons % Change vs Reference Case without Required Reserve Margin 29,399, % 204,948, % 3, % 101,329 21% 328, % Reference Case with Required Reserve Margin 31,192, % 203,461, % 3, % 100,179 20% 328, % High Gas Prices - No Required Reserve Margin 109,699, % 126,324, % 3, % 92,793 11% 324, % High Gas Prices and Low Renewables Costs 141,191, % 104,279, % 3, % 86,461 3% 306, % Moderate Federal Carbon Rule with Required Reserve Margin 29,365, % 233,354, % 3, % 99,544 19% 310, % Stronger Federal Carbon Rule 182,420, % 183,846, % 2, % 30,411-64% 21, % 1 Includes hydroelectric and biomass generation In our high gas price scenario renewable generation grows to account for 25.8% of total generation by 2032, nearly as much as the 29.7% of power generated by gas. Cumulative carbon emissions through 2032 are cut by 8.6% and 6.8% under high gas prices with and without low renewables costs respectively. In both high gas scenarios NOX emissions continue to grow, although more slowly than they do in the reference case, increasing by 11% without low renewables costs and only 3% with them. SO2 emissions in 2032 are similarly affected, actually decreasing compared to 2013 emissions in the High Gas Low Renewable Costs scenario. A moderate federal carbon rule would lead to renewables accounting for just 7% of total generation in 2032, a comparable level to the 7.3% predicted in our reference scenarios with capacity payments and the 6.9% predicted without capacity payments. While this lowers carbon displacement via renewable power, this is more than offset by the carbon removed from coal emissions. Cumulative carbon emissions are cut by around 12% relative to the reference case, with a 15.6% decrease in 2032 emissions relative to 2012 levels, as compared with an 18.8% increase in the reference case. Interestingly, this rule has little effect on NOX emissions with predicted growth in emissions of 19%, slightly lower than in the reference case. SO2 emissions would be reduced by 1.2% of 2013 emission levels. The combination of a strong federal carbon rule with high gas prices and low renewables costs would lead to renewables accounting for 42.6% of total generation by 2032, about six times the level in the reference scenarios and nearly 10% higher than the high gas prices with low 57 brattle.com
62 renewables cost scenario. Gas would account for 43% of generation under a strong federal carbon rule for a combined renewables and gas total of 85.6% of total generation, the highest of any scenario. Carbon emissions in 2032 would be around one third of their 2012 level and cumulative carbon emissions around 30% less than they would be in the reference case. The strong carbon scenario also predicts large falls in 2032 NOX emissions, 64%, and SO2 emissions, 93.2% relative to their 2012 and 2013 levels, respectively. This is due to the predicted retirement of nearly all coal generation under a strong federal carbon rule. Figure IV-15 Carbon Emissions Across Scenarios DEMAND RESPONSE RESOURCES Although we have modeled demand response in a very simple and limited manner, it plays an important role in many of our scenarios, especially where there is no required reserve margin or renewable resources are very high. For example, as shown in Table IV-13, in the reference scenario our simulations indicate that the full amount of available demand response resources 58 brattle.com
63 (2800 MW) are needed by 2017 to help ERCOT manage reliability with efficiency and costeffectiveness. As more flexible CC capacity is added in later years in both reference scenarios, the need for DR declines. Although the displacement of DR by CC additions is common across the scenarios, more DR is needed in the high gas and stronger carbon rule cases. In the high gas scenario, gas capacity becomes expensive to operate and high levels of renewables are built, indicating an obvious economic niche for DR in managing net load variations. The strong carbon rule case has similar high gas prices and renewables additions, yielding the same increased role for DR. The scenario with high gas and low renewables costs needs less DR by 2032 in comparison to the other two scenarios with high renewables because it has more thermal capacity than the high gas scenario due to the reserve margin required, and less renewables than the scenario with stronger carbon rules. As noted in the introduction, these results do not reflect the full potential of DR in the Texas market, and further research in this area is important. Table IV-13 Maximum New Demand Response Resources Employed (MW) Scenario Reference Ref no reserve margin High gas High gas low renewables Stronger carbon Rule CONCLUDING OBSERVATIONS Before offering some concluding thoughts, we briefly reiterate some of the important features of our analysis that were necessarily limited. 28 First, the six scenarios we examine are certainly not a complete range of possible outcomes, nor are any of these scenarios our own predicted most likely path. Second, our modeling approach did not fully incorporate the effects of gas price 28 These limitations are discussed in Sections I and II in more detail. 59 brattle.com
64 uncertainty nor the full variability of solar energy. Third, we modeled only a specific set of large-scale supply alternatives, recognizing fully that other technologies exist today and that technical breakthroughs may change supply options in the future. Fourth, our models do not examine transmission expansion in much detail and assume that additional CREZ transmission would be built as needed following the current payment model. Fifth, we assume that all wind and solar tax supports other than the 10% ITC are phased out by Sixth, our scenarios including a required reserve margin make no assumptions about the detailed form of the rules that implement this requirement. Finally, we did not fully incorporate the effects of enhanced energy efficiency, demand response, distributed generation sources, or storage, all of which have significant potential and merit further study. Under this limited range of scenarios and assumptions, our results show that natural gas and renewables both play substantial roles in ERCOT and together provide all new generation. Within this definitive conclusion, however, the share of generation provided by these two forms of energy varies significantly. Under conditions of forecasted gas prices, expired renewables tax supports, and no breakthroughs in renewable capacity costs, the share of energy from renewable plants in Texas could actually decline from its current 12% level today to about 7% by At the other extreme, a strong federal carbon rule, higher gas prices, and lower renewable costs yields a future in which renewables supply 43% of ERCOT s generation by In the less extreme scenarios, wind and solar grow to generation shares between 25 and 33%. Natural gasfired generation provides all of the remaining incremental generation, adding 12 to 25 GW of new combined-cycle capacity. These results highlight the unsurprising conclusion that the mix of new gas and renewables generation is sensitive to the price of natural gas and cost declines in wind and solar power. Changes in these three factors can cause significant shifts in the mix of future installations, leading to a wide range of plausible generation shares for wind, solar, and natural gas. Higher gas prices were found to be more impactful than small declines in wind and solar costs, but by 2032 under nearly all conditions the cost of wind and solar both decline to the point where they are highly competitive with gas-fired power. Although it is difficult to discern from graphs that end in 2032, our results clearly indicate that wind and solar additions will dominate gas capacity in the later years of the 2030s and beyond. Our modeling approach allowed us to examine the importance of ancillary services and fastresponding natural gas capacity, the only fast-balancing option included in our study. We found that the ERCOT system could accommodate all levels of variable renewables likely to occur during this period with no reliability problems. However, accommodating higher levels of renewables required us to model an additional ancillary service, which we called Intra-day Commitment option, and to adjust the levels of current ancillary services. There are certainly other ways that market participants or ERCOT might achieve the same result.. 60 brattle.com
65 Among gas-fired power plants, nearly all future additions are combined-cycle plants rather than gas turbines. This is largely due to the fact that CCGTs are more efficient and new models are expected to increase their ability to start quickly and rapidly change output levels. The flexible modern gas technologies that are coming on line (both simple- and combined-cycle) will make it possible to accommodate higher renewable levels with fewer curtailments due to minimum generation and ramp constraints. The implementation of a reserve requirement helps improve the reserve margin, as intended. One of the effects of the reserve margin requirement is to delay the retirement of current gasand oil-fired installations in ERCOT. Conversely, a required reserve margin slightly disfavors solar PV and peak-coincident wind energy, although it provides a small boost to Panhandle wind. However, while capacity installations are changed significantly by the required reserve policy, the generation mix (and thus air emissions) is much more sensitive to gas prices and other policies than the existence of a reserve margin. With respect to coal-fired plants, we find that existing units in ERCOT remain profitable and are not retired unless a relatively stringent federal carbon rule is adopted. Federal carbon rule requiring 90% capture and storage of carbon would prompt the retirement of most ERCOT coal units, while a 50% capture and storage rule reduces coal plant margins but does not force retirements. Under the strong federal rule scenario, gas and renewable generation would together replace the energy formerly supplied by coal plants. In this scenario renewable energy could rise to become 43% of ERCOT generation by New coal plants, which will almost certainly require carbon capture and sequestration, are not built in any scenario. Our analysis shows that greenhouse gas and other air pollution emissions vary greatly across the scenarios we examine with surprisingly moderate impacts on market prices. Carbon dioxide emissions are largely unchanged by the required reserve policy, but are reduced to zero growth by high gas prices and are reduced by as much as 66% versus 2012 levels in the remaining scenarios. In particular, the moderate carbon rule reduces CO2 by over 16% by 2032 and the strong rule reduces it by 66%. The same scenarios create comparable reductions in SO2 emissions and smaller but parallel reductions in NOx. 29 All these outcomes occur at average annual total costs of energy that are in broadly in keeping with historic energy prices and expectations. Using the year 2010 as the base, average annual total wholesale power costs increase from a low of 0.74% a year in the reference case with no required reserves to 2.5% a year under a strong federal carbon rule, high gas prices, and a 29 The moderate carbon rule is something of an anomaly, yielding essentially no net NOX reductions versus the reference cases. 61 brattle.com
66 required reserve margin. In these results, the strongest drivers of prices are higher gas prices and, starting in 2025, the effect of a strong carbon rule. Finally, we have noted several times that demand response and energy efficiency remain important elements of the Texas resource mix. Our scenarios confirm that DR is particularly important in the absence of a required reserve margin, and that further study and policy development for these resources is useful. The electric power industry is in an era of dramatic change, and the range of uncertainties surrounding the expansion of any power system has never been greater. Within this highly uncertain world, we find that the future of ERCOT s power system is very likely to combine substantial amounts of both renewable energy and gas-fired power. The economic and environmental attractiveness of these electricity sources, the strong Texas resource base, and the evolution of power markets and systems all point to these energy options as the likely foundation of all new supplies to the ERCOT system in the next several decades ahead. 62 brattle.com
67 APPENDIX A LIST OF RECENT RELEVANT REPORTS Kathleen Spees, Samuel A. Newell, and Johannes P. Pfeifenberger, Capacity Markets Lessons Learned from the First Decade, published in Economics of Energy & Environmental Policy, Vol. 2, No. 2, September Johannes P. Pfeifenberger, Making Energy-Only Markets Work: Market Fundamentals and Resource Adequacy in Alberta, presented at the Harvard Electricity Policy Group Meeting, Calgary, June 13, Jurgen Weiss, Heidi Bishop, Peter Fox-Penner, and Ira Shavel, Partnering Natural Gas and Renewables in ERCOT, prepared by The Brattle Group for the Texas Clean Energy Coalition, June 11, Johannes P. Pfeifenberger, Structural Challenges with California s Current Forward Procurement Construct, The Brattle Group, presented at the CPUC and CAISO Long-Term Resource Adequacy Summit, February 26, Jurgen Weiss and Pedro L. Marin, Reforming Renewable Support in the United States: Lessons from National and International Experience, The Brattle Group, prepared for the Bipartisan Policy Center, November Johannes P. Pfeifenberger, Kathleen Spees, and Samuel A. Newell, Resource Adequacy in California: Options for Improving Efficiency and Effectiveness, The Brattle Group, prepared for Calpine, October Samuel A. Newell, Resource Adequacy and Demand Response in ERCOT, The Brattle Group, presented to the Center for the Commercialization of Electric Technologies (CCET) Summer Board Meeting, Austin, TX, August 8, Jurgen Weiss, Judy Chang, and Onur Aydin, The Potential Impact of Solar PV on Electricity Markets in Texas, The Brattle Group, prepared for the Solar Energy Industries Association and the Energy Foundation, June 19, Samuel A. Newell, Kathleen Spees, Johannes P. Pfeifenberger, Robert S. Mudge, Michael DeLucia, and Robert Carlton, ERCOT Investment Incentives and Resource Adequacy, The Brattle Group, prepared for the Electric Reliability Council of Texas, June 1, Johannes P. Pfeifenberger, Peter S. Fox-Penner, and Delphine Hou, Review of EIPC s Phase 1 Report, The Brattle Group, prepared for the Working Group for Investment in Reliable and Economic Electric Systems (WIRES), May 22, brattle.com
68 Metin Celebi, Kathleen Spees, Quincy Liao, and Steve Eisenhart, Supply Chain and Outage Analysis of MISO Coal Retrofits for MATS, The Brattle Group, prepared for Midwest Independent Transmission System Operator, May Johannes P. Pfeifenberger, Samuel A. Newell, Kathleen Spees, Attila Hajos, and Kamen Madjarov, Second Performance Assessment of PJM's Reliability Pricing Model: Market Results 2007/08 through 2014/15, The Brattle Group, prepared for PJM Interconnection, August 26, Kathleen Spees, Samuel A. Newell, Robert Carlton, Bin Zhou, and Johannes P. Pfeifenberger, Cost of New Entry Estimates For Combustion Turbine and Combined-Cycle Plants in PJM, The Brattle Group, prepared for PJM Interconnection, August 24, Samuel A. Newell, Johannes P. Pfeifenberger, and Kathleen Spees, Second RPM Performance Assessment and CONE Study, The Brattle Group, Prepared for PJM Interconnection, August 18, Metin Celebi and Frank C. Graves, Potential Coal Plant Retirements in ERCOT Under Emerging Environmental Regulations: Update, The Brattle Group, Presented before Public Utility Commission of Texas, at Workshop on Potential Environmental Regulations and Resource Adequacy, June 22, brattle.com
69 APPENDIX B ADDITIONAL MODEL AND SCENARIO INFORMATION THE XPAND AND PSO MODELS Xpand is a linear programming model that simulates electric generation system expansion over multi-decade time horizons. Its objective function minimizes the present value of total system costs, including capital cost, fixed O&M, variable O&M, fuel and emission costs while meeting electricity demand and complying with environmental policy limits, operating reserve constraints and reserve margin constraints (where applicable). It is designed to operate as if all generation decisions are market-driven. As part of the cost-minimizing solution, Xpand produces forecasts of short-term and long-term decisions such as new capacity additions, retirements, generation and fuel mix levels, and energy prices. Xpand operates on a seasonal basis using load duration curves. It does not model ERCOT at the sub-hourly level required to simulate actual operations. Power Systems Optimizer ( PSO ) is an advanced production cost simulation tool developed by Polaris Systems Optimization, Inc. Traditional production cost models were designed to model controllable thermal generation and focus on the energy markets. PSO was built to focus on the variability needs of the current and future electrical system. The model is able to simultaneously optimize energy and multiple ancillary services markets on a sub-hourly timeframe. PSO also allows for the modeling of forecast uncertainty and uses mixed-integer programming techniques to solve the commitment and dispatch problem. The model is designed to mimic market operations software and market outcomes in competitive energy and ancillary services markets. One of PSO s most important features is the ability for users to define different decision points called cycles that have different data available for commitment and dispatch decisions. This allows users to model the successive energy and ancillary services markets that are found in ERCOT. As an example, both day-ahead and real-time markets can be modeled and the appropriate forecasts for load and wind can be used in each stage of the market simulation. This enables the calculation of accurate energy prices of both real-time and day-ahead markets in a single model run. PSO s features also include the modeling of ramping constraints, capturing the costs associated with the additional ramping and cycling required in a system with high penetration of intermittent resources, and allows for various user-defined ancillary services. PSO also provides the additional flexibility to model new technologies, including various energy storage devices with different operating characteristics. Before running any scenarios we benchmarked each of these models by simulating the actual performance of the ERCOT system for the full year The results of these benchmarking exercises are presented in below. 65 brattle.com
70 MODEL ZONES We modeled four load pockets around the major cities with limited import capability, Dallas- Fort Worth, Austin, San Antonio, and Houston, as well as the South ERCOT zone, covering the Lower Rio Grande Valley area. The transmission limits into these load pockets for each of the scenarios modeled were obtained from the most similar scenario in the ERCOT DOE LTS study. We modeled wind developments in two additional broad zones: the Texas Panhandle and North West ERCOT (spanning the Far West, West and North West ERCOT weather zones). Coastal wind developments were modeled in the South ERCOT zone. Limits into these areas were linked to the wind capacity installed in the area, in effect assuming that no wind is developed without the necessary transmission. The remaining footprint of ERCOT was collectively named the Rest-of-ERCOT zone. Load and generation resources were mapped to each zone using input from ERCOT. MODEL CYCLES Four cycles were modeled in PSO to emulate in detail the operational decision process in ERCOT, as follows: 1. Day-Ahead Cycle: Emulates the day-ahead market decisions Solves daily looking 72 hours ahead Hourly granularity for 24 hours, longer for the remaining 48 hours Slow-start units (coal and gas-fired steam turbines) are committed in this cycle Day-ahead load, wind and solar forecasts are used in this cycle Market price capped at $2,500/MWh. 2. Reliability Unit Commitment (RUC) Cycle Emulates the CC commitment decisions made after the day-ahead market clears Solves daily looking 48 hours ahead Hourly granularity for 24 hours, longer for the remaining 24 hours Improved forecasts are used in this cycle day-ahead load forecasts capped to 1800 MW of over forecasts, and hour-ahead forecasts for wind units. 3. Hour-Ahead Cycle Emulates the CT and IC commitment decisions made intra-hourly Looks 2 hours ahead Runs every 10 minutes for the first hour 66 brattle.com
71 We assume that the new CC units can be committed in this cycle, since they have a very short start-up time (30 minutes) No uncertainty is modeled in this cycle. 4. Real-Time Cycle: Emulates real-time market decisions Single-period energy and ancillary service co-optimization Runs every 10 minutes Only the units online from previous cycles are able to meet load No uncertainty is modeled in this cycle PBPC curve is included to model scarcity conditions. For the scenarios with high renewable penetration (all scenarios with high gas prices), instead of the RUC cycle, an alternative 4-hour-ahead cycle was used to better incorporate wind forecast uncertainty in the CC commitment decisions. The characteristics of that cycle are Emulates the CC commitment decisions made intra-day Solves every other hour, looking 12 hours ahead Hourly granularity for the first 8 hours, by-hourly for the remaining 4 hours Wind forecast is a blend of 4 hour-ahead RT observation (persistence) and hourahead (ERCOT) or day-ahead (SPS) wind forecasts detailed to account for 4-hour start time of existing CC Perfect load and solar foresight is assumed. The figures below provide a schematic of the different cycles. 67 brattle.com

72 Figure B-1 Day-Ahead cycle periodicity and granularity Figure B-2 RUC cycle periodicity and granularity 68 brattle.com

73 Figure B-3 4 Hours-Ahead cycle periodicity and granularity Note: Numbers indicates an interval of 1-hour duration. Figure B-4 Hour-Ahead cycle periodicity and granularity Note: The first hour is modeled with 10-minute resolution. Figure B-5 Real-Time cycle periodicity and granularity Note: Numbers indicates an interval of 10-minute duration. CALIBRATION We ran every year from in Xpand and we ran PSO for 2017, 2022 and We benchmarked both models against 2012 actual market outcomes. In the 2012 State of the Market 69 brattle.com
74 Report it is reported that the wind curtailments in ERCOT were 4% in 2012 and 8% in The report also notes that the ERCOT wide average real-time energy price in 2012 was $27, the average day-ahead energy price was $ Our benchmarked 2012 case in PSO had duration-weighted energy prices of $25.55 real-time, and $27.68 day-ahead. The load-weighted energy prices in PSO were $27.00 real-time and $30.18 day-ahead. Additionally, curtailments in the 2012 PSO benchmark case averaged 3%. The 2012 Xpand results had a duration-weighted energy price of $ We found that our simulation of capacity factors with both PSO and Xpand were quite close to 2012 actual capacity factors as is shown in Table B-1. Table B-1 PSO and Xpand 2012 Simulated Capacity Factors Capacity Factor Comparison Tech Type Historical PSO Benchmark Xpand Benchmark Steam Turbine 9% 2% 1% Internal Combustion 22% 11% 8% Wind 33% 34% 35% CC 46% 56% 55% CT 25% 3% 2% PV 20% 26% 26% Nuclear 89% 96% 93% Steam Coal 60% 54% 57% ERCOT State of the Market Report, Potomac Economics, June 2013, p ERCOT State of the Market Report, Potomac Economics, June 2013, p brattle.com
75 LOAD For load, we obtained the following sets of load data: The 2012 minute by minute ERCOT system-wide load (1 min) annual energy and hourly peak load forecast, based on ERCOT forecast. 32 Hourly Weather normalized shapes by weather zone (1 hr) in 2012, downloaded from ERCOT website /2022/2032 load bus and mapping to weather and city zones, from ERCOT day-ahead and hour-ahead forecasts. PSO uses chronological, hourly (or sub-hourly) data. Xpand uses load duration curves. The Xpand load duration curves are based on the minute by minute load data for 2012, which is first aggregated to an hourly level. These hourly load data are then grouped by four seasons and with 18 tranches in each season, as shown in Figure B-6, ranked with the magnitude of the load for each hour in a given season. The load duration curve shape is assumed to be the same for all future years Long- Term Hourly Peak Demand and Energy Forecast.pdf accessed on August 22, brattle.com
76 Figure B-6 The number of hours in each tranche for each season in the load duration curve Tranche Spring Summer Fall Winter t t t t t t t t t t t t t t t t t t PSO requires chronological load data for each sub-region region. The minute by minute system wide loads are aggregated based on the intervals in the real-time cycle and then divided into the different regions based on the mapping between city zones and weather zones based on the load bus power flow. Lastly, the forecast errors in day-ahead and hour ahead are derived from forecast data in 2012 and are applied in all future years. WIND Multiple datasets and processes were used to develop the wind profile inputs for the existing West North, existing Coastal, future West North, future Coastal, and future Panhandle wind installations modeled. Existing ERCOT wind generation was developed from two sources: (1) 1-minute ERCOT-wide actual 2012 wind generation data, and (2) hourly 2012 wind forecasts and actuals for South Houston, or Coastal area, and the West North. Both data sources were provided by ERCOT. The first set of wind data was used by ERCOT in their KERMIT-modeling for the DOE LTS and provides detailed information about the sub-hourly wind patterns for all of ERCOT. The second set of data contains the hourly day-ahead and hour-ahead wind forecasts for 2012 as well as the 72 brattle.com
77 real-time wind output and installed capacity. This data is regionally aggregated in to the Coastal and the West North area to inform the different wind output profiles by region. Existing wind profiles for Xpand relied on the real-time wind output from the second set of data. This hourly data were aggregated into load blocks, using the hour-to-load-block mapping informed by the 2012 hourly ERCOT load, and the hourly capacity factor was averaged to develop the block capacity factor. These capacity factors by block for the West North and Coastal regions were inputs to Xpand. For PSO, the normalized day-ahead and hour-ahead forecasts were maintained for each region as inputs to the model, but the hourly normalized realtime output was transformed to reflect the sub-hourly variability implied by the first data set. The hourly real-time data was disaggregated into 10-minute segments and was then reshaped based on the 1-minute wind generation data. Wind profiles for future wind farms in the Coastal and West North regions were developed by assuming an enhanced power curve for the wind turbines. Then an improved power curve was used to calculate an increased wind output profile for future wind farms in those regions. From this process, future wind installations are modeled having higher annual output than the existing wind facilities. To estimate improved power curves, we assumed that such improvements would be similar to those experienced between the initial development of the Eastern NREL database 34 and the subsequent update. 35 We proceeded as follows: using the wind power curves from the initial, 2009 Eastern NREL database, and the wind profiles from the existing wind plants in South and Northwest ERCOT and in SPS, we estimated implied wind speed time series for each of the three areas. To estimate the future wind power production under historical 2012 conditions, we passed the implied wind speeds through the wind power curves from the updated, 2012 Eastern NREL database. As the CREZ lines become operational, wind development in the Texas Panhandle will be able to expand. Since 2012 ERCOT wind generation data did not reflect wind output profiles from this region, we requested and received data from Southwestern Public Service (SPS) for wind installed in the Texas Panhandle on their system. This 2012 SPS wind data contained hourly day-ahead and 5-minute real-time data aggregated for all SPS wind sites in the area. Both datasets were adjusted to assume an enhanced power curve for future wind installations as described above. The hourly day-ahead was then normalized and input to PSO while the 5-34 M. Brower, Development of Eastern Regional Wind Resource and Wind Plant Output Datasets, National Renewable Energy Laboratory, Subcontract Report NREL /SR , December K. Pennock, Updated Eastern Interconnect Wind Power Output and Forecasts for ERGIS, National Renewable Energy Laboratory, Subcontract Report NREL /SR , July brattle.com
78 minute real-time data was normalized and aggregated to 10-minute segments for implementation in PSO. Xpand aggregated the 5-minute real-time SPS data into hourly segments, calculated the hourly capacity factor based on installed wind capacity, and then aggregated the hourly capacity factors in to load blocks. Table B-2 Renewable Capacity Factors Region/Technology Capacity factor Existing Coastal Wind 34.4% Existing Northwest Wind 35.2% New Coastal Wind 37.7% New Northwest Wind 38.7% Panhandle Wind 42.3% Solar 26.0% SOLAR We created a solar power time series used for all solar power developments in ERCOT by taking the average of all Solar PV single-axis tracking weather-normalized time series available from ERCOT. 36 This time series has hourly granularity, and represents the ERCOT-wide average actual solar output available in a representative year. Operational forecasts are not available for this weather normalized time series, so we estimated a (pessimistic) forecast by creating a lower envelope of observed values based on current and previous day conditions. This forecast was used in the day-ahead cycle. Intra-hourly shapes were created by interpolating hourly values. Note that the solar profiles are not from 2012 (they were not available for 2012), but from a weather-normalized year. As such, solar output is not modeled as synchronized with wind and load. The effects of neglecting the correlation between solar and load are probably small, and may result in either under- or overestimation of the impacts of solar plants, depending on the location of the plants and the weather profile in those locations. The solar plants modeled represent utility-scale PV facilities, which were mapped to the Rest-of- ERCOT zone. Distributed PV or Concentrated Solar plants (CSP) were not modeled in this 36 URS, ERCOT Solar Generation Patterns, Project Summary Report, March brattle.com
79 study, and may be the subject of future studies. These technologies have the potential to reduce transmission needs (distributed PV) and improve the profile and capacity value of solar plants (CSP). To produce a good estimate of the impacts of these technologies, more detailed locational solar data, including intra-hourly and forecast data synchronized with load and wind, is needed. TRANSMISSION We used a pipes-and-bubbles model of the transmission system, given that the focus of the study was on long-term generation expansion and operational feasibility and impacts. The bubbles used were the zones detailed in section A. The transmission limits into the load pockets were adapted from the Business as usual with Retirements Scenario in the ERCOT DOE LTS study, effectively assuming a similar transmission build-out as in the corresponding ERCOT LTS scenario. Limits out of the wind-rich zones (Texas Panhandle, North West ERCOT and South ERCOT) were adjusted in Xpand based on the wind capacity installed in the zone, in effect assuming that no wind is developed without the necessary transmission. Table B-3 below provides the load pocket transmission limits used in 2032 for each scenario Table B-3 Load Pocket Transmission Assumptions Dallas/Fort Worth Import Houston Import Austin Import San Antonio Import Limit (MW) 22,887 13,108 5,175 4,579 EXISTING GENERATORS The list of existing generators came from ERCOT data. This data was used for most of the unit characteristics. Heat rate curves and start-up costs were generalized by unit type and assumptions for these characteristics were taken from the EIPC study. 37 Additionally, unit outage data were derived from GADS data. PRIVATE USE NETWORKS ERCOT has about 8.1 GW of capacity that comes from the behind the meter industrial facilities. Information about these generators is confidential and ERCOT only models them as the brattle.com
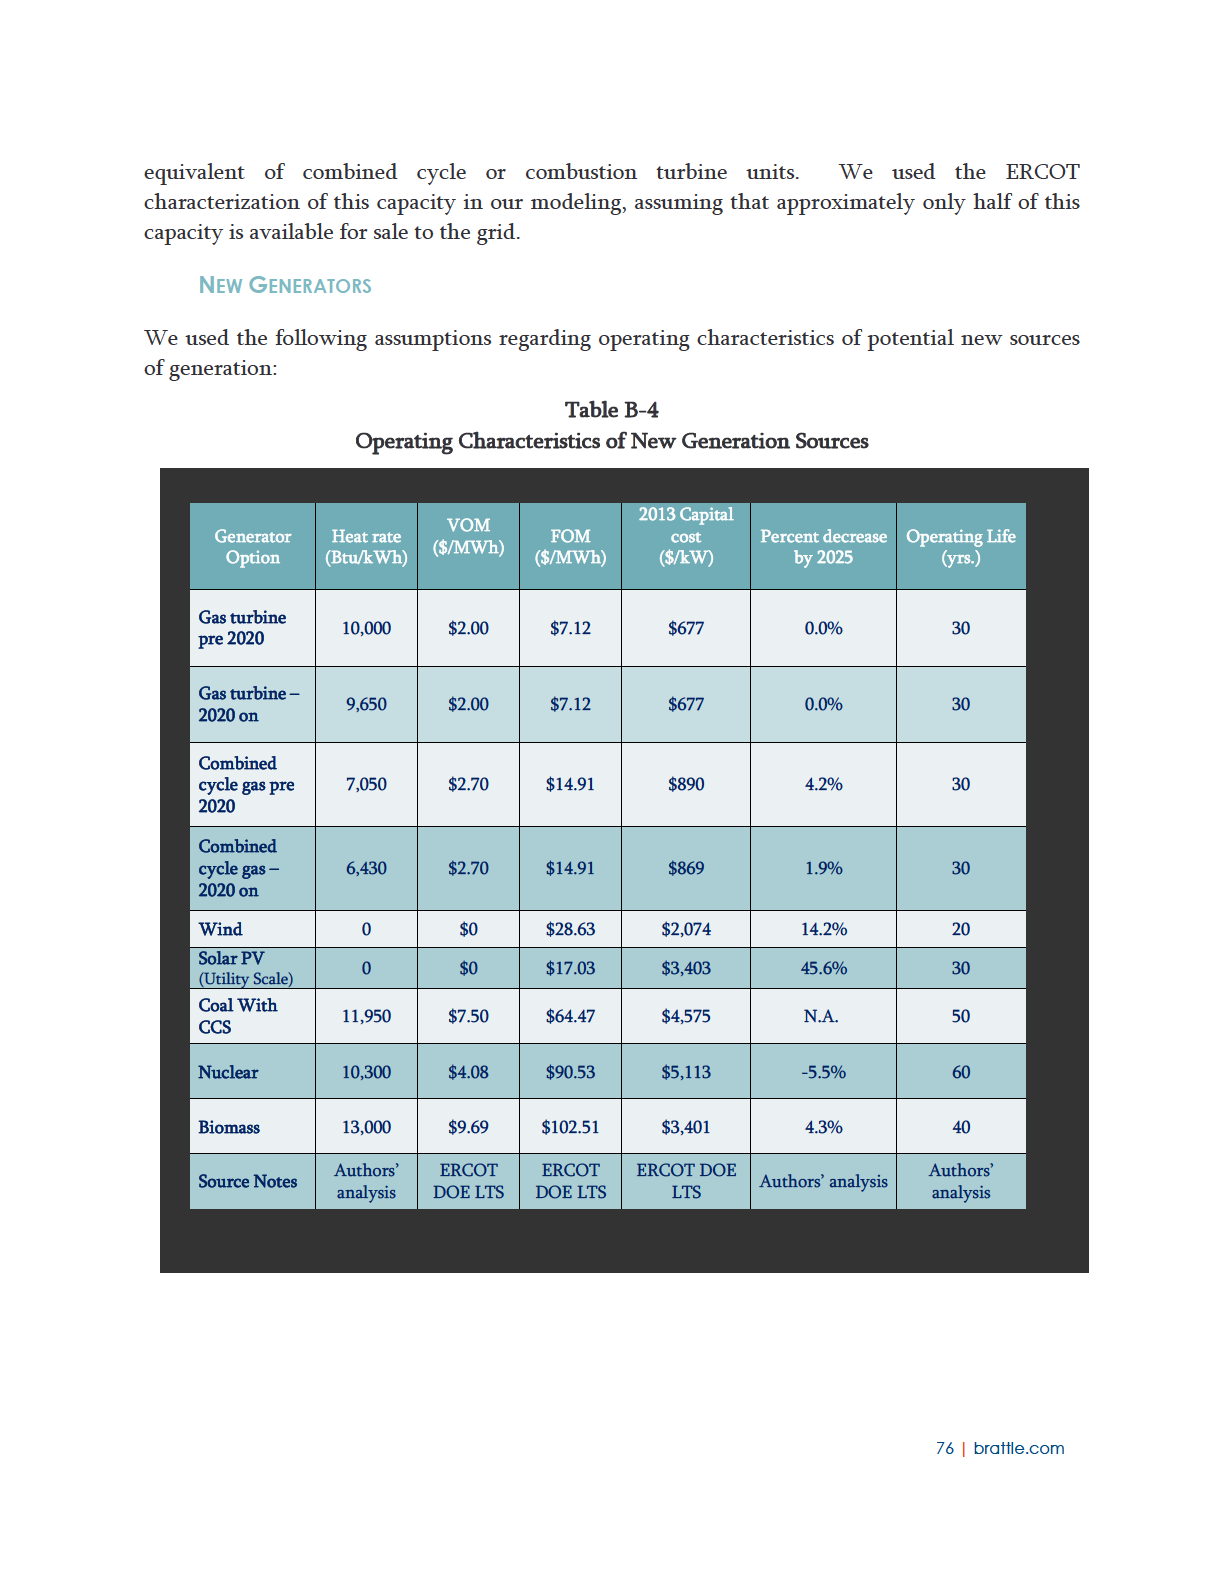
80
Exploring Natural Gas and Renewables in ERCOT, Part III:
 Exploring Natural Gas and Renewables in ERCOT, Part III: The Role of Demand Response, Energy Efficiency, and Combined Heat & Power PREPARED FOR The Texas Clean Energy Coalition PREPARED BY Ira Shavel Peter
Austin Energy Resource, Generation and Climate Protection Plan to 2025: An Update of the 2020 Plan
 Austin Energy Resource, Generation and Climate Protection Plan to 2025: An Update of the 2020 Plan INTRODUCTION The Austin City Council adopted the Austin Climate Protection Plan (ACPP) in 2007 to build
EPA s Clean Power Plan
 EPA s Clean Power Plan Basics and Implications of the Proposed CO 2 Emissions Standard on Existing Fossil Units under CAA Section 111(d) PRESENTED TO Goldman Sachs Power, Utilities, MLP and Pipeline Conference
ERCOT Analysis of the Impacts of the Clean Power Plan Final Rule Update
 ERCOT Analysis of the Impacts of the Clean Power Plan Final Rule Update ERCOT Public October 16, 2015 ERCOT Analysis of the Impacts of the Clean Power Plan Final Rule Update In August 2015, the U.S. Environmental
Anticipating Compliance Strategies and Forecasts for Satisfying Clean Power Plan Requirements
 Anticipating Compliance Strategies and Forecasts for Satisfying Clean Power Plan Requirements By Maggie Shober, Matthew Tanner, and Matt Drews CONTENTS Executive Summary 2 The Clean Power Plan 4 Litigation
Levelized Cost and Levelized Avoided Cost of New Generation Resources in the Annual Energy Outlook 2015
 June 2015 Levelized Cost and Levelized Avoided Cost of New Generation Resources in the Annual Energy Outlook 2015 This paper presents average values of levelized costs for generating technologies that
Coal Plant Retirements
 DISCUSSION Coal Plant Retirements Feedback Effects on Wholesale Electricity Prices By Onur Aydin, Frank Graves, and Metin Celebi Contents Introduction Section 1: Range of Potential Coal Plant Retirements...5
[Sent to Covered Activities and Resource Mapping working groups on Oct. 21, 2011.]
![[Sent to Covered Activities and Resource Mapping working groups on Oct. 21, 2011.]](/thumbs/29/13809325.jpg "[Sent to Covered Activities and Resource Mapping working groups on Oct. 21, 2011.]") 2040 and 2050 Acreage Needs for Renewable Generation Dave Vidaver, Electricity Analysis Office, California Energy Commission dvidaver@energy.state.ca.gov In order to inform the DRECP process, Energy Commission
2040 and 2050 Acreage Needs for Renewable Generation Dave Vidaver, Electricity Analysis Office, California Energy Commission dvidaver@energy.state.ca.gov In order to inform the DRECP process, Energy Commission
GLOBAL RENEWABLE ENERGY MARKET OUTLOOK 2013
 GLOBAL RENEWABLE ENERGY MARKET OUTLOOK 213 FACT PACK GUY TURNER HEAD OF ECONOMICS AND COMMODITIES APRIL 26, 213 GLOBAL RENEWABLE ENERGY MARKET OUTLOOK, 26 APRIL 213 1 INTRODUCTION This year s Global Renewable
Electricity Costs White Paper
 Electricity Costs White Paper ISO New England Inc. June 1, 2006 Table of Contents Executive Summary...1 Highlights of the Analysis...1 Components of Electricity Rates...2 Action Plan for Managing Electricity
Quantifying the Amount and Economic Impacts of Missing Energy Efficiency in PJM s Load Forecast
 Quantifying the Amount and Economic Impacts of Missing Energy Efficiency in PJM s Load Forecast PREPARED FOR The Sustainable FERC Project PREPARED BY Ahmad Faruqui, Ph.D. Sanem Sergici, Ph.D. Kathleen
Michigan Nuclear Power Plants Contribution to the State Economy
 Michigan Nuclear Power Plants Contribution to the State Economy PREPARED FOR PREPARED BY Mark Berkman, Ph.D. Dean Murphy, Ph.D. September 2015 This report was prepared for Nuclear Matters. All results
EPA s Clean Power Plan and Reliability
 EPA s Clean Power Plan and Reliability Assessing NERC s Initial Reliability Review PREPARED FOR Advanced Energy Economy Institute PREPARED BY Jurgen Weiss, PhD Bruce Tsuchida Michael Hagerty Will Gorman
From Forecast to Discovery: Applying Business Intelligence to Power Market Simulations
 From Forecast to Discovery: Applying Business Intelligence to Power Market Simulations Presented at the Energy Central Webinar May 12, 2015 Copyright 2015 Newton Energy Group LLC Welcome and Introduction
Emissions Comparison for a 20 MW Flywheel-based Frequency Regulation Power Plant
 Emissions Comparison for a 20 MW Flywheel-based Frequency Regulation Power Plant Beacon Power Corporation KEMA Project: BPCC.0003.001 May 18, 2007 Final Report with Updated Data Emissions Comparison for
Transmission Planning in the ERCOT Interconnection
 Transmission Planning in the ERCOT Interconnection Warren Lasher Manager, Long-Term Planning and Policy Department of Energy Electricity Advisory Committee The ERCOT Interconnection The ERCOT Region is
SECTION 1. PREAMBLE 3 SECTION 2. EXECUTIVE SUMMARY 4 ABOUT US 6
 CONTENTS SECTION 1. PREAMBLE 3 SECTION 2. EXECUTIVE SUMMARY 4 ABOUT US 6 Disclaimer notice on page 8 applies throughout. Page 2 SECTION 1. PREAMBLE The New Energy Outlook (NEO) is Bloomberg New Energy
Tax Credit Extension: Impact on Renewables Investment and Emissions Outcomes
 CONCORD, MA - WASHINGTON, DC 47 Junction Square Drive Concord, MA 01742 978-369-5533 www.mjbradley.com MJB&A Issue Brief March 7, 2016 Tax Credit Extension: Impact on Renewables Investment and Emissions
UNITED STATES OF AMERICA BEFORE THE FEDERAL ENERGY REGULATORY COMMISSION. ) ) Reliability Technical Conference ) Docket No.
 ) Reliability Technical Conference ) Docket No.") UNITED STATES OF AMERICA BEFORE THE FEDERAL ENERGY REGULATORY COMMISSION Reliability Technical Conference Docket No. AD14-9-000 REMARKS OF BRAD ALBERT GENERAL MANAGER, RESOURCE MANAGEMENT ARIZONA PUBLIC
UNITED STATES OF AMERICA BEFORE THE FEDERAL ENERGY REGULATORY COMMISSION Reliability Technical Conference Docket No. AD14-9-000 REMARKS OF BRAD ALBERT GENERAL MANAGER, RESOURCE MANAGEMENT ARIZONA PUBLIC
Convergence of Wholesale And Retail Markets: The Texas Experience
 Convergence of Wholesale And Retail Markets: The Texas Experience 1 COMMISSIONER KENNETH W. ANDERSON, JR. PUBLIC UTILITY COMMISSION OF TEXAS PRESENTATION FOR HARVARD ELECTRICITY POLICY GROUP JUNE 12, 2014
Market Outlook Report
 Market Outlook Report What effect will the shift from coal to natural gas fired electricity generation in Alberta have on the price of the Alberta Electric System Operator s system marginal price of electricity?
Energy and Consumer Impacts of EPA s Clean Power Plan. Prepared for the American Coalition for Clean Coal Electricity
 Energy and Consumer Impacts of EPA s Clean Power Plan Prepared for the American Coalition for Clean Coal Electricity Contents Executive Summary Overview of the Clean Power Plan NERA Methodology Baseline
System-friendly wind power
 System-friendly wind power Lion Hirth (neon) Simon Müller (IEA) BELEC 28 May 2015 hirth@neon-energie.de Seeking advice on power markets? Neon Neue Energieökonomik is a Berlin-based boutique consulting
State of Renewables. US and state-level renewable energy adoption rates: 2008-2013
 US and state-level renewable energy adoption rates: 2008-2013 Elena M. Krieger, PhD Physicians, Scientists & Engineers for Healthy Energy January 2014 1 Introduction While the United States power sector
Consumer Cost Effectiveness of CO 2 Mitigation Policies in Restructured Electricity Markets. Jared Moore and Jay Apt.
 Consumer Cost Effectiveness of CO 2 Mitigation Policies in Restructured Electricity Markets Jared Moore and Jay Apt Supporting Data Consumer Cost Effectiveness of CO 2 Mitigation Policies in Restructured
The Natural Gas-Electric Interface: Summary of Four Natural Gas-Electric Interdependency Assessments WIEB Staff November 30, 2012
 Introduction. The Natural Gas-Electric Interface: Summary of Four Natural Gas-Electric Interdependency Assessments WIEB Staff November 30, 2012 The increased reliance on natural gas as the primary fuel
New York s Upstate Nuclear Power Plants Contribution to the State Economy
 New York s Upstate Nuclear Power Plants Contribution to the State Economy PREPARED FOR New York State IBEW Utility Labor Council Rochester Building and Construction Trades Council Central and Northern
Vectren Integrated Resource Plan (IRP) Stakeholder Meeting 3 of 3. Discussion of Analysis Results September 24, 2014
 Stakeholder Meeting 3 of 3. Discussion of Analysis Results September 24, 2014") Vectren Integrated Resource Plan (IRP) Stakeholder Meeting 3 of 3 Discussion of Analysis Results September 24, 2014 IRP Timeline 2 1. Identify key objectives and metrics Complete 2. Gather information
Vectren Integrated Resource Plan (IRP) Stakeholder Meeting 3 of 3 Discussion of Analysis Results September 24, 2014 IRP Timeline 2 1. Identify key objectives and metrics Complete 2. Gather information
Competitive Electricity Prices: An Update 1
 Competitive Electricity Prices: An Update by J. Alan Beamon Throughout the country, States are moving to make their electricity generation markets more competitive. Although the timing will surely vary,
Public Service Company of Colorado 2 GW and 3 GW Wind Integration Cost Study
 Final Report: Public Service Company of Colorado 2 GW and 3 GW Wind Integration Cost Study Prepared by Xcel Energy Inc 1800 Larimer Street Suite 1400 Denver, Colorado 80202 Jeff Butler Regulatory Consultant
Industries Association. ERCOT Successes and Challenges
 Texas Renewable Energy Industries Association ERCOT Successes and Challenges Laura Doll Board Chair Electric Reliability Council of Texas November 7, 2011 ERCOT Overview The ERCOT market covers roughly
Winter Impacts of Energy Efficiency In New England
 Winter Impacts of Energy Efficiency In New England April 2015 Investments in electric efficiency since 2000 reduced electric demand in New England by over 2 gigawatts. 1 These savings provide significant
Maryland Nuclear Power Plant s Contribution to the State Economy
 Maryland Nuclear Power Plant s Contribution to the State Economy PREPARED FOR PREPARED BY Mark Berkman, Ph.D. Dean Murphy, Ph.D. September 2015 This report was prepared for Nuclear Matters. All results
Comparison of CO 2 Abatement Costs in the United States for Various Low and No Carbon Resources. Total System Levelized Cost Based on EIA LCOE
 Comparison of CO 2 Abatement Costs in the United States for Various Low and No Carbon Resources Every year the Energy Information Administration (EIA) publishes its Annual Energy Outlook (AEO). In the
An Introduction to Variable-Energy-Resource Integration Analysis Energy Exemplar October 2011
 An Introduction to Variable-Energy-Resource Integration Analysis Energy Exemplar October 2011 1. Introduction Increased Renewable Portfolio Standards (RPS) are being enacted at the state, provincial, and
Concepts and Experiences with Capacity Mechanisms
 Concepts and Experiences with Capacity Mechanisms Manuel Baritaud, International Energy Agency Conference Capacity Mechanisms: Experiences in Various European Countries Bundesministerium fur Wirtschaft
Potential Energy Impacts of the EPA Proposed Clean Power Plan
 Potential Energy Impacts of the EPA Proposed Clean Power Plan Prepared for: American Coalition for Clean Coal Electricity American Fuel & Petrochemical Manufacturers Association of American Railroads American
Multi-Faceted Solution for Managing Flexibility with High Penetration of Renewable Resources
 Multi-Faceted Solution for Managing Flexibility with High Penetration of Renewable Resources FERC Technical Conference Increasing RT & DA Market Efficiency Through Improved Software June 24 26, 2013 Nivad
Valuing Renewables as a Long-Term Price Hedge, Even in an Era of Low Natural Gas Prices
 Valuing Renewables as a Long-Term Price Hedge, Even in an Era of Low Natural Gas Prices Mark Bolinger Lawrence Berkeley National Laboratory 2013 EIA Energy Conference Washington, DC June 17, 2013 The work
Levelized Cost of New Electricity Generating Technologies
 Levelized Cost of New Electricity Generating Technologies The Energy Information Administration (EIA) produces forecasts of energy supply and demand for the next 20 years using the National Energy Modeling
Forecasting & Scheduling Renewables in North American Power Systems
 Forecasting & Scheduling Renewables in North American Power Systems Current Status and Future Trends Mark Ahlstrom, CEO, WindLogics Inc. (a subsidiary of NextEra Energy, Inc.) IEEE PES General Meeting
Economic and Rate Impact Analysis of Clean Energy Development in North Carolina 2015 Update
 February 2015 Economic and Rate Impact Analysis of Clean Energy Development in North Carolina 2015 Update Prepared for North Carolina Sustainable Energy Association 4800 Six Forks Rd Suite 300 Raleigh,
Addressing Barriers to Renewable Energy Procurement. In association with the EPA Green Power Partnership
 Addressing Barriers to Renewable Energy Procurement In association with the EPA Green Power Partnership September 19, 2012 CORPORATE GOALS Corporations are increasingly interested renewable energy. The
The Value of Distributed Electricity Storage in Texas
 The Value of Distributed Electricity Storage in Texas Proposed Policy for Enabling Grid-Integrated Storage Investments PREPARED FOR PREPARED BY Judy Chang Johannes Pfeifenberger Kathleen Spees Matthew
While there has been a lot of discussion
 Pipelines Is North American Natural Gas Infrastructure Up to Complementing Wind, Solar? Donald F. Santa Jr. While there has been a lot of discussion within the electric power industry about integrating
Value of Distributed Generation
 Value of Distributed Generation Solar PV in Massachusetts April 2015 Overview Distributed energy resources (DERs) like solar photovoltaic (solar PV) systems provide unique value to the electric grid by
Preparatory Paper on Focal Areas to Support a Sustainable Energy System in the Electricity Sector
 Preparatory Paper on Focal Areas to Support a Sustainable Energy System in the Electricity Sector C. Agert, Th. Vogt EWE Research Centre NEXT ENERGY, Oldenburg, Germany corresponding author: Carsten.Agert@next-energy.de
The Prospects for Cost Competitive Solar PV Power
 The Prospects for Cost Competitive Solar PV Power Stefan Reichelstein Graduate School of Business Stanford University September 2012 Introduction Rapid Growth of Solar PV Installations 17 GW of solar PV
Value of Distributed Generation
 Value of Distributed Generation Solar PV in Rhode Island July 2015 Overview Distributed energy resources (DERs) like solar photovoltaic (solar PV) systems provide unique value to the electric grid by reducing
Opportunity, Policy, and Practice for Renewable Energy: New Mexico Case Study
 Opportunity, Policy, and Practice for Renewable Energy: New Mexico Case Study 1 Federal policy: RPS, RES, CES Program Design Element S 3813 Renewable Energy Promotion Act 2010 (Bingaman) S. 1462 American
Displacement of Coal with Natural Gas to Generate Electricity
 Displacement of Coal with Natural Gas to Generate Electricity The American Coalition for Clean Coal Electricity (ACCCE) supports a balanced energy strategy that will ensure affordable and reliable energy,
Port Jackson Partners
 Port Jackson Partners NOT JUST A CARBON HIT ON ELECTRICITY PRICES Many factors will drive a doubling of electricity prices in many states by 15. This will have a major impact on virtually all businesses.
POWER SECTOR OPPORTUNITIES FOR REDUCING CARBON DIOXIDE EMISSIONS: COLORADO
 Fact Sheet POWER SECTOR OPPORTUNITIES FOR REDUCING CARBON DIOXIDE EMISSIONS: COLORADO MICHAEL OBEITER, KRISTIN MEEK, AND REBECCA GASPER CONTACT Michael Obeiter Senior Associate Climate and Energy Program
COMPARING THE COSTS OF INTERMITTENT AND DISPATCHABLE ELECTRICITY GENERATING TECHNOLOGIES. Paul L. Joskow Alfred P. Sloan Foundation and MIT 1 ABSTRACT
 September 27, 2010 (Revised February 9, 2011) DISCUSSION DRAFT COMPARING THE COSTS OF INTERMITTENT AND DISPATCHABLE ELECTRICITY GENERATING TECHNOLOGIES Paul L. Joskow Alfred P. Sloan Foundation and MIT
Renewable Energy. Winner, Loser, or Innocent Victim? by Dallas Burtraw, Joel Darmstadter, Karen Palmer, and James McVeigh
 Renewable Energy Winner, Loser, or Innocent Victim? by Dallas Burtraw, Joel Darmstadter, Karen Palmer, and James McVeigh Predictions that wind, solar power, and other renewable energy sources would make
Integrating Renewable Energy into the Electricity Grid
 Integrating Renewable Energy into the Electricity Grid Case studies showing how system operators are maintaining reliability PREPARED FOR Advanced Energy Economy Institute PREPARED BY Jurgen Weiss, PhD
Value of storage in providing balancing services for electricity generation systems with high wind penetration
 Journal of Power Sources 162 (2006) 949 953 Short communication Value of storage in providing balancing services for electricity generation systems with high wind penetration Mary Black, Goran Strbac 1
Potential Coal Plant Retirements in U.S. and Impact on Gas Demand
 Potential Coal Plant Retirements in U.S. and Impact on Gas Demand Presented at CERI Conference Calgary Presented by Metin Celebi The Brattle Group February 27, 2012 Copyright Copyright 2012 2010The TheBrattle
White Paper. Understanding California s Electricity Prices
 White Paper Understanding California s Electricity Prices Executive Summary Most industry experts predict that average electricity prices throughout the U.S. will increase significantly over the next decade.
The Economic Impact of Replacing Coal with Natural Gas for Electricity Production. William A. Knudson. Working Paper 01 0811
 THE STRATEGIC MARKETING INSTITUTE The Economic Impact of Replacing Coal with Natural Gas for Electricity Production William A. Knudson Working Paper 01 0811 80 AGRICULTURE HALL, MICHIGAN STATE UNIVERSITY,
Cutting Australia s Carbon Abatement Costs with Nuclear Power
 Cutting Australia s Carbon Abatement Costs with Nuclear Power Martin Nicholson, October 2011 Abstract The Australian Government Treasury modelling of a carbon price shows that Australia must purchase the
NV Energy ISO Energy Imbalance Market Economic Assessment
 March 25, 2014 NV Energy ISO Energy Imbalance Market Economic Assessment NV Energy ISO Energy Imbalance Market Economic Assessment 2014 Copyright. All Rights Reserved. Energy and Environmental Economics,
Unlocking Electricity Prices:
 Volume 2 A BidURenergy White Paper Unlocking Electricity Prices: A White Paper Exploring Price Determinants by: Mark Bookhagen, CEP pg. 2 Written by Mark Bookhagen, CEP Introduction In order to be classified
3.0. IGCC DEPLOYMENT. Financing IGCC 3Party Covenant 48
 .0. IGCC DEPLOYMENT With 004 natural gas prices at levels two to three times above historic averages, the focus of many power plant developers has shifted to coal technologies, which is stimulating interest
Appendix F. DRECP Energy Development Assumptions and the BLM LUPA
 Appendix F DRECP Energy Development Assumptions and the BLM LUPA F DRECP Proposed LUPA and Final EIS DRECP ENERGY DEVELOPMENT ASSUMPTIONS AND THE BLM LUPA F.1 Introduction This appendix briefly summarizes
Energy Storage for Renewable Integration
 ESMAP-SAR-EAP Renewable Energy Training Program 2014 Energy Storage for Renewable Integration 24 th Apr 2014 Jerry Randall DNV GL Renewables Advisory, Bangkok 1 DNV GL 2013 SAFER, SMARTER, GREENER DNV
Re: Docket No. RM 10-11-000, Comments on Proposed Rule on Integration of Variable Energy Resources
 750 1 st St, NE Suite 1100 Washington, DC 20002 202.682.6294 Main 202.682.3050 Fax www.cleanskies.org March 2, 2011 Via Electronic Docket Hon. Kimberly D. Bose Secretary Federal Energy Regulatory Commission
Rules on Southern Companies Energy Auction Participation
 Southern Company Services, Inc. First Revised Sheet No. 20B Superseding Original Sheet No. 20B Rules on Southern Companies Energy Auction Participation 1.0 Participation; Definitions 1.1 Southern Companies
Study to Determine the Limit of Integrating Intermittent Renewable (wind and solar) Resources onto Pakistan's National Grid
 Resources onto Pakistan's National Grid") Pakistan Study to Determine the Limit of Integrating Intermittent Renewable (wind and solar) Resources onto Pakistan's National Grid Final Report: Executive Summary - November 2015 for USAID Energy Policy
Pakistan Study to Determine the Limit of Integrating Intermittent Renewable (wind and solar) Resources onto Pakistan's National Grid Final Report: Executive Summary - November 2015 for USAID Energy Policy
Renewable Energy Finance, Market & Policy Overview
 Renewable Energy Finance, Market & Policy Overview April 2014 Generation (TWh) - Solid Lines Retail Cost ($/kwh) - Dashed Lines Renewable Energy Policy is Driving Massive Private Capital Investment The
Present and Future Cost of New Utility- Scale Electricity Generation
 Present and Future Cost of New Utility- Scale Electricity Generation Version 1.0 July 10 Matt Croucher and Tim James L. William Seidman Research Institute W. P. Carey School of Business Arizona State University
The Outlook for Nuclear Energy In a Competitive Electricity Business
 1776 I STREET N.W. SUITE 400 WASHINGTON, D.C. 20006 202.739.8000 The Outlook for Nuclear Energy In a Competitive Electricity Business Executive Summary: Nuclear Units Competitive, Profitable in Deregulated
INVESTING IN A CLEAN FUTURE. Austin Energy s Resource, Generation and Climate Protection Plan to 2020 Update
 INVESTING IN A CLEAN FUTURE Austin Energy s Resource, Generation and Climate Protection Plan to 2020 Update ABOUT AUSTIN ENERGY Austin Energy is the nation s eighth largest publicly owned electric utility
Demand Response and Energy Efficiency in the Midwest ISO. A Primer
 Demand Response and Energy Efficiency in the Midwest ISO A Primer John Moore Bruce Campbell Kevin Murray September 28, 2010 1 Agenda Types of Midwest ISO Demand Response (DR). Products DR is eligible to
ESF RESEARCH. Natural Gas and Renewables are Complements, Not Competitors. North America Fossil Fuels Natural Gas. June 25, 2013 Industry Brief
 ENERGY SOLUTIONS FORUM INC. ESF RESEARCH North America Fossil Fuels Natural Gas June 25, 2013 Industry Brief Natural Gas and Renewables are Complements, Not Competitors Angelique Mercurio Founding Partner
High Penetration of Distributed Solar PV Generation
 High Penetration of Distributed Solar PV Generation Lessons Learned from Hawaii September 30, 2014 Discussion Overview Solar PV penetrations trends in Hawaii Lessons learned from Hawaii s high penetration
ANALYSIS OF THE ADMINISTRATION S PROPOSED TAX INCENTIVES FOR ENERGY EFFICIENCY AND THE ENVIRONMENT
 June 28, 1999 ANALYSIS OF THE ADMINISTRATION S PROPOSED TAX INCENTIVES FOR ENERGY EFFICIENCY AND THE ENVIRONMENT INTRODUCTION A few months ago in the FY 2000 budget the President proposed a $3.6 billion
PJM Renewable Integration Study
 GE Energy Consulting PJM Renewable Integration Study Executive Summary Report Revision 03 Prepared for: PJM Interconnection, LLC. Prepared by: General Electric International, Inc. February 28, 2014 Legal
Demand Response in Capacity and Electricity Markets: What Role Can and Should It Play?
 Demand Response in Capacity and Electricity Markets: What Role Can and Should It Play? Professor Joel B. Eisen Austin Owen Research Fellow University of Richmond School of Law Austin Electricity Conference
The Clean Power Plan and Reliability
 The Clean Power Plan and Reliability PRESENTED TO National Governors Association Jurgen Weiss May 6, 2015 Copyright 2015 The Brattle Group, Inc. Disclaimers and Caveats The views expressed in this presentation
THE NET BENEFITS OF LOW AND NO-CARBON ELECTRICITY TECHNOLOGIES
 GLOBAL ECONOMY & DEVELOPMENT WORKING PAPER 73 MAY 2014 Global Economy and Development at BROOKINGS THE NET BENEFITS OF LOW AND NO-CARBON ELECTRICITY TECHNOLOGIES Charles R. Frank, Jr. Global Economy and
NARUC International Relations Committee Meeting February 5, 2012 Washington, D.C. Jay Godfrey Jfgodfrey@aep.com Managing Director, Renewable Energy
 NARUC International Relations Committee Meeting February 5, 2012 Washington, D.C. Jay Godfrey Jfgodfrey@aep.com Managing Director, Renewable Energy American Electric Power Company U.S. electric generation
Fiscal Year 2011 Resource Plan
 Salt River Project Fiscal Year 2011 Resource Plan Page 1 Last summer SRP hosted three resource planning workshops for a diverse group of stakeholders and customers to explain the planning process, discuss
Reasons for the drop of Swedish electricity prices
 Reasons for the drop of Swedish electricity prices Project for Svensk Energi Dr. Lion Hirth Neon Neue Energieökonomik GmbH Karl-Marx-Platz 12, 12043 Berlin, Germany hirth@neon-energie.de Summary report
Indiana Electricity Projections: The 2011 Forecast
 Indiana Electricity Projections: The 2011 Forecast Prepared by: Forrest D. Holland Marco A. Velastegui Douglas J. Gotham David G. Nderitu Paul V. Preckel Timothy A. Phillips Darla J. Mize State Utility
Energy storage in the UK and Korea: Innovation, Investment and Co-operation Appendix 4.1: Stakeholder interviews from Korea
 Energy storage in the UK and Korea: Innovation, Investment and Co-operation Appendix.1: Stakeholder interviews from Korea Peter Taylor & Lloyd Davies, University of Leeds Appendix.1: Stakeholder interviews
PARTNERING NATURAL GAS
 PARTNERING NATURAL GAS AND RENEWABLES IN ERCOT June 11, 2013 Dr. Jurgen Weiss Heidi Bishop Dr. Peter Fox-Penner Dr. Ira Shavel Prepared for The Texas Clean Energy Coalition Copyright 2013 The Brattle Group,
ECCO International, Inc. 268 Bush Street, Suite 3633 San Francisco, CA 94104
 PROMAX SHORT-TERM ENERGY & TRANSMISSION MARKET SIMULATION SOFTWARE PACKAGE ECCO International, Inc. 268 Bush Street, Suite 3633 San Francisco, CA 94104 ECCO International, Inc. Copyright 2009 EXECUTIVE
2010 STATE OF THE MARKET REPORT
 2010 STATE OF THE MARKET REPORT FOR THE ERCOT WHOLESALE ELECTRICITY MARKETS POTOMAC ECONOMICS, LTD. Independent Market Monitor for the ERCOT Wholesale Market August 2011 TABLE OF CONTENTS Executive Summary...
Calculating the Business Case for Demand Response
 Calculating the Business Case for Demand Response Whether for regional transmission systems, integrated utilities, or load serving retailers, there are many direct and indirect benefits financial, regulatory,
ELECTRICITY MARKET REFORM (EMR) & THE ENERGY BILL INENCO OVERVIEW
 & THE ENERGY BILL INENCO OVERVIEW") ELECTRICITY MARKET REFORM (EMR) & THE ENERGY BILL INENCO OVERVIEW February 2014 ELECTRICITY MARKET REFORM (EMR) & THE ENERGY BILL The Energy Bill is the government s flagship energy policy. There have
ELECTRICITY MARKET REFORM (EMR) & THE ENERGY BILL INENCO OVERVIEW February 2014 ELECTRICITY MARKET REFORM (EMR) & THE ENERGY BILL The Energy Bill is the government s flagship energy policy. There have
Written Testimony Submitted by Mr. Michael Kezar General Manager San Miguel Electric Cooperative, Inc.
 Written Testimony Submitted by Mr. Michael Kezar General Manager San Miguel Electric Cooperative, Inc. U.S. House of Representatives Committee on Small Business Subcommittee on Agriculture, Energy and
Guidance for U.S. Positions on MDBs Engaging with Developing Countries on Coal-Fired Power Generation 1
 October 29, 2013 Guidance for U.S. Positions on MDBs Engaging with Developing Countries on Coal-Fired Power Generation 1 The following guidance is intended to be adapted by individual MDBs and incorporated
Rethinking Electric Company Business Models
 Rethinking Electric Company Business Models National Association of Regulatory Utility Commissioners Staff Subcommittee on Accounting and Finance Spring 2014 Conference March 19, 2014 Discussion overview
So, What Exactly is Risk Management?
 So, What Exactly is Risk Management? By Paul Wielgus, Managing Director, GDS Associates, Inc. Buyers, sellers, and others in the energy business need to understand the risks in this very uncertain environment
Implications of Carbon Cap-and-Trade for Electricity Rate Design, with Examples from Florida. Hethie Parmesano and Theodore J.
 Implications of Carbon Cap-and-Trade for Electricity Rate Design, with Examples from Florida Hethie Parmesano and Theodore J. Kury Hethie Parmesano is a Special Consultant with NERA Economic Consulting
EPA Clean Power Plan and Impact on Texas and the Country. Scott D. Deatherage 214-999-4979 sdeatherage@gardere.com
 EPA Clean Power Plan and Impact on Texas and the Country Scott D. Deatherage 214-999-4979 sdeatherage@gardere.com United Nations 21 st Conference of the Parties United Nations Meeting on Climate Change
UNITED STATES OF AMERICA BEFORE THE FEDERAL ENERGY REGULATORY COMMISSION. PJM Interconnection, L.L.C. ) Docket No. ER14-
 Docket No. ER14-") UNITED STATES OF AMERICA BEFORE THE FEDERAL ENERGY REGULATORY COMMISSION PJM Interconnection, L.L.C. ) Docket No. ER14- AFFIDAVIT OF DR. SAMUEL A. NEWELL AND MR. CHRISTOPHER D. UNGATE ON BEHALF OF PJM
UNITED STATES OF AMERICA BEFORE THE FEDERAL ENERGY REGULATORY COMMISSION PJM Interconnection, L.L.C. ) Docket No. ER14- AFFIDAVIT OF DR. SAMUEL A. NEWELL AND MR. CHRISTOPHER D. UNGATE ON BEHALF OF PJM
TAMPA ELECTRIC COMPANY UNDOCKETED: SOLAR ENERGY IN FLORIDA STAFF S REQUEST FOR COMMENTS INTRODUCTION PAGE 1 OF 1 FILED: JUNE 23, 2015.
 INTRODUCTION PAGE 1 OF 1 Introduction Solar power is an important part of Florida s energy future and can provide a number of benefits to Florida and its citizens by generating power without emissions
Integration of Wind and Solar Energy in the California Power System: Results from Simulations of a 20% Renewable Portfolio Standard
 Integration of Wind and Solar Energy in the California Power System: Results from Simulations of a 20% Renewable Portfolio Standard Udi Helman BrightSource Energy (formerly California ISO) Mark Rothleder*