Wichita State University AeroShock Page 2 of 57
|
|
|
- Jasper Greene
- 8 years ago
- Views:
Transcription
1

2 Table of Contents Acronyms, Abbreviations, and Symbols Executive Summary Management Summary Design Team Composition and Responsibilities Scheduling Conceptual Design Mission Requirements Scoring Analysis Design Objectives and Requirements Conceptual Configurations Selection Process Aircraft Configuration Empennage Configuration Landing Gear Configuration Battery Configuration Payload Arrangement Conclusion Preliminary Design Critical Design Parameters Aerodynamic Parameters Propulsion Parameters Mission Model Optimization Scheme Aerodynamics Module Propulsion Module Performance Module Stability and Control Module Weight and Structures Module Flight Score Module Optimization Results Aerodynamic Trade Studies Stagger Analysis Preliminary Lift and Drag Estimates Propulsion Trade Studies Stability and Control Analysis...28 Wichita State University AeroShock Page 2 of 57

3 4.8.1 Stability and Control Critical Parameters Estimated Stability Characteristics Structural Analysis Critical Design Loads and Parameters Structural Optimization Aircraft Performance Predictions Mission Performance Prediction Detail Design Propulsion System Selection and Performance Control Sub-System Selection Aircraft Sizing Aircraft Weight and Balance Flight and Mission Performance Structural Design and Capabilities Landing Gear Selection Payload Solution Drawing Package Manufacturing Plan Manufacturing Methods and Materials Manufacturing Methods and Materials Figure of Merit Construction Process Manufacturing Schedule Testing Plan Structural Testing Material Testing Propeller Testing Half-Scale Wind Tunnel Testing Propulsion System Wind Tunnel Testing Full Scale Wind Tunnel Testing Flight Testing Performance Results Propulsion System Evaluation Flight Testing Evaluation Wind Tunnel Study and Evaluation of Complete Aircraft Performance Results Summary References Wichita State University AeroShock Page 3 of 57

4 Acronyms, Abbreviations, and Symbols α Angle of Attack L Lift Force β Sideslip Angle LAPS Lap Number (Total) δ a Aileron Deflection L/D Lift-to-Drag Ratio δ e Elevator Deflection Angle LT Loading Time δ r Rudder Deflection Angle MAC Mean Aerodynamic Center AC Aerodynamic Center MDO Multidisciplinary Optimization AOA Angle of Attack (also α) NiCad Nickel Cadmium AR Aspect Ratio NiMH Nickel Metal Hydride BW 1 Battery Weight - Delivery Mission p Roll Rate BW 2 Battery Weight - Payload Mission q Pitch Rate C D Drag Coefficient r Yaw Rate C l Rolling Coefficient RAC Rated Aircraft Cost C L Lift Coefficient Re Reynolds Number C M Pitching Moment Coefficient RMS Raytheon Missile Systems C n Yawing Coefficient RPM Revolutions per Minute C y Sideforce Coefficient S a Aileron Area CA Cyanoacrylate Glue S e Elevator Area CAD Computer Aided Design S r Rudder Area CG Center of Gravity S T Horizontal Stabilizer Area D Drag Force S V Vertical Stabilizer Area DBF Design/Build/Fly S Wing Reference Area FEM Finite Element Method S&C Stability and Control FOM Figure of Merit SW System Weight FS Flight Score T/O Takeoff GP Gold Peak (Battery Manufacturer) WSU Wichita State University I Current X ac Aerodynamic Center Location K v RPM/Volt Motor Constant X-wind Crosswind aaaaaaaaa Wichita State University AeroShock Page 4 of 57

5 1.0 Executive Summary This report details the design, testing, and manufacturing processes conducted by the Wichita State University (WSU) AeroShock team in preparation for the AIAA/Cessna/RMS student Design/Build/Fly competition. The primary objective is to maximize the total score, which is comprised of a report and flight score (FS). The FS consists of two unique missions to be completed in succession: Delivery and Payload. The Delivery Mission requires the airplane to maximize the number of laps within 5 minutes using the least amount of battery weight, whereas the Payload Mission involves minimizing system and battery weight along with payload loading time. The most important competition constraints are a 75-ft takeoff distance (which is the most critical performance leg), and a 4x5-ft dimension restriction (which limits the fuselage length and wing span combination). Score analysis shows that system and battery weight combine for 61% of the Total Score, making them the most critical design variables. Several solution concepts are proposed with a balanced wing loading and thrust-to-weight ratio to meet the design objectives and requirements previously stated. These are: a Biplane (single), a Monoplane (twin), a Tandem (single), a Canard (twin), and a Flying Wing (single). A Figure of Merit (FOM) analysis selected a single-propeller biplane wing-body with a conventional tail, a conventional/taildragger landing gear, and a single-stack battery configuration. The chosen aircraft has a low wing loading which reduces the amount of thrust and battery weight required to meet the takeoff distance. The conventional tail provides formidable stability characteristics at a low weight. The conventional landing gear is light and improves field length performance due to its inherent angle of attack (AOA). The single-stack battery configuration is chosen due to its high power to weight ratio. In addition, top loading is implemented to reduce loading times, and composite manufacturing is used to reduce system weight. A Multidisciplinary Optimization (MDO) program analyzes different combinations of the critical design variables, which include: wing area, span and airfoil, motor, propeller, and battery selection. The wings are sized to a 4.83-ft wingspan, with a total wing area of 9.67 ft 2 and a SD7062 airfoil. An inverted NACA 2408 airfoil is selected for the horizontal tail, while a flat plate is used for the vertical. Propulsion optimization suggests that a NEU 1506/3Y motor geared 5.2:1 performs optimally for both missions. For the Delivery Mission, 12 Elite 1700 cells and an 18x10E propeller yield the highest score. On the other hand, 18 GP 2000 cells with a 19x10E propeller are optimal for the Payload Mission. The following performance capabilities are predicted for the Delivery and Payload Missions, respectively: a takeoff distance of 46 / 71-ft, a stall speed of 22 / 35-ft/s, a cruise speed of 40 / 50-ft/s, and a maximum speed of 59 / 75-ft/s. AeroShock is expected to complete 3 laps in the Delivery Mission with a battery weight of 0.75-lb, for a score of 4 laps/lb. The Payload Mission RAC is 7.2 lb 2, with a battery weight of 1.5-lb. The loading time is estimated at 15 seconds on average, which yields a score of (lb 2 sec) -1 per flight. Wichita State University AeroShock Page 5 of 57

6 2.0 Management Summary The team organization is based on a hierarchical structure to encourage dynamic involvement among all the members. 2.1 Design Team Composition and Responsibilities Team AeroShock consists of 14 WSU aerospace engineering students ranging from freshman to graduate. The team includes: 5 seniors, each with a primary and secondary design responsibility, 1 graduate student advisor, and 8 underclassmen who help with manufacturing, flight testing, and payload. Each senior student is assigned to a technical group based on his individual interests, knowledge, and experience. The organizational chart is shown in Figure 2.1. Jackson Anyasi Structures / Chief Engineer Alonso Zamora Graduate Advisor / CFD Dheeraj Kancharla Kan Yip Tan Trent Frantz Yuttanant Aerodynamics / S&C / Performance / Suwansiri Optimization Organization Build Captain Propulsion / CAD Chandresh William Vien Nguyen Maryanne Zinzuwadia Okorie Manufacturing Kamunge Landing Gear Manufacturing Lead CAD Support Mrinal Nagrecha Hemal Shah Shiva Mogili Raoul Fossi Manufacturing Manufacturing Payload Manufacturing Specialist Figure 2.1 Team Organization Chart Wichita State University AeroShock Page 6 of 57

7 The Graduate advisor is a former member of the 2006/07 Wichita State DBF entry, Shockin Surveyor 1. He supervises design development, suggests improvements, and participates in the manufacturing and testing processes. The five main technical groups are: Aerodynamics: Responsible for aerodynamic force resolution, airfoil selection, wing sizing, wind tunnel testing, and programming for the Aerodynamics Module. Propulsion: In charge of propeller testing, coding for the Propulsion Module, and selection of components such as motor, batteries, and propellers. Also conducts wind tunnel testing on the optimized propulsion system to validate calculations. Structures: Responsible for laying out the overall aircraft s internal and external design, selecting materials, and preparing a manufacturing scheme. Other responsibilities include structural and material testing. S&C: Acquires accurate weight estimates to assess longitudinal and lateral-directional stability. Other duties include: control surface sizing, servo selection, evaluation of X-wind capabilities, and investigation of dynamic stability modes. Performance: Evaluates the impact and interfacing of decisions made by other technical groups on the aircraft flying qualities, and suggests improvements to maximize the FS. Other tasks include coding and estimation of aircraft performance parameters for each flying mission, as well as the preparation of a detailed mission profile including time, current, and energy. The senior student s secondary roles are: Chief Engineer: Works dynamically among the other engineering groups to promote effective collaboration and to ensure a steady pace for the design effort. Optimization: Oversees MDO coding and all optimization efforts. Organization: Schedules team meetings, collaborates with undergraduate members, and monitors the overall design pace. Build Captain: Prepares the construction schedule, designates responsibilities, and oversees manufacturing efforts. CAD Lead: Responsible for organizing all Computer Aided Design (CAD) efforts. 2.2 Scheduling The first team meeting occurred in August The design project was set to span over an 8-month period, and a competitive schedule was created and adopted with fixed dates and milestones. The following Gantt chart demonstrates the team schedule, showing planned and actual timing of the design, fabrication, and testing processes. Wichita State University AeroShock Page 7 of 57

8 Task Name Aircraft Design Conceptual Design Preliminary Design Detailed Design Aircraft Manufacturing Prototype Construction Prototype Rollout Final Aircraft Construction Final Aircraft Due Report Report Writing Report Review Report Due Testing Material Testing Propulsion Testing Prototype Flight Testing Full Scale Wind Tunnel Final Aircraft Testing DBF Competition Qtr 3, 2007 Qtr 4, 2007 Qtr 1, 2008 Qtr 2, 2008 Jul Aug Sep Oct Nov Dec Jan Feb Mar Apr May 8/15 1/22 12/15 4/4 1/21 3/20 8/15 3/3 3/4 10/1 4/11 4/18 4/20 Figure 2.2 Project Schedule 3.0 Conceptual Design Conceptual design begins by identifying the mission requirements and details. The critical design variables and goals are selected to perform FOM analyses, and several aircraft configurations are proposed and evaluated. In addition, the basic propulsion system, payload, and landing gear configurations are also selected. 3.1 Mission Requirements The competition score is directly proportional to the written report score and total FS, where the latter is the sum of the Delivery and Payload Mission scoring (50 and 100 points, respectively). Other competition requirements and specifications include: - Size limitation of 4x5-ft. - Maximum takeoff distance of 75-ft. - Maximum battery weight of 4-lb Amp current limit. Delivery Mission The airplane must fly empty while carrying all payload restraint components. The objective is to complete the course profile (Figure 3.1) as many times as possible within 5 minutes, while minimizing battery weight. Score is given by: # Completed Laps / Battery Weight. Maximum score is 50 points. Wichita State University AeroShock Page 8 of 57

9 Figure 3.1 Flight Course 2, 1 Payload Mission The team is timed to configure a given payload combination consisting of bottles and bricks (Table 3.1) with which the airplane must complete 2 course laps. The bottles have a maximum height of 8.5-in, and are fitted with a round or square collar (4-in diameter or 4x4-in maximum). They are ballasted with water to approximately 0.5-lb, which allows for center of gravity (CG) shifts during flight. The bricks are approximately 4x4x2-2/3-in and 1.8-lb each. In addition, the airplane is assigned a RAC (System Weight x Battery Weight), where System Weight is the airplane weight without payload or batteries. The score is inversely proportional to RAC and loading time (1 / RAC x Loading Time). This mission can be completed twice for a score of 100 (50 each). Option Bottles Bricks Weight (lb) Table 3.1 Payload Combinations Scoring Analysis A sensitivity study is conducted to evaluate the effects of mission scoring variables. Figure 3.2(a) shows Score vs. Battery Weight for the Delivery Mission. As battery weight increases, scoring becomes less sensitive to the number of laps completed. From this trend, it is evident that the maximum battery weight of 4-lb does not yield a competitive score. Wichita State University AeroShock Page 9 of 57
, where System Weight is the airplane weight without payload or batteries.")
10 1 Lap 2 Lap 3 Lap 4 Lap 15 sec 20 sec 25 sec 30 sec Score (lap/lb) Score (1/(lb 2 sec)) Battery Weight (lb) RAC (lb 2 ) Figure 3.2 (a) Score vs. Battery Weight for Delivery and (b) Score vs. RAC for Payload Figure 3.2(b) shows Score vs. RAC for different loading times in the Payload Mission. Note that the change in score between 15 and 20 seconds is nearly identical to the difference between 20 to 25, and 25 to 30 seconds combined. As loading time increases, its effect on scoring diminishes rapidly. Further analysis is conducted by combining the individual mission score equations: Score = LAPS BW 1 + SW 2 BW 2 LT Equation 3.1 Where LAPS is the total number of laps, SW is System Weight, LT is Loading Time, and BW 1 and BW 2 are Battery Weight for the Delivery and Payload Missions, respectively. Note that LT for each payload flight is assumed to be equal for this equation. Table 3.2 depicts the percentage influence on score for each variable. Variable Percentage Effect on Score Battery Weight Payload (BW 2 ) 22.2% System Weight (SW) 22.2% Loading Time (LT) 22.2% Battery Weight Delivery (BW 1 ) 16.7% Number of Laps (LAPS) 16.7% Table 3.2 Variable Percentages Initial inspection of Table 3.2 shows that SW, BW 2, and LT have the same effect on score; however, the battery weight required is directly proportional to system weight. Also, the battery weight influence increases to 39% if it is combined for both missions. Consequently, battery and system weight can be considered the most influential factors in mission scoring. Wichita State University AeroShock Page 10 of 57

11 The LT and LAPS variables both have a large degree of uncertainty. For example, although the number of laps completed depends on aerodynamic and performance parameters along with gross weight, it also depends on factors such as wind speed and direction. Therefore, environmental influences must be taken into account when predicting the mission profile and scoring. In regards to LT, any type of human factors, environmental influences, loading mechanism or aircraft failure could have a drastic effect. Since the time is recorded in seconds, the range of values could potentially be very large from one situation to another; much more than the range of weights or laps. Because of the unpredictable nature of this variable, special attention must be given to create a payload restraint system which is repeatable, reliable, and efficient for handling all types of payload combinations. 3.3 Design Objectives and Requirements After conducting a scoring analysis and a competitive evaluation of past DBF airplanes, the team imposed the following design objectives and requirements. Delivery Mission: Complete at least 3 laps with less than 1-lb of battery weight. Payload Mission: Complete the 2 laps required with less than 1.5-lb of battery weight and a loading time under 15 seconds. Wing Loading and Thrust-to-Weight Ratio: Optimize the combination of wing loading and thrust-to-weight ratio to minimize battery weight, and to meet takeoff requirements (65 to 70-ft). Manufacturing: Produce a light aircraft structure (< 4.5-lb) with a high strength-to-weight ratio. Payload Loading: Implement top-loading to minimize loading time. Payload Restraint: Create a light and efficient loading mechanism to minimize time and system weight, and to maintain a consistent longitudinal CG for all payload combinations. 3.4 Conceptual Configurations The following solution concepts are idealized with a balanced combination of wing loading and thrustto-weight ratio to meet the design objectives and requirements previously stated. Biplane (Single): Low wing loading helps to reduce the amount of thrust and number of cells required to meet takeoff distance. The top wing spar location is a potential problem, as it could interfere with the payload bay. Monoplane (Twin): Higher wing loading and thrust-to-weight ratio than the Biplane concept. Relies on rapid acceleration to meet takeoff distance. It could require counter-rotating propellers and dihedral to maintain lateral-directional stability. Weight of two propulsion systems is a concern. Tandem (Single): Two wings are aligned in a negatively staggered configuration. Appropriate separation from the airplane CG could make a horizontal tail unnecessary. The takeoff field length is typically longer than that of a traditional monoplane or biplane concept. Wichita State University AeroShock Page 11 of 57

12 Canard (Twin): A lifting canard with multiple props is similar to a tandem concept, and has the same issues with takeoff distance. The motors can be placed on the canard wing tips along with the landing gear to merge stress concentration points and attempt to minimize structural weight. Flying Wing (Single): Takes advantage of payload bay width to increase available surface area and to lower wing loading. This configuration produces a considerable amount of induced drag due to its short aspect ratio. The necessary fuselage height to accommodate tall payload elements could present possible design complications. Canard Twin Flying Wing Biplane Monoplane Twin Tandem Figure 3.3 Five Solution Concepts 3.5 Selection Process The following Figures of Merit are assigned weighting factors and used to evaluate the proposed conceptual solutions and subsequent components using a five-point scale system (1-Inferior, 2-Weak, 3- Average, 4-Good, and 5-Superior). Battery Weight: A critical component of score for both missions. System Weight: Reducing system weight is critical to minimizing battery weight and the required lift coefficient for cruise. Drag: The amount of drag generated affects the number of laps for the Delivery Mission and the amount of energy required for both missions. In general, the more energy required, the heavier the battery. Takeoff Distance: A critical phase for both missions. The aircraft must takeoff within 75-ft. Stability & Control: It is desirable to have an aircraft with reliable S&C during takeoff, cruise, and landing. This is especially important considering the unpredictable nature of wind in Wichita. Manufacturability: Ease of manufacturability and reproducibility is important to minimize downtime after a crash event. Wichita State University AeroShock Page 12 of 57

13 3.5.1 Aircraft Configuration The proposed solution concepts are evaluated based on the previous Figures of Merit. Figure of Merit Weight (%) Biplane Single Monoplane Twin Tandem Single Canard Twin Flying Wing Single Battery Weight System Weight Drag Takeoff Distance Stability & Control Manufacturability Total Table 3.3 Aircraft Configuration Decision Matrix From the decision matrix, the biplane is the most advantageous concept. It has a low wing loading to reduce the amount of thrust and battery weight required to meet the takeoff distance. In addition, it has adequate lateral-directional stability; an important factor when considering X-winds in Wichita. The only concern carried to preliminary design is the potential interference of the top wing spar with the payload bay Empennage Configuration After selecting a biplane configuration, different types of empennage are investigated: Figure of Merit Weight (%) Conventional V-Tail T-Tail U-Tail Stability & Control System Weight Drag Manufacturing Total FOM Table 3.4 Empennage Configuration Decision Matrix Conventional: A typical tail configuration that provides reliable and familiar S&C characteristics. V-Tail: Provides an opportunity to save weight since only two stabilizing surfaces are used. However, it is very susceptible to X-winds. Wichita State University AeroShock Page 13 of 57

14 T-Tail: Similar to conventional design, but the horizontal stabilizer is at the top of the vertical. This clears the horizontal from the wing wash and increases its effective angle of attack (AOA). U-Tail: Two vertical stabilizers are mounted on either side of a horizontal. This configuration can improve the efficiency of the horizontal since the verticals act as endplates. This is the heaviest configuration analyzed. The conventional configuration is selected. It provides formidable stability characteristics at a lower weight than the T-tail and U-tail options, and adapts better to X-winds than a V-tail Landing Gear Configuration The types of landing gear evaluated are: Conventional: The advantages of this configuration are: low drag (no nose-wheel) and an inherent AOA that assists short-field takeoffs. Ground handling capabilities are reduced. Tricycle: The most common type of landing gear. It has reliable ground handling capabilities, but it is heavier and produces more drag than the conventional. Bicycle: This type of gear has 4 wheels, one on the front, one aft of the main wings, and one on each wing. Drag, weight, and ground handling are significant drawbacks. Figure of Merit Weight (%) Conventional Tricycle Bicycle System Weight Drag Stability & Control Total FOM Table 3.5 Landing Gear Configuration Decision Matrix The conventional configuration is selected for its low weight and improved takeoff performance, at the minor expense of reduced ground handling capabilities Battery Configuration Two different battery configurations are considered: Single-Stack: Arrangement where all the cells are placed in series in one or more packs. Battery weight is reduced in this configuration because fewer cells are required. A potential disadvantage is that the battery packs support the entire current drawn from the motor, which reduces their available voltage. Wichita State University AeroShock Page 14 of 57

15 Double-Stack: This configuration has two packs connected in parallel with each other. This arrangement is ideal for missions that demand a large energy capacity. However, the number of cells required is double that of a single-stack configuration. Three additional Figures of Merit are added to determine the most competitive battery configuration. Power: Producing the largest amount of power with the least amount of cells is desirable. Energy Available: This is major concern for the Delivery Mission, since the number of laps directly depends on how much battery energy is available. Efficiency: This pertains to the discharge rate efficiency. Figure of Merit Weight (%) Single-Stack Double-Stack Battery Weight Power Energy Available Efficiency Total FOM Table 3.6 Battery Configuration Decision Matrix Although the double-stack provides more energy, the single-stack battery configuration is ultimately chosen based on its superior power-to-weight ratio Payload Arrangement The last study during conceptual design investigates different ways to arrange the 5 possible payload combinations (Table 3.1). It is desired to maintain a constant CG location for all the combinations. After a preliminary screening process of basic concepts, the following arrangement options are considered for further study (Fig 3.4). Option 1: This is a symmetric system which allows for small taper angles. Although not readily apparent, this arrangement has a sizeable range of CG shift for various payload combinations. Option 2: This arrangement is the most compact of those considered. Due to lack of symmetry, the CG location varies significantly between combinations. Taper is allowed from one end only. Option 3: This is the narrowest of the options, which allows for a similarly narrow fuselage. However, the length may decrease ease of loading, and it may also require relatively large taper and upsweep angles, increasing drag. Although this arrangement is symmetric, payload balancing is a major concern. Option 4: This system is very similar to Option 1, except that it has slightly better stability characteristics and requires larger taper angles. Wichita State University AeroShock Page 15 of 57

16 Three Figures of Merit for payload arrangement are considered: Stability: For consistent stability characteristics, it is desired to keep the payload CG as close as possible to the airplane CG for all the payload combinations. Drag: The width of the payload arrangement can determine the width of the fuselage. A narrow fuselage width provides less drag, while a wider fuselage will provide more drag. Also, some options better accommodate smaller taper and upsweep angles than others. Ease of Loading: Compact payload configurations require less movement of the individual s involved during loading, which will yield lower and more consistent loading times. Figure of Merit W eight (%) Option 1 Option 2 Option 3 Option 4 Stability Drag Ease of Loading Total FOM Figure 3.4 Payload Configuration Decision Matrix Option 4 is chosen based on results from stability analysis and the flexibility of fuselage tapering. 3.6 Conclusion are Upon conducting an analysis of mission requirements and scoring, a series of FOM decision matrices used to analyze a combination of primary configurations and subsequent systems. The selected concept is a single propeller biplane wing-body with a conventional tail, a conventional landing gear, and a single-stack battery configuration. A top loading configuration is identified as optimal for easy access to the payload bay. An appropriate payload configuration is chosen based on stability and drag concerns; the latter of which is expected to be significant due to the large base area required for the payload bay. The final conceptual design is shown in Fig Wichita State University AeroShock Page 16 of 57

17 Biplane Wings Top Loading Design Conventional Tail Flaperons Tractor Propeller Conventional Landing gear Figure 3.5 Final Conceptual Design 4.0 Preliminary Design This section describes the critical design parameters, mission model, and optimization scheme. In addition, analysis is conducted among the 5 main technical groups, and preliminary results are obtained from each. 4.1 Critical Design Parameters Primary aircraft optimization is centered on obtaining an optimal range of aerodynamic and propulsion design parameters which have the largest influence on scoring and performance Aerodynamic Parameters Wing Area: An important parameter for the short field takeoff requirement. Increasing the wing area reduces the wing loading and helps to reduce takeoff distance, but increases drag which affects the amount of energy required. Wing Span: The competition rules impose a limitation on wingspan and fuselage length by stipulating that the aircraft must fit in a 4x5-ft spot size. It is necessary to achieve an optimal combination of wing span and area that best fulfills these dimensional requirements. Wichita State University AeroShock Page 17 of 57

18 Wing Airfoil: Airfoil selection is also critical to minimize takeoff distance. A high lift airfoil improves takeoff performance, but creates a significant amount of drag during cruise. Alternatively, a balanced airfoil provides moderate lift coefficients and less cruise drag Propulsion Parameters Motor Selection: This is highly influenced by system weight and power requirements. Brushless motors are preferred to brushed due to their lower weight and greater efficiency. Battery Selection and Number of Cells: Battery weight has a direct effect on scoring. The battery capacity must be chosen to minimize weight, while maximizing the number of laps for the Delivery Mission. The number of cells used must be able to provide sufficient power for takeoff. Propeller Selection: The propeller is an important parameter that directly affects the aircraft s available power and the current drawn from the battery. 4.2 Mission Model The missions are modeled using five different phases: takeoff, climb, 180-degree turn, 360-degree turn, and cruise. Takeoff: Ground roll is modeled using a trapezoidal integration method. The model assumes a full throttle setting, a rolling friction coefficient of 0.03, and a wind speed set to 0 mph. The takeoff AOA varies with increasing speed. It is initially set at 12 degrees, and incrementally decreases as the airplane accelerates to a 0-degree attitude. Climb: Full throttle is assumed during the climb leg to 50-ft. The horizontal distance is calculated to ensure that the airplane successfully reaches the desired altitude before the first 180-deg turn. Cruise: Level flight is modeled to find the necessary cruise speed. Full throttle is maintained in the Delivery Mission to maximize the number of laps, while throttle control is implemented in the Payload Mission to reduce the amount of current consumed and to save energy. Turns: The turn segments are estimated by calculating the maximum bank angle the airplane can sustain in a 180- and 360-degree level turn. A maximum turn radius of 175-ft is specified. The same throttle conditions used for cruise are employed for turns. The model includes head and crosswind (X-wind) data 3 in Wichita for the third week of April (Table 4.1). The east field at Cessna heads N-S. Year Mean / Max Wind Speed (mph) / / / / / 34 Table 4.1 Wind Historical Information Wichita State University AeroShock Page 18 of 57

19 4.3 Optimization Scheme A Multidisciplinary Optimization (MDO) Code is created using FORTRAN 77 to integrate the following technical Modules: Aerodynamics, Propulsion, Performance, S&C, Weight & Structures, and Mission Scoring. The code analyzes numerous configurations and records the results for comparison. Critical design variables are selected based on these outputs. Figure 4.1 depicts the optimization flowchart. Baseline Configuration Weight & Structures New Configuration MDO Kernel Aerodynamics Module Performance Module Propulsion Module Performance Check Fail Stability Check Fail Record Results Calculate Score Optimized Range of Critical Design Variables Figure 4.1 Optimization Flowchart Aerodynamics Module This module calculates aerodynamic coefficients, Reynolds numbers, and aerodynamic forces for each external component. A complete drag build-up is implemented using the method outlined in Roskam 4. Lift coefficients are calculated using the Prandtl lifting line theory and a biplane aspect ratio (AR) consistent with the definition from Hoerner 5. Wichita State University AeroShock Page 19 of 57

20 The module also compares four different airfoils: NACA 4415, Eppler 560, SD 7062, and Eppler 423. Figure 4.2 (a) and (b) show the lift-coefficient and drag polar curves for these airfoils obtained from XFOIL at a Reynolds number of 500,000. Estimates for the Oswald efficiency factor are initially based on data from WSU s previous DBF entry 1, and later validated through wind tunnel testing (Section 7.4). Lift Coefficent Lift Coefficient Angle of Attack (deg) Drag Coefficient Figure 4.2 (a) Airfoil Lift Curves and (b) Airfoil Drag Polar Curves Propulsion Module The Propulsion Module stores data for different motors, gear ratios, battery cells, and propellers. Subsequently, it calculates current, thrust, torque, and brake power for a given propulsion system configuration and flight speed. These values are used by the MDO kernel to evaluate the feasibility of numerous configurations in the Performance Module. Figure 4.3 shows the Propulsion Module flowchart. Select Motor/Gear Ratio Add Battery (start with 10 cells) Go to next propeller or motor/gear Ratio Select Propeller (adjust battery cells to meet max current) Record Output Go to next propeller or motor/gear Ratio No Sufficient Power and Thrust? Yes Figure Propulsion Module Flowchart Wichita State University AeroShock Page 20 of 57
 0.0 0.000 0.005 0.010 0.015 0.020 Drag Coefficient Figure 4.")
21 A preliminary screening process of historical data identifies the most efficient motors and batteries. Eight different motors (Table 4.2) are included into the module. Five NiMH battery cells are considered (Table 4.3) based on their superior capacity-to-weight ratio (energy density). Motor Kv (RPM/V) Idle Current (A) Resistance (Ω) Weight (lb) NEU 1506/3Y 1, NEU 1509/2Y 1, NEU 1512/3D 1, NEU 1512/1.5Y 1, NEU 1521/1.5D 1, Hacker B50 10L 2, Hacker B50 13L 1, Hacker B50 9XL 1, Table Motor Specifications Battery Cell Capacity (mah) Nominal Voltage (V) Ri (mω) Weight (lb) Energy Density (mah/lb) IB , ,333 Elite , ,451 Elite , ,396 GP , ,125 Sanyo FAUP , ,367 Table 4.3 Battery Cell Properties The criterion for propeller selection is based on the required power to takeoff within 75-ft. As a result, large diameters (17- to 20-in) and low pitches (10- to 12-in) are considered. These propellers are tested in a wind tunnel (Section 7.3) to obtain thrust, torque, and power coefficients. The maximum propeller size is set by the current limit and ground clearance Performance Module The Performance Module analyzes each mission phase by solving the aircraft equations of motion 6 and calculates total mission times based on the mission model described in Section 4.2. This module outputs variables including takeoff distance, rate of climb, cruise speed, rate of turn, turn radius, throttle setting, energy required, number of laps, and mission times, among others Stability and Control Module The S&C Module assesses longitudinal and lateral-directional stability. It calculates static margin, along with the required tail area and control surface deflection for trimmed flight during takeoff and cruise. Airplane stability characteristics are estimated using a linear model outlined by Roskam 4. Wichita State University AeroShock Page 21 of 57
22 4.3.5 Weight and Structures Module The primary function of this module is to generate a weight database of materials and components including battery cells and motors. The Euler-Bernoulli Beam Theory 7 is used to size the wing spars and internal fuselage components. The aircraft structural weight is calculated based on the particular manufacturing method and materials selected for the wings, fuselage, and empennage (Section 6.0) Flight Score Module This module predicts a FS based on data output from other modules. The cost function (Eq. 4.1) includes the number of laps for the Delivery Mission, the system weight, and the battery weight for both missions. Loading time is not included as it is not a factor in the optimization of the critical design variables. This score is used to evaluate all the aircraft configurations that successfully pass the performance and stability requirements built into the code. FS LAPS 2 ( SW BW ) = + Equation 4.1 BW Optimization Results The main tradeoff study to size the airplane s wings and to configure the propulsion system is related to the amount of energy (i.e. battery weight) required to complete both missions successfully. An MDO run is performed for the critical design parameters listed in Section 4.1 based on ranges determined from Conceptual Design and preliminary exploratory runs. The results demonstrate that there are multiple configurations which could achieve a high score. Table 4.4 lists several different competitive configurations obtained from the analysis. Some clear trends extracted from optimization are: Large wing spans and areas help to reduce the number of battery cells required. The SD 7062 and NACA 4415 consistently perform well for both missions. Therefore, it is not required to use a high lift airfoil (Eppler 423 and 560). This translates into reduced wing drag. The most suitable motor is the NEU 1506/3Y. It is the lightest available, and requires the least amount of current to provide adequate power. Only the APC 19x10E propeller can be used to successfully complete the Payload Mission without exceeding the 40-amp limit, while an 18x10 propeller provides adequate power for the Delivery Mission with less current drawn than the 19x10. Figure 4.4 (a) shows that the cruise speed is reduced as wing area increases. For the Delivery Mission, it is important to minimize cruise drag and to save energy by lowering the motor throttle setting. Figure 4.4 (b) suggests that configurations cruising from 26 to 30 ft/s need the least amount of energy to complete a single lap for the Delivery Mission. Low energy consumption facilitates the optimization of battery weight by using low capacity cells. Wichita State University AeroShock Page 22 of 57
23 Analysis of the Delivery Mission suggests that the wings can be sized from 7- to 10-ft 2 in order to achieve a cruise speed that minimizes energy consumption. Figure 4.5 suggests that a larger wing area does not necessarily imply a shorter takeoff distance for the Payload Mission (i.e. the wing loading cannot be arbitrarily lowered). A wing area between 7- and 10-ft 2 is also satisfactory for this case. Case Span (ft) Wing Area (ft 2 ) AR Airfoil SD x SD x NACA x SD x SD x NACA x SD x SD x NACA x10 Table 4.4 Competitive Configurations Delivery Mission Payload Mission Propeller Battery Propeller Battery 12 Elite 1700 (0.75-lb) 19x10 18 GP 2000 (1.52-lb) Cruise Speed (ft/s) Wing Area (ft 2 ) Energy / Lap (mah) Cruise Speed (ft/s) Figure 4.4 Delivery Mission (a) Cruise Speed vs. Wing Area and (b) Energy/Lap vs. Cruise Speed Takeoff Distance (ft) Wing Area (ft 2 ) Figure 4.5 Payload Mission Takeoff Distance vs. Wing Area Wichita State University AeroShock Page 23 of 57
24 The following critical design parameters are selected based on the results and trends above. The configuration has a relatively large wing span and area, which most resembles case number 7. Based on the results from optimization, the largest possible wingspan is desirable; hence a maximum wingspan of 4.83-ft (58-in) is chosen to allow a 2-in tolerance from the 5-ft (60-in) geometric restriction. Aerodynamic Parameters Propulsion Parameters Item Delivery Payload Wing Airfoil SD7062 Motor NEU 1506/3Y Wing Chord (ft) 1.00 Number of Cells 12 Elite GP 2000 Wing Span (ft) 4.83 Cell Capacity (mah) 1,600 1,850 Wing Area (ft 2 ) 9.67 Propellers 18X10E 19X10E Tables 4.5 Critical Design Parameter Selection 4.5 Aerodynamic Trade Studies A FOM analysis is used to validate the airfoil selection from the optimization results with respect to parameters such as manufacturability and stall characteristics. The following Figures of Merit are used: Delivery Performance (35%): The airfoil must keep drag to a minimum. Payload Performance (30%): High lift is important to meet the required takeoff distance (75 ft). Pitching Moment (25%): Excessive negative pitching moments can create problems during the Payload Mission when the motor is full-throttled at takeoff (forcing the airplane to nose down). Stall Characteristics (5%): It is desirable to have a gentle stall. Manufacturing (5%): Airfoils with sharp trailing edges and under-camber are inherently difficult to manufacture. Figure of Merit Weight (%) Eppler 423 Eppler 560 SD 7062 NACA 4415 Delivery Performance Payload Performance Pitching Moment Stall Characteristics Manufacturing Total FOM Table 4.6 Airfoil Decision Matrix The effects of decalage, wing twist, dihedral, taper, fuselage geometry, propeller location, and endplates are considered. Decalage: Increasing the top wing incidence can provide 1% higher efficiency 5. However, this advantage does not outweigh the related manufacturing complexities. Geometric and Aerodynamic Twist: Twist helps increase the wing s span efficiency factor, thus improving its performance. It is not implemented due to manufacturing complexities. Wichita State University AeroShock Page 24 of 57
25 Dihedral/Anhedral: Dihedral is typically used to improve the aircraft s roll control. However, a biplane naturally has satisfactory roll behavior, therefore dihedral is unnecessary. Wing Taper: Taper increases the wing s AR, but decreases its area, affecting takeoff distance performance and battery optimization. Consequently, taper is not introduced. Fuselage Geometry: Flow visualization from half-scale wind tunnel testing (Section 7.4) showed excessive flow separation near the aft fuselage, which is tapered in all directions (as Figure 3.5 shows). As a result, taper angles are lowered and the empennage is raised to increase effectiveness. Propeller Location: The propeller is placed high on the nose to minimize slipstream blockage and to accelerate the flow on the fuselage s upper section. Endplates (Wing Boxing): A viable option to increase the effective AR is to box the wings. Figure 4.6 shows the lift coefficient increments and drag polar curves obtained from the half-scale wind tunnel test (Section 7.4). A penalty of using endplates is increased parasite drag; however they prove necessary to achieve the 2.5G loading requirement for the wing structure (Section 4.8). Another potential problem of wing boxing is the effect on lateral-directional stability. Lift Coefficient Boxed Unboxed AOA (Deg) Lift Coefficient Boxed Unboxed Drag Coefficient Figure 4.6 Endplate Comparison: (a) Lift Coefficient vs. AOA and (b) Drag Polar Curves Stagger Analysis Stagger improves the efficiency of the biplane cell 8 by reducing interference effects and trim drag 9. A Computational Fluid Dynamics (CFD) analysis is performed to evaluate the impact of positive and negative stagger on the biplane cell s lift coefficients, and to study the flow characteristics. Fluent 10, a commercial CFD package, is used to conduct the simulations. Unstructured computational grids are generated with a high grid density near the wing s surface (Y + ~1) to properly resolve the sub-viscous boundary layer, according to the specifications for the Spalart-Allmaras turbulence model 10. The flow conservation equations (continuity, momentum, and energy), along with the integral equation for the turbulence scalar are solved with a 2 nd -order coupled implicit upwind scheme. Wichita State University AeroShock Page 25 of 57
26 A symmetry condition is used to truncate the domain in the spanwise direction, while a far field boundary condition (Mach = and T = 300K) bounds the flow domain. All surfaces are modeled as no-slip. The results are post-processed in Fieldview. Figure 4.6 shows (a) the pressure coefficient distribution for 4-in of positive stagger and (b) the lift coefficient curves for a 4-in positively and negatively stagger biplane cell. In general, the forward wing produces an average of 25% more lift for both cases. Positive stagger is introduced after analyzing the results from CFD and wind tunnel testing (Section 7.4). Based on the vertical distance between the wing chords, at least 4-in of stagger is recommended 8. Top Bottom Lift Coefficient Positive Stagger Negative Stagger AOA (deg) Figure 4.6 (a) CFD Pressure Coefficient Distribution and (b) CFD Lift Curve Slopes Airfoil: SD 7062, No Decalage, Span = 4.83-ft, S ref = 9.67-ft 2, Re = 300, Preliminary Lift and Drag Estimates Table 4.7 presents the preliminary aircraft parasite drag build-up, while Figure 4.7 shows the (a) Liftto-Drag Curve and (b) Airplane Drag Polar. Component C D0 Wings Fuselage Empennage Landing Gear Total Wings Empennage 14% 9% 46% Fuselage Landing Gear 31% Table 4.7 Parasite Drag Build-up Wichita State University AeroShock Page 26 of 57
27 L/D AOA (deg) Lift Coefficient C D0 = Drag Coefficient Figure (a) Airplane L/D Curve and (b) Airplane Drag Polar 4.7 Propulsion Trade Studies The Optimization program predicted that the Delivery and Payload Missions can be completed with 12 Elite 1700 and 18 GP 2000 cells, respectively. Further trade studies are conducted to evaluate the effect of the discharge rate on the system performance. Table 4.8 shows the available voltage from different cell types at three different discharge rates. Figure 4.8 shows power available curves for these cells at various discharge levels. For the Delivery Mission, the curves for GP2000 and Elite 1700 overlap each other. In this case, the MDO program correctly selects Elite 1700 to minimize weight. On the other hand, the Payload Mission cannot be flown with Elite 1700 cells, as they cannot handle the predicted full throttle discharge rate (~35 Amps). This also confirms the MDO prediction that GP2000 must be used for the Payload Mission. 20 Amps Discharge Power Available (ft-lb/s) GP Volts/Cell Elite Volts/Cell Elite Volts/Cell GP 2000 and Elite 1700 overlap Flight Speed (ft/s) 35 Amps Discharge Power Available (ft-lb/s) GP Volts/Cell Sanyo Volt/Cell Elite Volts/Cell Flight Speed (ft/s) Figure 4.8 Power Available Curves (a) Delivery Mission, Amps and (b) Payload Mission, Amps Wichita State University AeroShock Page 27 of 57
28 Voltage Discharge Levels Cell 20 Amps 35 Amps 40 amps Elite V V V Elite V V V GP V V V Sanyo FAUP V V V Table 4.8 Cell s Voltage at Various Discharge Rates 4.8 Stability and Control Analysis The most important S&C tradeoff is the effect of stagger on the aircraft s longitudinal stability. The Aerodynamics group recommends introducing at least 4-in of positive stagger to reduce interference effects along with a high motor location to minimize slipstream blockage. Therefore, an inverted tail with no incidence is introduced to counteract the expected large negative pitching moments, especially during the Payload Mission. Figure 4.9 shows a diagram of the primary forces and moments for such a configuration. Figure 4.9 2D Longitudinal Stability Force and Moment Diagram at Cruise (AOA = 0-deg) Stability and Control Critical Parameters CG Location: For the present biplane configuration, CFD analysis (Section 4.5.1) shows that the top wing produces an average of 25% more lift than the lower wing. An evaluation of pitching moments suggests that the CG must be placed forward of the aircraft mean aerodynamic center (MAC) to ensure adequate static margins. Wichita State University AeroShock Page 28 of 57
29 Wing Location: Ideally, it is desirable to place the top wing as forward as possible to clear it from the payload bay. However, a too far forward MAC reduces the longitudinal static margin because the CG cannot be moved forward as much. Horizontal Tail Sizing: The horizontal tail must be sized to achieve adequate pitch stiffness while minimizing trim drag. Different airfoils are evaluated and a NACA 2408 is selected due to its production of sufficient lift without incidence. Historical data from Raymer 11 and previous DBF teams is also used to guide the process and to determine acceptable volume coefficients. The horizontal tail volume coefficient is Vertical Tail Sizing: The payload dimensions anticipate a large fuselage side area, which tends to affect the aircraft s lateral-directional stability. Therefore, it is necessary to use a large vertical tail that provides adequate yaw control. The same methods mentioned to size the horizontal tail are used for the vertical. The vertical tail volume coefficient is Control Surface Sizing: Large control surfaces are considered to increase the aircraft maneuverability. Based on historical data, guidelines from Roskam 4, and pilot feedback, the rudder and the elevator are sized to 50% of the vertical and horizontal tail, respectively. Flaperons are added on the top wing only to reduce weight and complexity. Based on historical data, Raymer 11 and Roskam 4, the flaperons are sized to 62% of the span and 12% of the chord Estimated Stability Characteristics The Stability & Control Module introduced in Section is used to evaluate the aircraft s stability characteristics. As Table 4.9 shows, the aircraft CG is ahead of the MAC for both missions, which yields satisfactory static margins with 4-in of stagger. Figure 4.10 shows the longitudinal trim plots for takeoff and cruise conditions. CM T/O δe = 13 Cruise δe = AOA (deg) CM T/O δe = 13 Cruise δe = AOA (deg) Figure 4.10 Longitudinal Trim Plots for (a) Delivery Mission and (b) Payload Mission Wichita State University AeroShock Page 29 of 57
30 Delivery Payload Top Wing AC (in) 12.5 CG (in) (avg.) Bottom Wing AC (in) 16.5 Static Margin 12.50% 9.10% (avg.) Aircraft MAC (in) 13.9 Table 4.9 Static Margin Characteristics The stability coefficients listed in Table 4.10 are initially calculated using methods from Roskam 4 and Raymer 11. Wind Tunnel Testing (Section 7.6) provides more accurate estimates. The stability derivatives predict a stable airplane in both static and dynamic conditions. The X-wind capability, calculated using methods from Yechout and Morris 12, is 17.6 ft/s (12 mph). C L0 C M δ C C e lβ nβ C Lα C Mq C l δ a Cn δ a C L δ e C y0 C l δ C r n δ r C M 0 C yβ C l C r nr C Mα C y δ a C lp C n p Table 4.10 Stability Derivatives (1/rad) for Cruising Delivery Flight (AOA = 3 deg) 4.9 Structural Analysis Structural analysis is conducted after identifying the material system and critical loading conditions Critical Design Loads and Parameters The following parameters are critical for weight reduction and airframe integrity. Manufacturing Process and Materials: Investigation of alternative materials and construction methods are required to achieve the lightest possible aircraft (detailed in Section 6.0). Top Wing Arrangement: The restriction on top wing placement requires special structural considerations and analysis. The wings must be able to withstand a 2.5-G tip test. Motor Mount: It must be capable of distributing instantaneous motor loads (9-lb thrust and 12 inlb torque) with a sufficient factor of safety. Main Landing Gear Mount: It must withstand a 5-G landing at full weight Structural Optimization Structural optimization is paramount to reducing system and battery weight. The first study evaluates possible manufacturing techniques that could be used to build a light and reliable airplane. From analysis presented in Section 6.0, a hybrid composite method using fiberglass reinforced balsa is selected to construct a monocoque fuselage, while a balsa build-up approach is chosen for the wings and empennage. Wichita State University AeroShock Page 30 of 57
31 The most important issue carried from conceptual design is the interference between the top wing spars and the payload bay. This can negatively impact loading time, and may provide a risk to the wing structure during payload handling. To circumvent these potential problems, it is determined necessary to avoid a continuous spar and to attach the top wing to the fuselage side-walls. The proposed aircraft structure is analyzed numerically and experimentally. First, material properties for fiberglass reinforced balsa are obtained by conducting an MTS tensile test (Section 7.2). Next, a perfectly monocoque fuselage structure is modeled and solved in PATRAN/NASTRAN, a commercial finite element analysis package, to identify stress concentration points (the nose section is modeled without fillets for simplicity). Two critical loading scenarios are used: a 2.5-G load on the wing-fuselage attachment at maximum speed and throttle, and a 5-G landing at maximum weight. The first scenario is used to design proper reinforcements and load paths near the wing/fuselage connection and motor mount, while the second is used to design the main fuselage structure and landing gear mount. The equivalent loads applied at the wing-fuselage attachment points on the fuselage model are calculated using Euler-Bernoulli Beam Theory 6 with a triangular distributed loading of 8.75-lb and a 0.6 ftlb torsional moment applied on each wing. The thrust loads are 9.5-lb and 12-in-lb at the motor mount location. Results yield maximum stresses of 625-psi located at the root chord of the top wing, and 3,500- psi located at the motor mount. The 5-G landing scenario consists of a 70-lb landing load applied at the landing gear mount, shown in Figure A maximum stress of 16,200-psi is obtained. Figure 4.11 FEM Results for a 5-G Landing at Maximum Weight Wichita State University AeroShock Page 31 of 57
32 The results obtained from FEM analysis subsequently led to the design of appropriate load paths. As Figure 4.12 suggests, U-frames at the mid-fuselage section distribute landing loads, while longerons connect the main structure and reinforce the fuselage side panels. A motor mount and an aft bulkhead are used to support loads from the motor and empennage, which are transferred to the main structure via stringers. Once proper load paths are determined, calculations based on Euler-Bernoulli Beam Theory 7 and Strength of Materials 12 are used to determine material and dimensions for the fuselage and wing s structure, which are documented in Sections 5.6 and 6.3. Figure 4.12 Load Paths and Critical Loads Internal fuselage attachment plates along with endplates are considered to reduce shear stresses and bending moments at the top wing roots. Experimental testing with a wiffle-tree apparatus evaluated the structural integrity of the proposed wing design (Section 7.1). Both wings were epoxy-glued to the fuselage walls. The experimental results showed that the system is capable of handling 2.6-G s, while deflections experienced at each wingtip were demonstrated to be approximately 2-in lower than predicted without endplates. The failure mode was compression buckling on the fuselage side panel. This outcome can be prevented if the low wing is not glued to the fuselage Aircraft Performance Predictions Performance estimations are shown in Table L/D versus Flight Speed and Power Available versus Power Required are shown for both missions in Figures 4.13 and 4.14, respectively. The cruise speed for the Delivery and Payload Missions are 40 ft/s and 50 ft/s, respectively. The maximum speeds are 59-ft/s and 75-ft/s for the Delivery and Payload Missions, respectively. Wichita State University AeroShock Page 32 of 57
33 Basic Performance Parameters Delivery Mission Payload Mission (L/D) max (with flaps) 5.12 Max. Weight (lb) 5.75 Max. Weight (lb) 13.5 C Lmax (12 deg) 1.0 Battery Weight (lb) 0.75 Battery Weight (lb) 1.50 C D W / S (lb/ft 2 ) 0.60 W / S (lb/ft 2 ) 1.40 Oswald Efficiency Factor 0.77 T / W (takeoff) 0.87 T / W (takeoff) 0.67 Anticipated load factor 2.5 Cruise Speed (ft/s) 40.0 Cruise Speed (ft/s) 50.0 Rotation AOA (deg) 12 Stall Speed (ft/s) 22.0 Stall Speed (ft/s) 35.0 Rotation L/D (with flaps) 3.1 Takeoff distance (ft) 46.0 Takeoff distance (ft) 71.0 Table 4.11 Aircraft Performance Predictions L/D Delivery Mission Payload Mission Flight Speed (ft/s) Figure 4.13 L/D vs. Flight Speed Power Required (Delivery) Power Available (Delivery) 400 Power Required (Payload) Power Available (Payload) Power (ft-lb/sec) Flight Speed (ft/s) Figure 4.14 Power Required vs. Flight Speed Wichita State University AeroShock Page 33 of 57
34 4.11 Mission Performance Prediction Table 4.12 shows current, energy, and time budgets for Delivery and Payload (max. wt.) Missions. 1st Lap Current (Amps) Delivery Mission Time (sec) Energy (mah) Current (Amps) Payload Mission Time (sec) Energy (mah) Takeoff Climb Cruise (2000 ft) turn (x 2) Turn (360) nd Lap Cruise (2000 ft) turn (x 2) Turn (360) rd Lap 19.1(avg.) Total , ,700.0 Available energy - - 1, Excess Energy Number of Laps Table 4.12 Current and Energy Budget for Delivery and Payload Missions 5.0 Detail Design During detail design, all systems and components are selected and integrated. The aircraft structural characteristics and capabilities are finalized, and a complete aircraft sizing is expanded into a CAD loft depicting all features and dimensions. A weight and balance summary is compiled for each mission, including different payload combinations. Finally, flight and mission performance parameters are documented, along with the Rated Aircraft Cost for the Payload Mission. 5.1 Propulsion System Selection and Performance The propulsion system components (Table 5.1) are selected based on data from Optimization Results (Section 4.4) and Propulsion Trade Studies (Section 4.7). The Opto-45 speed controller is chosen for its lightweight and its ability to handle high voltage. The batteries are located in front of the fore U-frames. Propulsion system performance predictions for this configuration are shown in Figure 5.1. The thrust values presented are validated experimentally in Section 8.0. Propulsion Configuration Motor NEU 1506/3Y geared 5.2:1 Speed Controller Opto-45 Delivery Mission Payload Mission Battery 12 Elite GP 2000 Propeller APC 18x10E APC 19x10E Table 5.1 Propulsion System Configuration Wichita State University AeroShock Page 34 of 57
35 10 8 Delivery Mission Payload Mission Thrust (lb) Flight Speed (ft/s) Figure 5.1 Thrust vs. Flight Speed 5.2 Control Sub-System Selection The control subsystems and selection justification are shown in Table 5.2. The elevator and rudder servos are located on the pressure side of the horizontal tail, on either side of the vertical. The flaperon servos are also placed on the top wing pressure side. The receiver battery is in front of the fore U-frames. The receiver is located behind the rear U-frames to minimize required wire length. Subsystem locations are shown in the Drawing Package (Section 5.9 Systems Layout/Location). Subsystem Model Weight (oz) Selection Justification Servos (4) Hitec HS-85BB Lightweight, Sufficient Torque Receiver JR R790UL 7-channel 0.42 Lightweight Receiver Battery JR Extra Lightweight, Adequate Capacity Transmitter JR X9303 N/A Pilot Preference Table 5.2 Subsystem Selection and Justification 5.3 Aircraft Sizing Fuselage Max Height (in) 10.5 Length (in) 39 Maximum Diameter (in) 16.7 Landing Gear Height 6 Base Diameter (in) 7.2 Aft upsweep (deg) 12 Biplane Wings Horizontal Tail Vertical Tail Airfoil SD 7062 Airfoil (inverted) NACA 2408 Airfoil Flat Chord (in) 12 Chord (in) 10 Root Chord (in) 5 Span (in) 58 Span (in) 24 Tip Chord (in) 3 Area(in 2 ) 1392 Area (in 2 ) 240 Span (in) 12.5 Geometric AR 2.4 Aspect Ratio 2.4 Area (in 2 ) 81.3 Biplane AR 3.1 Incidence (deg) 0 Aspect Ratio 2.74 Stagger (in) 4 Volume Ratio 0.3 Volume Ratio 0.03 Aileron Chord (in) 1.7 Elevator Chord (in) 5 Rudder Chord (in) 5 Sa/S 0.04 Se/St 0.6 Sr/Sv 0.6 Table 5.3 Aircraft Sizing Wichita State University AeroShock Page 35 of 57
36 5.4 Aircraft Weight and Balance Weight Build-Up Delivery Mission Components Weight (lb) Battery Weight (lb) 0.75 Fuselage 1.30 Gross Weight (lb) 5.55 Landing Gear 0.12 CG Location (in) Payload Restraint 0.30 Payload Mission Wings 1.40 Battery Weight (lb) 1.5 Empennage 0.25 RAC (lb 2 ) 7.2 Servos 0.16 Payload Option Gross Wt. (lb) CG (in) Receiver and Rx Battery bottles (7 lb) Wires, Bolts bricks (7.2 lb) Motor/Speed Controller bottles / 1 brick (6.8 lb) Propeller bottles / 2 bricks (7.1 lb) System Weight bottles / 3 bricks (6.9 lb) Table 5.4 (a) Weight Build-Up and (b) Mission Weight and Balance 5.5 Flight and Mission Performance Table 5.5 lists some of the most important flight and mission performance parameters. In addition, Figure 5.2 shows the predicted (a) L/D curve and (b) drag polar for the final airplane with and without flaperon deflection. Flight and Mission Performance Delivery Payload C D Takeoff Distance (ft/s) Oswald Efficiency Factor 0.77 Maximum Climb Rate (ft/min) CL max (No flaps) 1.01 Cruise Speed (ft/s) L/D max (No flaps) 4.10 Stall Speed (ft/s) CL stall (No Flaps) 1.23 Maximum Speed (ft/s) CL max (Flaps 15º) 1.34 Maximum Turn Rate (deg/min) L/D max (Flaps 15º) 5.12 Max Load Factor Table 5.5 Flight and Mission Performance 6 Flaps No Flaps 1 Flaps No Flaps L/D AOA (deg) Lift Coefficient Drag Coefficient Figure 5.2 Predicted Aerodynamic Performance Wichita State University AeroShock Page 36 of 57
37 5.6 Structural Design and Capabilities The aircraft structural design is based on the results from Structural Analysis (Section 4.9), and Manufacturing Methods and Materials FOM (Section 6.2). The middle and aft fuselage skin is constructed by joining flat-plate sections of fiberglass reinforced balsa material. Four plywood U-frames (1/8-in thick) are attached to the side and bottom sections to reduce skin buckling and to efficiently transfer landing loads. Two plywood longerons (1/8-in thick) run across the base of the U-frames to stiffen the fuselage floor and to provide a resting platform for the payload bricks. An aft plywood bulkhead (1/8-in thick) is used to support the empennage load, which is transferred to the rear U-frames via 4 balsa stringers (1/4x1/4-in). The nose is made using a molded method. This one piece structure better resists motor torque by providing improved shear flow. The motor is attached to the nose by a 5-ply plywood mount, which is connected to the main structure via 2 balsa stringers (1/4x1/4-in). In addition, a 5-ply plywood mount attached between the two frontal U-frames supports the main landing loads, while a small 3-ply plywood mount attaches the secondary landing gear to the aft fuselage. The hatch is a composite laminate plate attached to the fuselage with Dubro TM hinges and light brass latches. Based on extended FEM analysis originally conducted in Section 4.9.2, the landing gear mount can support more than 5 G s with a safety factor of 1.2, and the nose/motor mount is designed for maximum propulsion loads of lb and 18-in-lb which corresponds to a safety factor of 1.5. Figure 5.3 shows the fuselage structural layout. Figure 5.3 Internal Fuselage Structural Layout The top wing consists of 2 sections which are fixed to the fuselage side-walls by means of internal attachment plates. The top wing is framed by ribs and spaced with shear webs to improve bending rigidity and shear loading capabilities. Wichita State University AeroShock Page 37 of 57
38 Five spruce spars span the wing: 1 at the leading edge, 2 at the quarter chord, and 2 at the trailing edge. The front-most spar is used to provide wing rigidity, the quarter chord spars handle bending loads, while the rear 2 handle torsional loads introduced from the flaperons. Based on structural testing results described in Sections and 7.1, and FEM analysis, the top wing/fuselage connection is capable of supporting design loads up to 2.5 G s with a safety factor of 1.2. The bottom wing consists of two joined wing sections and is attached to the fuselage floor by rubber bands strung across 2 dowel rods (1/4-in diameter balsa). The bottom wing has the same rib and shear plate configuration as the top wing. The main spar configuration is the same as the top wing, without the two trailing edge spars. In addition a spar which spans the fuselage s width is added to reinforce the joint between the two wing sections Balsa sheeting is applied to the leading and trailing edge of both wings to preserve the airfoil shape. The wings are subsequently covered with Ultracote TM to create a light skin. Endplates connect the top and bottom wing to provide rigidity to the overall wing structure (Figure 5.4 (a)). The horizontal stabilizer uses two spars to connect the ribs, similar to the top wing, and the vertical tail and rudder consists of a balsa truss structure (Figure 5.4 (b)). The empennage components are also covered with Ultracote TM. Figure 5.4 Structural Layout of (a) Wings and (b) Empennage 5.7 Landing Gear Selection For the primary landing gear, carbon fiber is selected over fiberglass and aluminum due to its high strength-to-weight ratio. The two options considered are: Commercially Available: Commercial landing gear comes in many different sizes and weights. These are usually built with a large factor of safety, which may be heavier than necessary. Custom made: The landing gear can be made exactly to the dimensions and mechanical properties desired. However, it is time consuming and requires a great deal of expertise. Wichita State University AeroShock Page 38 of 57
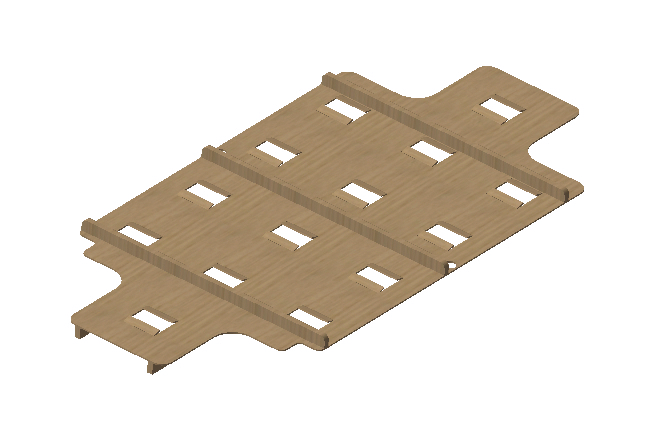
39 The commercially available Graphtech RC 206 Banshee E3D carbon landing gear is selected over the custom gear option. It weighs only 1.9 ounces and provides a ground attitude of 12 degrees. 5.8 Payload Solution The bottle restraint system is a speed-loader design made out of a fiberglass reinforced balsa plate with trap doors to secure the bottles by the neck (Figure 5.5 (a)). Bottles that cannot be held by the neck due to a high collar location are first placed inside the aircraft, and then secured underneath by the bottle restraint. The bottle restraint rests on 6 brackets (3 on each side). The outermost brackets are covered with wood flaps to prevent vertical movement, and are attached to the fuselage sidewalls with CA hinges. The middle brackets on each side have a one-half inch diameter vertical dowel rod, which mates with holes drilled in the bottle restraint to prevent horizontal shifting. This fixture also increases the fuselage s structural rigidity by connecting the two fuselage sidewalls (Figure 5.5 (b)). The bricks rest on top of the longerons, and are restrained by a balsa box-frame to prevent horizontal shifting. Cloth straps fitted with snap buttons are attached to either side of the box, and encircle the bricks to restrain them from vertical movement. Wood Flap Vertical Dowel Rod Brackets Figure 5.5 (a) Bottle Restraint and (b) Bottle Restraint Attachment 5.9 Drawing Package The drawing package, created using CATIA V5, includes the following drawings: Aircraft 3-view Structural Arrangement Systems Layout Payload System and Restraints Wichita State University AeroShock Page 39 of 57

40
41
42
43
Lab 8 Notes Basic Aircraft Design Rules 6 Apr 06
 Lab 8 Notes Basic Aircraft Design Rules 6 Apr 06 Nomenclature x, y longitudinal, spanwise positions S reference area (wing area) b wing span c average wing chord ( = S/b ) AR wing aspect ratio C L lift
Aerodynamic Design Optimization Discussion Group Case 4: Single- and multi-point optimization problems based on the CRM wing
 Aerodynamic Design Optimization Discussion Group Case 4: Single- and multi-point optimization problems based on the CRM wing Lana Osusky, Howard Buckley, and David W. Zingg University of Toronto Institute
ESTIMATING R/C MODEL AERODYNAMICS AND PERFORMANCE
 ESTIMATING R/C MODEL AERODYNAMICS AND PERFORMANCE Adapted from Dr. Leland M. Nicolai s Write-up (Technical Fellow, Lockheed Martin Aeronautical Company) by Dr. Murat Vural (Illinois Institute of Technology)
Chapter 6 Lateral static stability and control - 3 Lecture 21 Topics
 Chapter 6 Lateral static stability and control - 3 Lecture 21 Topics 6.11 General discussions on control surface 6.11.1 Aerodynamic balancing 6.11.2 Set back hinge or over hang balance 6.11.3 Horn balanace
APPENDIX 3-B Airplane Upset Recovery Briefing. Briefing. Figure 3-B.1
 APPENDIX 3-B Airplane Upset Recovery Briefing Industry Solutions for Large Swept-Wing Turbofan Airplanes Typically Seating More Than 100 Passengers Briefing Figure 3-B.1 Revision 1_August 2004 Airplane
Aeronautical Testing Service, Inc. 18820 59th DR NE Arlington, WA 98223 USA. CFD and Wind Tunnel Testing: Complimentary Methods for Aircraft Design
 Aeronautical Testing Service, Inc. 18820 59th DR NE Arlington, WA 98223 USA CFD and Wind Tunnel Testing: Complimentary Methods for Aircraft Design Background Introduction ATS Company Background New and
NACA Nomenclature NACA 2421. NACA Airfoils. Definitions: Airfoil Geometry
 0.40 m 0.21 m 0.02 m NACA Airfoils 6-Feb-08 AE 315 Lesson 10: Airfoil nomenclature and properties 1 Definitions: Airfoil Geometry z Mean camber line Chord line x Chord x=0 x=c Leading edge Trailing edge
Cessna Skyhawk II / 100. Performance Assessment
 Cessna Skyhawk II / 100 Performance Assessment Prepared by John McIver B.Eng.(Aero) Temporal Images 23rd January 2003 http://www.temporal.com.au Cessna Skyhawk II/100 (172) Performance Assessment 1. Introduction
Table of Contents. 1.0! Executive Summary... 3! 2.0! Management Summary... 4! 3.0! Conceptual Design... 6! 4.0! Preliminary Design... 18!
 Table of Contents 1.0! Executive Summary... 3! 2.0! Management Summary... 4! 2.1! Team Organization... 4! 2.2! Project Milestone Chart... 6! 3.0! Conceptual Design... 6! 3.1! Design Constraints... 6! 3.2!
Aerospace Engineering 3521: Flight Dynamics. Prof. Eric Feron Homework 6 due October 20, 2014
 Aerospace Engineering 3521: Flight Dynamics Prof. Eric Feron Homework 6 due October 20, 2014 1 Problem 1: Lateral-directional stability of Navion With the help of Chapter 2 of Nelson s textbook, we established
Light Aircraft Design
 New: Sport Pilot (LSA) The Light Aircraft Design Computer Program Package - based on MS-Excelapplication was now extented with the new Sport Pilots (LSA) loads module, which includes compliance for the
HALE UAV: AeroVironment Pathfinder
 HALE UAV: AeroVironment Pathfinder Aerodynamic and Stability Analysis Case Study: Planform Optimization Desta Alemayehu Elizabeth Eaton Imraan Faruque Photo courtesy NASA Dryden Photo Gallery 1 Pathfinder
Computational Aerodynamic Analysis on Store Separation from Aircraft using Pylon
 International Journal of Engineering Science Invention (IJESI) ISSN (Online): 2319 6734, ISSN (Print): 2319 6726 www.ijesi.org ǁ PP.27-31 Computational Aerodynamic Analysis on Store Separation from Aircraft
AE 430 - Stability and Control of Aerospace Vehicles
 AE 430 - Stability and Control of Aerospace Vehicles Atmospheric Flight Mechanics 1 Atmospheric Flight Mechanics Performance Performance characteristics (range, endurance, rate of climb, takeoff and landing
Wing Design: Major Decisions. Wing Area / Wing Loading Span / Aspect Ratio Planform Shape Airfoils Flaps and Other High Lift Devices Twist
 Wing Design: Major Decisions Wing Area / Wing Loading Span / Aspect Ratio Planform Shape Airfoils Flaps and Other High Lift Devices Twist Wing Design Parameters First Level Span Area Thickness Detail Design
Application of CFD Simulation in the Design of a Parabolic Winglet on NACA 2412
 , July 2-4, 2014, London, U.K. Application of CFD Simulation in the Design of a Parabolic Winglet on NACA 2412 Arvind Prabhakar, Ayush Ohri Abstract Winglets are angled extensions or vertical projections
A. Hyll and V. Horák * Department of Mechanical Engineering, Faculty of Military Technology, University of Defence, Brno, Czech Republic
 AiMT Advances in Military Technology Vol. 8, No. 1, June 2013 Aerodynamic Characteristics of Multi-Element Iced Airfoil CFD Simulation A. Hyll and V. Horák * Department of Mechanical Engineering, Faculty
APP Aircraft Performance Program Demo Notes Using Cessna 172 as an Example
 APP Aircraft Performance Program Demo Notes Using Cessna 172 as an Example Prepared by DARcorporation 1. Program Layout & Organization APP Consists of 8 Modules, 5 Input Modules and 2 Calculation Modules.
Lift and Drag on an Airfoil ME 123: Mechanical Engineering Laboratory II: Fluids
 Lift and Drag on an Airfoil ME 123: Mechanical Engineering Laboratory II: Fluids Dr. J. M. Meyers Dr. D. G. Fletcher Dr. Y. Dubief 1. Introduction In this lab the characteristics of airfoil lift, drag,
SIX DEGREE-OF-FREEDOM MODELING OF AN UNINHABITED AERIAL VEHICLE. A thesis presented to. the faculty of
 SIX DEGREE-OF-FREEDOM MODELING OF AN UNINHABITED AERIAL VEHICLE A thesis presented to the faculty of the Russ College of Engineering and Technology of Ohio University In partial fulfillment of the requirement
High-Lift Systems. High Lift Systems -- Introduction. Flap Geometry. Outline of this Chapter
 High-Lift Systems Outline of this Chapter The chapter is divided into four sections. The introduction describes the motivation for high lift systems, and the basic concepts underlying flap and slat systems.
Using CEASIOM-SUMO RapidMeshing in Computational Study of. Asymmetric Aircraft Design
 Using CEASIOM-SUMO RapidMeshing in Computational Study of Asymmetric Aircraft Design Mengmeng Zhang, Arthur Rizzi Royal Institute of Technology (KTH), Stockholm, Sweden & D. Raymer Conceptual Research
This file contains the full script of the corresponding video, published on YouTube. November 2014: http://youtu.be/wbu6x0hsnby
 This file contains the full script of the corresponding video, published on YouTube. November 2014: http://youtu.be/wbu6x0hsnby Background papers and links to formal FAA and EASA Aviation Regulations and
THE CFD SIMULATION OF THE FLOW AROUND THE AIRCRAFT USING OPENFOAM AND ANSA
 THE CFD SIMULATION OF THE FLOW AROUND THE AIRCRAFT USING OPENFOAM AND ANSA Adam Kosík Evektor s.r.o., Czech Republic KEYWORDS CFD simulation, mesh generation, OpenFOAM, ANSA ABSTRACT In this paper we describe
Airplane/Glider Design Guidelines and Design Analysis Program
 Airplane/Glider Design Guidelines and Design Analysis Program Ever have the urge to design your own plane but didn t feel secure enough with your usual TLAR (that looks about right) methods to invest all
Practice Problems on Boundary Layers. Answer(s): D = 107 N D = 152 N. C. Wassgren, Purdue University Page 1 of 17 Last Updated: 2010 Nov 22
: D = 107 N D = 152 N. C. Wassgren, Purdue University Page 1 of 17 Last Updated: 2010 Nov 22") BL_01 A thin flat plate 55 by 110 cm is immersed in a 6 m/s stream of SAE 10 oil at 20 C. Compute the total skin friction drag if the stream is parallel to (a) the long side and (b) the short side. D =
BL_01 A thin flat plate 55 by 110 cm is immersed in a 6 m/s stream of SAE 10 oil at 20 C. Compute the total skin friction drag if the stream is parallel to (a) the long side and (b) the short side. D =
CHAPTER 7 CLIMB PERFORMANCE
 CHAPTER 7 CLIMB PERFORMANCE 7 CHAPTER 7 CLIMB PERFORMANCE PAGE 7.1 INTRODUCTION 7.1 7.2 PURPOSE OF TEST 7.1 7.3 THEORY 7.2 7.3.1 SAWTOOTH CLIMBS 7.2 7.3.2 STEADY STATE APPROACH TO CLIMB PERFORMANCE 7.4
Flightlab Ground School 5. Longitudinal Static Stability
 Flightlab Ground School 5. Longitudinal Static Stability Copyright Flight Emergency & Advanced Maneuvers Training, Inc. dba Flightlab, 2009. All rights reserved. For Training Purposes Only Longitudinal
AIRCRAFT GENERAL www.theaviatornetwork.com GTM 1.1 2005 1-30-05 CONTENTS
 www.theaviatornetwork.com GTM 1.1 CONTENTS INTRODUCTION... 1.2 GENERAL AIRPLANE... 1.2 Fuselage... 1.2 Wing... 1.2 Tail... 1.2 PROPELLER TIP CLEARANCE... 1.2 LANDING GEAR STRUT EXTENSION (NORMAL)... 1.2
Lecture 8 : Dynamic Stability
 Lecture 8 : Dynamic Stability Or what happens to small disturbances about a trim condition 1.0 : Dynamic Stability Static stability refers to the tendency of the aircraft to counter a disturbance. Dynamic
Fundamentals of Airplane Flight Mechanics
 Fundamentals of Airplane Flight Mechanics David G. Hull Fundamentals of Airplane Flight Mechanics With 125 Figures and 25 Tables 123 David G. Hull The University of Texas at Austin Aerospace Engineering
Model Aircraft Design
 Model Aircraft Design A teaching series for secondary students Contents Introduction Learning Module 1 How do planes fly? Learning Module 2 How do pilots control planes? Learning Module 3 What will my
AERODYNAMIC ANALYSIS OF BLADE 1.5 KW OF DUAL ROTOR HORIZONTAL AXIS WIND TURBINE
 AERODYNAMIC ANALYSIS OF BLADE 1.5 KW OF DUAL ROTOR HORIZONTAL AXIS WIND TURBINE HITENDRA KURMI Research scholar, School of Energy and Environmental Managment,UTD, RGPV Bhopal,MP,INDIA htr.ptl@gmail.com
CFD Analysis on Airfoil at High Angles of Attack
 CFD Analysis on Airfoil at High Angles of Attack Dr.P.PrabhakaraRao¹ & Sri Sampath.V² Department of Mechanical Engineering,Kakatiya Institute of Technology& Science Warangal-506015 1 chantifft@rediffmail.com,
SELECTION AND ANALYSIS OF THE LANDING GEAR FOR UNMANNED AERIAL VEHICLE FOR SAE AERO DESIGN SERIES
 INTERNATIONAL JOURNAL OF MECHANICAL ENGINEERING AND TECHNOLOGY (IJMET) International Journal of Mechanical Engineering and Technology (IJMET), ISSN 0976 6340(Print), ISSN 0976 6340 (Print) ISSN 0976 6359
XFlow CFD results for the 1st AIAA High Lift Prediction Workshop
 XFlow CFD results for the 1st AIAA High Lift Prediction Workshop David M. Holman, Dr. Monica Mier-Torrecilla, Ruddy Brionnaud Next Limit Technologies, Spain THEME Computational Fluid Dynamics KEYWORDS
Aerodynamics of Flight
 Chapter 2 Aerodynamics of Flight Introduction This chapter presents aerodynamic fundamentals and principles as they apply to helicopters. The content relates to flight operations and performance of normal
Cessna 172SP & NAV III Maneuvers Checklist
 Cessna 172SP & NAV III Maneuvers Checklist Introduction Power Settings This document is intended to introduce to you the standard method of performing maneuvers in Sunair Aviation s Cessna 172SP and NAV
VARIABLE STABILITY FLIGHT OPERATIONS MANUAL
 SPACE INSTITUTE VARIABLE STABILITY FLIGHT OPERATIONS MANUAL Prepared by the Aviation Systems and Flight Research Department September 2004 Index 1.1 General Description...1 1.2 Variable Stability System...5
Aerodynamic Department Institute of Aviation. Adam Dziubiński CFD group FLUENT
 Adam Dziubiński CFD group IoA FLUENT Content Fluent CFD software 1. Short description of main features of Fluent 2. Examples of usage in CESAR Analysis of flow around an airfoil with a flap: VZLU + ILL4xx
Performance. Power Plant Output in Terms of Thrust - General - Arbitrary Drag Polar
 Performance 11. Level Flight Performance and Level flight Envelope We are interested in determining the maximum and minimum speeds that an aircraft can fly in level flight. If we do this for all altitudes,
Technical data. Assembly: Introduction. Before starting construction. Equipment needed. Glider or Electro Glider?
 Palio pro S2084 Technical data Wing span: Lenght: Weight: Wing area: Wing loading: El. Motor/ no. of cells: Controls: Introduction 2150 mm 1150 mm 1120 g 1860 g 42 dm2 27 g/dm2 44 g/dm2 600 / 7-8 cells
CFD Analysis of Civil Transport Aircraft
 IJSRD - International Journal for Scientific Research & Development Vol. 3, Issue 06, 2015 ISSN (online): 2321-0613 CFD Analysis of Civil Transport Aircraft Parthsarthi A Kulkarni 1 Dr. Pravin V Honguntikar
RECYCLING OLD WEIGHT ASSESSMENT METHODS AND GIVING THEM NEW LIFE IN AIRCRAFT CONCEPTUAL DESIGN
 28 TH INTERNATIONAL CONGRESS OF THE AERONAUTICAL SCIENCES Abstract RECYCLING OLD WEIGHT ASSESSMENT METHODS AND GIVING THEM NEW LIFE IN AIRCRAFT CONCEPTUAL DESIGN Aircraft conceptual design is an iterative
Build and Fly the Fokker D- 8
 Details are carefully carried out. Note movable controls The high wing gives it unusual stability Build and Fly the Fokker D- 8 Complete Data From Which You Can Build a Successful Model of a Famous German
Propeller Efficiency. Rule of Thumb. David F. Rogers, PhD, ATP
 Propeller Efficiency Rule of Thumb David F. Rogers, PhD, ATP Theoretically the most efficient propeller is a large diameter, slowly turning single blade propeller. Here, think the Osprey or helicopters.
The Influence of Aerodynamics on the Design of High-Performance Road Vehicles
 The Influence of Aerodynamics on the Design of High-Performance Road Vehicles Guido Buresti Department of Aerospace Engineering University of Pisa (Italy) 1 CONTENTS ELEMENTS OF AERODYNAMICS AERODYNAMICS
A NUMERICAL METHOD TO PREDICT THE LIFT OF AIRCRAFT WINGS AT STALL CONDITIONS
 Braz. Soc. of Mechanical Sciences and Engineering -- ABCM, Rio de Janeiro, Brazil, Nov. 29 -- Dec. 3, 24 A NUMERICAL METHOD TO PREDICT THE LIFT OF AIRCRAFT WINGS AT STALL CONDITIONS Marcos A. Ortega ITA
ENHANCEMENT OF AERODYNAMIC PERFORMANCE OF A FORMULA-1 RACE CAR USING ADD-ON DEVICES B. N. Devaiah 1, S. Umesh 2
 ENHANCEMENT OF AERODYNAMIC PERFORMANCE OF A FORMULA-1 RACE CAR USING ADD-ON DEVICES B. N. Devaiah 1, S. Umesh 2 1- M. Sc. [Engg.] Student, 2- Asst. Professor Automotive and Aeronautical Engineering Department,
Behavioral Animation Simulation of Flocking Birds
 Behavioral Animation Simulation of Flocking Birds Autonomous characters determine their actions Simulating the paths of individuals in: flocks of birds, schools of fish, herds of animals crowd scenes 1.
Interactive Aircraft Design for Undergraduate Teaching
 Interactive Aircraft Design for Undergraduate Teaching Omran Al-Shamma, Dr. Rashid Ali University of Hertfordshire Abstract: This paper presents new software package developed for Aircraft Design. It is
The aerodynamic center
 The aerodynamic center In this chapter, we re going to focus on the aerodynamic center, and its effect on the moment coefficient C m. 1 Force and moment coefficients 1.1 Aerodynamic forces Let s investigate
Computational Modeling of Wind Turbines in OpenFOAM
 Computational Modeling of Wind Turbines in OpenFOAM Hamid Rahimi hamid.rahimi@uni-oldenburg.de ForWind - Center for Wind Energy Research Institute of Physics, University of Oldenburg, Germany Outline Computational
Requirements to servo-boosted control elements for sailplanes
 Requirements to servo-boosted control elements for sailplanes Aerospace Research Programme 2004 A. Gäb J. Nowack W. Alles Chair of Flight Dynamics RWTH Aachen University 1 XXIX. OSTIV Congress Lüsse, 6-136
CFD results for TU-154M in landing configuration for an asymmetrical loss in wing length.
 length. PAGE [1] CFD results for TU-154M in landing configuration for an asymmetrical loss in wing length. Summary: In CFD work produced by G. Kowaleczko (GK) and sent to the author of this report in 2013
Design of Steel Structures Prof. S.R.Satish Kumar and Prof. A.R.Santha Kumar. Fig. 7.21 some of the trusses that are used in steel bridges
 7.7 Truss bridges Fig. 7.21 some of the trusses that are used in steel bridges Truss Girders, lattice girders or open web girders are efficient and economical structural systems, since the members experience
Aviation Supplies & Academics, Inc. 7005 132nd Place SE Newcastle, Washington 98059-3153 www.asa2fly.com
 The Pilot s Manual 1: Flight School Aviation Supplies & Academics, Inc. 7005 132nd Place SE Newcastle, Washington 98059-3153 www.asa2fly.com Originally published by Aviation Theory Centre 1990 1993. Fourth
Simulation at Aeronautics Test Facilities A University Perspective Helen L. Reed, Ph.D., P.E. ASEB meeting, Irvine CA 15 October 2014 1500-1640
 Simulation at Aeronautics Test A University Perspective Helen L. Reed, Ph.D., P.E. ASEB meeting, Irvine CA 15 October 2014 1500-1640 Questions How has the ability to do increasingly accurate modeling and
CFD Simulations and Wind Tunnel Experiments of a Generic Split-Canard Air-to-Air Missile at High Angles of Attack in Turbulent Subsonic Flow
 AIAA Atmospheric Flight Mechanics Conference 08-11 August 2011, Portland, Oregon AIAA 2011-6335 CFD Simulations and Wind Tunnel Experiments of a Generic Split-Canard Air-to-Air Missile at High Angles of
Design and Structural Analysis of the Ribs and Spars of Swept Back Wing
 Design and Structural Analysis of the Ribs and Spars of Swept Back Wing Mohamed Hamdan A 1, Nithiyakalyani S 2 1,2 Assistant Professor, Aeronautical Engineering & Srinivasan Engineering College, Perambalur,
parts of an airplane Getting on an Airplane BOX Museum Aeronautics Research Mission Directorate in a Series
 National Aeronautics and Space Administration GRADES K-2 Aeronautics Research Mission Directorate Museum in a BOX Series www.nasa.gov parts of an airplane Getting on an Airplane MUSEUM IN A BOX Getting
Micro. Pitts Special for the RFFS-100 by Chris O Riley
 Micro Pitts Special for the RFFS-100 by Chris O Riley F1 F2 F3 F4 1 2 3 4 All wood 1/32 inch sheet unless otherwise stated. F1 F2 F3 F4 Small balsa blocks for LG reinforcement Small balsa blocks for LG
Chapter 3. Track and Wheel Load Testing
 Chapter 3 Track and Wheel Load Testing This chapter describes the track, truck, and testing equipment that were used by the Transportation Technology Center, Inc. (TTCI) for collecting the data that was
SebArt professional line
 SebArt professional line New Sukhoi 29S 50E ARF ASSEMBLY MANUAL The new Sukhoi 29S 50E ARF was designed by Italy aerobatic pilot, Sebastiano Silvestri and the design is based on of his new Tournament Of
NACA airfoil geometrical construction
 The NACA airfoil series The early NACA airfoil series, the 4-digit, 5-digit, and modified 4-/5-digit, were generated using analytical equations that describe the camber (curvature) of the mean-line (geometric
Assembly and Operating Manual Nano warbirds FW 190 Specification: *Length: 18 1/2"(470mm) *Wing Span: 21 7/10"(550mm)
 *Wing Span: 21 7/10(550mm)") Assembly and Operating Manual Nano warbirds FW 190 Specification: *Length: 18 1/2"(470mm) *Wing Span: 21 7/10"(550mm) *Flying Weight: 6 1/2 oz (185g) Dear customer, Congratulations on your choice of a
Assembly and Operating Manual Nano warbirds FW 190 Specification: *Length: 18 1/2"(470mm) *Wing Span: 21 7/10"(550mm) *Flying Weight: 6 1/2 oz (185g) Dear customer, Congratulations on your choice of a
Basics of vehicle aerodynamics
 Basics of vehicle aerodynamics Prof. Tamás Lajos Budapest University of Technology and Economics Department of Fluid Mechanics University of Rome La Sapienza 2002 Influence of flow characteristics on the
Toward Zero Sonic-Boom and High Efficiency. Supersonic Bi-Directional Flying Wing
 AIAA Paper 2010-1013 Toward Zero Sonic-Boom and High Efficiency Supersonic Flight: A Novel Concept of Supersonic Bi-Directional Flying Wing Gecheng Zha, Hongsik Im, Daniel Espinal University of Miami Dept.
Programme Discussions Wissenschaftstag Braunschweig 2015 Laminarität für zukünftige Verkehrsflugzeuge
 Programme Discussions Wissenschaftstag Braunschweig 2015 Kevin Nicholls, EIVW Prepared by Heinz Hansen TOP-LDA Leader, ETEA Presented by Bernhard Schlipf, ESCRWG Laminarität für zukünftige Verkehrsflugzeuge
SIMPLIFIED METHOD FOR ESTIMATING THE FLIGHT PERFORMANCE OF A HOBBY ROCKET
 SIMPLIFIED METHOD FOR ESTIMATING THE FLIGHT PERFORMANCE OF A HOBBY ROCKET WWW.NAKKA-ROCKETRY.NET February 007 Rev.1 March 007 1 Introduction As part of the design process for a hobby rocket, it is very
NACA 2415- FINDING LIFT COEFFICIENT USING CFD, THEORETICAL AND JAVAFOIL
 NACA 2415- FINDING LIFT COEFFICIENT USING CFD, THEORETICAL AND JAVAFOIL Sarfaraj Nawaz Shaha 1, M. Sadiq A. Pachapuri 2 1 P.G. Student, MTech Design Engineering, KLE Dr. M S Sheshgiri College of Engineering
CFD ANALYSIS OF RAE 2822 SUPERCRITICAL AIRFOIL AT TRANSONIC MACH SPEEDS
 CFD ANALYSIS OF RAE 2822 SUPERCRITICAL AIRFOIL AT TRANSONIC MACH SPEEDS K.Harish Kumar 1, CH.Kiran Kumar 2, T.Naveen Kumar 3 1 M.Tech Thermal Engineering, Sanketika Institute of Technology & Management,
Introduction to Aircraft Stability and Control Course Notes for M&AE 5070
 Introduction to Aircraft Stability and Control Course Notes for M&AE 57 David A. Caughey Sibley School of Mechanical & Aerospace Engineering Cornell University Ithaca, New York 14853-751 211 2 Contents
Reynolds Averaged Navier-Stokes Analysis for Civil Transport Aircraft using Structured and Unstructured grids
 14 th Annual CFD Symposium 10 th 11 th August 2012, Bangalore Reynolds Averaged Navier-Stokes Analysis for Civil Transport Aircraft using Structured and Unstructured grids Vishal S. Shirbhate CTFD Division,
Florida Institute of Technology Phoenix SAE Aero Design Final Report
 Florida Institute of Technology Phoenix SAE Aero Design Final Report Team Members: Jeff Gibson (L) Dan Denmark Kathleen Murray Steven Tucker Ray Klingerman Jenn Allison Sarah Lagerquist MAE 4292 Submitted
Thin Airfoil Theory. Charles R. O Neill School of Mechanical and Aerospace Engineering Oklahoma State University Stillwater, OK 74078
 13 Thin Airfoil Theory Charles R. O Neill School of Mechanical and Aerospace Engineering Oklahoma State University Stillwater, OK 7478 Project One in MAE 3253 Applied Aerodynamics and Performance March
Certification Specifications for Large Rotorcraft CS-29
 European Aviation Safety Agency Certification Specifications for Large Rotorcraft CS-29 11 December 2012 CS-29 CONTENTS (general layout) CS 29 LARGE ROTORCRAFT BOOK 1 CERTIFICATION SPECIFICATIONS SUBPART
MODULE 11B. PISTON AEROPLANE AERODYNAMICS, STRUCTURES AND SYSTEMS
 MODULE 11B. PISTON AEROPLANE AERODYNAMICS, STRUCTURES AND SYSTEMS Note: The scope of this Module should reflect the technology of aeroplanes pertinent to the A2 and B1.2 subcategory. 11.1 Theory of Flight
Electric Motors and Drives
 EML 2322L MAE Design and Manufacturing Laboratory Electric Motors and Drives To calculate the peak power and torque produced by an electric motor, you will need to know the following: Motor supply voltage,
Production of Wind Tunnel Testing Models with use of Rapid Prototyping Methods
 Production of Wind Tunnel Testing Models with use of Rapid Prototyping Methods R. ADELNIA 1, S. DANESHMAND 2, S. AGHANAJAFI 3 Mechanical Group, Majlesi Azad University Isfahan IRAN Abstract: In a time
How To Build A Roc Plane
 SebArt professional line AngelS EVO 50E ARF ASSEMBLY MANUAL The new AngelS EVO 50E ARF, was designed by the 10 times F3A Italian Champion Sebastiano Silvestri, it is the replica of his 2 meter size F3A
NUMERICAL ANALYSIS OF WELLS TURBINE FOR WAVE POWER CONVERSION
 Engineering Review Vol. 32, Issue 3, 141-146, 2012. 141 NUMERICAL ANALYSIS OF WELLS TURBINE FOR WAVE POWER CONVERSION Z. 1* L. 1 V. 2 M. 1 1 Department of Fluid Mechanics and Computational Engineering,
ENGINE FIRE / SEVERE DAMAGE / SEPARATION ON TAKEOFF
 ENGINE FIRE / SEVERE DAMAGE / SEPARATION ON TAKEOFF According to RYANAIR Procedures PF PM REMARKS Control the aircraft (FULL T/O thrust can be manually selected) Announce «ENGINE FAILURE» or «ENGINE FIRE»
Flight Operations Briefing Notes
 Flight Operations Briefing Note I Introduction Operations in crosswind conditions require strict adherence to applicable crosswind limitations or maximum recommended crosswind values, operational recommendations
General aviation & Business System Level Applications and Requirements Electrical Technologies for the Aviation of the Future Europe-Japan Symposium
 General aviation & Business System Level Applications and Requirements Electrical Technologies for the Aviation of the Future Europe-Japan Symposium 26 March 2015 2015 MITSUBISHI HEAVY INDUSTRIES, LTD.
High Alpha 3D Maneuvers
 High Alpha 3D Maneuvers Harrier Pass Elevator Back Flip Parachute Whip Stalls Rolling Harrier 3D Rolling Turn 3D Knife Edge C-82 Rudder Warmup Note: Every flight mode and maneuver presented in this section
Multi Engine Oral Exam Questions
 Multi Engine Oral Exam Questions 1. What are the requirements for a multi-engine rating? 2. What is the max rated horse power at sea level? At 12,000 msl? 3. What is the rated engine speed? 4. What is
Lab 1a Wind Tunnel Testing Principles & Lift and Drag Coefficients on an Airfoil
 Lab 1a Wind Tunnel Testing Principles & Lift and Drag Coefficients on an Airfoil OBJECTIVES - Calibrate the RPM/wind speed relation of the wind tunnel. - Measure the drag and lift coefficients of an airfoil
Introduction to RC Airplanes. RC Airplane Types - Trainers, Sport RC Planes, 3D Acrobat RC Airplanes, Jets & More
 Introduction to RC Airplanes RC Airplane Types - Trainers, Sport RC Planes, 3D Acrobat RC Airplanes, Jets & More RC Airplane Types RC airplanes come in a few distinct categories. Each category generally
Visualization and Data Mining of Pareto Solutions Using Self-Organizing Map
 Visualization and Data Mining of Solutions Using Self-Organizing Map Shigeru Obayashi and Daisuke Sasaki Institute of Fluid Science, Tohoku University, Sendai, 980-8577 JAPAN obayashi@ieee.org, sasaki@reynolds.ifs.tohoku.ac.jp
Teacher Edition. Written By Tom Dubick. 2011 by Fly To Learn. All rights reserved.
 Teacher Edition Written By Tom Dubick TABLE OF CONTENTS First Flight... 3 May The Force(s) Be With You... 9 Lift A Real Pick Me Up... 17 What a Drag, Man... 23 Thrust It s All About Altitude... 29 Flight
Dipl. Ing. Falk Pätzold Technische Universität Braunschweig, Institut für Flugführung February 21 st 2014
 1/14 Results of Flight Performance Determination of the Lak 17a FES (S5 3117) using the comparison flight method in Aalen Heidenheim Elchingen, August 20th and 21st 2012 Dipl. Ing. Falk Pätzold Technische
CFD simulations of flow over NASA Trap Wing Model
 CFD simulations of flow over NASA Trap Wing Model Andy Luo Swift Engineering Pravin Peddiraju, Vangelis Skaperdas BETA CAE Systems Introduction A cooperative study was undertaken by BETA and Swift Engineering
CE 3500 Fluid Mechanics / Fall 2014 / City College of New York
 1 Drag Coefficient The force ( F ) of the wind blowing against a building is given by F=C D ρu 2 A/2, where U is the wind speed, ρ is density of the air, A the cross-sectional area of the building, and
European Aviation Safety Agency
 European Aviation Safety Agency ED Decision 2003/2/RM Final 17/10/2003 The Executive Director DECISION NO. 2003/2/RM OF THE EXECUTIVE DIRECTOR OF THE AGENCY of 17 October 2003 on certification specifications,
Multi-Engine Training And The PTS
 Multi-Engine Training And The PTS GHAFI John Sollinger/Larry Hendrickson October 28, 2000 Overview FAR differences between original and add-on Multi-Engine PTS Training methods Common training scenarios
Crimp Tooling Where Form Meets Function
 Crimp Tooling Where Form Meets Function Quality, cost, and throughput are key attributes for any production process. The crimp termination process is no exception. Many variables contribute to the results.
Brief introduction----------------------------------------------------------------------------03
 A-1 skyraider Brief introduction----------------------------------------------------------------------------03 Specification----------------------------------------------------------------------------------03