MASTER'S THESIS. Mobile Application Analytics
|
|
|
- Primrose Gibson
- 8 years ago
- Views:
Transcription
1 MASTER'S THESIS 2010:172 CIV Mobile Application Analytics - specification for an online analytics tool David Juhlin Luleå University of Technology MSc Programmes in Engineering Industrial Design Engineering Department of Human Work Sciences Division of Engineering Psychology 2010:172 CIV - ISSN: ISRN: LTU-EX--10/172--SE

2 Mobile Application Analytics -Specification for an online analytics tool- David Juhlin Master of Engineering Physics Human Machine Interaction Luleå University of Technology Department of Human Work Science Division of Engineering Psychology Luleå,

3 Abstract The purpose of the project was to develop a concept description over an analysis tool for mobile devices. This analytics tool is intended to be used by mobile application developers all over the world. The tool will assist them in their work by providing insight regarding the users behaviors along with other interesting information regarding their application(s). This project has foremost strived to find out which information is interesting, but a lot of time has also been spent on creating a user friendly design. The gathering of information began by studying a large amount of already published material which was then supplemented by a questionnaire, interviews, and studies of already existing programs on the market. From this information a concept was developed and later on evaluated through user testing. The user tests resulted in improvements of the original concept. Finally, the project resulted in a concept description of how a mobile analytics tool could work along with suggestions of future studies which could be of interest. i

4 Sammanfattning Projektet syftade till att ta fram en konceptbeskrivning av ett analysverktyg för mobila enheter. Detta analysverktyg är ämnat att användas av applikationstillverkare världen över. Verktyget skall bistå dem i arbetet genom att bidra med förståelse angående användarnas beteende samt annan information som är intressant för utvecklarna av applikationen/applikationerna. Projekt har framför allt strävat efter att fastställa vilken information som är intressant, men stor vikt har även lagts på en användarvänlig design. Informationsinsamlingen startade genom att en stor mängd redan publicerat material studerades för att sedan kompletteras med en enkät, intervjuer samt studier av redan existerande program på marknaden. Utifrån denna information utvecklades ett koncept som sedan utvärderades via användartester. Dessa användartester har resulterat i förbättringar av det ursprungliga konceptet. Arbetet resulterade slutligen i en konceptbeskrivning av hur ett analysverktyg för mobila enheter kan fungera samt förslag på vilka vidarestudier som kan vara intressanta. ii

5 Acknowledgements I would like to thank all the people who participated in the interviews, questionnaire and usability tests. I would also like to give an extra thank you to, Tor Björn Minde who gave me the opportunity to carry out this Master s thesis; Marika Stålnacke and Daniel Nitsche who I have been able to discuss ideas with. Finally, I would like to thank Phillip Tretten who has been my mentor throughout the whole Master s thesis process. iii

6 Table of Contents 1 Introduction Background Current Status Purpose and Objectives Boundaries Theory Questionnaire Interview Usability Testing Number of Participants Card Sorting Paper Prototype Test Cognitive Psychology Color Coding Number of Mental Operations Emotional Design Influence of Choices Successful Web Analytics Approaches System Design Information Searching on a Display Attention Distribution on Web Pages Response Time Consistency Design Layout Methodology Brainstorming and Sorting of Questions Study of Already Existing Programs Interview and Questionnaire Usability Tests Card Sorting Paper Prototype Pre study Study of Already Existing Programs Parameters Logged Other Functions Other Reflections Interviews Structured Interviews Non Structured Interviews Questionnaire Questions Removed Parameter Ranking Card Sorting Grouping of Words Sorting into Categories Requirements Groups of Users Programmers Business People Specifications Concept Overview and Basic Structure... 31

7 6.2 The First Interaction Easy Installation Storage and Data Transfer Informing the User Storage of Information Time of Transfer Data Transfer Triggers Server Demo Version versus Full Version Presentation of Data The Structure of the Tool General Design Specific Examples Report Special Data Collection Evaluation of the Concept Layout Functions Further Development Layout Functions Final concept Overview and Basic Structure The First Interaction Easy Installation Storage and Data Transfer Informing the User Parameters to Log Storage of Information Time of Transfer Data Transfer Triggers Server Demo Version versus Full Version Presentation of Data The structure of the Tool General Design Specific Examples Report Special Data Collection Discussion Flaws in the Project The Tool Recommendations and Future Studies References Appendix Appendix 1: The result of the brainstorming session Appendix 2: Modified survey that was sent out Appendix 3: Instructions for the first card sorting test Appendix 4: The 39 parameters for the first card sorting test Appendix 5. The headings for the second card sorting test and the one parameter added Appendix 6: Instructions for the second card sorting test Appendix 7: The mail sent out for the third card sorting test

8 Appendix 8: Instructions for the paper prototype testing Appendix 9: The tasks for the paper prototype test Appendix 10: Table of the parameters the already existing programs have Appendix 11: Other parameters from the already existing programs Appendix 12: Screen shoots of already existing programs Appendix 13: Results from the different surveys Appendix 14: The result from the first card sorting test Appendix 15: Group names that came up Appendix 16: The result after the second card sorting test Appendix 17: Result after the experts had sorted the last categories Appendix 18: Data transfer scheme Appendix 19: The final concept of the analytics tool

9 Glossary and Abbreviations API Application Programming Interface, interface implemented by a software program which enables it to interact with other software. This is a common abbreviation among computer engineers. Application A program that meets the users computing intention as opposed to system and software tools that meet the computer's internal needs, Nationalencyklopedin 2010 (a Swedish encyclopedia). App(s) See application. CSV Comma separated values, a standard format of data which splits the data with a comma. This format enables transfer between different software programs. DO Developers/ Owners of the application. Fold Nominal scale Ordinal scale SDK TED TSV Xml The fold is the line that separates the visible area without scrolling from the non-visible area. The fold can be both vertical and horizontal. A scale were the object/participant is distinguished by the group or category to which they belong, McQueen & Knussen. (2006) Categories that are in an ordered continuum, but the distance between each option can differ, McQueen & Knussen. (2006). Software development kit, consists of multiple APIs and is a common abbreviation for computer engineers. is a non profitable organization which devotes to ideas worth spreading. Their conferences include top scientists invited to give a speech within the fields of Technology Entertainment and Design, which TED was derived from. Tab Separated values, a standard format of data which split the data with tabs. This format enables transfer between different software programs. Extensible markup language, a standardized format which splits data in to a hierarchic structure. It enables transfer between different software (in comparison to the markup languages CSV and TSV, Xml has a more modern way of doing it).
 See application. CSV Comma separated values, a standard format of data which splits the data with a comma. This format enables transfer between different software programs.")
10 1 Introduction The mobile application market is continuously growing and along with it the competition between the mobile application producing companies. The demand to achieve an advantage against the competitors is striking and has created a market for mobile application analytics. Mobile application analytics is the trade name for tracking systems that collects data regarding the users behaviors in the application. The developers/owners (here on DOs) implement the analytics program code in to their application and when the user (you and me) uses the application, the analytics tool will collect information and send it to the server. The DOs can then logon to the server and track the application usage. The feedback through this analytics tool will improve the likelihood of making the right business decisions (i.e. where to market the product, the price of the product, usability improvements, etc). 1.1 Background Since a lot of coding has to be programmed in order to extract this data and display it properly, small companies cannot afford to spend resources to develop a tool like this just to cover their own demands. In order to make a profit of the work spent on developing the analysis tool it would be necessary to sell the tool to other companies, which would mean they need to sidetrack even more from their original business plan. To solve this problem companies use already existing programs. They integrate the pre made APIs (Application Programming Interface) from the provider of the analysis tool into their application code and then use the provider s web page to analyze the results. For this service a fee is paid allowing it to be more economically efficient to use an existing analysis tool compared to developing one themselves. 1.2 Current Status Among computer programmers it is custom to share some of their code in developing communities. Ericsson Labs is such a community and provides free APIs to developers all over the world. They are now looking at expanding their service and considering offering an analytics SDK (Software development kit, usually consisting of multiple APIs) which developers would be able to download and implement in to their mobile applications. Currently, Apple and Google are the two major corporations running the application market. Since these companies have the main part of the market most applications are developed for ios platform (Apple) and/or Android platform (Google). Therefore, the mobile application analytic SDKs on the market are purposefully adjusted to Apple and Google platforms since they are the main companies sought after. Unfortunately one mobile application analytics provider (Flurry) has ended in a fuss with Apple and the result was that Apple banned all third party software in the distributed applications. Luckily this has only been an oral ban without further action so far. 1.3 Purpose and Objectives The purpose of this project was to create a concept for mobile application analytics. It should include which information developers want to access and how they would like it presented along with two minor areas of interest. The first area of interest concerns the ways of communication between the mobile device and the analytics program, and the second concerns who should have access to the information. 1
 implement the analytics program code in to their application and when the user (you and me) uses the application, the analytics tool will collect information and")
11 The final objective is to present the findings through a concept description and a specification over the analytics tool. The description should clearly present o What information should be logged. o How information should be presented and interacted with. o When and how information should be sent to the analysis program. o Which information should be accessible for everyone. From these findings another master thesis student should be able to program the analysis tool that has been suggested. 1.4 Boundaries The lack of programming knowledge resulted in a limitation of information gathering regarding the competitors software, since their analytics tool was never implemented into any application. Further on, the final concept was never created as a software due to this lack of expertise. 2 Theory This chapter presents the theories used throughout the project and will contribute to a deeper understanding of the following chapters. The theories have mainly been related to one of the following topics; information gathering, interaction design or analytics. 2.1 Questionnaire According to Online Evaluation Resource Library ( ) questionnaires should only be used if the following criteria is met o The members of the population must be able to give you useful information on the issue(s). o You must have a clear idea of what variables you want to gather data about, and you need to be reasonably sure you will get those data by posing standardized questions. o You must believe that the respondents can be relied on to give you the information you need. There are advantages with questionnaires, and according to John Milne (Learning Technology Dissemination Initiative, ) the main ones are o The responses are gathered in a standardized way, so questionnaires are objective. o Generally it is relatively quick to collect information using a questionnaire. o Potentially information can be collected from a large portion of a group. John Milne also discusses the disadvantages of a questionnaire along with possible solutions to solve these problems o Questionnaires are standardized so it is not possible to explain any points in the questions that participants might misinterpret. This could be partially solved by piloting the questions on a small group of students, friends and/or colleagues. o Open-ended questions can generate large amounts of data that can take a long time to process and analyze. One way of limiting this would be to limit the space available to fill out so their responses are concise. o Respondents may answer superficially especially if the questionnaire takes a long time to complete. The common mistake of asking too many questions should be avoided. o Students may not be willing to answer the questions. If possible the questionnaire should be anonymous. 2

12 Trost (2007) discussed similar problems targeted by Milne, but included additional points to reflect over o Open-ended questions should be used with caution not only because it can take a long time to analyze but also since there is the possibility of having to decipher one s hand writing. In order to ease the analysis process he recommends using closed ended questions and include only one open ended question in the end where the participant can add any extra information. o There should only be one question per question. Make sure there is only one thing asked in each question so it is clear which question the respondent is answering. Trost (2007) mentions the importance of providing information regarding confidentiality and anonymity in the cover letter. Trost also states an Internet questionnaire should be shorter than a paper questionnaire. The paper questionnaire allows the respondent to easily see the length of the questionnaire, permitting him/her to put it aside and finish it later. There remains a chance the participant may drop out before he/she is finished with the Internet questionnaire since the uncertainty of the length and how long it will take can become an issue.. Finally, Trost highlights that Internet questionnaires have a lower answering frequency since it is easier to forget an than an envelope lying on your table/desk. s are also sometimes blocked in a firewall so they never even arrive, Trost (2007). 2.2 Interview If the field of interest is very narrow and the number of participants is limited, it is preferred to execute multiple interviews with the same participants, Thomsson (2002). Having repeated interviews will extract more information and provide richer material. Further on when few participants are interviewed it is preferred to perform a reflexive interview so more information can be extracted from each interview. 2.3 Usability Testing These types of tests have been used to ensure good usability within the concept. The theories discussing the topics of number of participants, card sorting and paper prototype test follows below Number of Participants There are different opinions concerning the number of participants needed for usability tests. According to Nielsen & Molich (1990) there is enough to perform heuristic evaluations with three to five participants in an early developmental stage. By using three to five participants Nielsen and Molich (1990) claim that about two thirds of the usability issues will be found, and instead of using more participants the financial recourses should be used to execute other types of usability tests. In March 2000 Nielsen released an article in his alert box, explaining how he derived to the magic number five. He explains that most usability flaws will be found by the first user since the second participant findings will slightly overlap the first ones; the third findings will overlap even more and so on. He also states that 15 participants are needed in order to find all usability problems in a study. In a panel discussion in 2003 (Chi: New horizons) Nielsen emphasizes the fact that he would actually recommend three to four users in the study. He advises, however, planning for five so if there are one or two who do not show up, the result is still valid. Nielsen is supported by Tullis and Albert (2008). Gilbert Cockton (Chi: new horizon 2003) claims that no one can predict in advance how many users are needed. Cockton describes the variables that influence the number of participants and are not accounted for in the calculation of magic number five (test user diversity, test protocol design, task performance diversity, application complexity, design quality, problem reporting procedures and usability goals set for the product). In Cockton s last statement he emphasizes that usability is about risk management, and with more users 3

13 the risks diminish. Whereas, Wonil Hwang and Gavriel Salvendy (2010) studied 27 usability experiments (between 1990 and 2004) and concluded that the number of users should be changed to 10±2 due to the complexity of the system in order to find 80% of the usability issues. Furthermore, Carol Barnum (Chi: new horizon 2003) claims that five participants are enough for web testing, if the original discount model (think aloud, low-fidelity prototypes and heuristic evaluation) for testing is followed. On the other hand, Dennis Wixon (Chi: new horizon 2003) states that when considered from the viewpoint of designing real products in the real world it is the wrong problem to study. He explains that the goal of most iterative tests is to produce the best possible design in the shortest time at the lowest cost with the least risk. The consequence of this is that usability teams are advised to fix usability problems as fast as possible and continue testing until time runs out. Jared Spool (Chi: new horizon 2003) agrees with Dennis Wixon regarding that design teams are limited to time and resources. He also states that regardless of what the number of participants is, it is better than zero Card Sorting Card sorting is a technique for discovering the users mental model of information. By asking them to group the cards together there is a possibility to see which words have a connection (Nielsen 1995). Further on, if the participant is asked to associate a word with the group, there is a possibility to gain insight of how they view the group and from there derive a top category name. The result from the card sorting can thereafter be evaluated and words that have been paired together by many participants should preferably be designed so they belong together. Another way to use card sorting is to use a so-called closed card sorting. In this study the participant sort cards into predefined categories (Tullis Albert 2008). One way to analyze this is to count the percentage of how many times each word was sorted in to each category Paper Prototype Test In order to save time in a design process, paper prototypes can be used advantageously (Matthew Klee). There are multiple reasons why a paper prototype is advantageous; the greatest is the quickness of creating them and the great flexibility (example; if a simple icon is needed it can be created while the test is running). Other advantages are o Users feel more comfortable criticizing a paper prototype than a computer program since the computer program looks so finished. o In a paper prototype the user can click on everything, making it easier to locate clickable items. 2.4 Cognitive Psychology When designing systems humans interact with, the cognitive aspects should be kept in mind. Below follows the theories of interest within this project Color Coding Color coding is a useful and powerful tool in design, but some precaution should be considered according to Wickens and Hollands (1999). The advantages with color coding are o Color stands out from a monochrome background. Therefore, color coded targets are easily and rapidly noticeable. o Certain colors have well established symbolic meaning within a population (green= good and red= bad) and can thereby increase the readability. o Color coding can tie together spatially separated elements. o Color can also contribute with another dimension of redundancy. 4
 claims that five participants are enough for web testing, if the original discount model (think aloud, low-fidelity prototypes and heuristic")
14 Despite all theses advantages, several limitations exists for color coding o Like other sensory continua, color is subject to the limits of absolute judgment. To guarantee that the value and meaning of a color will not be misidentified there should not be more than five to six colors in a display. If the display is perceived under conditions of glare, changing or low illumination, even less colors should be used. o Colors do not naturally define an ordered continuum. The continuum that is most well known is the rainbow, but there are not many people who would know in what order to place blue, yellow and green (the answer is yellow, green and then blue. Remember the Roy G Biv; Red, Orange, Yellow, Green, Blue, Indigo and Violet). A better way to create an ordered continuum is to use saturation or brightness of the color which can be used in combination with colors. o Population stereotypes can produce poor design if the color conflicts with the mental model of that color. For example, green represents a low temperature of a system but at a low temperature the system becomes unstable. This creates a conflict since green is normally good. o Since color is rapidly processed, irrelevant color coding can be distractive. o Approximately 7% of the male population cannot discriminate certain wavelengths of light (red- green blindness) Number of Mental Operations When graphs are displayed the designer should choose the appropriate graph that will minimize the number of operations by the reader, Wickens and Hollands (1999). Further on, the information displayed and the arrangement of the graph should also be considered with the same objectives in mind. 2.5 Emotional Design According to Don Norman (2004) emotions have an important impact on the perception of usability. To demonstrate how emotions affect the human he illustrates the impact with an example (2004, p.11) Imagine a long and narrow plank ten meters long and one meter wide. Place it on the ground. Can you walk on it? Of course. You can jump up and down, dance, and even walk along with your eyes shut. Now prop the plank up so that it is three meters off the ground. Can you walk on it? Yes, although you proceed more carefully. What if the plank were a hundred meters in the air? Most of us wouldn t dare to go near it, even though the act of walking along it and maintaining balance should be no more difficult than when the plank is on the ground. This example shows how emotions can interfere with the perceived difficulty of a task; our fear makes it harder to perform. Further on Norman (2004) describes two Japanese researchers, Masaaki Kurosu and Kaori Kashimura, who concluded that attractive things were easier to use. Noam Tractinskys (see Norman 2004) later supported their conclusion after he redid their conclusion in Israel with the hypothesis that usability and aesthetics were not expected to correlate. Additionally, Norman (2004) concludes; the emotional system change how the cognitive system operates. So if aesthetic would change our emotional state it can in turn change our cognitive system. To illustrate how emotions can change the cognitive system he refers to a study performed by Alice Isen (see Norman 2004). Isen discovered that when people were asked to solve a difficult problem which required out of the box thinking, they performed much better when they felt good. 5

15 The reason being the emotional system can change how the cognitive system operates. So, if aesthetics would change our emotional state it can in turn change our cognitive system. To illustrate this example Norman (2004) refers to a study performed by Alice Isen. Isen discovered that when people were asked to solve a difficult problem which required out of the box thinking, they performed much better when they felt good. Norman (2004) addresses the three levels of the brain that can be designed to improve usability. The first is the visceral level, the automatic, pre wired layer. For this layer the appearance of the design is important. The second level is the behavioral level, which performs everyday behavior. For this layer the product should be pleasurable and effective to use (traditional Human Machine Interaction). The final is the reflective level, which is the contemplative part. For this layer of the brain the design should attract the self- image, personal satisfaction and evoke memories. The Google search logo, as Norman (2004) discusses, presents an interesting example for this thesis. When a search result shows two or more pages, the Google logo appears in the bottom of the page and for each page they have an O, se figure 1. In this way they have transformed boring data into fun data, reinforcing their brand image of being a fun and effective site. This design affects the reflective layer of the brain while continuing to remain useful (the behavioral level). The Google logo itself is aesthetically pleasing, attracting the visceral level of the brain. Figure 1: The Google logo at the bottom of the page becomes extended with multiple Os to match the number of pages. This way of displaying the information is fun, informative and best of all non-intrusive. 2.6 Influence of Choices In a speech given during a TED conference in February 2003 (filmed and posted on YouTube), Barry Schwartz highlights the two main negative effects of too many choices. The first negative effect is all the choices create paralysis instead of liberation. With too many choices the decision becomes too hard to make. The second negative effect Barry Schwartz addresses is satisfaction; there are four reasons why satisfaction goes down with many choices. The first reason is that with fewer options it is easier to be satisfied. With so many choices it can easily be imagined that another option could have been better. The second reason is the values of things depend upon the things we compare them to. With more options it is easier to value the non-selected options higher. Thirdly is the escalation of expectation; with more options to choose from the expectations increase. The fourth and final reason is when you are dissatisfied and only had a few options to choose from, when you ask your self who is responsible for this? the answer is clear; the world is responsible, what could you have done? With many options to choose from and you ask your self who is responsible for this? the answer is equally clear; you are, you could have done better. With all those options you could have picked a better option. All these reasons make people feel worse when they have many options. 2.7 Successful Web Analytics Approaches In a Google speech on August 1 st 2007 (filmed and posted on YouTube), Avinash Kaushik explains the waste of recourses when data is aggregated and stored. When data is stored it becomes a number, which does not provide insight, and no one is interested in anything that does not give insight. Avinash emphasizes that data should drive actions; otherwise it is a 6
 addresses the three levels of the brain that can be designed to improve usability. The first is the visceral level, the automatic, pre wired layer.")
16 waste of time. In order to drive an action the data should be given in a context, preferably distributions, that moves the conversations forward. This is so important that he says do not argue about confidence in data, make a decision. Avinash defines reporting as providing data meanwhile analysis is providing insight to data. Computers automatic logging system provides data, but in order to understand the data an analyst is needed. Avinash claims that 10% of the analytic budget should go to logging data and 90% of the budget should be spent on the persons analyzing data. He says that analytics tools are good at providing data but are bad at analyzing data. An analytics person is needed in order to make sense of the data and thereby drive action. Avinash also claims that averages lie since there is no average person. The way to compare data is to look at distributions. This topic is also something he argues in a speech on September 5 th 2007 (filmed and posted on YouTube). The distribution shows how the key user group is utilizing the web site. In his September speech he also brings up the importance of measuring the outcome. He states that the easiest way to measure is by a survey that asks three questions: 1. Why are you here? (multiple choice) 2. Did you succeed with the task? (yes/ no choice) 3. (Only if they answer no on question 2) why not? (open ended question) If a survey is not used the outcome can be analyzed with a click stream tool. The click stream tool logs data of the user s movements, which can then be analyzed. 2.8 System Design The following sections present different system design theories. These theories are information search on display, attention distribution on web pages, response time, consistency and finally design layout Information Searching on a Display There is no consistent pattern of display scanning (left to right, clockwise etc.). Moreover, the user typically scans the areas most likely to contain the desired information, Wickens and Hollands (1999). On web pages the user will first scan the content and thereafter scan the navigation (Jakob Nielsen 2000). Further on, in 2006 Nielsen posted in his alert box that he had found out that users scan web pages content in the form of an F- shape, see figure 2. The user starts by looking at the top of the content from left to right which creates the top bar. Thereafter they skip down a bit and scan from left to right again, usually they create a little shorter bar this time. Finally, they scan the left side of the content varying in speed. 7

17 Figure 2: Three different pictures of heat maps created by an eye tracking device. The left one is a page of about us section on a corporate site, the middle one is a product page of an ecommerce site and the right one is a search engine result page (picture taken from Jakob Nielsen s alert box) Attention Distribution on Web Pages. The users attention is focused 80% above the page fold (the fold is the line that separates the visible area without scrolling and the non visible area) and 20% below the fold (Nielsen alert box 2010). The study was conducted on a computer screen with a resolution of 1024x768 and the distribution of time above the fold can be seen in figure 3. Figure 3: The distribution of time spent on different heights of the screen (picture taken from Jakob Nielsen s alert box). 8
 and 20% below the fold (Nielsen alert box")
18 In another article (alert box 2010) Nielsen has written about how much time is spent on the left side compared to the right side. In his study he used the same sized monitor as the previous one, 1024x768, and concluded that 69% of the time is spent on the left side of the page and 30% on the right (the remaining 1% is further to the right and requires scrolling, below the fold ). The distribution of the view time can be seen in figure 4. Figure 4: The distribution of time spent depending on the distance from the left of the screen (picture taken from Jakob Nielsen s alert box) Response Time According to Nielsen (2000) response time for a computer program or a web site should preferably be less than 0.1 seconds since it is about the limit for having the user feel that the system reacts instantaneously. If the response time is kept below 1.0 second the users thought and flow will feel like it remains uninterrupted, even though they notice the delay. In order to keep the users attention the response time has to be less than 10.0 seconds. If the response time is slower than 10 seconds the user will start to perform other tasks in between or leave the site Consistency According to Shneiderman and Plaisant (2005), consistency in the system is very vital and requires careful thought. The reason for this is inconsistency in elements, such as the positioning of buttons or colors, will slow down the user 5-10% and inconsistencies in terminology will slowdown the user 20-25% Design Layout Page Design Nielsen (2000) also suggests that two segments should be separated by white space instead of a line. He claims it will appear more attractive most of the time. Further on, Nielsen (2000) emphasizes the importance of a high ratio between content and navigation. There should be at least 50% content but preferably over 80% content. Another guideline that Nielsen (2000) states is the design should only have two fonts (exception if it is computer code text, then a third can be used); producing more fonts will create a ransom-note look. Shneiderman and 9
. 2.8.")
19 Plaisant (2005 p.78) agree with Nielsen in their recommendations use up to three fonts. Shneiderman and Plaisant also say the design should not contain more than four text sizes. According to Nielsen (2000), links should be deactivated when the user is already on the page they lead to, (exception inlinks). The user should not click anything that takes him right back to the same page. Another design element requiring proper usage to minimize confusion is the radio- and checkbox buttons. According to Shneiderman and Plaisant (2005) radio buttons should be used when the user needs to choose one option. When multiple options can be selected at the same time checkboxes should be used. Dates Dates on an international website should always have the month spelled out (Nielsen 2000). If the date is written 5/3, is it the 5 th of March or May 3 rd? To avoid confusion simply use March 5 th or 5 th of March rather than 5/3. Printouts There should be specific layouts for pages that are supposed to be printed. These pages should be designed to fit both A4 and US Letter (Nielsen 2000). If one inch margins are used, the printable area will be 6 ¼ (15.9 cm) wide and 9 (22.9 cm) tall. Search Times and Menu Structure To reduce expected search time for computer menu systems the more frequently used items should be positioned in the top and the less frequently used words should be positioned in the bottom (Lee and MacGregor 1985 see Wickens and Hollands 1999). Lee and MacGregor also recommend that the optimal number of items in a menu is between three and ten. Their last recommendation regarding computer menu design is to avoid many embedded levels of short menus. Another factor that determines the search time is the choice of word assigned to the items (Pirce, Parkinsson and Sission 1992 see Wickens and Hollands 1999). When the target item for a search is highly similar to the correct alternative (target item is ballet and the correct word is dance ) the search time was lower compared to when the words were less similar (more generic, target item ballet and the correct alternative art ). Pirce, Parkinsson and Sission also concluded that when menu alternatives were made more similar (cab, car, chariot etc.) the search was slower compared to less similar alternatives (car, taxi, wagon). Tabs Nielsen (alert box 2007) writes 13 recommendations of the usage of tabs on a web page. 1. Tabs should be used to alternate between views of the same data not as navigation. 2. The information behind the tabs should be logically chunked together. 3. Users should not have to see information from different tabs simultaneously. 4. The tabs should be roughly similar in nature (General- Advanced or Europe- Asia). 5. The selected tab should be highlighted by color (can also preferably be combined with text size, bold label, an icon, or by making it appear in front of the other tabs). 6. The unselected tabs should be clearly visible. 7. The active tab should be connected to the content area. 8. Labels should be short and plain language should be used. 9. There should be consistency in text layout 10. There should only be one row of tabs. 11. The row of tabs should be on top of the panel. 12. The scope controlled by the tabs should be obvious from the visual design. 13. The response time should be below 0.1 second. 10
 radio buttons should be used when the user needs to choose one option. When multiple options can be selected at the same time checkboxes should be used.")
20 3 Methodology In this chapter the methods used throughout the project are presented. These methods include brainstorming, study of already existing programs, interviews, questionnaires and usability tests. 3.1 Brainstorming and Sorting of Questions At the start of the thesis project a single person brainstorming attempted to capture all possible angles of what the mobile application tool concept could contain. The different thoughts were collected in a document containing multiple questions, appendix 1. An internal expert at Ericsson provided his opinion of each question after reviewing them. The questions were thereafter updated and throughout the projects course new questions were added to the document and some were discarded when there was no solution possible. For easier overview the questions were sorted into a number of different topics such as user, application, how to collect the information etc. 3.2 Study of Already Existing Programs In parallel with the brainstorming an analysis of existing programs was made. Ericsson provided some material containing information of existing programs on the market. This information in combination with some internet searches generated the following programs o AppClix (2010), Flurry (2010), Localytics (2010), Motally (2010) and Pinch Media (2010) which are mobile application analytic tools o Admob (2010) which is a mobile advertising network o Google Analytics (2010) which is an analytics tool for internet sites. The author of this paper performed a competitor analysis of these programs. The depth of the analysis of each program depended on how much information was accessible without any programming. 3.3 Interview and Questionnaire Based on the brainstorming and study of already existing programs a questionnaire was constructed in order to collect quantitative data. From the start, the questionnaire consisted of twelve open ended questions; 59 questions were ordered categories, three questions on the nominal scale and four yes/no questions. This questionnaire was filled out and used as a point of discussion when internal experts at Ericsson were interviewed in a group. The five internal experts at Ericsson were all male computer engineers in the age span of years. After the internal experts had been interviewed, the questionnaire was analyzed. The questions with a high score (five or above), a low score (three or lower) or just not suitable questions were removed from the questionnaire or changed to suit better. When the external experts in the area of Luleå, Sweden were interviewed the questionnaire consisted of ten open-ended questions, 24 ordered category questions, three questions on the nominal scale and three multiple choice questions. After they had filled out the questionnaire, it was used as a starting point of the interview. The interviews were semi structured and recorded on a tape recorder (Olympus VN-1100PC Digital voice recorder) to be further analyzed. The external experts consisted of four males and one female, in the age span of years (only three of them filled out the questionnaire). All of them were somehow connected to application or API development and were either programmers or chief executive officers. Four of the experts were located in the area of Luleå and one in Stockholm (phone interview). 11

21 From the information gathered through these interviews the questionnaire was reviewed and modified into eleven open ended questions, 24 ordered category questions, two questions on the nominal scale and three multiple choice questions, appendix 2. The finalized questionnaire was then distributed to application developers all over the world. These developers were recruited through s whose addresses were found in istore or Android market s were sent out and two questionnaires were filled out. In the end of the questionnaire was the possibility to submit their address and thereby be able to be contacted with more questions at a later occasion; both of the ones who participated in the survey submitted their . The external experts who received an had at least developed or participated in the development of a mobile application. Finally, a long list, which contained all average scores for the parameters, was constructed. The parameters that had been given a score (from the internal experts) of five or higher and three or lower were the same as before, meanwhile the scores in between were calculated as an average for each user group (programmers and CEOs). Apart from the structured interviews, non-structured interviews were also held with internal experts at Ericsson. These interviews were held throughout the project and ideas regarding the analytics tool were discussed. The internal experts employed ranged from years of age. 3.4 Usability Tests User tests have been used in this project to improve the usability of the system. The methods used, to ensure good usability, have been card sorting and paper prototype tests Card Sorting When all information was gathered and a first concept had been constructed, card-sorting tasks were executed in order to create a menu structure. Three types of card sorting tasks were performed. Before the card sorting was conducted some parameters were removed due to unimportance in measure, or too hard to measure, or it is obvious where the function should be positioned or the information can be displayed another way. There were also some parameters added for two reasons; user specific information was never considered in the survey and some parameters were found to be important after the survey was completed. The first card sorting test began by reading the instructions to the participants (appendix 3). Thereafter the participant sorted the 39 paper notes (appendix 4) into groups they believed the notes belonged to. At the back of each note was a short explanation, and when they turned a note a small marker was attached as a reminder when the result was analyzed. If they still did not understand the word an explanation was given orally. When they were done with the grouping they had to give each group a name or short description. Finally, the participant had to suggest a different word for the notes with a marker. Between each participant minor changes were performed to the cards which had been marked. Three participants executed the first card sorting test. All of them were computer engineer students from Luleå University of Technology in Sweden who worked at the Luleå Ericsson branch during the summer. They were all males in the age span of years and had studied computer engineering for three or four years. The grouping result of the first card sorting test was analyzed through a matrix system described by Tullis and Albert (2008). For each participant the words that were paired together were given a point and then all points for the participants were summed together, see table 1. The result for the top headings was analyzed in combination with the menu structures the competitors used. 12
22 Table 1. Example of how the first card sorting result was analyzed (all data are made up). Age Sex OS version Platform App version Age Sex OS version Platform - 2 App version - In the second card sorting test the same 39 notes were used (with one extra parameter added), along with six pre made headings, appendix 5. After the instructions, appendix 6, had been read to the participants they were asked to sort the cards into the heading the participant thought they belonged to. In the same way as a marker was attached in the first card sorting test, markers were attached here too. When the participants were done they were asked to look over it again and see if they wanted to make any changes. Finally, they had to explain what they thought each word meant except from the words with a marker, which they had to try to come up with another word that they would have understood. The four participants used for the second card sorting test were computer engineering students from Luleå University of Technology who worked at the Ericsson branch in Luleå during the summer. All were males in the age span of years and had studied three or four years. The result from the card sorting test was analyzed through a matrix system described by Tullis and Albert (2008). Along the top horizontal row the headings were placed and along the left vertical column the parameters were placed, see table 2. If a parameter was placed under the heading the corresponding box was given a point. Finally, these points were converted into percentages. Table 2. Example of how the second card sorting was analyzed (all Data are made up). Parameter User Finance International Events Technical - Technical- Device Application Age 100% Sex 100% OS Version 75% 25% Platform 50% 50% App version 25% 25% 50% The final card sorting task was the same as the second, except for the international heading was removed and only 11 parameters were used. The parameters used in this task were the ones hard to place under a specific heading. The instructions, the parameters and the headings were all sent in one , appendix 7. The was sent out to the external experts who had agreed to participate in follow-up questions (the two who participated in the online survey and three of the ones who participated in the interviews). Out of these five participants, three returned their answer. The result was analyzed in the same way as the second card sorting task, and then combined with the result for the second card sorting task. 13
23 3.4.2 Paper Prototype When the menu structure was complete a paper prototype was constructed from the concept. The paper prototype was improved through an iterative process were two to three users tried the prototype before changes were made. This iterative process was executed four times with internal employees at Ericsson and thereafter one time with external experts. The test started by a brief explanation of the project (if they did not already know it) and how the analytics tool would work. Thereafter the participant was handed a paper with instructions, appendix 8. When the participant was finished reading the instructions, they were given the first question. The test consisted of five tasks, appendix 9, and the tasks were given one at a time in a random order. They were encouraged to think aloud when performing the tasks and at some points prompting was used. In combination with the last paper prototype tests, with external experts, interviews were held to determine how the concept could be improved. The total amount of participants in this study was 13, ten of which were internal employees at Ericsson and three were external experts. The employees at Ericsson were between 22 to 47 years and all but one was male. All of them worked with computer science except for one who worked as an R&D manager and had an engineer background. The external experts were all males, two worked as CEOs and one as a computer engineering teacher. They were in the age span of years. 4 Pre study This chapter presents the result from the pre studies. The results presented include a study of already existing programs, interviews, questionnaire and card sorting. These results laid as a foundation for the requirements and the formation of the concept. 4.1 Study of Already Existing Programs The information gained from the study of existing programs generated data that was sorted into the three categories below (parameters logged, other functions and other reflections) for easier overview Parameters Logged Table 3 presents the number of programs that log a specific parameter displayed (full list in appendix 10). What can be seen is that all programs logged some parameters and some were only logged by one program. When reading the table it is important to know that two of the existing programs were not used for mobile applications (Google analytics for web sites and Admob for mobile web sites). 14
24 Table 3. The number of programs that log each parameter Parameter Unique Users 7 Sessions (visits) 7 Session Lengths 7 Total Session Length/ User 7 Platform 7 OS version 7 Country 7 Device model 6 Device Brand 6 Events 5 Number of Sessions/ User 5 Returning Users 5 New Users 5 App Version 5 Internet/Network Provider 4 Top Screens 2 User Paths 2 Language 2 Application Downloads 2 Gross Income 2 Commission to Seller 2 Cracked 1 Net Income 1 Trial to Paid Upgrade 1 Trial to Paid Upgrade Income 1 Time Before Paid Upgrade 1 Times of Use Before Paid Upgrade 1 Star Rating for Each Version 1 Data Transfer 1 Jail Broken 1 score Other Functions All existing programs included the functions select application/web site menu, my account menu, help and time scale, see table 4, full data in appendix 11. The first encounter with all the programs was through the existing programs websites and the bottom four parameters are in regards to that web page. Noticeably, all existing programs showed pictures on their web page. Roughly half (four) of the existing programs had a demonstration video accessible. There were also four programs that gave access to demonstration accounts; two of them required the user to provide some information in order to access the program, and two allowed instant access without providing any information. 15
25 Table 4. Other functions that existing programs had. The top four parameters concern the programs, meanwhile the bottom four concern the first encounter with the site that provides the program/software. Parameters Score Select Applications Menu 7 My Account Menu 7 Help 7 Time Scale 7 Shows pictures of the product on the web 7 Has a demonstration video clip on the web 4 Has the possibility for demo user (have to create account) 4 Access to demo account without logging in Other Reflections Below follows reflections of each program and only results used later in the project are presented. Further on, only the actual analytics tool web pages have been analyzed in this chapter, i.e. after the DOs have logged in to their analytics tool. Admob The first page (in the analysis tool) gave an overview of all websites the user had, appendix 12 contains one screen shoot of Admob. If one of the links was clicked, the dashboard for that website was accessed. Another interesting find was Admob had split the world map into regions instead of the continents, which zoomed in by clicking. Below the map was a table with the regions and data for them. Menu in Admob was to the left and contained o Dashboard o Visitor o Source o Site usage o Events AppClix One interesting feature AppClix had was percentage next to some data in combination with an arrow that showed if it was an increase or a decrease, see appendix 12 for an example screen shot of AppClix. Another intelligent concept AppClix has included is they let the DOs host the server themselves. By incorporating this they get around Apples policy of no third party is allowed to collect information. The menu in AppClix was in the top and contained o Dashboard o Session details o Events o Sales o Reviews & rating o Ranking o Campaigns Flurry Flurry s dashboard gave a nice and clean, easy to read impression, see appendix 12. Help icons with short descriptions were provided for some of the information pertaining to the 16
26 displayed data. One innovative function Flurry had was event and application movement. Through these functions the program logged how the users navigated through the application. The menu in Flurry was to the left and contained o Dashboard o Users o Audience o Events o Technical Localytics Localytics idea is to let the users create their own charts and tables by choosing parameters in the menu; one screen shot is presented in appendix 12. To improve usability, Localytics has also provided a bar with pre-constructed popular charts. Localytics did not really have a menu (in the same way as the other existing programs) instead they had a list of favorite charts in the top which contained o Users o Hourly o Countries o App version o Hardware o Software o Session length Motally Motally had a very polished look giving the easy to use impression, very similar to Flurry, see appendix 12 for a screen shot. Motally had a simple way of selecting the timeframe for the data displayed. Finally, Motally presented pictures of the top five devices the application had been used on; from these pictures is it possible to see the screen size of the devices. The menu in Motally was to the left and contained o Dashboard o Visitors o Pages o Tracking IDs o Reference o Internal searches Pinch Media Pinch Media had a few unique functions. One of the functions incorporated was when a bar in a graph was marked, a box popped up and displayed specific information regarding the selected bar. Another function unique to Pinch Media was providing information regarding sex and age of the users. They accessed this information through cooperation with Facebook and other outside resources. Finally one feature that Pinch Media had was information regarding specific days of the week, see appendix
27 The menu in Pinch media was to the left and contained o Dashboard o Statistics by date o Statistics by lifecycle o Statistics by region o Statistics by action o Statistics by version o Statistics by OS version o Statistics by device type o Statistics by demographic o Statistics by day of the week o Statistics by the hour of day Google Analytics Most information from Google was given in context; one screen shot of Google analytics is in appendix 12, and clickable in order to see more in depth information. One desirable feature of Google was how the world map was clickable down to city level and displayed the amount of users with different sized circles. When graphs/tables were displayed, Google offered the possibility to display the graph in other views (line, bar, circle etc.). Apart from these layout features, Google offered the possibility to set up goals and then examine how well the goals were met. Google analytics provides the opportunity to send s with the reports attached in the form of PDF, xml (extensible markup language), CSV (comma separated values) and TSV (tab separated values). Another ability of the report module function was the option to schedule reports to be sent at specific times. The menu in Google Analytics was to the left and contained o Dashboard o Visitor o Traffic sources o Content o Goals o Ecommerce 4.2 Interviews The results of the structured and non-structured interviews, with both internal and external experts, are presented below. These results are not presented in any relative order Structured Interviews The most important finding from the structured interviews is presented in this section. o It would be beneficial if data transfer settings could be changed on the applications without having to release a new update. A type of forcing out new settings. o One important aspect to remember is marketing/sales persons are thinking very differently from the developers and therefore want different information. o During the implementation of the analytics API into the application, the feedback must be rapid so the developers see how it works right away. o When an application is being released to the market, information regarding crashes needs to be sent rapidly to the developers so major problems can be solved as quickly as possible. o Sales information can be delayed slightly, but when a campaign is running the feedback needs to be quick so an accurate decision regarding continuing or terminating the campaign can be made. o The geographical precision of information depends on the application. 18
28 o It is important to have information regarding the operative system version and the application version along with possibility for comparison. o It would be relevant to know how much information is delayed. o The demo version has to be easy to implement and try. o The analytics tool should preferably have large flexibility with default settings. o It should be optional to have the more advanced installations. o The time frames should be able to select both the actual time frame and the reference time frame. o It would be good if the analytics tool could log sales data from istore and all Android markets, and then combine them into a sales report, but should remain affordable. o It would be beneficial if two different times could be compared. For example, if two marketing campaigns are made, it would be interesting to compare the two day by day (i.e. the first day of campaign one with the first day of campaign two, second day campaign one with second day campaign two etc.). o It would be interesting to know how many pirated copies there are of the application. o It would be useful to have a flow chart that shows where in the application users get stuck. o It would be highly interesting to know how many applications are downloaded from Android market and how many are downloaded through istore within each category, such as business, games, etc. o It would be advantageous to see an overview of all applications the DOs have. o The size of the analytics API/SDK is probably not a problem even if a log file is implemented Non Structured Interviews From the non-structured interviews the following were interesting points. o The first interaction with the analytics tool will probably be through the Ericsson labs site. o The demo version should have some type of limitations so the DOs will want to use the full version. o It would probably be good if the application version had fake data that displays how it would look when they have implemented all the advanced installations. o If a survey is utilized it should log how many users chose to answer. o When the application is started it would be good if it had a brief data exchange with the analytics tool. This exchange of data could make it possible to send updates and session IDs. o As much data as possible should be sent over Wi-Fi, so the users do not have to pay for the traffic. o There can be a Wi-Fi trigger that activates a small part of the application when the phone has Wi-Fi connection. The activated part of the application can then send the information to the server. o It would also be beneficial if there was a time trigger, so data that has passed maximum storage time can trigger a small part of the application that sends this data when the phone has some kind of internet connection. o If the maximum storage space becomes full, it would be useful if the application would send data. If it is not possible to send data some might need to be discarded. o It would be helpful if the analytics tool can estimate how much data is missing. It has to be an estimate since some data might never be transferred. o It would be advantageous if the developers could be able to upload each screen of their application. The analytics tool should then log what pixels have been clicked and which page has been uploaded. From this data it would be possible to calculate where buttons are on each screen and to what page they link to (the developers can of course correct and rearrange it). 19
29 o When the developers are in the analytics tool it would be good if they are able to navigate through their application and see information for each screen. If they have missed to define a page, one button might link to two pages; if this happens a small box should ask to which page they would like to go and then ask if they would like to correct their error and upload the forgotten page. o The information for each screen could contain information as a heat map. Where the more clicked areas are displayed warmer. o When the movements of the heat map are analyzed, it would be advantageous if the developer/owners of the application could be able to mark areas; the marked areas should then display how many percentages of the clicks are within the area. o It would be beneficial if the users had the possibility to recommend the application to others through SMS/text message, , Facebook or some other web site. When the user recommends the application they should have the possibility to rate the application, which in turn should be logged and stored in the analytics tool. It would further on be advantageous if the developer/owner of the application would be able to decide when this recommendation option should pop up. o When the user recommends the application to others a link to where the application can be downloaded would be good to attach. o There could be a question that pops up the first time the user starts the application that asks if data is allowed to be logged and stored in order to improve the application. o The amount of data able to send over the carrier without the user to become suspicious depends on the plan the user has and how much it costs the user. o The DOs can be allowed to decide when data should be transferred. o When amount of data transferred and what way data was transferred are measured the data should be provided for the actions the user commits, the action the application commits without the user taking any actions and for the action the analysis tool commits without any actions from either of the previous. o If the radio connection is stronger the data transfer will take less battery power, so if the analytics tool can check how strong the connection is before the data is sent it might be possible to spare some battery. o There should probably be some type of limit for how low the battery state of charge can be when the transfer of data starts, since it would be frustrating if the transfer drains all battery and the phone dies. The user would dislike this and the data would have to be retransferred. o It would be good to know how many applications are downloaded in each country and how large percentage the share of the market the application has. o It would be useful if the application could be compared to other developers applications. There can possibly be one standard application based on averages or displayed as distributions. o Data should preferably be able to be exported from the analysis tool. o It would be good if there was a quick button to send and print the graphs/tables. o When the users click send graphs/tables there should be a popup window displayed where they can write the addresses. When they start to type a name or address the system should take information from labs and give suggestions of the address. Alternatively, the system should be integrated with their provider. o If a report tool was constructed it would probably be helpful to be able to create customized reports and the menus and options in table 5 should preferably be included. 20
30 Table 5. A suggestion of the menu system of the report builder tool. File Edit View Export Import Open Undo Zoom in To Word Create chart Open recent Redo Zoom out As PDF Save Cut A4 format As Excel Save as Copy (area) US-letter format As XML Print Paste Combined A4 As CSV &US Letter Send as Delete As TSV Preview 4.3 Questionnaire As mentioned in the method, the questionnaire was created through an iterative process and below is first, the parameters removed from the questionnaire after internal experts at Ericsson had participated. Thereafter the final rankings are presented with all parameters keeping in mind the results are concluded from a small sample size and might deviate from the result of a larger sample size Questions Removed After the internal experts had filled out the survey the following questions were removed due to a high score and thereby considered important o Should it be able to download in PDF format? (6.25) o How many times has the user used the application? (6.2) o How many unique users? (6) o How many have downloaded the application? (5.8) o How many have used it more than once? (5.8) o For how long was the application used? (5.8) o Would the user recommend the application to others? (5.8) o How often are they using the application? (5.6) o How many have started up the application? (5.5) o Should the report be able to print? (5.25) o Did the application fulfill the purpose? (5.2) o In what countries has the application been used? (5.2) o Is it a first time user or an expert user? (5) o What language is the user speaking? (5) o What software do the users have? (5) o What was the application used for? (5) Questions removed due to a low score were: o Are statistics at individual level interesting? (3) o Is the application used during travel? (3) o Is there any inconsistency in patterns? (2.33) o How much traffic is sent between the application and APIs on the phone? (2.25) o Is the phone Jail broken? (2) The reasons for other questions to be removed were o Questions that were changed into another type of question, Where do the users live? The sex of the user? The age of the user? The profession of the user? In what state(s) has the application been used? In what cities has the application been used? If the information was in real time, what would I perceive it as? (5 was max) 21
31 If the information was delayed 1 hour, what would I perceive it as? (5 was max) If the information was delayed 1 day, what would I perceive it as? (5 was max) If the information was delayed 1 week, what would I perceive it as? (5 was max) If the information was delayed 1 month, what would I perceive it as? (5 was max) o Legal issues What movement patterns does the user have in the world? (Also removed since the statistics on individual level were not wanted). o The design should be flexible since it depends greatly on the user. Should the information be presented in tables? Should the information be presented in graphs? Should the information be presented briefly? Should the information be presented in depth? Should the level of the report be on the level of an executive? Should the level of the report be on the level of a project manager? Should the level of the report be on the level of a programmer? Should the level of the report be on the level of a designer? Should the report have a lot of graphs? Should the report have a lot of tables? Should the report have a lot of text? Parameter Ranking A detailed list of the parameters scores from internal and external experts can be seen in Appendix 13. Below follows the priority for the two main user groups of a mobile application analytics tool. Programmers The most important parameters this particular user group is interested in are below. All these parameters received an average score of five or higher (5 average score), and there are no internal rankings in the list: o What language the user is speaking. o If it is a first time user or an expert user. o Number of unique users. o Number of times the user has used the application. o If the user would recommend the application to other people. o Which device the users have. o What software (operative system and version) the users have. o How many have downloaded the application. o How many have used it more than once. o How often the application is used. o What movement patterns the users have in the application. o For how long the application was used. o How long the response time is. o If the application fulfills its purpose. o What the application was used for. o Which version of the application it is. o How many bought the upgrade. o Gross revenue. o Net revenue. o Star rating. o Ranking in store. o Number of reviews. o The report should be able to print. o The report should be able to be downloaded in PDF format. o How many started up the application. o In what countries the application has been used. 22
32 The medially important parameters, as ranked by the programmers, were given an average score between three and five (3 < average score < 5). Below, these parameters are collected in a list with no internal ranking: o What carrier the users have. o How long the users spent on each page/ part of the application. o When the application is used (time of day). o Where the users drop out of the application. o How often a specific API is used. o The amount of traffic sent between server API and the application. o If the application was used over Wi-Fi. o If the application was used over the carrier. o In what context the application was used. o How the usage increased or decreased after the users bought the upgrade. o The average delay until the users bought the upgrade. o The average delay until the users downloaded a new version. The parameters with very low interests among programmers are presented below. They were given an average score of three or lower (average score 3): o To receive statistics on individual level. o To obtain inconsistency in patterns. o If the device is jail broken. o The amount of traffic sent between the application and APIs on the device. o The amount of users who used a pirated copy of the application. o If the application is used during travel. o The commission to sellers. Chief Executive Officers The most important parameters CEOs are interested in can be viewed below. All these parameters received an average score of five or higher (5 average score) and there is no internal ranking in the list: o Which device the users have. o How long the users spent on each page/ part of the application. o What movement patterns the users have in the application. o Where the users drop out of the application. o How long the response time is. o In what context the application was used. o Which version of the application it is. o How the usage increased or decreased after the users bought the upgrade. o Did the user change the way they used the application after purchase. o The average delay until the users bought the upgrade. o The average delay until the users downloaded a new version o Star rating. o Ranking in store. o Number of reviews. The Chief Executive Officers gave the following parameters an average score between three and five (3 < average score < 5): o When the application is used (time of day). o How often a specific API is used. o The amount of traffic sent between server API and the application. o How many bought the upgrade. 23
33 The parameters that received an average score of three or lower (average score 3) and thereby considered to have very low interests among CEOs are the ones below: o What carrier the users have. o If the application was used over Wi-Fi. o If the application was used over the carrier. o The amount of users who used a pirated copy of the application. o Gross revenue. o Net revenue. o The commission to sellers. The open ended questions and multiple choice questions from the questionnaire resulted in the following interesting thoughts. o The DOs only want to log data of the users location, with the precision they know is tolerable by the user. o The survey should be optional, and when they want to use it there should be preset questions. o Information they were willing to share was the usage of APIs and information they did not want to share was the earnings. o What was wanted in an analytics tool was; easy to use, easy to install, better view in mobiles along with information regarding number of installation, crash reports, number of downloads and more information about user and platform, and finally information in real time. 4.4 Card Sorting The parameters removed before the card sorting tests were executed are presented in table 6 and the parameters that were added before the usability test are presented in table 7. Table 6. Parameters removed before the card sorting test and the reason they were removed. Parameter Reason The report should be able to be downloaded in PDF format. Ranking in store. Number of reviews. How the usage increased or decreased after the users bought the upgrade. Did the user change the way they used the application after purchase. The report should be able to print. If the application fulfills its purpose. When the application is used (time of day). In what context the application was used How often a specific API is used. To receive statistics on individual level. If the application is used during travel. Obvious function in a report tool. Most likely impossible to get this information from the stores. Will be seen at the same time as user rating. Can be seen if two versions are compared. Can be seen if two versions are compared. Obvious function in a report tool. Very hard to measure, only with a survey or a click stream tool that guesses if they succeeded. Always going to be a time scale so the information will be there, they just have to filter it. Very hard to measure, would have to be guesses. Indirectly measured through user actions. Most likely illegal and not as wanted. Hard to measure if they are traveling, can log if they are in an offline mode but that does not necessarily mean they are traveling. 24
34 The amount of users who used a pirated copy of the application. To obtain inconsistency in patterns. The amount of traffic sent between the application and APIs on the device. If the device is jail broken. The data was not as wanted and will be very unreliable since when copied the hacker will probably remove the analytics tool from the application. low priority data, probably hard to measure and might be illegal to measure Not as wanted and indirectly measured through user actions. Not as wanted and might be hard to measure. Table 7. The parameters added before the card sorting test along with the reason they were added. Parameter Reason Sex Age App Language Times of Usage Before Paid Upgrade Battery Power Used Processing Power Used Amount of Data Transfer Income From Upgrade Sales Most Viewed Screens Crashes User specific information supposed to be logged only if the DOs prefer. User specific information supposed to be logged only if the DOs prefer. Never made the survey Never made the survey Never made the survey Never made the survey Never made the survey A type of income information. Was not on the survey since the survey needed to be short. Never made the survey Never made the survey Grouping of Words After the first card sorting test was summarized in a matrix, appendix 14, it was reviled that the following words were strongly connected o Age- Sex o Times of Use Before Paid Upgrade- Time Before Paid Upgrade o OS Version- Device Brand- Device Model- Platform o Battery Power Used- Processing Power Used o Method of Data Transfer- Amount of Data Transferred- Total Session Time- Session Length- Time per Screen o User App Movements- Exit Screens o User Action App Response Time o Net Profit- Gross Profit o New Users- Unique Users- User Rating o Number of Upgrades Purchased- Number of App downloaded From the headings they suggested, appendix 15, the following is the summed up result o Usage. o Technical. o User. o Finance. 25
35 When the menu headings were combined with the already existing programs menu structure the following result was found o Dashboard. o User. o Finance. o Technical (with under categories- Device & Application). o Events. o International (added as an extra since many of the competitors had countries as a lower menu and did not have app languages and user language as any parameter they logged) Sorting into Categories The complete result from the sorting of the 40 words into the six headings (User, Finance, Events, International, Technical-Device and Technical-Application) can be seen in appendix 16. These parameters should definitely be under the following headings because they had 100% more percentage points compared to the second sorted heading. o User Sex. Age. o Finance Seller Fees. Net Profit. Gross Profit. o Technical-Device Device Model. Device Brand. Platform. Processing Power Available. o Technical-Application App Version. Amount of Data Transferred. App Response Time. These parameters should most likely be placed under the following headings because they had 50% more percentage points compared to the second heading. o User New Users. Returning Users. Unique Users. Recommendations to Others. User Rating. o Finance Time Before Paid Upgrade. Times of Use Before Paid Upgrade. Income From Upgraded Sales. Number of Upgrades Purchased. o Events User App Movement. Crashes. o Technical-Device OS Version. Network Provider. Method of Data Transfer. 26
36 o Technical-Application Battery Power Used. Processing Power Used. Total Session Time. The parameters below were hard to place under any heading even after the experts had sorted these parameters into the five headings (International removed). The reason they could not be placed was because none of the headings had more than 30% points higher than the one with the second highest percentage. Appendix 17 contains the result from the external experts combined with the computer engineer students result (for the parameters below). o Country of Location. o User Language. o App Language. o Time Until Update is Downloaded. o User Action. o Session Length. o Exit Screens. o Time per Screen. o Number of App Downloaded. o Most Viewed Screens. o Number of Sessions. 5 Requirements This chapter converses the requirements of the analytics tool system. The different user groups are presented in the beginning of the chapter and subsequently the specifications are listed. 5.1 Groups of Users First off, it is important to know that the analysis tool will mainly have two groups of users and in some cases these groups overlap in smaller businesses. The first group consists of the programmers/ developers of the application and the second group contains the business related people Programmers This group of users prefers mixed information with a concentration of information regarding the user and technical data of the application and the device. In section 4.3.2, parameter ranking, it can bee seen that they have valued the financial data high, but this should not be considered (see discussion, 10.1, for explanation) Business People This group of users has mainly money as their main focus of interest and is looking for answers to similar questions as the following: Why is one part of the application used more than another part? How long does it take until the upgrade is bought? Did the use increase or decrease after purchase? These answers should also be connected to the application version and device so they can see if there are any differences. The already existing programs focus on this type of information. 5.2 Specifications The specifications of the system were created outgoing from the results and theory. Below follows a list of the system requirements that have been considered in the creation of the concept design. 27
37 Logging o The DOs should decide if the users should be informed/ asked permission about logging data. o The analytics tool should log everything and store it in a log file. o The size the analytic tool will add to the application should not be seen as a limitation as long as it is kept within reason, preferably less than 20 Megabytes. o If maximum storage space becomes too full, information should be sent to the analytics server. If this is not possible; the first information to be discarded should be the oldest information. o The parameters logged depend upon which user group the analytics tool is built for. The requirements from programmers and CEOs can be seen in chapter parameter ranking. o If financial information is provided, the analytics tool should provide sales information from all application stores/markets. o The system should log how many applications, within each category (game, business etc.), is downloaded for each operative system. This information should be global and accessible for all developers. Information Transfer o When the application is started there should be a brief data exchange between the application and the analytics tool. o As much traffic as possible should be sent over Wi-Fi so it is more cost efficient for the user. o When the users enter an accessible Wi-Fi zone a part of the application should start and transfer stored data. o The DOs should be allowed to decide how long data can be delayed before transfer ( maximum storage time ). o If any stored data exceeds the maximum storage time, a small part of the application should start and, if possible, transfer data regardless of connection. o There should be an estimate of how much information is missing (due to delay). o Sales information can be delayed a bit, but when advertising campaigns are running the information needs to be fast. o If an application is newly released to the market, crash information has to be rapid in order to repair the cause of the crash as soon as possible. o If the battery state of charge is lower than 20%, the application should not transfer any data. The DOs should be able to increase this parameter but never decrease it to become lower than 20%. o The analytics tool has to be able to send out new settings regarding maximum storage time to the applications without the developers having to release a new update. Server Storage o The server should be hosted by Ericsson as long as it is possible. o If the server cannot be hosted by Ericsson it should be possible for the DOs to host the server themselves. The First Encounter with the Analytics Tool o The first encounter with the analytics tool should be through the Ericsson labs site. o The page that the new customers (DOs) encounter first should have pictures of the program, a demonstration video and access to a demo account without logging in. o The demo version has to be easy to implement in the application and easy to use. o When the DOs are using the demo version and are trying it, the data should be sent as soon as possible to the analytics server. o The demo version should have limitations, such as it can only be used on five phones and one application. 28
38 o It should be optional to install the more advanced settings and the DOs should be able to install them whenever they want. o The analytics tool should contain a demo application where the DOs can see what the advanced settings would provide. o The analytics tool should have large flexibility with default settings. Analytics Tool Structure o When the DOs log in they should get an over view of all their applications. o From the first page the DOs should be able to navigate into each of their applications. o Independently of where in the system the DOs are, if a specific data is clicked, the system should provide more information regarding that data (if possible). o If the application name is clicked, the system should display that applications dashboard. o The dashboard should be customizable for each DO. General o Data should be given in a context (percentage, change) that moves the conversation forward. o It should be possible to create goals and use the goals as comparison (give context) in the analytics tool. o There should be a possibility to create customized graphs/tables. o Pictures should be used to enhance the reading speed. o When possible, the distribution should be given instead of averages. o There should be selectable time frames and filter functions. o It should be possible to see different time frames and the comparable data between them. o The data should be able to be displayed for each day of the week so the DOs can see if their application is used more during some week days than the others. They should also be able to see if the application is used more during specific hours of the day. o The preset filter functions should be the application version, the operative system and the operative system version. o The system should have a wide array of help icons for words and phrases. Alternatively, the system should have a hover function that displays a help box when hovering over a word (the help box should, in that case, have a clickable symbol that displays even more information). o There should be different DO profiles in the analytics tool. Different profiles should have different access. o The admin should be able to give out access to others DOs and set what access each profile should have. o If wanted, there should be preset user profiles for the DOs to choose among along with the possibility to create their own. o When possible, the DOs should be able to compare their application to a distribution generated from other applications. o There could be a function which displays popular APIs. o It should be possible to see data regarding crashes. Geographic Displays o The DO should be able to see the geographical data as top countries or geographical zones. o The geographical zones should be; North America, Central America, South America, Europe, Africa, Middle East, Asia and Oceania. If any of them are clicked, a zoomed in map should be shown. All names should be clickable within the map. o The map should be able to zoom down to city level (if data is collected at that level). 29
39 o The DOs should be able to decide to what level data is collected but can also let the users decide. o There should be the possibility to view countries/ geographical zones in a list/table which is underneath the map. o It would be beneficial to know how many applications are downloaded in each country and what market share the DOs applications have. User Movement o The DOs should be able to upload each screen of their application. o The analytics tool should log what pixels lead to which pages/screens. o When the DOs are logged in to the analytics tool they should be able to navigate through their applications as if they were using it. o If they have missed to define a page, they should be informed about it. o The analytics tool should provide marked areas of where the buttons are positioned. o The information for each screen should be able to view as a heat map. Where the more clicked areas are displayed as warmer. o The DOs should be able to mark areas; the marked areas should then display how many percentages of the clicks have been within the marked area. o The distribution of the page fold should be displayed on all screens/pages (both vertical and horizontal fold) Demographic Data o It would be helpful if the system could retrieve data from Facebook and other servers in order to collect demographic data and link it to the application. o It should be possible to send a questionnaire to the users (default should be not to send a questionnaire). The questions should be preset but the DOs should be able to change and create their own questions. o If a questionnaire is sent out, the percentages of answers should be logged. Report o There should be a report tool where the DOs can create their own customized reports. o There should be a possibility to send the reports through and also get a copy sent to their . o The function should preferably be integrated with Ericsson labs or the provider of their choice so the address book will be available. o When they start to type a name or an address, the system should take information from the integrated address book and provide suggestions for the address. o The report should be possible to send in Word, PDF, Excel, xml, CSV and TSV format. o Reports should be able to schedule, so the DOs can get the information sent to their without logging in every time. o Data from the analytics tool should be able to export. o There should be a shortcut (button) to send and print the graphs/tables. o When the DOs click send graphs/tables there should be a popup window displayed where they can write addresses. o The report tool should have a similar menu and options structure as table 8. 30
40 Table 8. A suggestion of a menu system for the report builder tool. File Edit View Export Import Open Undo Zoom in To Word Create chart Open recent Redo Zoom out As PDF Save Cut A4 format As Excel Save as Copy (area) US-letter format As XML Print Preview Send as Paste Delete Combined A4 & US Letter As CSV As TSV Recommendation to Others o The users should have the possibility to recommend the application to others through SMS/text message, , Facebook or some other web site. o The DOs should be able to decide when this recommendation option should pop up. o When the user recommends the application they should have the possibility to rate the application, which in turn should be logged and stored in the analytics tool. o When the user recommends the application to others an attached link should be available where the application can be downloaded. Other o It would be good if the screen size was displayed when the devices are analyzed. o When amount of data transferred and what way data was transferred are provided it should be split into the application and the analytics tool. o It would be good if the analytics tool was usable on mobile devices. 6 Concept The main emphasis of the concept regards the program structure and design layout. Information concerning which parameters should be gathered and presented can be found in sections 5.1 and Overview and Basic Structure The purpose of the analytics tool will be to collect information regarding the application and the usage of it. When the users utilize the application everything will be stored in a memory for a later transfer to the server, see figure 5. The reason to store data is to send as much information as possible when the data traffic is at a low cost or free to the user. The developers will be able to retrieve data and analyze the usage when the information has been transferred to the server. The aim for this feedback information is to provide insight to the application and thereby increase the likelihood for the developers to make better decisions regarding the tool. Finally, the developers will make the updates and improvements to the application. 31
 information regarding the tool, will present a demonstration video, where to access the demo version and a link to a tour (shows pictures")

41 Figure 5: Overview of how the analytics tool functions. 6.2 The First Interaction The DOs first interaction with the analysis tool will be through the Ericsson labs site. The page at Ericsson labs, which provides new customers (DOs) information regarding the tool, will present a demonstration video, where to access the demo version and a link to a tour (shows pictures of the analytics tool), see figure 6. Figure 6: The information page of the analytics tool displayed at Ericsson labs Easy Installation The analytics tool will be easy to implement for the developers since it is only necessary to paste a few rows into their application source code and move a few files into the application folder. All settings have default values; therefore, the DOs will be able to start using the analytics tool right away. If they would like to make more advanced installations they will be able to do those whenever they want. Depending on what information they would like to log 32
42 (bug check, page, event etc) the implementation load for the DOs will vary. Before the start of any advanced settings they will be able to access a short description of how to implement the advanced installation and an estimate of how long the installation will take. If they continue with the advanced installation they will be able to get a detailed specification of how to implement it. 6.3 Storage and Data Transfer The storage and data transfer is one of the key features in order to keep the expenses to a minimum for the end users. The solutions below are attempting to have a minimum userfriendly cost outcome; yet at the same time, developers obtain freedom over the settings. In the beginning some information regarding informing the user is discussed and the end includes a bit about server hosting Informing the User The DOs will have the possibility to log information with or without the users knowledge. If the DOs decide to inform the users regarding the collection of information, they will have the possibility to inform the users in two ways. The first way the DOs will only inform the user by text and in the second the DOs will let the users decide if they want to allow the application to log information. In the case of the latter of the two the question could be phrased as: Is the application allowed to log data which will be used for further improvements? In the same way as informing the user regarding the collection of data, the DOs can inform the users regarding the logging of users position Storage of Information Data will be stored to a log file, of maximum 20 Megabytes, in the application. If the data stored exceeds the maximum storage space, if possible, some data will be sent to the analytics tool server. If it is impossible to send the data, the data with the highest storage time will be discarded first, since that information probably will be valued lowest. When information has been transferred over to the server the information should be stored in the server and discarded from the application Time of Transfer Depending on the importance of data, the DOs decide how long the maximum storage time will be for that type of data, i.e. the maximum length they are willing to wait to receive the data. During this storage time the data will only be transferred if the data transfer is free for the user. If the maximum storage has exceeded, the application will send the information to the analysis tool independently of the data transfer method. If the DOs would like to change the maximum storage time they will be able to do it in the analytics tool, and the next time a user starts the application the new parameters will be downloaded to it. The advantage being they do not have to wait for the next application version in order to change these settings. Due to this time delay there will always be some information that has not been sent to the analytics tool server. There will, therefore, be an estimate of how much information is missing so the DOs know on what basis their decisions are made Data Transfer All data traffic will be sent via Wi-Fi, if possible, so the user does not have to pay for the data transfer; i.e. whenever the user activates the application on an accessible Wi-Fi connection, all data will be sent to the analytics server. No information will be transferred in order to spare the battery for the user, if the battery s state of charge is lower than 20%, and not risk the device to run out of battery. If the DOs want, they can change this number but never set it lower than 20%. 33
43 The first time the application is started (by an end user) some information will be sent right away to the analytics server. There will also be some information sent back to the device. The following times the application is started there will only be a brief data exchange independent of data connection. All data transfers between the analytics tool server and the application can be seen in appendix 18. If the amount and the way data was transferred will be logged it will be logged in regards to the actions of the user, the actions of the application and the actions of the analytics tool. The actions of the user refer to when a user pushes a button to retrieve data (example see a friend s profile on face book). The actions of the application refer to when the application sends data without the users direct actions (for example retrieves new commercial banners). The actions of the analytics tool refer to the actions the analytics tool makes without the user or the application s direct action (for example sends information to the analytics tool server) Triggers If the application has any data stored, a part of it will be active in the background and checking four times a day if the phone has access to Wi-Fi. When access has been found, the data stored will be transferred, and when all data is transferred the application will completely shut down. If a Wi-Fi connection was never found, and the maximum storage time for some data has exceeded, the application will check for any type of internet connection four times a day. The overdue information will be sent when a connection has been found. After delayed information has been sent, the application will check if the storage contains any more information; if so, the application will repeat the process of checking for a Wi-Fi connection four times a day Server For Apple devices the DOs will have to host the server to avoid the banning of third parties. On the Ericsson labs website there will be a link where to download the server software and how to install it. For all other devices Ericsson will host the server. 6.4 Demo Version versus Full Version The analytics tool will have two versions, the demo and full version. The limitation between the demo version and the full version is not in regards to advanced settings, but in the amount of users and number of applications (see below). Unlike the full version, the demo version will not have any delay of data transfer, i.e. the maximum storage time will be set to zero as default. The DOs will be able to see how things work when they implement the analytics tool into their application by having the information sent instantaneously. Table 9 displays all the differences between the demo version and the full version. The demo version will be limited in the number of devices and applications it can handle. It will be constricted to five devices and one application. Ericsson labs will host the server for the demo version. When the DOs, however, decide to upgrade and use the full analytics tool, the servers host will depend on the device the application is constructed for. Ericsson will host the server for applications run on other platforms than Apple. For applications created to run on apple devices the DOs will need to download a software program to host the server. Apple s no third party software will be avoided by building a flexible server. 34
44 Table 9. The differences between the demo version and the full version. Setting/ Limitation Demo Version Full Version Number of applications possible to connect/ labs user (and or Company) Number of application/user IDs Maximum storage time (for data) 1 Unlimited 5 Unlimited No storage, data is transferred instantly so developers can see how the analytics tool works There are pre settings for how long data will be stored in order to spare the end user the cost of data transfer. All settings can be changed by the developer. Server Ericsson Ericsson s server, or for iphone applications the DOs can download a program and host the server themselves. When the DOs decide to switch to the full version, they will be informed that the settings for maximum storage time have been switched in order to lower the cost for the users. The DOs can change the settings for the maximum storage time if desired. The new setting, if changed, will be pushed out to the user the next time he/she starts the application. The analysis tool will keep track of how all applications have their transfer settings; and when an account switches from demo version to the full version it automatically receives the settings that are most common among the applications (type values). If the type value changes later on it will not affect the accounts already using the full version, only the moment an account upgrades to the full version. If a new application is implemented (on a full version account) the settings will be copied from the applications already on the account. The settings will therefore have good pre-settings that most DOs would prefer, thereby minimizing the changes new DOs need to make. To make sure there will not be skewed settings in the beginning, when only a few applications exist, the start value (Ericsson gives) will need to be beaten by 50 before it becomes another type value. For both the demo and full version there will be an application with fake data available. The fake application will display how all advanced settings would look if installed. 6.5 Presentation of Data The data will mainly be displayed on computer screens, but it will also be possible to view the data in mobile devices through an application or web browser adjusted for mobile browsing. The analytics tool is presented for computer screens throughout the rest of this report The Structure of the Tool The first page after login will be an overview of all the DOs applications, see figure 7. Each application will have one row displaying basic data that is interesting to compare between applications. By clicking on any specific data, viewers will come to more information regarding that data. If the name of any application is clicked, the dashboard will be displayed for that application. 35
45 Figure 7: The first page after login 36
46 The dashboard, figure 8, will have a preset look with graphs and tables which each Ericsson labs user will be able to customize. When the user has navigated to an application the navigation menu will be both on the top and the left side to cope with Ericsson labs and the analytics tools competitors. Figure 8: The dashboard. 37
47 6.5.2 General Design All data will be given in context in order to help decision makers decipher and take actions, see section 2.7. The context can be created by providing distributions (preferred alternative) or comparable average values deriving from o Other time scales; the DOs will be able to use data retrieved over different times as reference values. o Average application; the DOs will be able to use data collected from all applications connected to the analytics tool (even other DOs). From this data one average application will be calculated and provide type value, mean, median and distribution from all other applications. Further on, this average application will be able to sort different fields such as games, utilities etc. o Goals; the DOs will be able to set up goals for the application and then follow how well the goals are met. The goals will be defined in many ways including, but not limited to Was a specific screen reached Was a specific link found Maximum amount of crashes for a time period Number of unique users for a time period Small icons (arrow up or down) will be used to increase the reading speed when data is compared. To increase the reading speed even further the data will always be presented in the graph/table that maximizes the reading speed along with the option to change the graph/table into other types. At the top of each page there will be a filter function, see figure 9, along with a selectable time frame. The filter function will, by default, contain application version, device and operative system. The filters will be able to change in the settings, and the time frame will have multiple selectable frames. Figure 9: The filter function and selectable time frame. Except from normal time scales, the data will be able to be displayed with accumulated numbers for days of the week, hours of the day and months of the year (in appendix 12 Pinch Medias days of the week graph is available). Further on, it will be possible to create customized charts that are easy to save and access from the navigation menu. Next to each graph/table there will be an icon that sends the graph/table to the report basket, export the graph/table to other computer programs, send the graph/table through and also makes it possible to print the graph/table. The analytics tool will be able to display data (beyond the parameters presented in section parameter ranking), such as crashes, most popular APIs, a combined sales report for all stores/markets and screen size when devices are analyzed. Each company will have at least one person with administrative access for the analytics tool. The administrator will be able to match profiles to Ericsson labs users and thereby grant them access to the information gathered by the analytics tool. The profile will decide what 38
48 type of information the user can access and which parameters they will be allowed to change in the analytics tool. Since the profile decides what information the user has access to, it will also influence the design and layout options. One final important design element will be small help/information icons for every type of data. These icons will either work as hover functions or as popup windows and will contain detailed information of what the data describes Specific Examples The following are two specific examples (geographical presentation and user movement) of the analytics tool design. Geographical Presentation When geographical data becomes displayed in a map, figure 10, the map will be able to display the data as a geographical zone, such as: Africa, Asia, North America, Central America, South America, Europe, Middle East and Oceania, or as each country by itself. If any of the regions are clicked the map will zoom in and display all countries in the selected region. If a country is clicked the map will zoom in and show states, and if a state is clicked the map will zoom in to city level (the map will zoom in to the lowest level possible). Displayed underneath the map is a table with geographical zones. In the table, the most important information will be displayed for each region/country. The number of unique users, sessions, etc. will be some of the information displayed, but there will also be information regarding their applications market share in each country/region (not displayed in figure 10). The table will work the same way as the map; if a zone is clicked the table will display all countries for that region. The map and the table will also be linked together so if one changes the other one changes simultaneously. Further on, the table will have an option to see the countries in an ordered list. Figure 10: Geographical data 39

49 User Movement One advanced setting the DOs will be able to make is to log user movement in the application. To be able to access this information the DOs will upload each screen of their application to the analytics tool and implement screen ID on each screen. The analytics tool will log every pixel the user is clicking in the application and which screen was uploaded due to the click. When the DOs are logged in to the analytics tool they will then be able to click and navigate through their application as if they were using the application. If the DOs have forgotten to specify one screen of the application they will be able to realize it when they navigate in the analytics tool since they will not be able to reach that screen. For each screen they will be able to see information such as (see figure 11) how the users navigate to the displayed screen, where they went after this screen, within which areas the users have clicked on the screen, how long they spent on each screen, the response time of the screen, etc. Further on, the developers will be able to see the clicks for each screen as a heat map, where the more clicked areas are warmer. The DOs will also be able to mark areas on each screen and see how many clicks (absolute number and percentages) the marked area has had. The fold of the page/screen might be different, if there even is a fold, since different devices have different screen sizes. If any device has a fold there will be a line on the side of the screen where the fold will be positioned, see figure 11. The marks length should represent the distribution of the users fold. Figure 11: Information for each screen. The data to the right of each screen can be changed to better suite the DOs need. In the bottom left side two small markers (red) can be seen. These represent the page fold on some devices. (The application figures are screen shots from the application Iced In) Report All tables, graphs and information in the analysis tool can be exported to a report basket (small icon next to the graph/table) were the DOs can create reports. The reports will be created in a similar tool as Microsoft Word, where the DOs can write text and insert graphs. 40
50 The menu for the report tool will be similar to the menu system in table 10 (there have not been any usability tests to support this structure). Table 10. A suggestion for the structure of the menu system of the report tool. File Edit View Export Import Open Undo Zoom in To Word Create chart Open recent Redo Zoom out As PDF Save Cut A4 format As Excel Save as Copy (area) US-letter format As XML Print Send as Schedule report Preview Paste Delete Combined A4 & US Letter As CSV As TSV When the DOs are done with the report they will be able to save it (as Word, PDF, Excel, XML, CSV and TSV), print it and/or send it through . If they choose to send it through , a popup box will appear, see figure 12. In the popup box there will be a space to enter addresses, subject, message and a checkbox that sends a copy to themselves. There will also be checkboxes to decide which format the report will be sent (the formats available; word, PDF, Excel, xml, CSV and TSV). The function will be integrated with the DOs account (Ericsson labs or some other) so when they start to type a name or address the analytics tool will suggest addresses. Finally, the reports will be able to be scheduled so the DOs get the report they want, when they want it. For example; at the end of the month they will obtain a financial report over all the sales for the past month. Figure 12: The pop up box that appears when send is clicked. 6.6 Special Data Collection The DOs will have the possibility to create a questionnaire (default will be not to send a questionnaire) that the users fill out. The DOs will be able to decide when the questionnaire is sent (at the first start up or at the fifth etc.) and which questions will be asked. There will be some pre-made questions they can use in the questionnaire or create their own questions. 41
51 The purpose of this questionnaire will be to collect data regarding personal user information, such as age, sex, profession etc. If a questionnaire has been sent, the analytics tool will keep track of the percentage that fill out the questionnaire. It would be beneficial if the personal information could be extracted from Facebook, Twitter or similar communities. The DOs acquire the user information and the user never has to fill out a survey by extracting the information from such sites. To be able to provide data regarding the recommendations of the application the analytics tool will provide the possibility to recommend the applications to other people (the DOs will decide when and if the recommendation option will appear). The users will be able to fill out a star rating (which is stored and logged in the analytics tool) and send the recommendation through Facebook, SMS/text message, and/or some web site (possibly Chomp, A link to where the application can be downloaded will be attached whenever recommended. 7 Evaluation of the Concept The evaluation was performed through paper prototype testing. The paper prototype was derived from the concept and the theory chapters presented in to Examples of the paper prototype can be seen in both figures 7 and 8. The first page after logging in to the analytics tool can be seen in figure 7, and the dashboard can be seen in figure 8 (the paper prototype was originally on an A3 format). The majority of the negative aspects are brought up below since the focus of the usability was to find design/ concept flaws that needed improvements. The spontaneous, positive points discussed have also been included. 7.1 Layout The design element that caused the most problems was the set time box, figure 13. Most users realized the blue markers could slide to change the time frame the data was displayed. The problem arose regarding communicating how to add another time frame or another line in the graph. The proposed idea was the user either clicked the or any of the other markers, which would then jump in to the time scale bar. Figure 13: The time interval setting, which caused problems in the paper prototype. The next largest problem was the split navigation system, figure 14. The main problem with this split navigation system was most participants did not see one of the two parts (primarily the top one). Very few had an incorrect mental model of the system. These people believed the top navigation strip was for even higher navigation, such as Ericsson Labs settings, and not for the analytics tool. 42
52 Figure 14: The split navigation system. The top is the highest level of the analytics application navigation and to the left is an expandable lower level navigation menu. Due to the misunderstanding of the navigation structure, some users had a hard time finding the settings. This problem also affected their search of changing settings for the graph even though a graph setting icon, figure 15, had been implemented in the upper left hand corner. The reason this specific icon was overlooked was because it was perceived as too high of a level setting even though it was displayed within close proximity to the graph. The basis for this misperception was the symbol of tools used for the graph settings is typically used for a higher level of system settings. Figure 15: The icon that was meant to take the user to graph settings can be seen in the top left corner (right under user). Further on, the dashboard was perceived to be cluttered, containing too much information (see figure 8). The outcome resulted in participants having a hard time finding crashes on the dashboard, and instead used the navigation menu to find it. 43

53 7.2 Functions The largest problem regarding functions was how to combine graphs so they show related data (example: unique users with new users). The main reason for this problem was no one found the Create Chart in the menu; instead they tried to solve it from the dashboard or other menu alternatives. When attempting to solve it from the other menus there were split perceptions of the system; some believed it worked as an internet page while others believed it would work as a computer system. Due to the split views, some participants tried to click until they found what they wanted as they do on a web page whereas some tried to right click, double click and/or drag and drop. The most irritating issue to users was the pop up box used to send s. The participants preferred to use their own provider and just extract the information from the analytics tool instead of extracting their contact list from their and then send it through the analytics tool. Further on, it was requested to be able to send the graph/table in the body of the and not just as an attachment. One function that received a lot of positive feedback was the User App Movement, see figure 16. The DOs liked the fact they could move around in their application and see how the users have used and clicked around within it. The only thing missing in the user app movement was small close window boxes ( ) for each application screen. Figure 16: In the User App Movement the DOs were able to click around within the application, and then see how the users have clicked and navigated through the application. In the top picture they have clicked on options and then the option screen appeared underneath. (The application figures are screen shots from the application Iced In). The one major function the paper prototype lacked, but is supposed to exist in the analytics tool, is the possibility to set up goals. The lack of this was highlighted by one of the external experts. He thought it would be important for some applications to see how the users navigated to reach the preset goal. 44
54 Additional findings in the prototype testing were many participants forgot to save their new settings before they navigated to another page, and some participants wondered if the advanced installations were for free. 8 Further Development In this chapter the improvements from the first concept are presented. It begins with the layout and proceeds to the functions. 8.1 Layout The set time box has been given another layout for adding new time frames. Now there is a link with the words add another time scale, resulting in a new bar underneath if clicked, see figure 17. The advantage of adding time frames is that it will probably be easier to understand. The disadvantage is that it uses up a lot of space, resulting in more information pushed underneath the page fold. Further design elements implemented include when a marker is clicked and moved, the data (graphs, tables etc.) and filters connecting to that time frame become magnified and highlighted the same color as the markers. Figure 17: The new time setting scale. Since this type of layout is used for the set time box, the filters box has also slightly changed to better fit the new layout. The filters box now contains a link that expands it and creates a selecting feature of which filter to add and then adds it. Figure 18 is an example of how this system looks. Figure 18: The updated filter box. Color coding has been used to improve the understanding of the site navigation, see figure 19. The advantage with this type of color coding is the same navigation structure can be used that has a clear top/lower structure. The navigation will receive more attention resulting in the data receiving less. 45

55 Figure 19: The new navigation system with color coding.. The graph setting icon was misunderstood, therefore a new symbol has been created. The symbol now combines a graph with some symbol for settings, see figure 20 for two suggestions. The new icon will probably not need color coding since the problem was not detection, and unnecessary color will contribute to a cluttered display. Figure 20: Two suggestions for the graph setting icon. In order to make the dashboard less cluttered three changes have been made. The first was to reduce the amount of information by removing finance and loyalty, see figure 21. The removed information depends on the focus group the analytics tool is built for; here it is built for developers and the business related information is removed. The second was to remove icons that were redundant (the same icons exist in the heading bar) so the information would appear clearer, this change has been made for all graphs in the analytics tool. The third and final was to increase the size of information and thereby expand the page length. The advantage with increased size is that less information fits on the page and all seen information feels less cluttered. The drawback is with a longer page more information ends up underneath the fold where less attention is received. 46
56 Figure 21: Suggestion of how a less cluttered dashboard might look. 47

57 8.2 Functions The system will be built to work both as a web page and a computer program as long as possible since it would enable DOs to right click, double click, drag and drop. The advantage of making an internet site work as a computer program is more DOs will succeed in their tasks, and the downloaded version and online version will cope better. The disadvantage is there are higher expectations on a computer program, which most likely will be transferred over to the online version. These expectations will increase the demand for fast response times and stable servers. Further on, the analytics tool will allow the DOs to use their own function instead of forcing them to use the one the analytics tool provides. The DOs will have an easier time navigating and finding information such as sent s, replies etc. Another important aspect is the DOs will be able to get the graph/table in the body of the instead of just attaching it, so the receiver does not have to download anything in order to see the information. In the user app movement an will be included in all but the top screen, see figure 22. The reason the top screen will not have one is the need of a starting point to be able to navigate through it. By including an box the DOs will be able to eliminate unimportant screens if the list becomes rather long. The icons for sending the information to the report basket or to export it have also been removed, and the headings have been increased in size to cope with the dashboard. Figure 22: User app movement with an box in the lower level screens. (The application figures are screen shots from the application Iced In). Previously, a lot of participants failed to save their new settings; therefore, the system will now forgive mistakes and help the DOs to correct the mistakes. A pop up window will now 48
58 appear if the DOs have not saved before navigating away from the screen. The text on the pop up window will read you have not saved your new settings, would you like to save them before you navigate away from this page? and the choices will be yes, save it, no, discard the changes and cancel. This pop up box will also have a check box which enables them to never receive the warning again. When the DOs navigate to a page that requires advanced settings, which they do not have installed, a pop up box will be displayed informing the user that the setting is not installed. The DOs will be offered to see demo data for free, install it for free or cancel. 9 Final concept Here follows the final concept which also is available in appendix 19, where it easily can be removed and used as a separate document. The main emphasis of the concept regards the program structure and design layout. There is also some information concerning which parameters should be logged. Further on, the concept below has mainly been constructed for programmers/developers and their needs. 9.1 Overview and Basic Structure The purpose of the analytics tool will be to collect information regarding the application and the usage of it. When the users utilize the application everything will be stored in a memory for a later transfer to the server, see figure 23. The reason to store data is to send as much information as possible when the data traffic is at a low cost or free to the user. The developers will be able to retrieve data and analyze the usage when the information has been transferred to the server. The aim for this feedback information is to provide insight to the application and thereby increase the likelihood for the developers to make better decisions regarding the tool. Finally, the developers will make the updates and improvements to the application. Figure 23: Overview of how the analytics tool functions. 9.2 The First Interaction The developers first interaction with the analysis tool will be through the Ericsson labs site. The page at Ericsson labs, which provides new customers (developers) information regarding the tool, will present a demonstration video, where to access the demo version and a link to a tour (shows pictures of the analytics tool), see figure
59 Figure 24: The information page of the analytics tool displayed at Ericsson labs Easy Installation The analytics tool will be easy to implement for the developers since it is only necessary to paste a few rows into their application source code and move a few files into the application folder. All settings have default values; therefore, the developers will be able to start using the analytics tool right away. If they would like to make more advanced installations they will be able to do those whenever they want. Depending on what information they would like to log (bug check, page, event etc) the implementation load for the developers will vary. Before the start of any advanced settings they will be able to access a short description of how to implement the advanced installation and an estimate of how long the installation will take. If they continue with the advanced installation they will be able to get a detailed specification of how to implement it. 9.3 Storage and Data Transfer The following section handles the storage and data transfer of the information. It is constructed to decrease the users costs at the same time as it is supposed to give the developers large flexibility Informing the User The developers will have the possibility to log information with or without the users knowledge. If the developers decide to inform the users regarding the collection of information, they will have the possibility to inform the users in two ways. The first way the developers will only inform the user by text and in the second the developers will let the users decide if they want to allow the application to log information. In the case of the latter of the two the question could be phrased as: Is the application allowed to log data which will be used for further improvements? In the same way as informing the user regarding the collection of data, the developers can inform the users regarding the logging of users position. 50
60 9.3.2 Parameters to Log Programmers are mainly interested in information regarding technical data of the application, and the device the application is used on. In table 11 the parameters have been grouped into four categories (high medium, low and unknown) depending on how high the demand is; there is no ranking within the groups. Table 11. The priority of the parameters deriving from the programmers demands. High Demand Medium demand Low demand Unknown o What language the o What carrier the o To receive statistics o Times of use before user is speaking. users have. on individual level. paid upgrade o If it is a first time o When the o If the device is jail o Processing power user or expert user. application is used broken. used o Number of unique users. o Which device the users have. o Number of times the user has used the application. o If the user would recommend the application to other people. o What software (operative system and version) the users have. o For how long the application was used. o How many downloaded the application. o How often the application is used. o How many used it more than once. o What movement patterns the users have in the application. o How long the response time is. o If the application fulfills its purpose. (time of day). o Where the users drop out of the application. o How often a specific API is used. o The average delay until the users bought the upgrade. o The amount of traffic sent between server API and the application. o The average delay until the users downloaded a new version. o If the application was used over the carrier. o How long the users spent on each page/ part of the application. o In what context the application was used. o If the application was used over Wi- Fi. o How the usage increased or decreased after the users bought the upgrade. o The commission to sellers. o If the application is used during travel. o To obtain inconsistency in patterns. o The amount of traffic sent between the application and APIs on the device. o The amount of users who used a pirated copy of the application. o Amount of data transferred o Trial to paid upgrade income o Application language o Battery power used o Most viewed screens o Crashes 51
61 o What the application was used for. o Which version of the application it is. o How many bought the upgrade. o Gross revenue. o Net revenue. o Star rating. o Ranking in store. o Number of reviews. o The report should be able to print. o The report should be able to be downloaded in PDF format. o How many started up the application. o In what countries the application has been used Storage of Information Data will be stored to a log file, of maximum 20 Mbytes, in the application. If the data stored exceeds the maximum storage space, if possible, some data will be sent to the analytics tool server. If it is impossible to send the data, the data with the highest storage time will be discarded first, since that information probably will be valued lowest. When information has been transferred over to the server the information should be stored in the server and discarded from the application Time of Transfer Depending on the importance of data, the developers decide how long the maximum storage time will be for that type of data, i.e. the maximum length they are willing to wait to receive the data. During this storage time the data will only be transferred if the data transfer is free for the user. If the maximum storage has exceeded, the application will send the information to the analysis tool independently of the data transfer method. If the developers would like to change the maximum storage time they will be able to do it in the analytics tool and the next time a user starts the application the new parameters will be downloaded to it. The advantage being they do not have to wait for the next application version in order to change these settings. Due to this time delay there will always be some information that has not been sent to the analytics tool server. There will therefore be an estimate of how much information is missing so the developers know on what basis their decisions are made Data Transfer All data traffic will be sent via Wi-Fi, if possible, so the user does not have to pay for the data transfer; i.e. whenever the user activates the application on an accessible Wi-Fi connection, all data will be sent to the analytics server. No information will be transferred in order to spare the battery for the user, if the battery s state of charge is lower than 20%, and not risk 52
62 the device to run out of battery. If the developers want, they can change this number but never set it lower than 20%. The first time the application is started (by an end user) some information will be sent right away to the analytics server. There will also be some information sent back to the device. The following times the application is started there will only be a brief data exchange independent of data connection. All data transfers between the analytics tool server and the application can be seen in table 12. Table 12. Data transfer scheme. Event Information only sent at the first startup of the application. Information only sent back after the first startup of the application. Information always sent to the analytics server after the startup of the application. Information always sent back to the application after start up. Information always sent to the server when the application closes. Information sent or stored in the application when the application is closed (depends on the maximum storage time). Data sent Language setting in the device Carrier Operative system and version Device model and technical data (processor power etc) Application ID (number to track application version etc.) Time zone User ID Start time GPS coordinate (depending on analytics tool setting) Time stamp Session ID Parameter settings User ID Stop time Session ID Crashes How data was transferred Amount of data transferred Recommendations of the application Movement patterns Etc. (see table 1 for interesting parameters) If the amount and the way data was transferred will be logged, it will be in regards to the actions of the user, the actions of the application and the actions of the analytics tool. The actions of the user refer to when a user pushes a button to retrieve data (example see a friend s profile on face book). The actions of the application refer to when the application sends data without the users direct actions (for example retrieves new commercial banners). The actions of the analytics tool refer to the actions the analytics tool makes without the user or the application s direct action (for example sends information to the analytics tool server) Triggers If the application has any data stored, a part of it will be active in the background and checking four times a day if the phone has access to Wi-Fi. When access has been found, the data stored will be transferred, and when all data is transferred the application will completely shut down. If a Wi-Fi connection was never found, and the maximum storage time for some data has exceeded, the application will check for any type of internet connection four times a day. The 53
63 overdue information will be sent when a connection has been found. After delayed information has been sent, the application will check if the storage contains any more information, if so the application will repeat the process of checking for a Wi-Fi connection four times a day Server For Apple devices the developers will have to host the server to avoid the banning of third parties. On the Ericsson labs website there will be a link where to download the server software and how to install it. For all other devices Ericsson will host the server. 9.4 Demo Version versus Full Version The analytics tool will have two versions; demo and full version. The limitation between the demo version and the full version is not in regards to advanced settings, but in the amount of users and number of applications (see below). Unlike the full version, the demo version will not have any delay of data transfer, i.e. the maximum storage time will be set to zero as default. The developers will be able to see how things work when they implement the analytics tool into their application by having the information sent instantaneously. Table 13 displays all the differences between the demo version and the full version. The demo version will be limited in the number of devices and applications it can handle. It will be constricted to five devices and one application. Ericsson labs will host the server for the demo version, but when the developers decide to upgrade and use the full analytics tool the servers host will depend on the device the application is constructed for. For applications created to run on apple devices the developers will need to download a software program to host the server. For applications run on other platforms Ericsson will host the server. Apples no third party software will be avoided by building a flexible server. Table 13. The differences between the demo version and the full version. Setting/ Limitation Demo Version Full Version Number of applications possible to connect/ labs user (and or Company) Number of application/user IDs Maximum storage time (for data) 1 Unlimited 5 Unlimited No storage, data is transferred instantly so developers can see how the analytics tool works There are pre settings for how long data will be stored in order to spare the end user the cost of data transfer. All settings can be changed by the developer. Server Ericsson Ericsson s server, or for iphone applications the DOs can download a program and host the server themselves. 54
64 When the developers decide to switch to the full version, they will be informed that the settings for maximum storage time have been switched in order to lower the cost for the users. The developers can change the settings for the maximum storage time if desired. The new setting, if changed, will be pushed out to the user the next time he/she starts the application. The analysis tool will keep track of how all applications have their transfer settings; and when an account switches from demo version to the full version it automatically receives the settings that are most common among the applications (type values). If the type value changes later on it will not affect the accounts already using the full version, only the moment an account upgrades to the full version. If a new application is implemented (on a full version account) the settings will be copied from the applications already on the account. The settings will therefore have good pre-settings that most developers would prefer, thereby minimizing the changes new developers need to make. To make sure there will not be skewed settings in the beginning when only a few applications exist, the start value (Ericsson gives) will need to be beaten by 50 before it becomes another type value. For both the demo and full version there will be an application with fake data available. The fake application will display how all advanced settings would look if installed. 9.5 Presentation of Data The data will mainly be displayed on computer screens but it will also be possible to view the data in mobile devices through an application or web browser adjusted for mobile browsing. The analytics tool is presented for computer screens here on The structure of the Tool The first page after login will be an overview of all the developers applications, see figure 25. Each application will have one row displaying basic data that is interesting to compare between applications. By clicking on any specific data, viewers will come to more information regarding that data. If the name of any application is clicked, the dashboard will be displayed for that application. Figure 25: The first page after login 55
65 The dashboard, figure 26, will have a preset design with graphs and tables that each Ericsson labs user will be able to customize. When the programmers have navigated into an application, the navigation menu will be color coded and split between the top and the left side in order to cope with both Ericsson labs and the analytic tools competitors. Figure 26: The dashboard. 56
66 9.5.2 General Design All data will be given in context in order to help decision makers decipher and take actions. The context can be created by providing distributions (preferred alternative) or comparable average values deriving from o Other time scales; the developers will be able to use data retrieved over different times as reference values. o Average application; the developers will be able to use data collected from all applications connected to the analytics tool (even other developers). From this data one average application will be calculated and provide type value, mean, median and distribution from all other applications. Further on, this average application will be able to sort different fields such as games, utilities etc. o Goals; the developers will be able to set up goals for the application and then follow how well the goals are met. The goals will be defined in many ways including, but not limited to Was a specific screen reached Was a specific link found Maximum amount of crashes for a time period Number of unique users for a time period To increase the reading speed the data will always be presented in the graph/table that maximizes the processing speed, along with the option to change the graph/table into other types. Small icons (arrow up or down) will be used to increase the reading speed even further when data is compared. Other icons used will be small help/information icons for every data. These icons will either work as hover functions or as popup windows and will contain detailed information of what the data describes. At the top of each page will be a filter function, see figure 27, along with a selectable time frame. The filter function will, by default, contain application version, device and operative system. The filters will be able to change in the settings, and the time frame will have multiple selectable frames. Figure 27: The filter function and selectable time frame. The analytics tool will be able to display data (beyond the parameters presented in table 11), such as crashes, most popular APIs and screen size when devices are analyzed. Apart form these extra parameters the analytics tool will also be able to display accumulated numbers for days of the week, hours of the day and months of the year. Further on, it will be possible to create customized charts that are easy to save and access from the navigation menu. Each company will have at least one person with administrative access for the analytics tool. The administrator will be able to match profiles to Ericsson labs users and thereby grant them access to the information gathered by the analytics tool. The profile will decide what type of information the user can access and which parameters they will be allowed to change 57
67 in the analytics tool. Since the profile decides what information the user has access to, it will also influence the design and layout options. The developers s will be integrated with the analytics tool, so when they click send their own provider will appear. Another important function is the graphs/tables should be able to be sent in the body of the . The analytics tool will forgive mistakes such as forgetting to save. A pop up window will now appear if the developers have not saved before navigating away from the screen. The text on the pop up window will read you have not saved your new settings, would you like to save them before you navigate away from this page? and the choices will be yes, save it, no, discard the changes and cancel. This pop up box will also have a check box enabling them to never receive the warning again. When the developers navigate to a page that requires advanced settings, which they do not have installed, a pop up box will be displayed informing the user that the setting is not installed. The developers will be offered to see demo data for free, install it for free or cancel. Finally the system will be built to work both as a web page and a computer program as long as possible since it would enable developers to right click, double click, drag and drop Specific Examples The following are two specific examples (geographical presentation and user movement) of the analytics tool design. Geographical presentation When geographical data becomes displayed in a map, figure 27, the map will be able to display the data as a geographical zone, such as: Africa, Asia, North America, Central America, South America, Europe, Middle East and Oceania, or as each country by itself. If any of the regions are clicked the map will zoom in and display all countries in the selected region. If a country is clicked the map will zoom in and show states, and if a state is clicked the map will zoom in to city level (the map will zoom in to the lowest level possible). Displayed underneath the map is a table with geographical zones. In the table, the most important information will be displayed for each region/country. The number of unique users, sessions etc. will be some of the information displayed, but there will also be information regarding their applications market share in each country/region (not displayed in figure 27). The table will work the same way as the map; if a zone is clicked the table will display all countries for that region. The map and the table will also be linked together so if one changes the other one changes simultaneously. Further on, the table will have an option to see the countries in an ordered list. 58
68 Figure 27: Geographical data User movement One advanced setting the developers will be able to make is to log user movement in the application. To be able to access this information the developers will upload each screen of their application to the analytics tool and implement screen ID on each screen. The analytics tool will log every pixel the user is clicking in the application and which screen was uploaded due to the click. When the developers are logged in to the analytics tool they will then be able to click and navigate through their application as if they were using the application. If the developers have forgotten to specify one screen of the application they will be able to realize it when they navigate in the analytics tool since they will not be able to reach that screen. For each screen they will be able to see information such as (see figure 28) how the users navigate to the displayed screen, where they went after this screen, within which areas the users have clicked on the screen, how long they spent on each screen, the response time of the screen, etc. Further on, the developers will be able to see the clicks for each screen as a heat map, where the more clicked areas are warmer. The developers will also be able to mark areas on each screen and see how many clicks (absolute number and percentages) the marked area has had. The fold of the page/screen might be different, if there even is a fold, since different devices have different screen sizes. If any device has a fold there will be a line on the side of the screen where the fold will be positioned, see figure 28. The marks length should represent the distribution of the users fold. 59
69 Figure 28: Information for each screen. The data to the right of each screen can be changed to better suite the DOs need. In the bottom left side two small markers (yellow and red) can be seen. These represent the page fold on some devices. (The application figures are screen shots from the application Iced In) Report All tables, graphs and information in the analysis tool can be exported to a report basket (small icon in the heading of the graph/table) were the developers can create reports. The reports will be created in a similar tool as Microsoft Word, where the DOs can write text and insert graphs. The menu for the report tool will be similar to the menu system in table 4 (there have not been any usability tests to support this structure). Table 4. A suggestion for the structure of the menu system of the report tool. File Edit View Export Import Open Undo Zoom in To Word Create chart Open recent Redo Zoom out As PDF Save Cut A4 format As Excel Save as Copy (area) US-letter format As XML Print Send as Schedule report Preview Paste Delete Combined A4 & US Letter As CSV As TSV 60
70 When the developers are done with the report they will be able to save it (as Word, PDF, Excel, XML, CSV and TSV), print it and/or send it through . Finally, the reports will be able to be scheduled so the developers get the report they want, when they want it. For example, once a month they will obtain a user report regarding unique users, new users, etc. over the past month. 9.6 Special Data Collection The developers will have the possibility to create a questionnaire (default will be not to send a questionnaire) that the users fill out. The developers will be able to decide when the questionnaire is sent (at the first start up or at the fifth etc.) and which questions will be asked. There will be some premade questions they can use in the questionnaire or create their own questions. The purpose of this questionnaire will be to collect data regarding personal user information such as age, sex, profession etc. If a questionnaire has been sent, the analytics tool will keep track of the percentage that fill out the questionnaire. It would be beneficial if the personal information could be extracted from Facebook, Twitter or similar communities. The developers acquire the user information and the user never has to fill out a survey by extracting the information from such sites. To be able to generate data regarding the recommendations, the analytics tool will provide the possibility to recommend the applications to other people (the developers will decide when and if the recommendation option will appear). The users will be able to fill out a star rating (which is stored and logged in the analytics tool) and send the recommendation through Facebook, SMS/text message, and/or some web site (possibly Chomp, A link to where the application can be downloaded will be attached whenever recommended. 10 Discussion In this chapter the project is discussed. First, the flaws in the project are conversed, followed by some parts of the tool Flaws in the Project The participating rate among the external experts who were recruited through was significantly low. The participation rate was expected to be low beforehand, since internet surveys have a lower response rate, but it was not expected to be so low. The main reason the participation rate was so low was the topic of the first recruiting was poorly titled. The heading Project- application analytics tool might have been perceived as a commercial and thereby ignored by multiple experts. The only received eight people willing to participate. Out of these eight participants who had been willing to participate there were only three who filled out the survey. The survey answers, however, had to be discarded because of an error in the construction of the survey. Another was then sent to these eight participants telling the survey was fixed, but only two filled out the updated survey. Both participants in the second survey also filled out the first survey, which was discarded (it is known because they submitted their both times). Only one participant, therefore, was lost because of this mistake. Since only two out of 142 participated in the survey, there was basically no validity in the survey. Further on, there were only ten experts in total (internal and external) who filled out the survey, in turn hurting the information gathered. For some of the existing programs there were only screen dumps and tutorial videos accessible for the existing programs analyzed. The most accessed information regarding existing programs was through demo versions; because of the lack of programming knowledge it was not possible to implement any of these into a real application. On account of these limitations the analysis of the competitors is not completely reliable. 61
71 The five tasks order was randomly selected when the paper prototype was tested. A Latin square was not used to decide the tasks order since no success rate was measured and notes were only taken of parts needing improvements. This lack of a Latin square might have resulted in some learning between the tasks, but nothing of significance. One other implication in the paper prototype was the participants did not click as much as they normally would do since it took some time to switch sheets. The result of this restraint of clicking has probably affected the large need of improvements on the multiple time frames. If the users had clicked more they might have figured out how it worked. Further on, the tasks were relatively hard to perform and most would not likely be anything the users would do during their first interaction with the program; on top of this some participants were stressed out from the testing situation. This particular study had a large limitation of participants, and it would have been beneficial if there were more external experts to access. It may have been helpful if some sort of reward had been given to the ones participating. A reward could have been free access to something Ericsson provides, which was not possible since Ericsson did not want to be associated with the recruiting s which were sent out. The participants partaking in this study matched the future users decently, but it would have been good if more participants with business backgrounds had participated. In the ranking of parameters the programmers had more since the CEOs filled out shorter versions of the questionnaire. The reason the questionnaire was shorter was to decrease the time it took to fill out the questionnaire and thereby increase the likelihood of participation. Noticeably, the programmers ranked the finance information higher than the CEOs. The main reason for this higher ranking was the CEOs knew they could get this information from other sources meanwhile the programmers were unaware. Further on, it may be important to know that all the CEOs who filled out the questionnaire had a programming background and thereby had deep insight of the programming questions The Tool The International category was removed since it mainly brought confusion instead of insight. Another heading that did not work as well was the heading Events. Even though it did not work as intended, it is a well established heading in the already existing analytics tool and can thereby benefit from other experiences users have had. In the paper prototype the dashboard was perceived as cluttered and the reason may be because the paper prototype was smaller then the actual size on the screen. Further on, as mentioned before, the multiple selected time frames were in need of improvements. When this widget was constructed a chance was taken since it was a completely new type of function. Unfortunately, this function backfired and a more established advanced link was implemented. If the application tool is built for programmers to support their work, the multiple time frames might not be necessary since they were mainly constructed so different marketing campaigns could be compared in a good way. The adding of multiple time frames was one of the hardest tasks for the users to perform so this would simplify the time setting function a lot. Avinash Kaushik has a very vital point when he says 90% of the budget should be spent on the people who analyze the data, and 10% on gathering data. To capture this argument and implement it into the analytics tool it would be good if the analytics tool had information/tutorials/hints of how the data could be used for maximum insight. The information could be in a help section with the tutorials as YouTube videos and the hints as a small symbol next to each heading. 62
72 The analytics tool will most likely be accessed through Ericsson Labs; it is preferable to use the same colors as the Ericsson labs page allowing the user to know they are still at Ericsson labs. The down side to this connection is the gray, dull color on the Ericsson labs site. The colors create a boring emotional state which in turn can influence the perceived usability of the analytics tool. During the discussion with Ericsson internal experts a thought was mentioned regarding providing the analytics tool to the Labs users for free. This suggestion implied the users would have to create an Ericsson Labs user account before they had access to the demo version of the tool. This approach might lose some potential customers since they are not committed enough to the tool when the personal information is required to submit. One suggestion is when they start with the demo version they only need to decide a username, password and address and when they switch over from the demo version to the full version all extra information is filled out. Further on, it should also clearly state what Ericsson would use their address for. A thought regarding the database of the analytics tool is to try to share some information with other competitors/ existing programs. Even if some competitors do not want to share information, Ericsson would still benefit from it since it would help to gain market shares. The competitors standing on the side of this sharing will lose customers since they will not provide the best insight to the DOs application(s). Further on, many competitors would probably feel obligated to join such a sharing of information if a well-established company such as Ericsson is behind it. 11 Recommendations and Future Studies My recommendation is to build a developer/programmer centered analytics tool, and later on add business features. The reason being there are already programs on the market which satisfy the business needs. Before any analytics tool is built/programmed there should be further studies of the competitors analytics tools by installing their software into an application and testing it. It would also be helpful to perform more extensive research regarding which information the developers/programmers want and would have use of. The design layout presented in this report could be used as a foundation during the building/programming of the analytics tool, but there has to be usability tests run in parallel throughout the development to ensure good usability. Even if the tool is built for programmers/developers one thing to consider when building the analytics tool it should still have a simple interface so business people will also be able to use it. The program might be expanded to cover the business field and it is preferable to keep the same interface. The last thing that I would recommend is to send member s to the DOs in order to strengthen the bond to Ericsson AB and Ericsson Labs. Sending member s with an interesting read to the DOs will strengthen the bonds without feeling intrusive. They will appreciate the interesting reading at the same time as they are continuously reminded of what Ericsson has to offer. To receive this they should have to mark a checkbox on the signup page, and whenever they want they should be able to unsubscribe to the member . 63
73 References Admob, Mobile Advertising [online] Available at: [Accessed 17 June 2010] AppClix Free Mobile Analytics [online] Available at: [Accessed 2 June 2010] CHI: New horizon, The magic number 5 : is it enough for web testing? Conference on Human Factors in Computing Systems, 2003, Ft. Lauderdale, Florida, USA. pp Chomp, 2010, Chomp: Live App Review [online] Available at: [accessed 21 June 2010] Flurry Flurry analytics [online] Available at: [Accessed 1 June September 2010, redesigned 22 July 2010] Google Analytics, , Google Analytics official website [online] Available at: [accessed at 22 June 2010] Human Factors in Computing Systems Conference 1990, Seattle, Washington, USA. pp Hwang W. Salvendy G., 2010 Number of people required for usability evaluation: the 10±2 rule. Communication of the ACM. Vol. 53 No. 5 pp Learning Technology dissemination initiative, , Questionnaires: advantages and disadvantages [online] Available at: [accessed 4 June 2010] Localytics Test. [online] Available at: [accessed 1 June 2010] McQueen R. & Knussen C., Introduction to research methods and statistics in psychology. Harlow: Pearson education. ISBN-13: Motally Mobile analytics [online] Available at: [accessed 1 June 2010] National encyklopedin. Applikation [online] available at: [accessed 7 June 2010] Norman Donald A., Emotional Design. New York: Basic Books ISBN Nielsen J., Applying discount usability engineering. IEEE Software, vol. 12, no. 1, pp , Jan Nielsen Jakob, Designing Web Usabilty. Indianapolis. New Riders ISBN X Nielsen J. Molich R., Heuristic evaluation of user interfaces. Proceedings of the ACM CHI 90 Online Evaluation Resource Library, Determining if questionnaires should be used [online] available at: [accessed 3 June 2010] Pinch media News and updates [online] Available at: [Accessed 1 June 2010] Shneiderman B. & Plaisant C Designing the User Interface. Fifth edition. Reading. Addison Wesley. ISBN
74 Thomsson Heléne, Reflexiva intervjuer. Lund: studentlitteratur ISBN Trost Jan., Enkätboken, Third edition. Lund: studentlitteratur ISBN Tullis t. & Albert B., 2008 Measuring the user experience; Boston: Morgan Kaufmann. ISBN Useit , F-Shaped Patterns For Reading Web Content (Jakob Nielsen s Alert box, 17 April 2006) [online] available at: [accessed 12 June 2010] Useit , Scrolling and attention (Jakob Nielsen s Alert box, 22 March 2010). [online] available at: [accessed at 13 July 2010] Useit , Tabs, used right: the 13 usability guidelines (Jakob Nielsen s Alert box, 17 September 2007) [online] available at: [accessed 2 July 2010] Useit , Why you only need to test with 5 users (Jakob Nielsen s Alert box, 19 March 2000) [online] available at: [accessed at 30 June 2010] User Interface Engineering , five paper prototyping tips (written by Matthew Klee) [online] available at: [accessed at 9 July 2010] Wikkens C. Hollands J., 1999 Engineering Engineering psychology and human performance. Third edition. Upper Saddle River. Prentice Hall. ISBN Wikipedia, Applcation programming interface. [online] (updated 6 June 2010) Available at: [accessed 7 June 2010] YouTube , Authors@google: Avinash Kaushik (speech given in September 2007) [online] available at: [accessed at 23 June 2010] YouTube , Barry Schwartz: the paradox of choice (speech given in February 2003) [online] available at: [accessed at 23 June 2010] YouTube , Don Norman: three ways that good design makes you happy (speech given in February 2003) [online] available at: [accessed at 17 June 2010] YouTube , Successful Web Analytics Approaches by Avinash Kaushik (speech given in august 2007) [online] available at: [accessed at 14 June 2010]
75 1 (1) Appendix 1 Appendix 1: The result of the brainstorming session (Modified due to limitations in implementation) User o Who is using the application? (sex, age, profession) o What languages are the users speaking? o Who is the carrier? (Sprint, AT&T, Telia) o What software? (ios, Android) o What device does the user have? (Nokia N80, Sony Ericsson w810i) o Would the user recommend the application to others? Application o When is the application used? (time, day, week, month, year) o How often is the application used? (typical user, average, normal distribution) o What was the application used for? o For how long was the application used? o Did the application fulfill the purpose? (GPS: did they reach the target destination? Did they find the stock they searched for?) o What APIs are used? o How often is a specific API used in the application? o How long was the response time? o How much traffic is sent between the application and APIs? (internal/external APIs) o Where do they drop out of the application? o How long of a time do they spend on each part/page of the program? (first time use, expert user) o How many have started up the application? o How many have used it more than once or twice? o How often are they using the application? (once a day, one a week, one a month) o How many are using API 1, API 2, etc/ how many are using part/page A, B, etc? o How many have bought the application? (if one part is free but the more advanced part costs) o How many of the users that bought the program increased/decreased the usage of it? o How much is the bought part used in comparison to the free part? o If they buy the update, from where was the original application downloaded? o How much battery does it take when data is transferred over Wi-Fi/ carrier? How to Collect the Information o Can applications be activated in any other way then by the user? o How should the program be implemented in the application? o Is it possible to create a survey in the application? o Should the data be stored in the application and then sent at a later occasion? o Can data be gathered from other web pages and servers? Transferring the Information o How and when should the information be sent? Presentation o How will the information be easily presented? o How can the information easily be analyzed in depth? o How can it be easy to find specific information? o Who should have access to the information? (Should some be logged in a global data base for everyone?) o How should the program be displayed (navigation, information)? o How should tables/graphs be constructed? (Color coding, heat maps?) o What parameters are interesting to see? (version, time, what is most interesting) o Is any presentation preferred? (ling graph, bar graph, table) o Should the program be a part of labs or stand alone? o How much of Ericsson style sheets have to be used

76 Appendix 2: Modified survey that was sent out 1 (6)

77 2 (6)
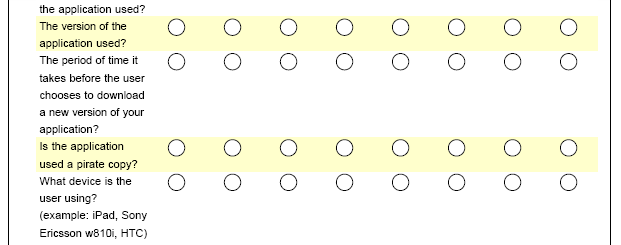
78 3 (6)

79 4 (6)

80 5 (6)
81 6 (6)
82 1 (1) Appendix 3: Instructions for the first card sorting test Hi I am currently working on a mobile application analytics tool. I would like you to group the notes into groups as you think they belong. You can decide how many groups, and which notes should be in each group. If you don t understand a word you can turn the note and see an explanation of the word. This explanation can be thought of as if you are hovering over a word with the mouse or click on an information/help symbol. If you still don t understand the note, please ask what it means. Please start the sorting. Please look over your groups and see if you would like to change anything. Now try to give a short description of each group, why do they belong together? Explain what you think each word means. For the words with markers, pleas provide a different word or explanation that is easier to understand. Thank you.
83 1 (2) Appendix 4: The 39 parameters for the first card sorting test Returning Users Number of users who have used the application more than once. New Users Number of users who have used the application for the first time. Unique Users Number of users who have used the application (only the first visit counts). Number of Sessions How many times the application has been used Session Length How long the application was used during each session. Total Session Time The total time spent in the application (all sessions are summed). Country of Location From what country(s) the application has been used. User Language What language the users of the application have in the settings of the phone. App Language What language the users have selected for the app. Network Provider Which company provides the network service for the phone (Ex: China mobile, Vodafone, T- Mobile, AT&T, and Teliasonera). Platform What platform the application is used on (Ex: Android, iphone). OS Version What version of the operative system the application is used on (Ex: iphone 4.0). App Version Which version of the application it is (ex: 1.0). Device Model Device Brand Method of Data Transfer Amount of Data Transferred Number of App Downloaded Gross Profit Seller Fees Net Profit Number of Upgrades Purchased Income From Upgrade Sales Time Before Paid Upgrade What model the device has where the application is used (Eg. Sonyericsson W810i). Who manufactured the device where the application is used (iphone, ipad, HTC, SonyEricsson)? How data was transferred between; the application and other external servers, and the application and the analytics server. How much data was transferred between; the application and other external servers, and the application and the analytics server. How many times the application has been downloaded. The income from all sales before fees have been paid. The fees paid to the store/market where the application is sold. The income after fees to the seller have been paid. Net income = total income from sales fees to the seller. How many users that have converted from the free trial to the paid upgrade. The income generated from the conversion from a free trial to a paid upgrade. How long time it takes before the users pay for the upgrade.
84 2 (2) Times of Usage Before Paid Upgrade User App Movement Time Until Update is Downloaded User Action Exit Screens App Response Time Crashes Most Viewed Screens Time per Screen Battery Power Used Processing Power Used User Rating Recommendations to Others Sex Age How many times the users use the application before they buy the paid upgrade. How the users move in the application. The time it takes from when a new version is released until the users download the new version. What functions the users use in the application. From what page the users have quit the application. The response time for the different parts of the application. What crashes have occurred in the application and how many. Which screens have been displayed most times? How long time was spent on each screen. How much battery was consumed while using the application. How much process power was consumed by the application What rating users have given the application. How many users have recommended the application to others? The sex of the users. The age of the users
85 1 (1) Appendix 5. The headings for the second card sorting test and the one parameter added Headings User Finance International Events Technical Device Application Information regarding the users of the application and their engagement of the application. Information regarding the finance of the application and related areas. Information regarding country and language. Information regarding user movement and specific information for the different screens displayed. Technical information regarding the phone and the application. Technical information regarding the devices hardware and software Technical information of the used resources of the application and application specific information. The parameter added. Processing Power Available The amount of processing power the device has access to.
86 1 (1) Appendix 6: Instructions for the second card sorting test Hi I am currently working on a mobile application analytics tool. I would like you to sort these notes under the headings you see on the table. If you don t understand a word you can turn the note and see an explanation of the word. This explanation can be thought of as if you are hovering over a word with the mouse or click on an information/help symbol. If you still don t understand the note, please ask what it means. Please start the sorting. Please look over your groups and see if you would like to change anything. Explain what you think each word means. For the words with markers, pleas provide a different word or explanation that is easier to understand. Thank you.
87 1 (2) Appendix 7: The mail sent out for the third card sorting test Hi I m about to create a menu structure of the mobile analytics tool and I am trying to figure out under which headings a few parameters should be placed. I was wondering if you have time to help me with a small test that should take less than 10 minutes. If you don t have time please me and tell me, so I don t wait for your answer. The task: Pair the parameters with the headings. There can be MULTIPLE parameters behind each heading, but one parameter is only allowed to be placed once. There is an example in the end of the mail. ---Parameters (there is a short description behind each parameter) --- * Number of Sessions - How many times the application has been used. * Session Length - How long the application was used during each session. * Country of Location - From what country(s) the application has been used. * User Language - What language the users of the application have in the settings of the phone. * App Language - What language the users have selected for the app. * Number of App Downloaded - How many times the application has been downloaded. * Time Until Update is Downloaded - The time it takes from when a new version is released until the users download the new version. *User Action- What functions the users use in the application. * Most Viewed Screens - Which screens have been displayed most times? * Time per Screen - How long time was spent on each screen. *Exit Screens From what page the users have quit the application. ---Headings--- User Finance Events Technical-Device Technical-Application Best regards David Juhlin Example Parameters: Banana Orange Lemon Apple Grape Plum Pear Mellon Pineapple
88 2 (2) Headings Citrus fruits Large fruits Small fruits Elongated fruits My sorting would look like this. Citrus fruits: Orange, Lemon, Large fruits: Apple, Pear, Mellon, Pineapple Small fruits: Grape, Plum Elongated fruits: Banana
89 1 (1) Appendix 8: Instructions for the paper prototype testing You will receive five tasks to perform with the analytics tool. Use the pencil as a mouse and tell me when you click somewhere. When you perform these tasks try to think aloud and describe as clear as possible what you do. When you think you are done, say so, and you will receive the next task to perform. You will now use the analytics tool from the internet site and extract data regarding the usage of your application (named APPLICATION 1). The analytics tool has one base version which supports more advanced settings. At this point you have not installed the advanced settings, and if you reach a page that is not available caused by this limitation, I will let you know. The first paper prototype page you will receive is a replica of the page you would arrive at after logging into the analytics tool.
90 1 (1) Appendix 9: The tasks for the paper prototype test 1. Check how the number of unique users with ios version 2.0 and application version 1.1 has changed for your application during June 2010 in comparison to June You should be able to compare it day by day (1 June 2009 to 1 June 2010, 2 June 2009 to 2 June 2010, etc.) 2. Since you only have the base version installed, you lack the advanced settings necessary to see how the users move in your application. You are thinking about installing these, but before you do it, you would like to see how it would look after installation. Find fake data which shows how it would look if you logged how the user moved in your application. 3. In the analytics tool you are able to decide when data should be sent from the application to the analytics tool. If you change the maximum delay of when data should be sent, you will be able to affect how long data can be stored in the application. When these installations are changed the settings will be sent to the already downloaded applications at the next start up. I would like you to change the maximum delay to one hour for transmitting information regarding which operative system version the device has. 4. Send information through to a colleague with in depth information of crashes in your application. 5. Find information of how new users are correlated to unique users. Create a graph.
91 1 (1) Appendix 10: Table of the parameters the already existing programs have Users Returning Users X X X 0 X New Users X X X 0 X Unique Users X X X X X X 0 Sessions (Visits) X X X X X X X Session Lengths X X X X X X 0 Total Session Length/ User 0 X X X 0 X 0 Number of Sessions/ User 0 X X X X Geographical Country X X X X X X X Language X X Technical Internet/Network Provider X X X X Platform X X X X OS Version X X X X X X 0 App Version X 0 X X 0 Device Model X X X X X X Device Brand X X X X X X Data Transfer X Jail Broken X Cracked X Finance Application Downloads X E Gross Income X E Commission to Seller X E Net Income X Trial to Paid Upgrade X Trial to Paid Upgrade Income X Time Before Paid Upgrade X Times of Use Before Paid Upgrade 0 Star Rating for Each Version X Movements Top Screens 0 X Events X X X X X User Paths 0 X X=have, 0=did not find, but they probably have, E=they have it in estimated values.
92 1 (1) Appendix 11: Other parameters from the already existing programs Parameters Shows pictures of the product on the web X X X X X X X Has a demonstration video clip on the web X X X X Has the possibility for demo user (have to create X X X X account) Access to demo account without logging in X X Analytics tool Select Applications Menu X X X X X X 0 My Account Menu X X 0 X X X X Help X X X X X X X Time Scale X X X X X X X X=have, 0=did not find, but they probably have.


93 1 (4) Appendix 12: Screen shoots of already existing programs Admob- First page AppClix- Dashboard

94 2 (4) Flurry analytic- Dashboard Localytics


95 3 (4) Motally Dashboard Pinch Media- Statistics by day of the week
96 Google Analytics- Dashboard 4 (4)
97 1 (2) Appendix 13: Results from the different surveys Inter Inter Inter Inter Inter Parameter nal 1 nal 2 nal 3 nal 4 nal 5 Sex of the user Age of the user Profession of the user Where the user lives What language the user is speaking Is it a first time user or expert user? Number of unique users Number of times the user has used the application What movement patterns does the user have (in the world)? If the user would recommend the application to other people To receive statistics on individual level To obtain inconsistency in patterns Exte rnal 1 Exte rnal 2 Exte rnal 3 Onli ne 1 Which device the users have What carrier the users have What software (operative system and version) the users have If the device is jail broken Onli ne 2 How many downloaded the application How many started up the application How many used it more than once How often the application is used How long the users spent on each page/ part of the application What movement patterns the users have in the application When the application is used (time of day) For how long the application was used Where the users drop out of the application How often a specific API is used The amount of traffic sent between the application and APIs on the device The amount of traffic sent between server API and the application How long the response time is If the application was used over Wi-Fi If the application was used over the carrier In what context the application was used If the application fulfills its purpose What the application was used for Which version of the application it is The amount of users who used a pirated copy of the application
98 2 (2) In what countries the application has been used In what state have the application been used In what cities have the application been used If the application is used during travel How many bought the upgrade How the usage increased or decreased after the users bought the upgrade Did the user change the way they used the application after purchased. 6 The average delay until the users bought the upgrade The average delay until the users downloaded a new version Gross revenue The commission to sellers Net revenue Star rating Ranking in store Number of reviews The information should be presented in tables The information should be presented in graphs The information should be presented briefly The information should be presented in depth The level of the report should be on a level of an executive. 5 6 The level of the report should be on a level of a project manager. 5 5 The level of the report should be on a level of a programmer The level of the report should be on a level of a designer The report should have lot of graphs The report should have lot of tables The report should have lot of text The report should be able to print The report should be able to be downloaded in PDF format If the information were in real time I would perceive it as (5 is max) If the information were delayed 1 hour I would perceive it as (5 is max) If the information were delayed 1 day I would perceive it as (5 is max) If the information were delayed 1 week I would perceive it as (5 is max) If the information were delayed 1 month I would perceive it as (5 is max)

99 1 (1) Appendix 14: The result from the first card sorting test.
Netigate User Guide. Setup... 2. Introduction... 5. Questions... 6. Text box... 7. Text area... 9. Radio buttons...10. Radio buttons Weighted...
 Netigate User Guide Setup... 2 Introduction... 5 Questions... 6 Text box... 7 Text area... 9 Radio buttons...10 Radio buttons Weighted...12 Check box...13 Drop-down...15 Matrix...17 Matrix Weighted...18
Measuring the online experience of auto insurance companies
 AUTO INSURANCE BENCHMARK STUDY Measuring the online experience of auto insurance companies Author: Ann Rochanayon Sr. Director of UX/CX Research at UserZoom Contents Introduction Study Methodology Summary
Getting Started with SurveyGizmo Stage 1: Creating Your First Survey
 Getting Started with SurveyGizmo Stage 1: Creating Your First Survey 1. Open SurveyGizmo site (http://www.surveygizmo.com) Log in 2. Click on Create Survey (see screen shot below) 3. Create Your Survey
Qualtrics Survey Tool
 Qualtrics Survey Tool This page left blank intentionally. Table of Contents Overview... 5 Uses for Qualtrics Surveys:... 5 Accessing Qualtrics... 5 My Surveys Tab... 5 Survey Controls... 5 Creating New
MetaTrader 4 for iphone Guide
 MetaTrader 4 for iphone Guide Logging in When you have first downloaded and installed the app from the App Store, you will see the Metatrader 4 icon appear on your screen. Please select this icon by tapping
New! Internet Courses
 Banner Blindness: Web Searchers Often Miss "Obvious" Links Jan Panero Benway David M. Lane Rice University Houston, Texas Suppose you are designing a web page where one particular link among many is likely
PloneSurvey User Guide (draft 3)
") - 1 - PloneSurvey User Guide (draft 3) This short document will hopefully contain enough information to allow people to begin creating simple surveys using the new Plone online survey tool. Caveat PloneSurvey
- 1 - PloneSurvey User Guide (draft 3) This short document will hopefully contain enough information to allow people to begin creating simple surveys using the new Plone online survey tool. Caveat PloneSurvey
How To Convert A Lead In Sugarcrm
 Attract. Convert. Retain. Lead Management in SugarCRM Written by: Josh Sweeney and Matthew Poer www.atcoresystems.com Atcore Systems, LLC 2010 All rights reserved. No part of this publication may be reproduced
SAS VISUAL ANALYTICS AN OVERVIEW OF POWERFUL DISCOVERY, ANALYSIS AND REPORTING
 SAS VISUAL ANALYTICS AN OVERVIEW OF POWERFUL DISCOVERY, ANALYSIS AND REPORTING WELCOME TO SAS VISUAL ANALYTICS SAS Visual Analytics is a high-performance, in-memory solution for exploring massive amounts
Presented By: Web Analytics 101. Avoid Common Mistakes and Learn Best Practices. June 2012. Lubabah Bakht, CEO, Vitizo
 Presented By: Web Analytics 101 Avoid Common Mistakes and Learn Best Practices June 2012 Lubabah Bakht, CEO, Vitizo Web Analytics 101, Lubabah Bakht, June 2012 This 12-page whitepaper provides a deep understanding
THE TOP TEN TIPS FOR USING QUALTRICS AT BYU
 THE TOP TEN TIPS FOR USING QUALTRICS AT BYU TIP #1: CREATING A SURVEY FROM A COPY AND COLLABORATING ON SURVEYS TIP #2: CREATING AND USING PANELS TIP #3: LIBRARIES AND HOW TO USE THEM TIP #4: BASIC SKIP
How to Use Easyhits4U
 How to Use Easyhits4U Table of Contents 1. What are Traffic Exchanges? 1a. What Makes a Good Traffic Exchange? 2. How to use EasyHits4U 2a. Surfing to Earn Credits 2b. Adding a New Site 2c. Assign Credits
USER GUIDE November 2012
 USER GUIDE November 2012 Please note that the screen shots used in this guide are from the demonstration system and may differ slightly from the live system. All customer data contained within these screen
SAP Digital CRM. Getting Started Guide. All-in-one customer engagement built for teams. Run Simple
 SAP Digital CRM Getting Started Guide All-in-one customer engagement built for teams Run Simple 3 Powerful Tools at Your Fingertips 4 Get Started Now Log on Choose your features Explore your home page
Using Google Analytics
 Using Google Analytics Overview Google Analytics is a free tracking application used to monitor visitors to your website in order to provide site designers with a fuller knowledge of their audience. At
Fan Fu. Usability Testing of Cloud File Storage Systems. A Master s Paper for the M.S. in I.S. degree. April, 2013. 70 pages. Advisor: Robert Capra
 Fan Fu. Usability Testing of Cloud File Storage Systems. A Master s Paper for the M.S. in I.S. degree. April, 2013. 70 pages. Advisor: Robert Capra This paper presents the results of a usability test involving
Designing for the Web
 Designing for the Web Design Issues Technical Issues Some Web Design Issues Breadth vs. Depth Navigation vs. Content Seller vs. Buyer (i.e., Designer vs. User) Colors and Images Several images in this
Marketing Automation And the Buyers Journey
 Marketing Automation And the Buyers Journey A StrategyMix White Paper By Jonathan Calver, Managing Director, StrategyMix About this Paper This paper will first introduce you to the principles and concepts
Bad designs. Chapter 1: What is interaction design? Why is this vending machine so bad? Good design. Good and bad design.
 Bad designs Chapter 1: What is interaction design? Elevator controls and labels on the bottom row all look the same, so it is easy to push a label by mistake instead of a control button People do not make
MicroStrategy Desktop
 MicroStrategy Desktop Quick Start Guide MicroStrategy Desktop is designed to enable business professionals like you to explore data, simply and without needing direct support from IT. 1 Import data from
Editors Comparison (NetBeans IDE, Eclipse, IntelliJ IDEA)
") České vysoké učení technické v Praze Fakulta elektrotechnická Návrh Uživatelského Rozhraní X36NUR Editors Comparison (NetBeans IDE, Eclipse, ) May 5, 2008 Goal and purpose of test Purpose of this test
České vysoké učení technické v Praze Fakulta elektrotechnická Návrh Uživatelského Rozhraní X36NUR Editors Comparison (NetBeans IDE, Eclipse, ) May 5, 2008 Goal and purpose of test Purpose of this test
3 Ways Your Web Design Can Better Connect You to Your Audience
 3 Ways Your Web Design Can Better Connect You to Your Audience by Rafal Tomal Feb 06 How do people recognize good web design? There is a big difference between good and bad design. Many people can identify
Data Driven Success. Comparing Log Analytics Tools: Flowerfire s Sawmill vs. Google Analytics (GA)
") Data Driven Success Comparing Log Analytics Tools: Flowerfire s Sawmill vs. Google Analytics (GA) In business, data is everything. Regardless of the products or services you sell or the systems you support,
Data Driven Success Comparing Log Analytics Tools: Flowerfire s Sawmill vs. Google Analytics (GA) In business, data is everything. Regardless of the products or services you sell or the systems you support,
Version 6.7 OPERATOR S GUIDE
 Version 6.7 OPERATOR S GUIDE Contents 1 Netop Live Guide... 1 2 Log on to Netop Live Guide Operator Console... 1 3 Manage chats... 2 3.1 Queue... 3 3.2 Chat area... 5 3.3 Tools... 6 3.4 Operator status...
SimplyCast emarketing Email User Guide
 SimplyCast emarketing Email User Guide Email User Guide Page 1 Contents 1. Email Overview... 3 2. Features Overview... 3 3. Email Editor Features... 8 4. How to Create an Email Campaign?... 5 5. Additional
Intellect Platform - The Workflow Engine Basic HelpDesk Troubleticket System - A102
 Intellect Platform - The Workflow Engine Basic HelpDesk Troubleticket System - A102 Interneer, Inc. Updated on 2/22/2012 Created by Erika Keresztyen Fahey 2 Workflow - A102 - Basic HelpDesk Ticketing System
DPD App manual. Guideline for DPD Apps version 1.0. Network Marketing, May 2011
 DPD App manual Guideline for DPD Apps version 1.0, May 2011 Table of content 1. Background 2. About this document 3. Global DPD App standards 4. Developing and designing ios Apps 5. Contact 6. Appendix
Executive Dashboard Cookbook
 Executive Dashboard Cookbook Rev: 2011-08-16 Sitecore CMS 6.5 Executive Dashboard Cookbook A Marketers Guide to the Executive Insight Dashboard Table of Contents Chapter 1 Introduction... 3 1.1 Overview...
Profitable vs. Profit-Draining Local Business Websites
 By: Peter Slegg (01206) 433886 07919 921263 www.besmartmedia.com peter@besmartmedia.com Phone: 01206 433886 www.besmartmedia.com Page 1 What is the Difference Between a Profitable and a Profit-Draining
IBM SPSS Direct Marketing 22
 IBM SPSS Direct Marketing 22 Note Before using this information and the product it supports, read the information in Notices on page 25. Product Information This edition applies to version 22, release
TOP New Features of Oracle Business Intelligence 11g
 10 TOP New Features of Oracle Business Intelligence 11g TABLE OF CONTENTS Feature 1 New Chart Choices Funnel Chart 2 Trellis Chart 3 Waterfall 4 Tile Diagram 5 Feature 2 Recommended Visualization 6 Feature
Succeed in Search. The Role of Search in Business to Business Buying Decisions A Summary of Research Conducted October 27, 2004
 Succeed in Search The Role of Search in Business to Business Buying Decisions A Summary of Research Conducted October 27, 2004 Conducted with the Assistance of Conducted by Gord Hotchkiss Steve Jensen
Power Tools for Pivotal Tracker
 Power Tools for Pivotal Tracker Pivotal Labs Dezmon Fernandez Victoria Kay Eric Dattore June 16th, 2015 Power Tools for Pivotal Tracker 1 Client Description Pivotal Labs is an agile software development
Table of Contents. Click on heading to navigate directly to that section. Introduction... 3
 Election Guide Table of Contents Click on heading to navigate directly to that section. Introduction... 3 Part One: Pre-Election Set-Up... 3 Step 1: Logging into Your Simply Voting User Account... 3 Step
5 STEP WEB-TO-LEAD CONVERSION
 Marketing Expertise - Topic Two: What Contractors Need to Know About Online Lead Conversion 5 STEP WEB-TO-LEAD CONVERSION Learn what every home remodeling contractor should know about online lead generation.
Writer Guide. Chapter 15 Using Forms in Writer
 Writer Guide Chapter 15 Using Forms in Writer Copyright This document is Copyright 2005 2008 by its contributors as listed in the section titled Authors. You may distribute it and/or modify it under the
Sales Performance Management Using Salesforce.com and Tableau 8 Desktop Professional & Server
 Sales Performance Management Using Salesforce.com and Tableau 8 Desktop Professional & Server Author: Phil Gilles Sales Operations Analyst, Tableau Software March 2013 p2 Executive Summary Managing sales
8 Tips for Maximizing Survey Response Potential
 8 Tips for Maximizing Survey Response Potential You ve built a survey and are ready to make it available to potential respondents. But how do you convert those potential respondents into completed responses?
Radian6: Reporting. The New Topic Analysis Widget compares results based off of your topic profile. It can compare results about
 Contents Radian6: Reporting Topic Analysis Widget.1 Use Keywords...1 Use Topics...7 New Topic Trends Widget..14 Conversation Cloud Widget...14 New Influence Viewer...15 River of News Widget 17 Example.19
Moreketing. With great ease you can end up wasting a lot of time and money with online marketing. Causing
 ! Moreketing Automated Cloud Marketing Service With great ease you can end up wasting a lot of time and money with online marketing. Causing frustrating delay and avoidable expense right at the moment
T he complete guide to SaaS metrics
 T he complete guide to SaaS metrics What are the must have metrics each SaaS company should measure? And how to calculate them? World s Simplest Analytics Tool INDEX Introduction 4-5 Acquisition Dashboard
A Simple Guide to Churn Analysis
 A Simple Guide to Churn Analysis A Publication by Evergage Introduction Thank you for downloading A Simple Guide to Churn Analysis. The goal of this guide is to make analyzing churn easy, meaning you wont
IBM SPSS Direct Marketing 23
 IBM SPSS Direct Marketing 23 Note Before using this information and the product it supports, read the information in Notices on page 25. Product Information This edition applies to version 23, release
Paper 10-27 Designing Web Applications: Lessons from SAS User Interface Analysts Todd Barlow, SAS Institute Inc., Cary, NC
 Paper 10-27 Designing Web Applications: Lessons from SAS User Interface Analysts Todd Barlow, SAS Institute Inc., Cary, NC ABSTRACT Web application user interfaces combine aspects of non-web GUI design
Introduction to ProForm Rapid elearning Studio. What is ProForm? The ProForm Course Authoring Tool allows you to quickly create
 Introduction to ProForm Rapid elearning Studio The ProForm Rapid elearning Studio includes the ProForm Course Authoring Tool, the SWiSH Rapid Animation Tool, and the RapidCam Screen Recording Tool. This
Green Arrow Web Design Limited
 Green Arrow Web Design Limited You and your ecommerce website. Don t think it will make your sales with no input from yourself or a professional Your Guide to ecommerce from Green Arrow Web Design What
Creating and Managing Online Surveys LEVEL 2
 Creating and Managing Online Surveys LEVEL 2 Accessing your online survey account 1. If you are logged into UNF s network, go to https://survey. You will automatically be logged in. 2. If you are not logged
GREATEST LEAD GENERATION TIPS, TRICKS & IDEAS PART 2
 THE GREATEST LEAD GENERATION TIPS, TRICKS AND IDEAS 1 THE GREATEST LEAD GENERATION TIPS, TRICKS & IDEAS PART 2 A Publication of THE GREATEST LEAD GENERATION TIPS, TRICKS AND IDEAS 2 CALLS-TO-ACTION THAT
Guidelines for Effective Email Creative
 Guidelines for Effective Email Creative While the need for quality and effective design has always existed from a marketing standpoint, challenges unique to the email space require a different look at
Online Banking & Bill Pay. Quick Start Guide. Step-by-step instructions PLUS easy-to-read screen shots and helpful tips.
 Online Banking & Bill Pay Quick Start Guide Step-by-step instructions PLUS easy-to-read screen shots and helpful tips. Welcome -- Online System Security Welcome to Online Banking and Bill Pay! Whether
GET OUT AND ABOUT WITH APPS
 GET OUT AND ABOUT WITH APPS App Development from FWDP Prepared by Mark Woolmer October 2014 And So Our Journey Begins... The development of an App can be a simple or complicated affair. As the functionality
Metatrader 4 Tutorial
 Metatrader 4 Tutorial Thank you for your interest in Best Metatrader Broker! This tutorial goes in detail about how to install and trade with your new Metatrader Forex trading platform. With Best Metatrader
OECD.Stat Web Browser User Guide
 OECD.Stat Web Browser User Guide May 2013 May 2013 1 p.10 Search by keyword across themes and datasets p.31 View and save combined queries p.11 Customise dimensions: select variables, change table layout;
starting your website project
 starting your website project Here are three comprehensive posts from our blog, refined and updated through feedback from our clients. Together, they cover the essentials of building a successful website.
ANALYTIC HIERARCHY PROCESS (AHP) TUTORIAL
 TUTORIAL") Kardi Teknomo ANALYTIC HIERARCHY PROCESS (AHP) TUTORIAL Revoledu.com Table of Contents Analytic Hierarchy Process (AHP) Tutorial... 1 Multi Criteria Decision Making... 1 Cross Tabulation... 2 Evaluation
Kardi Teknomo ANALYTIC HIERARCHY PROCESS (AHP) TUTORIAL Revoledu.com Table of Contents Analytic Hierarchy Process (AHP) Tutorial... 1 Multi Criteria Decision Making... 1 Cross Tabulation... 2 Evaluation
Distributor Certification Questionnaire
 Distributor Certification Questionnaire In order to take the test you must download and print both this questionnaire and the blank answer sheet. Write your answers on the answer sheet so that you only
Amusement Park Project
 Amusement Park Project Introduction Astroworld has recently received state and local approval to add two new rollercoasters to their amusement park. The new rides will demonstrate some of the basic laws
Lean UX. Best practices for integrating user insights into the app development process. Best Practices Copyright 2015 UXprobe bvba
 Lean UX Best practices for integrating user insights into the app development process Best Practices Copyright 2015 UXprobe bvba Table of contents Introduction.... 3 1. Ideation phase... 4 1.1. Task Analysis...
Final project report MODAVI Movie Database Visualization
 Final project report MODAVI Movie Database Visualization Group 7 Juha Hjelm 67359 Johanna Huhtala 81535 Petri Laitinen 73651 Tiina Malinen 72957 2 Table of Contents 1 Introduction... 3 1.1 Problem statement...3
QUALTRICS TIPS AND TRICKS FOR UNC-CH USERS
 QUALTRICS TIPS AND TRICKS FOR UNC-CH USERS PLEASE NOTE: This tip sheet is not intended as a step-by-step guide. It was developed to provide information that UNC users have found important to know in addition
TakeMySelfie ios App Documentation
 TakeMySelfie ios App Documentation What is TakeMySelfie ios App? TakeMySelfie App allows a user to take his own picture from front camera. User can apply various photo effects to the front camera. Programmers
SmallBiz Dynamic Theme User Guide
 SmallBiz Dynamic Theme User Guide Table of Contents Introduction... 3 Create Your Website in Just 5 Minutes... 3 Before Your Installation Begins... 4 Installing the Small Biz Theme... 4 Customizing the
The psychology behind creating successful email marketing
 Whitepaper Improving results together Whitepaper 1 Contents Introduction... 2 Psychology and why it s important... 3 Understanding how email generates an emotional response... 3-4 Colour... 4-5 Images...
P6 Analytics Reference Manual
 P6 Analytics Reference Manual Release 3.2 October 2013 Contents Getting Started... 7 About P6 Analytics... 7 Prerequisites to Use Analytics... 8 About Analyses... 9 About... 9 About Dashboards... 10 Logging
How to Select and Implement an ERP System
 How to Select and Implement an ERP System Prepared by 180 Systems Written by Michael Burns 180 Systems WHAT IS ERP?... 3 ANALYSIS... 4 VENDOR SELECTION... 6 VENDOR DEMONSTRATIONS... 8 REFERENCE CALLS...
Organizational Development Qualtrics Online Surveys for Program Evaluation
 The purpose of this training unit is to provide training in an online survey tool known as Qualtrics. Qualtrics is a powerful online survey tool used by many different kinds of professionals to gather
Intellect Platform - Tables and Templates Basic Document Management System - A101
 Intellect Platform - Tables and Templates Basic Document Management System - A101 Interneer, Inc. 4/12/2010 Created by Erika Keresztyen 2 Tables and Templates - A101 - Basic Document Management System
new techniques of information organization and retrieval have become both possible and necessary. Now that the Internet and the World Wide Web (WWW)
") 1 An evaluation of a Wizard approach to Web design Karl W. Sandberg Joel Palmius Yan Pan Mid Sweden University and Luleå University of Technology, Sweden Mid Sweden University Luleå University of Technology
1 An evaluation of a Wizard approach to Web design Karl W. Sandberg Joel Palmius Yan Pan Mid Sweden University and Luleå University of Technology, Sweden Mid Sweden University Luleå University of Technology
A 7-Step Analytics Reporting Framework
 A 7-Step Analytics Reporting Framework By Feras Alhlou, Principal Marketing Consultant 2 Marketing Optimization Imagine that you just attended a conference on digital marketing and analytics. You re pumped
Outlook Web Access (OWA) - Using Calendar and Email on the Web
 - Using Calendar and Email on the Web") Outlook Web Access (OWA) - Using Calendar and Email on the Web You can access OWA through a web browser on any computer connected to the internet. This guide is intended to help with the most common tasks
Outlook Web Access (OWA) - Using Calendar and Email on the Web You can access OWA through a web browser on any computer connected to the internet. This guide is intended to help with the most common tasks
COMMON CUSTOMIZATIONS
 COMMON CUSTOMIZATIONS As always, if you have questions about any of these features, please contact us by e-mail at pposupport@museumsoftware.com or by phone at 1-800-562-6080. EDIT FOOTER TEXT Included
2/24/2010 ClassApps.com
 SelectSurvey.NET Training Manual This document is intended to be a simple visual guide for non technical users to help with basic survey creation, management and deployment. 2/24/2010 ClassApps.com Getting
A Comparative Study of Database Design Tools
 A Comparative Study of Database Design Tools Embarcadero Technologies ER/Studio and Sybase PowerDesigner Usability Sciences Corporation 909 Hidden Ridge, Suite 575, Irving, Texas 75038 tel: 972-550-1599
Webropol 2.0 Manual. Updated 5.7.2012
 Webropol 2.0 Manual Updated 5.7.2012 Contents 1. GLOSSARY... 2 1.1. Question types... 2 1.2. Software Glossary... 3 1.3. Survey Glossary... 3 1.4. Reporting Glossary... 5 1.5. MyWebropol Glossary... 5
Novell ZENworks Asset Management 7.5
 Novell ZENworks Asset Management 7.5 w w w. n o v e l l. c o m October 2006 USING THE WEB CONSOLE Table Of Contents Getting Started with ZENworks Asset Management Web Console... 1 How to Get Started...
Create Beautiful Reports with AWR Cloud and Prove the Value of Your SEO Efforts
 Create Beautiful Reports with AWR Cloud and Prove the Value of Your SEO Efforts It can be difficult sometimes to show your clients the value that they get from your service. Your job, as an SEO, is to
SCC Online Web Edition
 THE SUREST WAY TO LEGAL RESEARCH SCC Online Web Edition User Guide Welcome to SCC Online Make your legal research easier, quicker, and more effective Thank you for choosing SCC Online Web Edition as your
Assessment of the project
 Assessment of the project International Marketing Offensive for Smart Phones in China 1. Assessment of the project itself In November 2014 we started preparing our project which was an international marketing
The Secret Formula for Webinar Presentations that Work Every Time
 The Secret Formula for Webinar Presentations that Work Every Time by Gihan Perera www.webinarsmarts.com Sponsored by In an online presentation, your slides aren t visual aids; they ARE the visuals. One
User Guide for TASKE Desktop
 User Guide for TASKE Desktop For Avaya Aura Communication Manager with Aura Application Enablement Services Version: 8.9 Date: 2013-03 This document is provided to you for informational purposes only.
Integrated Company Analysis
 Using Integrated Company Analysis Version 2.0 Zacks Investment Research, Inc. 2000 Manual Last Updated: 8/11/00 Contents Overview 3 Introduction...3 Guided Tour 4 Getting Started in ICA...4 Parts of ICA
ZOINED RETAIL ANALYTICS. User Guide
 ZOINED RETAIL ANALYTICS User Guide Contents Using the portal New user Profile Email reports Portal use Dashboard Drilling down into the data Filter options Analytics Managing analysis Saving the analysis
Virtual Heart User Manual Username Password
 Virtual Heart User Manual Username Password These instructions are meant to help you use the Virtual Heart website. Please write down your username and password and store them in a safe place in case you
After you complete the survey, compare what you saw on the survey to the actual questions listed below:
 Creating a Basic Survey Using Qualtrics Clayton State University has purchased a campus license to Qualtrics. Both faculty and students can use Qualtrics to create surveys that contain many different types
ONLINE EXTERNAL AND SURVEY STUDIES
 ONLINE EXTERNAL AND SURVEY STUDIES Before reading this document, be sure you are already familiar with the Instructions for using the School of Psychological Sciences Participant Pool available on the
Your Blueprint websites Content Management System (CMS).
.") Your Blueprint websites Content Management System (CMS). Your Blueprint website comes with its own content management system (CMS) so that you can make your site your own. It is simple to use and allows
Your Blueprint websites Content Management System (CMS). Your Blueprint website comes with its own content management system (CMS) so that you can make your site your own. It is simple to use and allows
Finance Reporting. Millennium FAST. User Guide Version 4.0. Memorial University of Newfoundland. September 2013
 Millennium FAST Finance Reporting Memorial University of Newfoundland September 2013 User Guide Version 4.0 FAST Finance User Guide Page i Contents Introducing FAST Finance Reporting 4.0... 2 What is FAST
A1 Customer Relationship Management (CRM) & Sales Force Management Guide
 & Sales Force Management Guide") A1 Customer Relationship Management (CRM) & Sales Force Management Guide What is CRM? A business that sells a product or service has a need for Customer Relationship Management or CRM. This App was the
A1 Customer Relationship Management (CRM) & Sales Force Management Guide What is CRM? A business that sells a product or service has a need for Customer Relationship Management or CRM. This App was the
Screen Design : Navigation, Windows, Controls, Text,
 Overview Introduction Fundamentals of GUIs Screen Design : Navigation, Windows, Controls, Text, Evaluating GUI Performance - Methods - Comparison 1 Example: Automotive HMI (CAR IT 03/2013) 64, 68, 69 2
MICROSOFT OUTLOOK 2010
 MICROSOFT OUTLOOK 2010 George W. Rumsey Computer Resource Center 1525 East 53rd, Suite 906 Chicago, IL 60615 (773) 955-4455 www.computer-resource.com gwrumsey@att.net What Is Outlook?... 1 Folders... 2
Chapter 15 Using Forms in Writer
 Writer Guide Chapter 15 Using Forms in Writer OpenOffice.org Copyright This document is Copyright 2005 2006 by its contributors as listed in the section titled Authors. You can distribute it and/or modify
Email Marketing Success
 Email Marketing Success Please Consider the following related offers. Thank you. Boost You Email List Sign-Up by 1000% FOR FREE!!! Watch this free video and find out how you can EASILY boost your email
Lotto Master Formula (v1.3) The Formula Used By Lottery Winners
 The Formula Used By Lottery Winners") Lotto Master Formula (v.) The Formula Used By Lottery Winners I. Introduction This book is designed to provide you with all of the knowledge that you will need to be a consistent winner in your local lottery
Lotto Master Formula (v.) The Formula Used By Lottery Winners I. Introduction This book is designed to provide you with all of the knowledge that you will need to be a consistent winner in your local lottery
EMAIL MARKETING BEST PRACTICES. www.agillic.com contact@agillic.com
 EMAIL MARKETING BEST PRACTICES www.agillic.com contact@agillic.com SUBJECTS AND PREHEADERS Subject Preheader Tell it don t sell it Your subjects and preheaders can make all the difference to your email.
Visualization Quick Guide
 Visualization Quick Guide A best practice guide to help you find the right visualization for your data WHAT IS DOMO? Domo is a new form of business intelligence (BI) unlike anything before an executive
10 features your practice s website must have to improve income and patient care!
 10 features your practice s website must have to improve income and patient care! What are they and how can you best take advantage of them? White paper produced - 2015 These strategic tips have proven
SelectSurvey.NET Basic Training Class 1
 SelectSurvey.NET Basic Training Class 1 3 Hour Course Updated for v.4.143.001 6/2015 Page 1 of 57 SelectSurvey.NET Basic Training In this video course, students will learn all of the basic functionality
Google Analytics Guide. for BUSINESS OWNERS. By David Weichel & Chris Pezzoli. Presented By
 Google Analytics Guide for BUSINESS OWNERS By David Weichel & Chris Pezzoli Presented By Google Analytics Guide for Ecommerce Business Owners Contents Introduction... 3 Overview of Google Analytics...
Copyright EPiServer AB
 Table of Contents 3 Table of Contents ABOUT THIS DOCUMENTATION 4 HOW TO ACCESS EPISERVER HELP SYSTEM 4 EXPECTED KNOWLEDGE 4 ONLINE COMMUNITY ON EPISERVER WORLD 4 COPYRIGHT NOTICE 4 EPISERVER ONLINECENTER
Virtual Terminal User Guide
 Virtual Terminal User Guide For Professional Use Only Currently only available in English. A usage Professional Uniquement Disponible en Anglais uniquement pour l'instant. Last Updated: 2005 PayPal Virtual