GPU Performance Analysis and Optimisation
|
|
|
- Leonard Goodwin
- 8 years ago
- Views:
Transcription
1 GPU Performance Analysis and Optimisation Thomas Bradley, NVIDIA Corporation

2 Outline What limits performance? Analysing performance: GPU profiling Exposing sufficient parallelism Optimising for Kepler

3 Additional Resources More information on topics we cannot cover today Kepler architecture: GTC on Demand: Session S0642 Inside Kepler Kepler whitepapers: More details: GTC on Demand - S0514 GPU Performance Analysis and Optimization - S0419 Optimizing Application Performance with CUDA ProfilingTools - S0420 Nsight IDE for Linux and Mac CUPTI documentation (describes all the profiler counters) - Included in every CUDA toolkit (/cuda/extras/cupti/doc/cupti_users_guide.pdf GPU computing webinars in general: In particular: register spilling
 - Included in every CUDA toolkit")
4 Example Workflow Getting Started on GPU Overall goal is application performance, combination of factors inter-node/inter-process communication CPU-GPU communication CPU/GPU performance Start by analysing realistic data at realistic scale Various tools such as Vampir, TAU, Scalasca help identify hotspots Extract data for development Select timesteps for shorter runtime Select subdomain for smaller scale

5 Example Workflow Optimising Communication (node/process) Computation In this talk we re focussing on the GPU CPU, DMA, GPU overlap Kernel optimisation

6 PERFORMANCE LIMITERS
7 What Limits Communication with the GPU? PCIe bus connects GPU to CPU/network Gen 2 (Fermi): 8 GB/s in each direction Gen 3 (Kepler): 16 GB/s in each direction Tesla GPUs have dual DMA engines Two memcpys (in different streams, different directions) Overlap with kernel and CPU execution GPUDirect RDMA e.g. MPI directly from GPU memory
 Overlap with kernel and CPU execution")
8 What Limits Kernel Performance? Memory bandwidth Low number of operations per byte Instruction bandwidth High number of operations per byte Latency Unable to fill memory or arithmetic pipelines How do we determine what is limiting a given kernel? Profiling tools (e.g. nsight, nvvp, nvprof)

9 PROFILING


10 Why Profile? GPU Application Code CPU 100 s of cores 10,000 s of threads Great memory bandwidth Best at parallel execution A few cores 10 s of threads Good memory bandwidth Best at serial execution

11 NVIDIA Profilers NVIDIA Visual Profiler Standalone (nvvp) Integrated into NVIDIA Nsight Eclipse Edition (nsight) NVIDIA Nsight Visual Studio Edition nvprof Command-line Driver-based profiler still available Command-line, controlled by environment variables

12 NVIDIA VISUAL PROFILER

13 Profiling Session

14 NVIDIA Visual Profiler
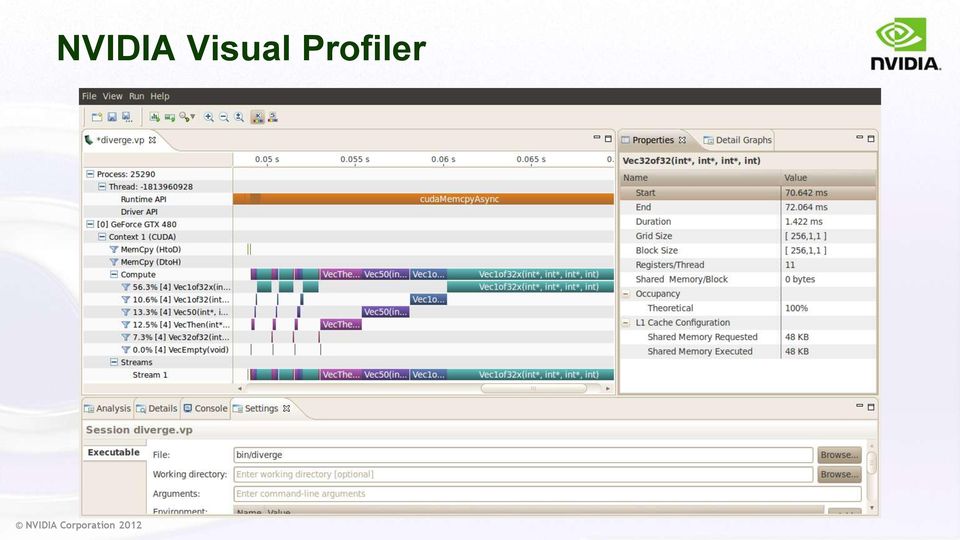
15 Timeline GPU/CPU Timeline

16 CPU Timeline CUDA API Invocations

17 GPU Timeline Device Activity

18 Measuring Time Measure time with horizontal rulers. Supports overlapping ranges, snap-to-edge

19 Correlating CPU and GPU Activity API Call Stream

20 Properties - Kernel Kernel Properties

21 Properties - Memcpy Memcpy Properties
22 Analysis, Details, etc. Additional Views
23 Concurrent Kernels Compute row shows concurrent kernel execution Multiple streams launch independent kernels
24 Profiling Flow Understand CPU behavior on timeline Add profiling annotations to application NVIDIA Tools Extension - Custom markers and time ranges - Custom naming Focus profiling on region of interest Reduce volume of profile data Improve usability of Visual Profiler Improve accuracy of analysis Analyze for optimisation opportunities
25 Annotations: NVIDIA Tools Extension Developer API for CPU code Installed with CUDA Toolkit (libnvtoolsext.so) Naming Host OS threads: nvtxnameosthread() CUDA device, context, stream: nvtxnamecudastream() Time Ranges and Markers Range: nvtxrangestart(), nvtxrangeend() Instantaneous marker: nvtxmark()
26 Example: Time Ranges Testing algorithm in testbench Use time ranges API to mark initialisation, test, and results nvtxrangeid_t id0 = nvtxrangestart( Initialize ); < init code > nvtxrangeend(id0); nvtxrangeid_t id1 = nvtxrangestart( Test ); < compute code > nvtxrangeend(id1);
27 Example: Time Ranges
28 Profile Region Of Interest cudaprofilerstart() / cudaprofilerstop() in CPU code Specify representative subset of app execution Manual exploration and analysis simplified Automated analysis focused on performance critical code for (i = 0; i < N; i++) { if (i == 12) cudaprofilerstart(); <loop body> if (i == 15) cudaprofilerstop(); }
29 Enable Region Of Interest Insert cudaprofilerstart() / cudaprofilerstop() Disable profiling at start of application
30 Example: Without cudaprofilerstart/stop Region of Interest

31 Example: With cudaprofilerstart/stop
32 Analysis Visual inspection of timeline Automated Analysis Metrics and Events
33 Visual Inspection Understand CPU/GPU interactions Use nvtoolsext to mark time ranges on CPU Is application taking advantage of both CPU and GPU? Is CPU waiting on GPU? Is GPU waiting on CPU? Look for potential concurrency opportunities Overlap memcpy and kernel Concurrent kernels Automated analysis does some of this
34 Automated Analysis - Application Analyse entire application Timeline Hardware performance counters
35 Analysis Documentation
36 Results Correlated With Timeline
37 Analysis Properties Highlight a kernel or memcpy in timeline Properties shows analysis results for that specific kernel / memcpy Optimisation opportunities are flagged
38 Automated Analysis Single Kernel Analysis performed on single kernel instance
39 Uncoalesced Global Memory Accesses Access pattern determines number of memory transactions Report loads/stores where access pattern if inefficient
40 Source Correlation
41 Divergent Branches Divergent control-flow for threads within a warp Report branches that have high average divergence
42 Source Correlation
43 Enabling Source Correlation Source correlation requires that source/line information be embedded in executable Available in debug executables: nvcc G New flag for optimised executables: nvcc -lineinfo
44 Detailed Profile Data
45 Detailed Summary Profile Data
46 Filtering
47 Metrics and Events
48 Metrics and Events
49 NVPROF
50 nvprof Textual reports Summary of GPU and CPU activity Trace of GPU and CPU activity Event collection Headless profile collection Use nvprof on headless node to collect data Visualise timeline with Visual Profiler
51 nvprof Usage $ nvprof [nvprof_args] <app> [app_args] Argument help $ nvprof --help
52 nvprof GPU Summary $ nvprof dct8x8 ======== Profiling result: Time(%) Time Calls Avg Min Max Name ms us 92.31us 94.31us CUDAkernel2DCT(float*, float*, int) ms us us us CUDAkernel1DCT(float*,int, int,int) us us us us CUDAkernel1IDCT(float*,int,int,int) us us us us CUDAkernelQuantizationFloat() us us us us [CUDA memcpy DtoH] us us 89.70us us [CUDA memcpy HtoD] us us us us CUDAkernelShortDCT(short*, int) us us us us [CUDA memcpy HtoA] us us us us CUDAkernelShortIDCT(short*, int) us us us us CUDAkernelQuantizationShort(short*) us us 97.75us 97.75us CUDAkernel2IDCT(float*, float*) us us 22.59us 22.59us [CUDA memcpy DtoA]
53 nvprof GPU Summary (csv) $ nvprof --csv dct8x8 ======== Profiling result: Time(%),Time,Calls,Avg,Min,Max,Name,ms,,us,us,us, 49.51, ,101, , , ,"CUDAkernel2DCT(float*, float*, int)" 37.47, ,10, , , ,"CUDAkernel1DCT(float*, int, int, int)" 3.75, ,1, , , ,"CUDAkernel1IDCT(float*, int, int, int)" 1.84, ,2, , , ,"CUDAkernelQuantizationFloat(float*, int)" 1.75, ,2, , , ,"[CUDA memcpy DtoH]" 1.42, ,2, , , ,"[CUDA memcpy HtoD]" 1.00, ,1, , , ,"CUDAkernelShortDCT(short*, int)" 0.94, ,1, , , ,"[CUDA memcpy HtoA]" 0.93, ,1, , , ,"CUDAkernelShortIDCT(short*, int)" 0.76, ,1, , , ,"CUDAkernelQuantizationShort(short*, int)" 0.52, ,1, , , ,"CUDAkernel2IDCT(float*, float*, int)" 0.12, ,1, , , ,"[CUDA memcpy DtoA]"
54 nvprof GPU Trace $ nvprof --print-gpu-trace dct8x8 ======== Profiling result: Start Duration Grid Size Block Size Regs SSMem DSMem Size Throughput Name ms us MB 5.93GB/s [CUDA memcpy HtoA] ms us ( ) (8 8 1) B 0B - - CUDAkernel1DCT(float*, ) ms us ( ) (8 8 1) B 0B - - CUDAkernel1DCT(float*, ) ms us ( ) (8 8 1) B 0B - - CUDAkernel1DCT(float*, ) ms us ( ) (8 8 1) B 0B - - CUDAkernel1DCT(float*, ) ms us ( ) (8 8 1) B 0B - - CUDAkernel1DCT(float*, ) ms us ( ) (8 8 1) B 0B - - CUDAkernel1DCT(float*, ) ms us ( ) (8 8 1) B 0B - - CUDAkernel1DCT(float*, ) ms us ( ) (8 8 1) B 0B - - CUDAkernel1DCT(float*, ) ms us ( ) (8 8 1) B 0B - - CUDAkernel1DCT(float*, ) ms us ( ) (8 8 1) B 0B - - CUDAkernel1DCT(float*, ) ms us ( ) (8 8 1) 27 0B 0B - - CUDAkernelQuantization ( ) ms 22.82us MB 45.96GB/s [CUDA memcpy DtoA]
55 nvprof CPU/GPU Trace $ nvprof --print-gpu-trace --print-api-trace dct8x8 ======== Profiling result: Start Duration Grid Size Block Size Regs SSMem DSMem Size Throughput Name ms us MB 5.93GB/s [CUDA memcpy HtoA] ms 2.00us cudasetupargument ms 38.00us cudalaunch ms 1.00ms cudadevicesynchronize ms us ( ) (8 8 1) B 0B - - CUDAkernel1DCT(float*, ) ms 2.00us cudaconfigurecall ms 1.00us cudasetupargument ms 1.00us cudasetupargument ms 1.00us cudasetupargument ms 0ns cudasetupargument ms 24.00us cudalaunch ms us cudadevicesynchronize ms us ( ) (8 8 1) B 0B - - CUDAkernel1DCT(float*, )
56 nvprof Event Query $ nvprof --devices 0 --query-events ======== Available Events: Name Description Device 0: Domain domain_a: sm_cta_launched: Number of thread blocks launched on a multiprocessor. l1_local_load_hit: Number of cache lines that hit in L1 cache for local memory load accesses. In case of perfect coalescing this increments by 1, 2, and 4 for 32, 64 and 128 bit accesses by a warp respectively. l1_local_load_miss: Number of cache lines that miss in L1 cache for local memory load accesses. In case of perfect coalescing this increments by 1, 2, and 4 for 32, 64 and 128 bit accesses by a warp respectively. l1_local_store_hit: Number of cache lines that hit in L1 cache for local memory store accesses. In case of perfect coalescing this increments by 1, 2, and 4 for 32, 64 and 128 bit accesses by a warp respectively.
57 nvprof Event Collection $ nvprof --devices 0 --events branch,divergent_branch dct8x8 ======== Profiling result: Invocations Avg Min Max Event Name Device 0 Kernel: CUDAkernel1IDCT(float*, int, int, int) branch divergent_branch Kernel: CUDAkernelQuantizationFloat(float*, int) branch divergent_branch Kernel: CUDAkernel1DCT(float*, int, int, int) branch divergent_branch Kernel: CUDAkernelShortIDCT(short*, int) branch divergent_branch Kernel: CUDAkernel2IDCT(float*, float*, int) branch divergent_branch
58 nvprof Profile Data Export/Import Produce profile into a file using o $ nvprof o profile.out <app> <app args> Import into Visual Profiler File menu -> Import nvprof Profile Import into nvprof to generate textual outputs $ nvprof i profile.out $ nvprof i profile.out --print-gpu-trace $ nvprof i profile.out --print-api-trace
59 nvprof MPI Each rank must output to separate file Launch nvprof wrapper with mpirun Set output file name based on rank Limit which ranks are profiled Example script in nvvp help for OpenMPI and MVAPICH2 Remember to disable profiling at start if using cudaprofilerstart()/cudaprofilerstop()
60 EXPOSING SUFFICIENT PARALLELISM
61 Kepler: Level of Parallelism Needed To saturate instruction bandwidth: Fp32 math: ~1.7K independent instructions per SM Lower for other, lower-throughput instructions Keep in mind that Kepler SM can track up to 2048 threads To saturate memory bandwidth: 100+ independent lines per SM
62 Memory Parallelism Achieved Kepler memory throughput As a function of the number of independent requests per SM Request: 128-byte line
63 Exposing Sufficient Parallelism What hardware ultimately needs: Arithmetic pipes: Sufficient number of independent instructions (accommodate multi-issue and latency hiding) Memory system: Sufficient requests in flight to saturate bandwidth (Little s Law) Two ways to increase parallelism More independent work within a thread (warp) - ILP for math, independent accesses for memory More concurrent threads (warps)
 Registers per thread - SM registers are partitioned among the threads Shared memory per threadblock - SM shared memory is partitioned among the")
64 Occupancy Occupancy: number of concurrent threads per SM Expressed as either: - the number of threads (or warps) - percentage of maximum threads Determined by several factors (refer to Occupancy Calculator, CUDA Programming Guide for full details) Registers per thread - SM registers are partitioned among the threads Shared memory per threadblock - SM shared memory is partitioned among the blocks Threads per threadblock - Threads are allocated at threadblock granularity Kepler SM resources 64K 32-bit registers Up to 48 KB of shared memory Up to 2048 concurrent threads Up to 16 concurrent threadblocks
65 Occupancy and Performance Note that 100% occupancy isn t needed to reach maximum performance Sufficient occupancy to hide latency, higher occupancy will not improve performance Sufficient occupancy depends on the code More independent work per thread less occupancy is needed Memory-bound codes tend to need higher occupancy - Higher latency (than for arithmetic) needs more work
66 Exposing Parallelism: Grid Configuration Grid: arrangement of threads into threadblocks Two goals: Expose enough parallelism to an SM Balance work across the SMs Several things to consider when launching kernels: Number of threads per threadblock Number of threadblocks Amount of work per threadblock
67 Threadblock Size and Occupancy Threadblock size is a multiple of warp size (32) Even if you request fewer threads, HW rounds up Threadblocks can be too small Kepler SM can run up to 16 threadblocks concurrently SM may reach the block limit before reaching good occupancy - Example: 1-warp blocks -> 16 warps per Kepler SM (frequently not enough) Threadblocks can be too big Quantization effect: - Enough SM resources for more threads, not enough for another large block - A threadblock isn t started until resources are available for all of its threads
68 Threadblock Sizing Too few threads per block Number of warps allowed by SM resources SM resources: Registers Shared memory Too many threads per block
69 Case Study: Threadblock Sizing Non-hydrostatic Icosahedral Model (NIM) Global weather simulation code, NOAA vdmintv kernel: - 63 registers per thread, 3840 bytes of SMEM per warp - At most 12 warps per Fermi SM (limited by SMEM) Initial grid: 32 threads per block, 10,424 blocks Blocks are too small: - 8 warps per SM, limited by number of blocks (Fermi s limit was 8) - Code achieves a small percentage (~30%) of both math and memory bandwidth Time: 6.89 ms
70 Case Study: Threadblock Sizing Optimized config: 64 threads per block, 5,212 blocks Occupancy: 12 warps per SM, limited by SMEM Time: 5.68 ms (1.21x speedup) Further optimization: Reduce SMEM consumption by moving variables to registers - 63 registers per thread, 1536 bytes of SMEM per warp Occupancy: 16 warps per SM, limited by registers Time: 3.23 ms (2.13x speedup over original)
71 General Guidelines Threadblock size choice: Start with threads per block - Adjust up/down by what best matches your function - Example: stencil codes prefer larger blocks to minimize halos Multiple of warp size (32 threads) If occupancy is critical to performance: - Check that block size isn t precluding occupancy allowed by register and SMEM resources Grid size: 1,000 or more threadblocks - 10s of waves of threadblocks: no need to think about tail effect - Makes your code ready for several generations of future GPUs
72 OPTIMISING FOR KEPLER
73 Kepler Architecture Family Two architectures in the family: GK104 (Tesla K10, GeForce: GTX690, GTX680, GTX670,...) - Note that K10 is 2 GK104 chips on a single board GK110 (Tesla K20,...) GK110 has a number of features not in GK104: Dynamic parallelism, HyperQ More registers per thread, more fp64 throughput For full details refer to: - Kepler Whitepaper ( - GTC12 Session 0642: Inside Kepler
74 Good News About Kepler Optimisation The same optimisation fundamentals that applied to Fermi, apply to Kepler There are no new fundamentals Main optimization considerations: Expose sufficient parallelism - SM is more powerful, so will need more work Coalesce memory access - Exactly the same as on Fermi Have coherent control flow within warps - Exactly the same as on Fermi
75 Level of Parallelism Parallelism for memory is most important Most codes don t achieve peak fp throughput because: - Stalls waiting on memory (latency not completely hidden) - Execution of non-fp instructions (indexing, control-flow, etc.) - NOT because of lack of independent fp math GK104: Compared to Fermi, needs ~2x concurrent accesses per SM to saturate memory bandwidth - Memory bandwidth comparable to Fermi - 8 SMs while Fermi had 16 SMs Doesn t necessarily need twice the occupancy of your Fermi code - If Fermi code exposed more than sufficient parallelism, increase is less than 2x
76 Kepler SM Improvements for Occupancy 2x registers Both GK104 and GK110 64K registers (Fermi had 32K) Code where occupancy is limited by registers will readily achieve higher occupancy (run more concurrent warps) 2x threadblocks Both GK104 and GK110 Up to 16 threadblocks (Fermi had 8) 1.33x more threads Both GK104 and GK110 Up to 2048 threads (Fermi had 1536)
77 Increased Shared Memory Bandwidth Both GK104 and GK110 To benefit, code must access 8-byte words No changes for double-precision codes Single-precision or integer codes should group accesses into float2, int2 strutures to get the benefit Refer to Case Study 6 for a usecase sample
78 SM Improvements Specific to GK110 More registers per thread A thread can use up to 255 registers (Fermi had 63) Improves performance for some codes that spilled a lot of registers on Fermi (or GK104) - Note that more registers per thread still has to be weighed against lower occupancy Ability to use read-only cache for accessing global memory Improves performance for some codes with scattered access patterns, lowers the overhead due to replays Warp-shuffle instruction (tool for ninjas) Enables threads in the same warp to exchange values without going through shared memory
79 Considerations for Dynamic Parallelism GPU threads are able to launch work for GPU GK110-specific feature Same considerations as for launches from CPU Same exact considerations for exposing sufficient parallelism as for traditional launches (CPU launches work for GPU) A single launch doesn t have to saturate the GPU: - GPU can execute up to 32 different kernel launches concurrently
80 Conclusion When programming and optimising think about: Exposing sufficient parallelism Coalescing memory accesses Having coherent control flow within warps Use profiling tools when analyzing performance Determine performance limiters first Diagnose memory access patterns
Optimizing Application Performance with CUDA Profiling Tools
 Optimizing Application Performance with CUDA Profiling Tools Why Profile? Application Code GPU Compute-Intensive Functions Rest of Sequential CPU Code CPU 100 s of cores 10,000 s of threads Great memory
NVIDIA Tools For Profiling And Monitoring. David Goodwin
 NVIDIA Tools For Profiling And Monitoring David Goodwin Outline CUDA Profiling and Monitoring Libraries Tools Technologies Directions CScADS Summer 2012 Workshop on Performance Tools for Extreme Scale
Guided Performance Analysis with the NVIDIA Visual Profiler
 Guided Performance Analysis with the NVIDIA Visual Profiler Identifying Performance Opportunities NVIDIA Nsight Eclipse Edition (nsight) NVIDIA Visual Profiler (nvvp) nvprof command-line profiler Guided
CUDA Optimization with NVIDIA Tools. Julien Demouth, NVIDIA
 CUDA Optimization with NVIDIA Tools Julien Demouth, NVIDIA What Will You Learn? An iterative method to optimize your GPU code A way to conduct that method with Nvidia Tools 2 What Does the Application
E6895 Advanced Big Data Analytics Lecture 14:! NVIDIA GPU Examples and GPU on ios devices
 E6895 Advanced Big Data Analytics Lecture 14: NVIDIA GPU Examples and GPU on ios devices Ching-Yung Lin, Ph.D. Adjunct Professor, Dept. of Electrical Engineering and Computer Science IBM Chief Scientist,
CUDA Tools for Debugging and Profiling. Jiri Kraus (NVIDIA)
") Mitglied der Helmholtz-Gemeinschaft CUDA Tools for Debugging and Profiling Jiri Kraus (NVIDIA) GPU Programming@Jülich Supercomputing Centre Jülich 7-9 April 2014 What you will learn How to use cuda-memcheck
Mitglied der Helmholtz-Gemeinschaft CUDA Tools for Debugging and Profiling Jiri Kraus (NVIDIA) GPU Programming@Jülich Supercomputing Centre Jülich 7-9 April 2014 What you will learn How to use cuda-memcheck
Introduction to GP-GPUs. Advanced Computer Architectures, Cristina Silvano, Politecnico di Milano 1
 Introduction to GP-GPUs Advanced Computer Architectures, Cristina Silvano, Politecnico di Milano 1 GPU Architectures: How do we reach here? NVIDIA Fermi, 512 Processing Elements (PEs) 2 What Can It Do?
Overview. Lecture 1: an introduction to CUDA. Hardware view. Hardware view. hardware view software view CUDA programming
 Overview Lecture 1: an introduction to CUDA Mike Giles mike.giles@maths.ox.ac.uk hardware view software view Oxford University Mathematical Institute Oxford e-research Centre Lecture 1 p. 1 Lecture 1 p.
OpenCL Optimization. San Jose 10/2/2009 Peng Wang, NVIDIA
 OpenCL Optimization San Jose 10/2/2009 Peng Wang, NVIDIA Outline Overview The CUDA architecture Memory optimization Execution configuration optimization Instruction optimization Summary Overall Optimization
Graphics Cards and Graphics Processing Units. Ben Johnstone Russ Martin November 15, 2011
 Graphics Cards and Graphics Processing Units Ben Johnstone Russ Martin November 15, 2011 Contents Graphics Processing Units (GPUs) Graphics Pipeline Architectures 8800-GTX200 Fermi Cayman Performance Analysis
CUDA SKILLS. Yu-Hang Tang. June 23-26, 2015 CSRC, Beijing
 CUDA SKILLS Yu-Hang Tang June 23-26, 2015 CSRC, Beijing day1.pdf at /home/ytang/slides Referece solutions coming soon Online CUDA API documentation http://docs.nvidia.com/cuda/index.html Yu-Hang Tang @
Introduction to GPU hardware and to CUDA
 Introduction to GPU hardware and to CUDA Philip Blakely Laboratory for Scientific Computing, University of Cambridge Philip Blakely (LSC) GPU introduction 1 / 37 Course outline Introduction to GPU hardware
TEGRA X1 DEVELOPER TOOLS SEBASTIEN DOMINE, SR. DIRECTOR SW ENGINEERING
 TEGRA X1 DEVELOPER TOOLS SEBASTIEN DOMINE, SR. DIRECTOR SW ENGINEERING NVIDIA DEVELOPER TOOLS BUILD. DEBUG. PROFILE. C/C++ IDE INTEGRATION STANDALONE TOOLS HARDWARE SUPPORT CPU AND GPU DEBUGGING & PROFILING
1. If we need to use each thread to calculate one output element of a vector addition, what would
 Quiz questions Lecture 2: 1. If we need to use each thread to calculate one output element of a vector addition, what would be the expression for mapping the thread/block indices to data index: (A) i=threadidx.x
Applications to Computational Financial and GPU Computing. May 16th. Dr. Daniel Egloff +41 44 520 01 17 +41 79 430 03 61
 F# Applications to Computational Financial and GPU Computing May 16th Dr. Daniel Egloff +41 44 520 01 17 +41 79 430 03 61 Today! Why care about F#? Just another fashion?! Three success stories! How Alea.cuBase
NVIDIA CUDA Software and GPU Parallel Computing Architecture. David B. Kirk, Chief Scientist
 NVIDIA CUDA Software and GPU Parallel Computing Architecture David B. Kirk, Chief Scientist Outline Applications of GPU Computing CUDA Programming Model Overview Programming in CUDA The Basics How to Get
ANDROID DEVELOPER TOOLS TRAINING GTC 2014. Sébastien Dominé, NVIDIA
 ANDROID DEVELOPER TOOLS TRAINING GTC 2014 Sébastien Dominé, NVIDIA AGENDA NVIDIA Developer Tools Introduction Multi-core CPU tools Graphics Developer Tools Compute Developer Tools NVIDIA Developer Tools
Next Generation GPU Architecture Code-named Fermi
 Next Generation GPU Architecture Code-named Fermi The Soul of a Supercomputer in the Body of a GPU Why is NVIDIA at Super Computing? Graphics is a throughput problem paint every pixel within frame time
GPU System Architecture. Alan Gray EPCC The University of Edinburgh
 GPU System Architecture EPCC The University of Edinburgh Outline Why do we want/need accelerators such as GPUs? GPU-CPU comparison Architectural reasons for GPU performance advantages GPU accelerated systems
GPU Tools Sandra Wienke
 Sandra Wienke Center for Computing and Communication, RWTH Aachen University MATSE HPC Battle 2012/13 Rechen- und Kommunikationszentrum (RZ) Agenda IDE Eclipse Debugging (CUDA) TotalView Profiling (CUDA
Lecture 1: an introduction to CUDA
 Lecture 1: an introduction to CUDA Mike Giles mike.giles@maths.ox.ac.uk Oxford University Mathematical Institute Oxford e-research Centre Lecture 1 p. 1 Overview hardware view software view CUDA programming
GPU Computing with CUDA Lecture 2 - CUDA Memories. Christopher Cooper Boston University August, 2011 UTFSM, Valparaíso, Chile
 GPU Computing with CUDA Lecture 2 - CUDA Memories Christopher Cooper Boston University August, 2011 UTFSM, Valparaíso, Chile 1 Outline of lecture Recap of Lecture 1 Warp scheduling CUDA Memory hierarchy
GPU Computing with CUDA Lecture 4 - Optimizations. Christopher Cooper Boston University August, 2011 UTFSM, Valparaíso, Chile
 GPU Computing with CUDA Lecture 4 - Optimizations Christopher Cooper Boston University August, 2011 UTFSM, Valparaíso, Chile 1 Outline of lecture Recap of Lecture 3 Control flow Coalescing Latency hiding
Programming models for heterogeneous computing. Manuel Ujaldón Nvidia CUDA Fellow and A/Prof. Computer Architecture Department University of Malaga
 Programming models for heterogeneous computing Manuel Ujaldón Nvidia CUDA Fellow and A/Prof. Computer Architecture Department University of Malaga Talk outline [30 slides] 1. Introduction [5 slides] 2.
Texture Cache Approximation on GPUs
 Texture Cache Approximation on GPUs Mark Sutherland Joshua San Miguel Natalie Enright Jerger {suther68,enright}@ece.utoronto.ca, joshua.sanmiguel@mail.utoronto.ca 1 Our Contribution GPU Core Cache Cache
GPU Computing - CUDA
 GPU Computing - CUDA A short overview of hardware and programing model Pierre Kestener 1 1 CEA Saclay, DSM, Maison de la Simulation Saclay, June 12, 2012 Atelier AO and GPU 1 / 37 Content Historical perspective
GPU Programming Strategies and Trends in GPU Computing
 GPU Programming Strategies and Trends in GPU Computing André R. Brodtkorb 1 Trond R. Hagen 1,2 Martin L. Sætra 2 1 SINTEF, Dept. Appl. Math., P.O. Box 124, Blindern, NO-0314 Oslo, Norway 2 Center of Mathematics
OpenPOWER Outlook AXEL KOEHLER SR. SOLUTION ARCHITECT HPC
 OpenPOWER Outlook AXEL KOEHLER SR. SOLUTION ARCHITECT HPC Driving industry innovation The goal of the OpenPOWER Foundation is to create an open ecosystem, using the POWER Architecture to share expertise,
GPU Parallel Computing Architecture and CUDA Programming Model
 GPU Parallel Computing Architecture and CUDA Programming Model John Nickolls Outline Why GPU Computing? GPU Computing Architecture Multithreading and Arrays Data Parallel Problem Decomposition Parallel
GPU File System Encryption Kartik Kulkarni and Eugene Linkov
 GPU File System Encryption Kartik Kulkarni and Eugene Linkov 5/10/2012 SUMMARY. We implemented a file system that encrypts and decrypts files. The implementation uses the AES algorithm computed through
Optimizing Parallel Reduction in CUDA. Mark Harris NVIDIA Developer Technology
 Optimizing Parallel Reduction in CUDA Mark Harris NVIDIA Developer Technology Parallel Reduction Common and important data parallel primitive Easy to implement in CUDA Harder to get it right Serves as
HP ProLiant SL270s Gen8 Server. Evaluation Report
 HP ProLiant SL270s Gen8 Server Evaluation Report Thomas Schoenemeyer, Hussein Harake and Daniel Peter Swiss National Supercomputing Centre (CSCS), Lugano Institute of Geophysics, ETH Zürich schoenemeyer@cscs.ch
NVIDIA CUDA GETTING STARTED GUIDE FOR MICROSOFT WINDOWS
 NVIDIA CUDA GETTING STARTED GUIDE FOR MICROSOFT WINDOWS DU-05349-001_v6.0 February 2014 Installation and Verification on TABLE OF CONTENTS Chapter 1. Introduction...1 1.1. System Requirements... 1 1.2.
Profiler User's Guide
 Version 2016 www.pgroup.com TABLE OF CONTENTS Profiling Overview... iv What's New... iv Terminology... v Chapter 1. Preparing An Application For Profiling...1 1.1. Focused Profiling...1 1.2. Marking Regions
Learn CUDA in an Afternoon: Hands-on Practical Exercises
 Learn CUDA in an Afternoon: Hands-on Practical Exercises Alan Gray and James Perry, EPCC, The University of Edinburgh Introduction This document forms the hands-on practical component of the Learn CUDA
The Fastest, Most Efficient HPC Architecture Ever Built
 Whitepaper NVIDIA s Next Generation TM CUDA Compute Architecture: TM Kepler GK110 The Fastest, Most Efficient HPC Architecture Ever Built V1.0 Table of Contents Kepler GK110 The Next Generation GPU Computing
LBM BASED FLOW SIMULATION USING GPU COMPUTING PROCESSOR
 LBM BASED FLOW SIMULATION USING GPU COMPUTING PROCESSOR Frédéric Kuznik, frederic.kuznik@insa lyon.fr 1 Framework Introduction Hardware architecture CUDA overview Implementation details A simple case:
Cluster Monitoring and Management Tools RAJAT PHULL, NVIDIA SOFTWARE ENGINEER ROB TODD, NVIDIA SOFTWARE ENGINEER
 Cluster Monitoring and Management Tools RAJAT PHULL, NVIDIA SOFTWARE ENGINEER ROB TODD, NVIDIA SOFTWARE ENGINEER MANAGE GPUS IN THE CLUSTER Administrators, End users Middleware Engineers Monitoring/Management
CudaDMA: Optimizing GPU Memory Bandwidth via Warp Specialization
 CudaDMA: Optimizing GPU Memory Bandwidth via Warp Specialization Michael Bauer Stanford University mebauer@cs.stanford.edu Henry Cook UC Berkeley hcook@cs.berkeley.edu Brucek Khailany NVIDIA Research bkhailany@nvidia.com
NVIDIA GeForce GTX 580 GPU Datasheet
 NVIDIA GeForce GTX 580 GPU Datasheet NVIDIA GeForce GTX 580 GPU Datasheet 3D Graphics Full Microsoft DirectX 11 Shader Model 5.0 support: o NVIDIA PolyMorph Engine with distributed HW tessellation engines
GPU Architectures. A CPU Perspective. Data Parallelism: What is it, and how to exploit it? Workload characteristics
 GPU Architectures A CPU Perspective Derek Hower AMD Research 5/21/2013 Goals Data Parallelism: What is it, and how to exploit it? Workload characteristics Execution Models / GPU Architectures MIMD (SPMD),
Lecture 3: Modern GPUs A Hardware Perspective Mohamed Zahran (aka Z) mzahran@cs.nyu.edu http://www.mzahran.com
 mzahran@cs.nyu.edu http://www.mzahran.com") CSCI-GA.3033-012 Graphics Processing Units (GPUs): Architecture and Programming Lecture 3: Modern GPUs A Hardware Perspective Mohamed Zahran (aka Z) mzahran@cs.nyu.edu http://www.mzahran.com Modern GPU
CSCI-GA.3033-012 Graphics Processing Units (GPUs): Architecture and Programming Lecture 3: Modern GPUs A Hardware Perspective Mohamed Zahran (aka Z) mzahran@cs.nyu.edu http://www.mzahran.com Modern GPU
OpenCL Programming for the CUDA Architecture. Version 2.3
 OpenCL Programming for the CUDA Architecture Version 2.3 8/31/2009 In general, there are multiple ways of implementing a given algorithm in OpenCL and these multiple implementations can have vastly different
GPU Usage. Requirements
 GPU Usage Use the GPU Usage tool in the Performance and Diagnostics Hub to better understand the high-level hardware utilization of your Direct3D app. You can use it to determine whether the performance
How To Test Your Code On A Cuda Gdb (Gdb) On A Linux Computer With A Gbd (Gbd) And Gbbd Gbdu (Gdb) (Gdu) (Cuda
 On A Linux Computer With A Gbd (Gbd) And Gbbd Gbdu (Gdb) (Gdu) (Cuda") Mitglied der Helmholtz-Gemeinschaft Hands On CUDA Tools and Performance-Optimization JSC GPU Programming Course 26. März 2011 Dominic Eschweiler Outline of This Talk Introduction Setup CUDA-GDB Profiling
Mitglied der Helmholtz-Gemeinschaft Hands On CUDA Tools and Performance-Optimization JSC GPU Programming Course 26. März 2011 Dominic Eschweiler Outline of This Talk Introduction Setup CUDA-GDB Profiling
The Uintah Framework: A Unified Heterogeneous Task Scheduling and Runtime System
 The Uintah Framework: A Unified Heterogeneous Task Scheduling and Runtime System Qingyu Meng, Alan Humphrey, Martin Berzins Thanks to: John Schmidt and J. Davison de St. Germain, SCI Institute Justin Luitjens
GPU Hardware Performance. Fall 2015
 Fall 2015 Atomic operations performs read-modify-write operations on shared or global memory no interference with other threads for 32-bit and 64-bit integers (c. c. 1.2), float addition (c. c. 2.0) using
CUDA programming on NVIDIA GPUs
 p. 1/21 on NVIDIA GPUs Mike Giles mike.giles@maths.ox.ac.uk Oxford University Mathematical Institute Oxford-Man Institute for Quantitative Finance Oxford eresearch Centre p. 2/21 Overview hardware view
Experiences on using GPU accelerators for data analysis in ROOT/RooFit
 Experiences on using GPU accelerators for data analysis in ROOT/RooFit Sverre Jarp, Alfio Lazzaro, Julien Leduc, Yngve Sneen Lindal, Andrzej Nowak European Organization for Nuclear Research (CERN), Geneva,
Introduction to GPU Architecture
 Introduction to GPU Architecture Ofer Rosenberg, PMTS SW, OpenCL Dev. Team AMD Based on From Shader Code to a Teraflop: How GPU Shader Cores Work, By Kayvon Fatahalian, Stanford University Content 1. Three
HPC with Multicore and GPUs
 HPC with Multicore and GPUs Stan Tomov Electrical Engineering and Computer Science Department University of Tennessee, Knoxville CS 594 Lecture Notes March 4, 2015 1/18 Outline! Introduction - Hardware
Enabling Preemptive Multiprogramming on GPUs
 Enabling Preemptive Multiprogramming on GPUs Ivan Tanasic 1,2, Isaac Gelado 3, Javier Cabezas 1,2, Alex Ramirez 1,2, Nacho Navarro 1,2, Mateo Valero 1,2 1 Barcelona Supercomputing Center 2 Universitat
NVIDIA CUDA GETTING STARTED GUIDE FOR MAC OS X
 NVIDIA CUDA GETTING STARTED GUIDE FOR MAC OS X DU-05348-001_v6.5 August 2014 Installation and Verification on Mac OS X TABLE OF CONTENTS Chapter 1. Introduction...1 1.1. System Requirements... 1 1.2. About
Lecture 11: Multi-Core and GPU. Multithreading. Integration of multiple processor cores on a single chip.
 Lecture 11: Multi-Core and GPU Multi-core computers Multithreading GPUs General Purpose GPUs Zebo Peng, IDA, LiTH 1 Multi-Core System Integration of multiple processor cores on a single chip. To provide
OPTIMIZE DMA CONFIGURATION IN ENCRYPTION USE CASE. Guillène Ribière, CEO, System Architect
 OPTIMIZE DMA CONFIGURATION IN ENCRYPTION USE CASE Guillène Ribière, CEO, System Architect Problem Statement Low Performances on Hardware Accelerated Encryption: Max Measured 10MBps Expectations: 90 MBps
NVIDIA VIDEO ENCODER 5.0
 NVIDIA VIDEO ENCODER 5.0 NVENC_DA-06209-001_v06 November 2014 Application Note NVENC - NVIDIA Hardware Video Encoder 5.0 NVENC_DA-06209-001_v06 i DOCUMENT CHANGE HISTORY NVENC_DA-06209-001_v06 Version
Computer Graphics Hardware An Overview
 Computer Graphics Hardware An Overview Graphics System Monitor Input devices CPU/Memory GPU Raster Graphics System Raster: An array of picture elements Based on raster-scan TV technology The screen (and
HPC Wales Skills Academy Course Catalogue 2015
 HPC Wales Skills Academy Course Catalogue 2015 Overview The HPC Wales Skills Academy provides a variety of courses and workshops aimed at building skills in High Performance Computing (HPC). Our courses
GTC 2014 San Jose, California
 GTC 2014 San Jose, California An Approach to Parallel Processing of Big Data in Finance for Alpha Generation and Risk Management Yigal Jhirad and Blay Tarnoff March 26, 2014 GTC 2014: Table of Contents
NVIDIA CUDA GETTING STARTED GUIDE FOR MAC OS X
 NVIDIA CUDA GETTING STARTED GUIDE FOR MAC OS X DU-05348-001_v5.5 July 2013 Installation and Verification on Mac OS X TABLE OF CONTENTS Chapter 1. Introduction...1 1.1. System Requirements... 1 1.2. About
~ Greetings from WSU CAPPLab ~
 ~ Greetings from WSU CAPPLab ~ Multicore with SMT/GPGPU provides the ultimate performance; at WSU CAPPLab, we can help! Dr. Abu Asaduzzaman, Assistant Professor and Director Wichita State University (WSU)
Parallel Programming Survey
 Christian Terboven 02.09.2014 / Aachen, Germany Stand: 26.08.2014 Version 2.3 IT Center der RWTH Aachen University Agenda Overview: Processor Microarchitecture Shared-Memory
Binary search tree with SIMD bandwidth optimization using SSE
 Binary search tree with SIMD bandwidth optimization using SSE Bowen Zhang, Xinwei Li 1.ABSTRACT In-memory tree structured index search is a fundamental database operation. Modern processors provide tremendous
GPU Hardware and Programming Models. Jeremy Appleyard, September 2015
 GPU Hardware and Programming Models Jeremy Appleyard, September 2015 A brief history of GPUs In this talk Hardware Overview Programming Models Ask questions at any point! 2 A Brief History of GPUs 3 Once
Molecular Dynamics, GPUs, and EC2. Scott Le Grand, Principal Engineer, AWS
 Molecular Dynamics, GPUs, and EC2 Scott Le Grand, Principal Engineer, AWS AMBER An MD simulation package and a set of MD force fields PMEMD is a subset of the MD simulation package optimized for production
Introduction to GPGPU. Tiziano Diamanti t.diamanti@cineca.it
 t.diamanti@cineca.it Agenda From GPUs to GPGPUs GPGPU architecture CUDA programming model Perspective projection Vectors that connect the vanishing point to every point of the 3D model will intersecate
Towards Fast SQL Query Processing in DB2 BLU Using GPUs A Technology Demonstration. Sina Meraji sinamera@ca.ibm.com
 Towards Fast SQL Query Processing in DB2 BLU Using GPUs A Technology Demonstration Sina Meraji sinamera@ca.ibm.com Please Note IBM s statements regarding its plans, directions, and intent are subject to
Multi-Threading Performance on Commodity Multi-Core Processors
 Multi-Threading Performance on Commodity Multi-Core Processors Jie Chen and William Watson III Scientific Computing Group Jefferson Lab 12000 Jefferson Ave. Newport News, VA 23606 Organization Introduction
Write a technical report Present your results Write a workshop/conference paper (optional) Could be a real system, simulation and/or theoretical
 Could be a real system, simulation and/or theoretical") Identify a problem Review approaches to the problem Propose a novel approach to the problem Define, design, prototype an implementation to evaluate your approach Could be a real system, simulation and/or
Identify a problem Review approaches to the problem Propose a novel approach to the problem Define, design, prototype an implementation to evaluate your approach Could be a real system, simulation and/or
CUDA Debugging. GPGPU Workshop, August 2012. Sandra Wienke Center for Computing and Communication, RWTH Aachen University
 CUDA Debugging GPGPU Workshop, August 2012 Sandra Wienke Center for Computing and Communication, RWTH Aachen University Nikolay Piskun, Chris Gottbrath Rogue Wave Software Rechen- und Kommunikationszentrum
Intro to GPU computing. Spring 2015 Mark Silberstein, 048661, Technion 1
 Intro to GPU computing Spring 2015 Mark Silberstein, 048661, Technion 1 Serial vs. parallel program One instruction at a time Multiple instructions in parallel Spring 2015 Mark Silberstein, 048661, Technion
Overview on Modern Accelerators and Programming Paradigms Ivan Giro7o igiro7o@ictp.it
 Overview on Modern Accelerators and Programming Paradigms Ivan Giro7o igiro7o@ictp.it Informa(on & Communica(on Technology Sec(on (ICTS) Interna(onal Centre for Theore(cal Physics (ICTP) Mul(ple Socket
GPU Profiling with AMD CodeXL
 GPU Profiling with AMD CodeXL Software Profiling Course Hannes Würfel OUTLINE 1. Motivation 2. GPU Recap 3. OpenCL 4. CodeXL Overview 5. CodeXL Internals 6. CodeXL Profiling 7. CodeXL Debugging 8. Sources
Introduction to Numerical General Purpose GPU Computing with NVIDIA CUDA. Part 1: Hardware design and programming model
 Introduction to Numerical General Purpose GPU Computing with NVIDIA CUDA Part 1: Hardware design and programming model Amin Safi Faculty of Mathematics, TU dortmund January 22, 2016 Table of Contents Set
15-418 Final Project Report. Trading Platform Server
 15-418 Final Project Report Yinghao Wang yinghaow@andrew.cmu.edu May 8, 214 Trading Platform Server Executive Summary The final project will implement a trading platform server that provides back-end support
COMPUTER ORGANIZATION ARCHITECTURES FOR EMBEDDED COMPUTING
 COMPUTER ORGANIZATION ARCHITECTURES FOR EMBEDDED COMPUTING 2013/2014 1 st Semester Sample Exam January 2014 Duration: 2h00 - No extra material allowed. This includes notes, scratch paper, calculator, etc.
Case Study on Productivity and Performance of GPGPUs
 Case Study on Productivity and Performance of GPGPUs Sandra Wienke wienke@rz.rwth-aachen.de ZKI Arbeitskreis Supercomputing April 2012 Rechen- und Kommunikationszentrum (RZ) RWTH GPU-Cluster 56 Nvidia
VI Performance Monitoring
 VI Performance Monitoring Preetham Gopalaswamy Group Product Manager Ravi Soundararajan Staff Engineer September 15, 2008 Agenda Introduction to performance monitoring in VI Common customer/partner questions
Introducing PgOpenCL A New PostgreSQL Procedural Language Unlocking the Power of the GPU! By Tim Child
 Introducing A New PostgreSQL Procedural Language Unlocking the Power of the GPU! By Tim Child Bio Tim Child 35 years experience of software development Formerly VP Oracle Corporation VP BEA Systems Inc.
Performance Analysis for GPU Accelerated Applications
 Center for Information Services and High Performance Computing (ZIH) Performance Analysis for GPU Accelerated Applications Working Together for more Insight Willersbau, Room A218 Tel. +49 351-463 - 39871
MONTE-CARLO SIMULATION OF AMERICAN OPTIONS WITH GPUS. Julien Demouth, NVIDIA
 MONTE-CARLO SIMULATION OF AMERICAN OPTIONS WITH GPUS Julien Demouth, NVIDIA STAC-A2 BENCHMARK STAC-A2 Benchmark Developed by banks Macro and micro, performance and accuracy Pricing and Greeks for American
Stream Processing on GPUs Using Distributed Multimedia Middleware
 Stream Processing on GPUs Using Distributed Multimedia Middleware Michael Repplinger 1,2, and Philipp Slusallek 1,2 1 Computer Graphics Lab, Saarland University, Saarbrücken, Germany 2 German Research
Performance Counter. Non-Uniform Memory Access Seminar Karsten Tausche 2014-12-10
 Performance Counter Non-Uniform Memory Access Seminar Karsten Tausche 2014-12-10 Performance Counter Hardware Unit for event measurements Performance Monitoring Unit (PMU) Originally for CPU-Debugging
The Yin and Yang of Processing Data Warehousing Queries on GPU Devices
 The Yin and Yang of Processing Data Warehousing Queries on GPU Devices Yuan Yuan Rubao Lee Xiaodong Zhang Department of Computer Science and Engineering The Ohio State University {yuanyu, liru, zhang}@cse.ohio-state.edu
A GPU COMPUTING PLATFORM (SAGA) AND A CFD CODE ON GPU FOR AEROSPACE APPLICATIONS
 AND A CFD CODE ON GPU FOR AEROSPACE APPLICATIONS") A GPU COMPUTING PLATFORM (SAGA) AND A CFD CODE ON GPU FOR AEROSPACE APPLICATIONS SUDHAKARAN.G APCF, AERO, VSSC, ISRO 914712564742 g_suhakaran@vssc.gov.in THOMAS.C.BABU APCF, AERO, VSSC, ISRO 914712565833
A GPU COMPUTING PLATFORM (SAGA) AND A CFD CODE ON GPU FOR AEROSPACE APPLICATIONS SUDHAKARAN.G APCF, AERO, VSSC, ISRO 914712564742 g_suhakaran@vssc.gov.in THOMAS.C.BABU APCF, AERO, VSSC, ISRO 914712565833
Hands-on CUDA exercises
 Hands-on CUDA exercises CUDA Exercises We have provided skeletons and solutions for 6 hands-on CUDA exercises In each exercise (except for #5), you have to implement the missing portions of the code Finished
10.04.2008. Thomas Fahrig Senior Developer Hypervisor Team. Hypervisor Architecture Terminology Goals Basics Details
 Thomas Fahrig Senior Developer Hypervisor Team Hypervisor Architecture Terminology Goals Basics Details Scheduling Interval External Interrupt Handling Reserves, Weights and Caps Context Switch Waiting
VALAR: A BENCHMARK SUITE TO STUDY THE DYNAMIC BEHAVIOR OF HETEROGENEOUS SYSTEMS
 VALAR: A BENCHMARK SUITE TO STUDY THE DYNAMIC BEHAVIOR OF HETEROGENEOUS SYSTEMS Perhaad Mistry, Yash Ukidave, Dana Schaa, David Kaeli Department of Electrical and Computer Engineering Northeastern University,
Direct GPU/FPGA Communication Via PCI Express
 Direct GPU/FPGA Communication Via PCI Express Ray Bittner, Erik Ruf Microsoft Research Redmond, USA {raybit,erikruf}@microsoft.com Abstract Parallel processing has hit mainstream computing in the form
HIGH PERFORMANCE VIDEO ENCODING WITH NVIDIA GPUS
 April 4-7, 2016 Silicon Valley HIGH PERFORMANCE VIDEO ENCODING WITH NVIDIA GPUS Abhijit Patait Eric Young April 4 th, 2016 NVIDIA GPU Video Technologies Video Hardware Capabilities AGENDA Video Software
Findings in High-Speed OrthoMosaic
 Findings in High-Speed OrthoMosaic David Piekny, Solutions Product Manager PCI Geomatics Committed To Image-Centric Excellence Technical Session 6, Rm. 203D Tuesday May 3 rd, 9:30-11:00 AM ASPRS 2011,
CLOUD GAMING WITH NVIDIA GRID TECHNOLOGIES Franck DIARD, Ph.D., SW Chief Software Architect GDC 2014
 CLOUD GAMING WITH NVIDIA GRID TECHNOLOGIES Franck DIARD, Ph.D., SW Chief Software Architect GDC 2014 Introduction Cloud ification < 2013 2014+ Music, Movies, Books Games GPU Flops GPUs vs. Consoles 10,000
Equalizer. Parallel OpenGL Application Framework. Stefan Eilemann, Eyescale Software GmbH
 Equalizer Parallel OpenGL Application Framework Stefan Eilemann, Eyescale Software GmbH Outline Overview High-Performance Visualization Equalizer Competitive Environment Equalizer Features Scalability
Pedraforca: ARM + GPU prototype
 www.bsc.es Pedraforca: ARM + GPU prototype Filippo Mantovani Workshop on exascale and PRACE prototypes Barcelona, 20 May 2014 Overview Goals: Test the performance, scalability, and energy efficiency of
CUDA Basics. Murphy Stein New York University
 CUDA Basics Murphy Stein New York University Overview Device Architecture CUDA Programming Model Matrix Transpose in CUDA Further Reading What is CUDA? CUDA stands for: Compute Unified Device Architecture
TOOLS AND TIPS FOR MANAGING A GPU CLUSTER. Adam DeConinck HPC Systems Engineer, NVIDIA
 TOOLS AND TIPS FOR MANAGING A GPU CLUSTER Adam DeConinck HPC Systems Engineer, NVIDIA Steps for configuring a GPU cluster Select compute node hardware Configure your compute nodes Set up your cluster for
Accelerating Wavelet-Based Video Coding on Graphics Hardware
 Wladimir J. van der Laan, Andrei C. Jalba, and Jos B.T.M. Roerdink. Accelerating Wavelet-Based Video Coding on Graphics Hardware using CUDA. In Proc. 6th International Symposium on Image and Signal Processing
Introduction to the CUDA Toolkit for Building Applications. Adam DeConinck HPC Systems Engineer, NVIDIA
 Introduction to the CUDA Toolkit for Building Applications Adam DeConinck HPC Systems Engineer, NVIDIA ! What this talk will cover: The CUDA 5 Toolkit as a toolchain for HPC applications, focused on the
ultra fast SOM using CUDA
 ultra fast SOM using CUDA SOM (Self-Organizing Map) is one of the most popular artificial neural network algorithms in the unsupervised learning category. Sijo Mathew Preetha Joy Sibi Rajendra Manoj A
GPU-based Decompression for Medical Imaging Applications
 GPU-based Decompression for Medical Imaging Applications Al Wegener, CTO Samplify Systems 160 Saratoga Ave. Suite 150 Santa Clara, CA 95051 sales@samplify.com (888) LESS-BITS +1 (408) 249-1500 1 Outline