Mapping volcanic terrain using high-resolution and 3D satellite remote sensing
|
|
|
- Dorothy Dalton
- 8 years ago
- Views:
Transcription
1 Geological Society, London, Special Publications Mapping volcanic terrain using high-resolution and 3D satellite remote sensing M. Kervyn, F. Kervyn, R. Goossens, S. K. Rowland and G. G. J. Ernst Geological Society, London, Special Publications 2007; v. 283; p doi: /sp alerting service click here to receive free alerts when new articles cite this article Permission click here to seek permission to re-use all or part of this article request Subscribe click here to subscribe to Geological Society, London, Special Publications or the Lyell Collection Notes Downloaded by on 14 November Geological Society of London

2 Mapping volcanic terrain using high-resolution and 3D satellite remote sensing M. KERVYN 1, F. KERVYN 2, R. GOOSSENS 3, S. K. ROWLAND 4 & G. G. J. ERNST 1 1 Mercator & Ortelius Research Centre for Eruption Dynamics, Department of Geology and Soil Sciences, Ghent University, Krijgslaan 281/S8, B-9000 Gent, Belgium ( Matthieu.KervynDeMeerendre@UGent.be) 2 Cartography & Photo-Interpretation Section, Geology and Mineralogy Department, Royal Museum for Central Africa, Leuvensesteenweg 13, B-3080 Tervuren, Belgium 3 Remote Sensing & Photogrammetry, Department of Geography, Ghent University, Krijgslaan 281/S8, B-9000 Gent, Belgium 4 Department of Geology & Geophysics, University of Hawai i at Mānoa, 1680 East West Road, Honolulu, HI 96822, USA Abstract: Most of the hazardous volcanoes, especially those in developing countries, have not been studied or regularly monitored. Moderate-to-high spatial resolution and 3D satellite remote sensing offers a low-cost route to mapping and assessing hazards at volcanoes worldwide. The capabilities of remote sensing techniques are reviewed and an update of recent developments is provided, with emphasis on low-cost data, including optical (Landsat, ASTER, SPOT, CORONA), topographic (3D ASTER, SRTM) and synthetic aperture radar data. Applications developed here illustrate capabilities of relevant remote sensing data to map hazardous volcanic terrain and derive quantitative data, focusing on mapping and monitoring of volcanic morphology. Limitations of the methods, assessment of errors and planned new sensors are also discussed. The volcanology community has long recognized the advantages of multispectral and synthetic aperture radar (SAR) remote sensing (RS) techniques. The multispectral nature of the data and the repeated coverage of extensive volcanic terrains are major advantages. For over two decades, satellite data have been used to study volcanic activity and map volcanic terrains (e.g. Francis & Baker 1978; Mouginis-Mark et al. 2000; Ramsey & Dean 2004; Ramsey & Flynn 2004). Spaceborne sensors permit observation of volcanoes that are remote or difficult to access for political reasons. Sensors allow information retrieval from ongoing eruptive activity for which field data collection is too hazardous. Satellite data allow study of diverse volcanic phenomena (e.g. Francis et al. 1996), including to: (1) detect hot areas, their temporal and spatial patterns (e.g. Harris et al. 2000); (2) monitor volcanic clouds (e.g. Rose et al. 2000); (3) map recently erupted volcanic (e.g. Patrick et al. 2003; Rowland et al. 2003) or volcano-related deposits (e.g. lahars, debris avalanches; Kerle et al. 2003); (4) discriminate fresh volcanic rock surfaces in terms of mineralogical, textural and compositional differences (e.g. Gaddis 1992; Ramsey & Fink 1999; Byrnes et al. 2004); (5) distinguish weathered volcanic surfaces and assess the terrains relative age (e.g. Kahle et al. 1988), or identify mechanically weak sectors in a volcanic edifice (Crowley & Zimbelman 1997); (6) characterize volcano morphology and study its changes (e.g. Amelung et al. 2000; Rowland & Garbeil 2000; Lu et al. 2003); (7) assess ground deformation using interferometric synthetic aperture radar (InSAR; e.g. Zebker et al. 2000). The potential of high temporal resolution satellite imagery for monitoring volcanic activity and mitigating hazards has been reviewed by Oppenheimer (1998) and Harris et al. (2000). Thanks to increased RS data accessibility and reduced time between data acquisition and availability to users (Ramsey & Flynn 2004), low-tomedium spatial resolution (.1 km to 250 m pixel) satellite data are now routinely used to monitor volcanoes; for example, to detect thermal anomalies (Wright et al. 2004), or to detect and track ash- and gas-rich volcanic clouds (e.g. Rose et al. 2000; Ramsey & Dean 2004). It is not the purpose of this paper to review RS capabilities to monitor From: TEEUW, R. M. (ed.) Mapping Hazardous Terrain using Remote Sensing. Geological Society, London, Special Publications, 283, DOI: /SP /07/$15.00 # The Geological Society 2007.
 2 Cartography & Photo-Interpretation Section, Geology and Mineralogy Department, Royal Museum for Central Africa, Leuvensesteenweg 13, B-3080 Tervuren, Belgium 3 Remote Sensing & Photogrammetry,")
3 6 M. KERVYN ET AL. eruptive events (for that, see Mouginis-Mark et al. 2000), but instead to focus on assessing future hazards by mapping the distribution of existing eruption-related features. Until recently, research focused on monitoring active volcanoes or on studying a posteriori volcanic events and their deposits. Repose periods between eruptions can be decades to thousands of years long. Some of the largest and most devastating historical eruptions occurred at volcanoes that had been considered as dormant or inactive (e.g Mt Pinatubo; Newhall & Punongbayan 1996). The majority of the c. 560 on-land historically active volcanoes are poorly known (Simkin & Siebert 1994). Fewer than a quarter of them have detailed hazards maps, and fewer still are regularly monitored. Many of these potentially hazardous volcanoes are located in developing countries, where local systems struggle to assess and mitigate volcanic hazards. For hazard assessment and risk modelling, there is an obvious need to map and characterize the range of deposit types at poorly known or remote volcanoes, to infer the range of activity that they might exhibit. Prior to geological mapping, one needs a good topographic map, also essential for modelling volcanic processes and risks, such as pyroclastic, lava and mud flows (e.g. Iverson et al. 1998; Stevens et al. 2002; Sheridan et al. 2004). Sources of spatial data, such as aerial photography and good quality topographic maps (e.g. 1: or better), either do not exist or are very difficult to obtain for many volcanically active regions. The goal of this paper is to illustrate how medium-to-high spatial resolution (c. 10 to 100 m pixel) satellite imagery provided by multispectral (e.g. Landsat, ASTER, SPOT, CORONA) and SAR sensors (e.g. ERS-1, ERS-2, SRTM) is helpful both for deriving accurate topographic and geological maps and for assessing volcanic hazards. A key development is that the availability of medium-resolution (c. 30 m pixel) satellite images over the Internet has increased dramatically, together with a rapid decrease in cost (Table 1). Satellite RS techniques (InSAR, digital stereophotogrammetry) now provide some of the best digital topographic datasets. These improvements will help the systematic assessment of geohazards at poorly studied volcanoes. However, there is a need to assess the accuracy of the quantitative data retrieved from satellite imagery. In this paper, we assess the capabilities of satellite data to map and quantitatively study the structure, morphology and texture of volcanic terrains at different scales, to gain insights into processes and assess hazards. We review previous studies, provide an update on advances and present new case studies to illustrate satellite data use for mapping volcanoes. We review the ability of multispectral and SAR sensors to map volcanic deposits, as well as InSAR s capability to generate digital elevation data, aiding morphological studies. A first case study illustrates the potential of ASTER and CORONA data to provide high-resolution and up-to-date topographic maps. The approach, illustrated for a non-volcanic region of Morocco, can be readily applied to volcanic regions. The second case study (Mauna Kea, Hawai i) illustrates use of multispectral imagery and SRTM DEM data to map small-scale volcanic features. The goal is to examine the advantages and limitations of RS data types available for developing countries, using a volcanic test area where data cross-validation allows accuracy assessments. With the third case study, we then explore to what extent the RS data can be used for the rapid mapping of geohazards and terrain types, including the monitoring of ground deformation, at the Rungwe Volcanic Province (RVP), SW Tanzania. Finally, we highlight some future perspectives for systematic risk assessment at volcanoes, especially in less developed countries, through integrated RS studies and through the increased capabilities that planned new sensors will provide. Multispectral and digital elevation model data An ever-increasing number of spaceborne sensors continue to provide a wealth of high-quality multispectral data. This study focuses on the moderate-to-high spatial resolution (c. 10 to 100 m pixel) sensors needed to study volcanoes and that are easily accessible at low cost (Table 1). Very high spatial resolution (c. 1 m pixel) data provided by commercial sensors (e.g. Ikonos, Quickbird) are not yet a low-cost alternative to assess volcanic hazards (Table 1), even though such sensors prove helpful to produce up-to-date orthomaps for some active volcanoes (e.g. Nisyros caldera, Greece; Vassilopoulou et al. 2002). Airborne RS, although very useful, is not discussed here because it is comparatively expensive, with coverage restricted to relatively few volcanoes. Multispectral images are a record of reflected or emitted electromagnetic energy. The data range from visible (VIS), near-infrared (NIR), and midinfrared (MIR) wavelengths (solar energy reflected by the surface) to thermal-infrared (TIR; solar energy absorbed and then re-emitted by the surface). Multispectral data are considered here from Landsat, SPOT, ASTER and CORONA sensors (properties summarized in Table 1). Digital Elevation Model s (DEM) of volcanic terrains
.")
4 Table 1. Characteristics and sources of RS data discussed in the text Sensor Number of bands and spatial resolution Scene size Cost Data distributor Distributor website Medium- to high-resolution optical sensors Landsat ETMþ ASTER SPOT 5 PAN: 1 band 15 m VNIR þ SWIR: 6 bands 30 m TIR: 1 band 60 m VNIR: 3 bands 15 m SWIR: 6 bands 30 m TIR: 5 bands 90 m PAN: 1 band 5 m VNIR: 3 bands 10 m SWIR: 1 band 20 m km 2 Free Global Land Cover Facility, University of Maryland km 2 Free Land Processes Distributed Active Archive Center (LPDAAC) US$ 55 Free km 2 E * E NASA Earth Observing System Data Gateway Global Land Cover Facility, University of Maryland Spotimage shtml datapool.asp ~imswww/pub/imswelcome/ shtml CORONA PAN: 2 30 ft (c m) c km 2 (KH 1 4) US$ USGS Earth Explorer EarthExplorer/ Very high-resolution optical sensors IKONOS PAN: 1 band 1 m.49 km 2 US$ 7 56 km 22 Space Imaging VNIR: 4 bands 4 m 11 km swath width Quickbird PAN: 1 band 0.6 m.25 km 2 E18 42 km 22 DigitalGlobe VNIR: 4 bands 2.4 m 16.5 km swath width Synthetic aperture radar ERS-1 &-2 C-band 25 m km 2 E Eurimage RADARSAT C-band 30 m km 2 US$ Radarsat International JERS SAR L-band 18 m km 2 E950 Eurimage Digital elevation models SRTM C-band: 30 m 18 lat long Free; US only Seamless Data Distribution C-band System C-band: 90 m 18 lat long Free Seamless Data Distribution System SRTM X-band: 25 m lat long E400 EOWEB, German Aerospace X-band Agency SPOT HRS PAN: 10 m.3000 km 2 ; 120 km swath width E2.3 km 22 Spotimage *Only for European scientific users. Range of price is indicative, varying with processing level, data type (archived or newly acquired data), and delivery time. Data distributors are given as examples of where those data can be acquired. MAPPING VOLCANIC TERRAIN 7

5 8 M. KERVYN ET AL. can be obtained by: (i) digital photogrammetry based on stereoscopic pair of aircraft of satellite images; (ii) digitalization and interpolation of topographic maps; (iii) radar interferometry; (iv) laser scanning or (v) field survey. Advantages and limitations of the different DEM-generation techniques have been received by Baldi et al. (2002) and Stevens et al. (e.g. 2002, 2004). Landsat The Enhanced Thematic Mapper þ (ETM þ ) instrument onboard the Landsat 7 satellite acquires data in six bands at VIS to MIR wavelengths at 30 m spatial resolution. It also provides a panchromatic band (i.e. black and white) spanning the visible spectrum at 15 m spatial resolution, and two TIR bands (at the same wavelength but with different gain settings) at 60 m spatial resolution (Williams 2003). An ETM þ scene ( km 2 ) covers a much larger area than that of an airphoto; it does not suffer from radial distortion (after systematic data pre-processing), and it is cheaper than airphoto coverage for the same area. The ETM þ image discussed here was downloaded, for free, from the Global Land Cover Facilities website (GLCF 2005; Table 1). Similar archive images are now freely available for most regions. The Landsat generation of satellites has acquired data since 1972, resulting in a large volume of available archived data. On request, a new image can be acquired, over any given region, every 16 days. However, the cost of on-request data remains high (up to E600; Eurimage website 2005). Regions for which no specific data acquisition requests have been made might not be covered by cloud-free data for several years. Data acquired by the Thematic Mapper (TM) and ETM þ instruments onboard the Landsat 5 and 7 satellites, respectively, have been used to monitor volcanic activity as these were the first sensors to provide sufficiently fine spatial resolution to map the extent, and characterize the spatial evolution, of hot volcanic areas (e.g. lava flows or domes; e.g. Harris et al. 2004). The fine spatial resolution of TM data was also exploited to identify potentially active volcanoes in the Andes (Francis & De Silva 1989) based on crater morphology, lava flow texture and evidence of post-glacial eruptive activity. TM s spectral capability also proved useful for identifying and mapping the distribution of distinct lithologies within volcanic debris avalanches (e.g. Francis & Wells 1988; Wadge et al. 1995), and for identifying basaltic scoria cones with specific iron oxidation features in dry environments (e.g. Chagarlamudi & Moufti 1991). Landsat data are now often used in morphological studies of volcanoes or a posteriori descriptions of a volcanic event because they easily provide a synoptic view of a volcano across multiple wavelengths (e.g. Patrick et al. 2003). On the other hand, the temporal resolution (16 days at best), time lag between image acquisition and availability to users (1 14 days), and high cost of on-request data over specific targets prevent true real-time monitoring of eruptive activity with Landsat. The small number of spectral bands, as well as their broad width in the shortwave IR (SWIR) and TIR also limit capabilities to discriminate volcanic lithologies. ASTER The Advanced Spaceborne Thermal Emission and Reflection Radiometer (ASTER) is a medium-to-high spatial resolution, multispectral imaging system flying aboard TERRA, a satellite launched in December Volcano hazards monitoring, geology and soil mapping are specific applications for which ASTER was developed (e.g. Pieri & Abrams 2004). An ASTER scene, covering 61.5 km 63 km, contains data from 14 spectral bands ranging from the VIS and NIR (VNIR; three bands at 15 m resolution), SWIR (six bands at 30 m resolution), to TIR (five bands at 90 m resolution; Abrams & Hook 2003). A key advantage for volcanic hazard assessment is that ASTER acquires stereoscopic images at 15 m spatial resolution for deriving digital elevation models (DEMs). Specifically, in the VNIR, one nadir-looking (band 3 N) and one backwardlooking telescope (band 3B, off-nadir with an effective viewing angle at the Earth s surface of 308) provide the stereo-pair images (Hirano et al. 2003). The advantage of this along-track mode of stereo-image acquisition is that the stereo-images are acquired only a few minutes apart, under uniform environmental and lighting conditions, whereas scenes from across-track data acquisition (e.g. SPOT) are several days apart (Hirano et al. 2003; Stevens et al. 2004). DEM accuracy depends on the availability, spatial distribution and accuracy of high-quality ground control points (GCPs) and on the contrast within the image (see Mauna Kea test case). Hirano et al. (2003) suggested that the root mean square error (RMSE) in ASTER DEM elevations ranges from +7 m to +15 m, depending on GCPs and image quality. Processed ASTER DEMs can be acquired at the same cost as an ASTER scene (Land Processes Distributed Active Archive Center website (LPDAAC 2005); Table 1). The routine procedure utilizes the ephemeris and attitude data derived from both the ASTER instrument and the TERRA spacecraft platform to compute a relative DEM. Absolute DEMs are based on GCPs specified by the user. ASTER DEMs are derived at 30 m resolution, in an attempt to minimize errors in the
 instrument onboard the Landsat 7 satellite acquires data in six bands at VIS to MIR wavelengths at 30 m spatial resolution.")
6 MAPPING VOLCANIC TERRAIN 9 matching process. The RMSE of the relative DEM in x, y and z is expected to range between 10 m and 30 m. An RMSE of 7 50 m is expected for absolute DEMs if at least four GCPs are provided (LPDAAC 2005). The capability of retrieving accurate relative DEMs without having to collect GCPs in the field is of great interest, especially for remote volcanoes. The exact accuracy of these DEMs still needs to be assessed, especially for high-relief terrains such as volcanoes. The easy availability, low cost and unique combination of multispectral and 3D capabilities at 15 m resolution are the main advantages of ASTER for volcano studies. Although Stevens et al. (2004) demonstrated that 3D ASTER allows for accurate topographic mapping of volcanoes and highlighted the potential for volcano terrain deformation analysis by repeat DEM generation combined with spectral change analyses, the full capability of these data has not yet been fully explored. Ramsey & Fink (1999) highlighted capabilities of ASTER multispectral data in the TIR for estimating surface vesicularity contrast in volcanic rocks. ASTER multispectral data were used by Byrnes et al. (2004) to discriminate between different lava flow morphologies based on the spectral reflectance in the VNIR, and on the emissivity in the TIR. The main limitation of ASTER data, as with other optical RS data, for regular monitoring is their sensitivity to cloud cover, a frequent problem with high-relief subtropical volcanoes. SPOT The SPOT satellites (Satellites Pour l Observation de la Terre) combine high-resolution multispectral bands with stereoscopic capabilities. SPOT acquires data in three bands in the VNIR at 20 m spatial resolution (10 m for the most recent satellite, SPOT 5), and one panchromatic band at 10 m spatial resolution (5 or 2.5 m for SPOT 5). SPOT 4 and 5 also provide one SWIR band (20 m resolution). Despite having fewer spectral bands than Landsat or ASTER, SPOT has the advantages of higher spatial resolutions and variable viewing angles. This increases the potential temporal resolution and the chances of acquiring cloud-free images. With three SPOT satellites currently operational, it is possible to observe almost the entire planet in a single day. SPOT can acquire stereo-images pairs, but in cross-track rather than along-track orientation (compared with ASTER). The two stereoscopic scenes can be acquired in tandem mode on the same day by using two of the three satellites. However, the stereo-pair images are not acquired under identical illumination or atmospheric conditions. This can affect the accuracy of the resulting DEM (e.g. vertical accuracy between +5 and +20 m; Hirano et al. 2003). SPOT 5, launched in May 2002, carries the High Resolution Stereoscopic (HRS) instrument, which can acquire simultaneous stereo images with 10 m spatial resolution. The simultaneity of acquisition for the stereo-pair images increases the quality of the derived DEMs (Kormus et al. 2004). A current problem is that the two images used to produce the DEM are not made available to users. Only the processed DEMs can be acquired. The cost of these DEMs has so far limited their applicability (Table 1). Even though SPOT satellites have been acquiring data since 1986, applications for volcanic studies have been less frequent than those using Landsat data. The lower number of spectral bands and higher cost (e.g. a minimum of E100 per scene for European scientists, and much higher price for non-europeans) in comparison with Landsat are the main factors limiting its current applicability. SPOT images were used to map lava flows and monitor eruptive activity at Sabancaya volcano (Chile; e.g. Legeley-Padovani et al. 1997), to map and assess structure and morphology of lahar deposits (see Kerle et al. 2003, for a review) and to map volcanic vents and lava flows, in combination with other RS and field data, at Galápagos volcanoes (e.g. Rowland 1996; Rowland et al. 2003). At Galápagos volcanoes, panchromatic and multispectral SPOT images allow identification of flow boundaries based on contrast in surface albedo and on surface colour change associated with flow ageing. All volcanic cones higher than a few metres were also readily identified (Fig. 1a; Rowland 1996). Declassified satellite images The CORONA programme was conceived by the US Air Force and Central Intelligence Agency, to take pictures from space of the Soviet Bloc countries and other parts of the world. In 1995, a first set of images, acquired by the CORONA and ARGON systems, was declassified and made available to the public at low cost via the US Geological Survey (USGS Earth Explorer website 2005; Table 1). Between 1960 and 1972, in the operational phase, panchromatic images were recorded by a panoramic camera at flight height of c. 150 km. Depending on the sensor used, the best ground resolution varied from c. 7.3 m to 1.8 m. Satellites used on CORONA missions (sensors KH-1 to KH-4B) carried two cameras, which recorded stereo images of the Earth s surface (McDonald 1995). The principal coverage areas are Asia, Eastern Europe and Northern Africa. The filmstrips suffer from typical panoramic distortion. Time-consuming processing allows derivation

7 10 M. KERVYN ET AL.

8 MAPPING VOLCANIC TERRAIN 11 of a DEM and ortho-image from the original image (see Altaimer & Christoph 2002). A second dataset from systems GAMBIT (KH-7 surveillance system; ) and HEXAGON (KH-9 mapping system; ) was declassified in The KH-7 system does not offer stereocapabilities but acquired very high resolution data ( m pixel) for many specific regions including volcanic terrains of Kamchatka and Indonesia. KH-9 acquired panchromatic images over much more extensive areas with a spatial resolution of m. When acquired in stereo-mode, successively acquired images overlap by 60%, allowing DEM derivation with standard photogrammetry techniques. In contrast to CORONA, HEXAGON images do not suffer from panoramic distortions. Because of their recent release, the capabilities of the HEXAGON data for DEM generation remain to be assessed. Although cloud cover is a limitation, a rapid search for declassified images returned potentially useful imagery for tens of active or dormant volcanoes in subtropical LDCs especially from KH4 (A and B) and KH-9 missions (USGS Earth Explorer website 2005). The declassified satellite images provide a wealth of panchromatic, very high resolution data for many regions, including some lacking airphoto coverage. These images may offer a low-cost route to highresolution DEM generation; for example, this option is about 3000 times cheaper than that using IKONOS data (,1 cent km 22 for CORONA v. c. $25km 22 for IKONOS; Altaimer & Christoph 2002). As with airphotos, CORONA data require intensive processing to correct for geometric distortions. Good quality GCPs are needed to obtain absolute elevations. Images acquired several decades ago might be of interest for assessing a volcano s morphology prior to its most recent eruptions or for studying its morphological changes. Satellite radar systems Synthetic aperture radar (SAR) Radar sensors provide terrain information by recording the amplitude and phase of the backscattered signal. Amplitude and phase are influenced by radar system parameters (wavelength, incidence angle, polarization) and by terrain properties such as surface roughness on the scale of the radar wavelength, ground slopes, and dielectrical properties of the surface (e.g. McKay & Mouginis-Mark 1997). Different radar wavelength can be used: X-band (2.8 cm), C-band (5.6 cm; ERS, ENVISAT, RADARSAT sensors) and L-band (23.5 cm; JERS sensor). The SAR sensors (ERS-1 until 2000, ERS-2, JERS until 1998, ENVISAT, RADARSAT) differ in wavelength, looking angle and other acquisition parameters. Radar penetrates clouds, a major advantage for the study of volcanic regions, especially in the subtropics. SAR sensors are active : they record their own backscattered signal, are not dependent on sun illumination, and so can work day and night; they combine ascending and descending orbit data (i.e. halving the return period from 35 days to 17.5 days in the case of ERS and ENVISAT). Radar image use for mapping is limited by the geometric distortion and shadowing effect caused by oblique viewing and topography. Backscatter intensity has been used to map distinct pahoehoe and aa lava flow surfaces (Gaddis 1992; see below), and surface textures of lava flows generally (Byrnes et al. 2004). Different polarizations were also used for mapping lava flows (McKay & Mouginis-Mark 1997). When combined with cross-validation field data, this provides insights into lava flow emplacement and constraints for lava flow modelling. Radar was also used on remote volcanoes to map new lava, debris or pyroclastic flows (Rowland et al. 1994; Carn 1999). Figures 1b and 2 illustrate the great capabilities of SAR datasets for volcano mapping. An SIR-C radar image of Volcán Fernandina shows how backscatter intensity varies with contrasted lava flow texture. Pahoehoe flows, which have a smooth texture relative to the radar wavelength (c. 6 cm), returns a low backscatter intensity. The rougher texture of aa flows produces higher backscatter and appears much brighter. This roughness contrast is not observed on the SPOT image (Fig. 1a). SPOT and SAR data served as complementary datasets to map and characterize lava flows (e.g. Fig. 1; Rowland 1996). An ERS-1 scene acquired on Aniakchak volcano in 1992 illustrates the advantages of using SAR for assessing eruptive activity at remote volcanoes that have chronic cloud coverage limiting the applicability of optical RS (e.g. Fig. 2; Rowland et al. 1994). Fig. 1. (a) Panchromatic SPOT image of Fernandina Island, Galápagos, collected in 1988 (10 m resolution). Representative aa (A) and pahoehoe (P) flows are indicated. It should be noted that albedos of aa and pahoehoe flows are similar, making these surfaces difficult to discriminate even on high-resolution satellite images such as this one. (b) Shuttle Imaging Radar-C (SIR-C) image of Fernandina Island, Galápagos, collected in The smooth texture of pahoehoe lava flows (P) produces a low backscatter intensity (dark pixels). Aa (A) flows have a rougher surface, with a roughness scale of same order as the radar wavelength (bright pixels). The caldera structure, intra-caldera and flank cones are visible (see Rowland 1996, for more details).

9 12 M. KERVYN ET AL. Fig. 2. European Remote-Sensing Satellite-1 (ERS-1) image of Aniakchak volcano, Alaska, collected in The nearly circular caldera formed c years ago, and truncated a volcanic cone that had been glacially eroded. Post-glacial and pre-caldera(?) volcanic deposits have presumably buried glacial valleys on the north and west flanks. Vent Mountain (V) is the tallest of c. 10 intra-caldera vents. It should be noted that topographic features all appear to be steeper on their SE-facing sides. This is the effect of radar foreshortening, whereby summits and ridges are displaced toward the radar, which in this case was looking from SE to NW. (See Rowland et al. (1994) for additional discussion of this image.) Careful analysis of backscatter intensity allows for recognition of post-glacial emplacement of lowmobility pyroclastic flow on the north and west flanks of the volcano. The break in slope that marks the outer limit of the flow deposit, about 10 km from the caldera rim, is highlighted by the low incidence angle of the radar beam (238). SAR interferometry and SRTM InSAR has emerged as a powerful technique to derive high-resolution DEMs and study ground deformation. InSAR involves comparing the phase of the backscatter signal for each corresponding pixel of two radar images acquired from different positions (Zebker et al. 2000), either at the same time by two antennas separated by a fixed baseline (e.g. SRTM or airborne), or during successive passes of a single antenna (e.g. ERS, JERS, RADARSAT, ENVISAT). InSAR gives exceptional results, although it has limitations. Preservation of the phase coherence (i.e. the level of correlation between the images of an interferometric couple) is the most limiting factor. Coherence is controlled by the system geometry (Zebker & Villasenor 1992) and by changes in surface conditions at the scale of the radar wavelength (c cm) during the time interval separating

10 MAPPING VOLCANIC TERRAIN 13 acquisition of the two images. Dense vegetation causes rapid coherence loss for data acquired in C-band (Kervyn 2001) but not L-band (Stevens & Wadge 2004). Decorrelation (i.e. loss of coherence) can also be used positively to map new lava flow areas in regions with an overall good coherence conservation (Lu et al. 2003). As far as the surface stability is concerned, the shorter the period between the two acquisitions, the higher the coherence will be. This is the main motivation for single-pass interferometry, such as in the recent SRTM mission (Rabus et al. 2003). On the other hand, a repeat-pass configuration offers more flexibility, particularly regarding the geometry of the acquired data. Depending on the application, one can look for a pair of images offering the optimum geometric baseline (i.e. spatial distance between the two points in space from which the two images were obtained, projected perpendicularly to the line of sight), incidence angle, orbit mode and revisiting rate. If the goal is to derive topography, a long geometric baseline is preferable; the phase difference will be associated with a smaller difference in elevation (e.g. Zebker et al. 1994). A shorter geometric baseline is more suitable for ground deformation studies. In this case, a phase difference is also produced by the displacement of the surface; deformation studies require that the topographic phase is filtered out. Although radar can penetrate clouds, a phase delay can still occur that must be taken into account for data interpretation. Differential interferometry (DifSAR) has to discriminate between the various phase difference origins, such as geomorphology, atmospheric conditions and ground deformation (Massonnet & Feigl 1995). InSAR monitoring The contribution of InSAR to monitor volcanic activity is particularly important in areas where cloud coverage is common and where deformations are recorded (e.g Zebker et al. 2000; Stevens & Wadge 2004). However, monitoring is inherently time-related and coherence loss can prevent the use of conventional DifSAR in the long term or for areas with dense vegetation. Recent developments make use of the persistent scatterers (PS) technique. Isolated targets in a highly decorrelated pair may still preserve phase coherence and be used to retrieve ground deformation, provided the PS density is high enough (Ferretti et al. 2001). The PS method, which requires a large number of scenes (.15, ideally.30), has proved highly successful and accurate in urban areas where hundreds PS km 22 can be identified (Ferretti et al. 2004). Hooper et al. (2004) proposed an adaptation of the method for natural areas devoid of such urbantype permanent scatterers. Airborne InSAR (e.g. AirSAR; AirSAR Jet Propulsion Laboratory website 2005) has been used to produce repeated high-resolution DEMs over volcanic terrains, to study volcano morphology, assess morphological changes or to constrain the volume of newly erupted material (Rowland et al. 1999, 2003; Lu et al. 2003). So far, these applications have, however, been limited to volcanoes in Hawai i, Alaska, the Aleutians and New Zealand (Stevens et al. 2002). SRTM and InSAR topography The Shuttle Radar Topography Mission (SRTM) flew on the Space Shuttle Endeavour in February Using two radar antennas separated by a 60 m long mast, it collected single-pass DEM data over nearly 80% of Earth s land surfaces (i.e. between 608N and 568S), using both a C- and X-band radar. The 11 day mission generated the most complete high-resolution digital topographic database for Earth. For the USA, the processed C-band DEM data have been released at 30 m spatial resolution (1 arc second). For the rest of the world, SRTM C-band DEMs are available only at 90 m spatial resolution (3 arc second). The nominal absolute horizontal and vertical accuracies are +20 m and +16 m, respectively (SRTM mission, JPL website 2005), although within a single scene the relative accuracies are considerably higher (Rabus et al. 2003). Table 2 shows the proportion of historically active and Holocene volcanoes for which SRTM DEMs at 30 or 90 m resolution are now available. Table 2. Illustration of how different fractional areas of the Earth with historically active and Holocene volcanoes are best covered by near-global digital elevation models Historical Holocene Total SRTM 30 m (%) SRTM 90 m (%) GTOPO30 1 km (%) No data (%) Number of volcanoes C-band SRTM 30 m data are available for the USA (including Hawaii and Alaska). SRTM 90 m data are available for all land surfaces between 608N and 568S. The 1 km resolution GTOPO data are available for all land surfaces (Global Topographic Data). No data: submarine and subglacial volcanoes for which there is no global coverage data at high resolution. Data on volcano location and activity are from Simkin & Siebert (1994; updated list available from Global Volcanism Program Smithsonian Institution 2005).
.")
11 14 M. KERVYN ET AL. The potential of gaining understanding about how volcanoes work, hazards or what controls volcano morphology and growth with SRTM data is tremendous. What controls the diversity, variability and complexity of volcano morphology has not been studied systematically. The only textbook on the subject dates from the 1940s (Cotton 1944). A considerable amount of novel work is now expected, exploring what can be learned from the shape, size and vent distributions of volcanoes. Because of their shorter wavelength, the X-band DEMs have a higher relative height accuracy (i.e. within a scene) by almost a factor of two. The X-band dataset has been processed and is available at a 25 m spatial resolution. The X-band DEMs do not cover the entire globe (i.e. c. 25% of C-band SRTM data coverage is not covered by the X-band SRTM; the areas not covered are evenly distributed worldwide). Another limitation is the E400 per scene cost of the X-band DEMs (X-SAR SRTM website 2005). Mapping topography with ASTER Topographic maps at 1: scale or larger are not available for many regions, especially in developing countries. In the framework of a large mapping project of the Drâa valley (Morocco; Drey et al. 2004), Goossens et al. (2003) took advantage of the high-resolution and 3D capability of ASTER and CORONA data to derive a topographic map for a region where the best available maps were at 1: scale. This case study, albeit in a non-volcanic terrain, is summarized here to illustrate the capabilities of the method. Using a limited number of high-quality GCPs (10 and 7, respectively, for the two scenes used) collected with a differential GPS (TRIMBLE Pathfinder Pro XRS), ortho-photomaps were produced for two areas based on two ASTER scenes. The RMSE on the GCPs in the x, y directions was c. 1 pixel (c. 15 m), whereas the vertical RMSE was 5 m and 10 m, respectively, for the two scenes. The field campaign illustrated that highquality GCPs that can be accurately located on the satellite image are difficult to find in regions with little human infrastructure and a monotonous landscape (e.g. most volcano landscapes). Comparison between the new DEM and existing topographic map shows that the ASTER-derived contour lines closely match available information on the 1: topographic map. More detailed contour lines with a smaller elevation interval were generated (20 m instead of 50 m intervals; Fig. 3a and b). The ortho-photomap (Fig. 3a and b) has a 15 m resolution and provides more information than the existing map. ASTER has the advantage that, with a limited number of GCPs, a DEM covering a zone of km 2 can be readily generated. Figure 3c and d illustrates the orthomap with contours obtained by processing a pair of CORONA stereo-images for the same region at a spatial resolution of 4 m. Based on 15 GCPs collected with a Leica 300 Differential global positioning system (accuracy of 5 cm) the resulting topographic map has a 1: scale. The DEM vertical accuracy is c. 20 m (Schmidt et al. 2002). These products are of much higher resolution than the 1: scale topographic maps that were the only ones available in this area. These two methods are thus especially suitable for mapping purposes in areas where no accurate topographic maps exist. This is the case for many volcanic regions. Collection of high-quality GCPs with a homogeneous spatial distribution on the satellite image is a key factor for the systematic production of orthophotomaps over hazardous volcanic terrains. Case study: Mauna Kea, Hawai i To assess and compare capabilities of the abovementioned RS data types, data were collected for Mauna Kea volcano, Hawai i. The goal was to compare information retrieved from satellite datasets with analyses of airphotos and topographic maps. We focus on the fine-scale capabilities of the different datasets to provide quantitative morphological data on the scoria cones on Mauna Kea s flanks. Pyroclastic constructs are the most common on-land volcanic landforms on Earth (Riedel et al. 2003). They range in size from spatter mounds only a few tens of metres wide, formed by lowenergy eruption, to scoria cones several kilometres in diameter and hundreds of metres high. Conebuilding eruptions (Riedel et al. 2003) are explosive, can be associated with high-rising ash clouds and widely dispersed ash, and pose a threat where cities are built on cone fields (e.g. Mexico City). Recent cone-building eruptions led to evacuations of settlements, building collapses (e.g. Heimaey, Iceland, 1973), or airport closures (e.g. Catania, July 2001 Etna eruption). The morphology of small-scale pyroclastic constructs can be described by average values of crater width W cr and construct height H co relative to basal cone diameter W co. Previous studies, based on a limited number of cone fields, found typical W cr / W co ratios of 0.40 and H co /W co ratios of 0.18 for pristine cones. However, published datasets (e.g. Wood 1980a) and preliminary results of the present study suggest a wide variability in these ratios. Riedel et al. (2003) gained insights into cone-forming eruptions and hazards by developing
 by almost a factor of two.")
12 MAPPING VOLCANIC TERRAIN 15 Fig. 3. (a) Topographic ortho-photomap derived from subset of ASTER scene of the Drâa valley (Morocco). (b) Subset of 1: topographic map for same region (adapted from Goossens et al. 2003). (c) Topographic ortho-photomap derived from CORONA data of the Drâa valley (Morocco). (d) Subset of 1: topographic map for same region (adapted from Schmidt et al. 2002). a capability of inverting volcanic construct shape and size data to derive key eruption parameters. Some previous studies focused on identifying pyroclastic constructs from airphotos or satellite imagery to document volcanic vent spatial distribution and assess tectonic controls (e.g. Chagarlamudi & Moufti 1991; Connor & Conway 2000). Davis et al. (1987) used the specific spectra of iron-oxidized scoria to discriminate basaltic pyroclastics from lava flows. All the abovementioned studies concluded that RS data, usually Landsat imagery, allow to identify 60 80% of the pyroclastic constructs within a cone field. Rowland (1996) identified most of the pyroclastic cones on Volcán Fernandina (Galapagos Island) by combining a TOPSAR-derived DEM and a panchromatic SPOT image. The latter analysis failed to identify only very small arcuate vent constructs (1 3 m high). Mauna Kea lies in the northern half of the Big Island of Hawai i (Fig. 4). Activity in the last 130 ka or so has been marked by numerous small gas-rich eruptions that formed c. 300 scoria cones (Porter 1972). Mauna Kea most recently erupted c years ago (Wolfe et al. 1997). It was chosen as a study site because of the high density of pyroclastic constructs, the morphologies of which had already been partially documented by
.")
13 16 M. KERVYN ET AL.
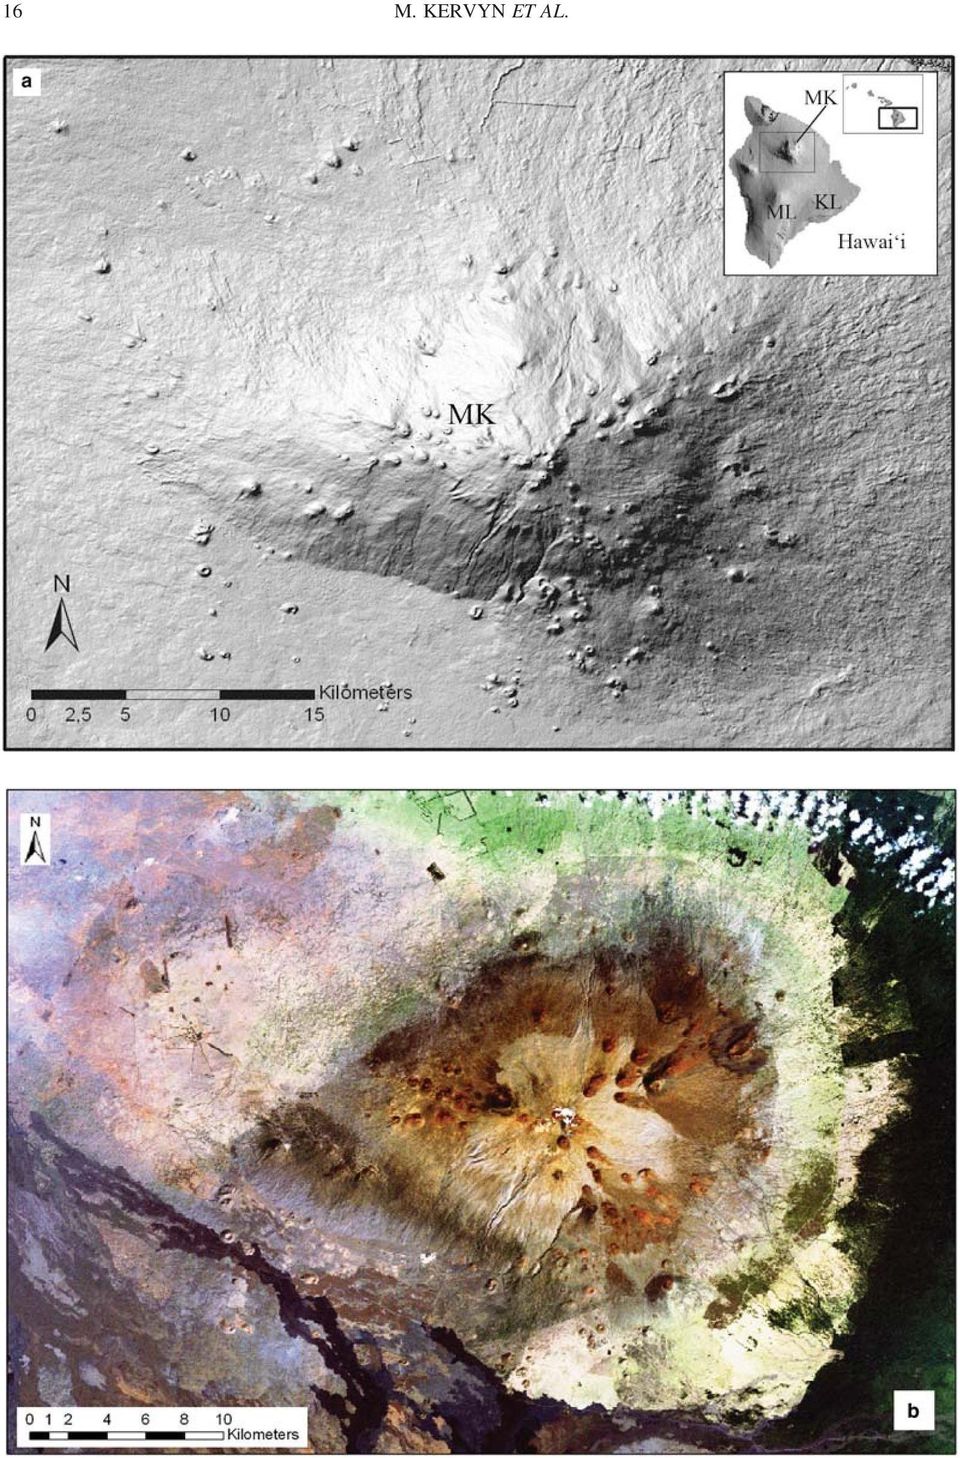
14 MAPPING VOLCANIC TERRAIN 17 Porter (1972). The cones have a wide size range (W co from c. 15 to 1450 m) and small average size (median diameter 450 m) compared with other cone fields (Wood 1980a), which makes them ideal to evaluate the limitations arising from the spatial resolution of the diverse RS data sources. Traditional sources of spatial data (aerial photographs, topographic and geological maps) were available to compare with our observations and to cross-evaluate RS quantitative measurements. The Mauna Kea cone field, extending from 750 to 4208 m above sea level (a.s.l)., a c m elevation range, spans a wide range of climatic conditions and vegetation zones. The contrast in conditions and construct ages (from 150 ka to 4 ka) allows us to assess the general applicability of the approach to volcanic fields and the limitations of several recently developed RS mapping methods. Data sources and visual interpretation A Landsat ETM þ image, processed to level L1G (radiometric and systematic geometric corrections applied; Williams 2003) was freely downloaded from the Global Land Cover Facilities website (2005; Table 1). The data were acquired by the satellite on 5 February 2000, and cover the NW part of the Big Island of Hawai i (Fig. 4b). An ASTER-level 1B image (i.e. registered radiance at sensor with automatic radiometric and geometric correction applied, similar to Landsat L1G; Abrams & Hook 2003) acquired on 5 December 2000 was freely downloaded from the Land Processes Distributed Active Archive Center website (LPDAAC 2005; Table 1). Clouds in the ASTER scene required that we exclude c. 50 cones of the c. 300 Mauna Kea cones (i.e. to have a cloud-free sub-scene for digital photogrammetry processing). SWIR bands of the ASTER scene contained significant linear noise. This is the commonly observed ASTER SWIR crosstalk problem (see ASTERGDS website 2005). C-band SRTM DEMs at both 30 m and 90 m resolution were freely downloaded from the Seamless Data Distribution System (2005, Table 1). The 90 m resolution is used here to exemplify what is achievable for volcanic regions outside the USA. The ASTER scene (bands 3 N and 3B) was processed using Virtuozo digital photogrammetry software, producing a DEM with 11 GCPs extracted from 1: scale topographic maps. The processing provided georeferenced and orthorectified images in the three VNIR bands. Several DEMs were produced by varying the DEM spatial resolution and the level of details in the matching process. The user needed to specify the spatial interval (i.e. number of pixels) between two pixels that are automatically matched by the software. Elevations were estimated only for matched pixels and extrapolated in the specified interval. Setting a finer-matching resolution results in more matching errors. In contrast, setting a coarser-matching resolution produces a smoother DEM. The vertical RMSE of the 11 GCPs was c. 4m, whereas the horizontal RMSE for these points was c. 20 m. The few points for which exact elevations were provided on the topographic maps typically corresponded to points (e.g. summit of cones) that could not be exactly located on RS images (error of 1 pixel unavoidable). A trade-off had to be found between the high resolution needed in the matching process to render small topographic features (e.g. scoria cone craters) and the increasing editing work needed to correct for matching errors. The ASTER DEM generation procedure takes a few hours, but several days can be spent on fine matching editing (i.e. manually matching pixels for areas where the automated process generated errors). Here, matching at too fine a level generated troughs or peaks (i.e. a cluster of pixels with abnormally low or high elevations compared with their surroundings) in regions with low contrast. Optimal results were obtained for a matching interval of 3 pixels (45 m) and 30 m spatial resolution. No manual editing of the matching process was undertaken. To reduce errors for regions where the resulting DEM computed slope angles above 458 (i.e. the upper limit expected on Mauna Kea), the pixel elevation was replaced by that from a DEM processed with a matching interval of 7 pixels. The accuracy of the SRTM and ASTER DEMs was evaluated using a 10 m resolution DEM interpolated from digitized contour lines of the topographic maps. The preliminary comparison of the ASTER and SRTM DEMs led to slope aspectcontrolled errors, later attributed to errors with georeferencing of the SRTM DEM. This systematic error was only identified and corrected thanks to the DEM derived from the topographic map. Subtracting the topographic map-derived DEM from the ASTER one, we obtained a mean absolute Fig. 4. (a) Shaded relief of Mauna Kea cone field derived from the 30 m resolution SRTM DEM (sun azimuth 3158; sun elevation 808; elevation exaggerated by factor of three). Inset shows the Big Island of Hawai i and locations of Mauna Kea (MK), Mauna Loa (ML) and Kilauea (KL). (b) True colour composite of the Mauna Kea cone field from the Landsat ETMþ image (R: band 3, mm; G: band 2, mm; B: band 1, mm). White patches on the upper right are clouds, and a small snow patch covers the summit cones. Lava flows to the SW are recent Mauna Loa flows. The arcuate fault-like volcano-scale feature extending from SSW to NNE and passing through MK summit should be noted.
 were available to compare with our observations and to cross-evaluate RS quantitative measurements.")
15 18 M. KERVYN ET AL. Table 3. Results of the error analysis of the ASTER and SRTM DEMs (30 m resolution) compared with the DEM derived from topographic map for Mauna Kea volcano DEMs ASTER; 11 GCPs ASTER; 13 GCPs SRTM 30 Mean absolute difference (m) Vertical RMSE (m) The mean absolute difference is obtained by subtracting DEMs. The vertical RMSE is assessed using a large number of randomly selected points. Original ASTER DEM processing was performed using 11 GCPs. The addition of two GCPs improved the accuracy of the DEM. difference of 11 m (90% of the errors ranging between 218 and þ29 m). Based on 218 control points selected randomly within the study area and taking the topographic map DEM as a reference, we obtained a vertical RMSE of 13 m. This error is in agreement with results from previous studies (Hirano et al. 2003). Errors are attributed to the large altitude range, low spectral contrast in band 3 (near-ir) for the Mauna Kea summit region, and especially to a lack of precise GCPs there. It should be noted that a mean absolute difference of 17 m and an RMSE of 21 m were obtained in a first attempt. Large errors were located in the northern part of Mauna Kea. Significantly, the accuracy of the overall DEM was drastically improved by adding two GCPs on the northern flank (Table 3). Overall, the ASTER DEM tended to underestimate elevations on the higher region of Mauna Kea and to overestimate them in the vegetated lower region. This is consistent with the fact that topographic maps are providing ground elevation value, whereas the ASTER and SRTM DEMs provide an average elevation for the vegetation canopy. Based on a sample of 450 control points selected randomly on the topographic map DEM, we obtained an RMSE of 9 m for the SRTM dataset. The mean absolute difference over the entire cone field is 6 m (90% of the errors ranging between 211 and þ18 m; Table 3). We cannot exclude that part of this is error in co-referencing the two DEMs. Most pixels for which the SRTM DEM overestimates elevation by more than 10 m are located in the heavily forested regions east of the summit. Shaded relief, oblique 3D views, and slope maps were generated from the SRTM and ASTER DEMs Fig. 5. Oblique view of shaded relief of the Mauna Kea summit displaying five cinder cones. (a, b) 30 m and 90 m resolution SRTM; (c, d) 30 m resolution ASTER DEM, the stereo-pair of images being matched every 3 and 7 pixels, respectively.
.")
16 MAPPING VOLCANIC TERRAIN 19 Fig. 6. (a) True colour composite of Landsat ETMþ bands draped over the 30 m SRTM DEM. (b) Colour composite of the three VNIR ASTER bands draped over the 30 m ASTER DEM. in a geographical information system (GIS; ArcMap 8.1) for visual interpretation (Figs 4 6). The shaded relief view of the entire cone field (Fig. 4a) shows the high cone density and clustering in three main zones radiating away from the Mauna Kea summit, described as rift zones by Porter (1972). The steep upper flanks are also clearly visible. The ASTER-derived DEMs likewise generated an accurate overall picture of the volcano morphology, although small-scale surface irregularities (i.e. noise in the data) limit identification of small topographic features, such as craters. Figure 5 compares oblique, SRTM- and 3D ASTER-derived views of the Mauna Kea summit cones. The 30 m spatial resolution SRTM DEM allows identification of individual cones and delineation of crater rims. At 90 m resolution, SRTM provides a much smoother representation of the topography. The smaller cones cannot be identified as specific features and craters can no longer be delineated or are no longer apparent. The ASTER shaded-relief DEM image, although at the same spatial resolution (30 m), is visually less attractive than that of the 30 m SRTM because of small-scale irregularities in the topography. From comparison with aerial photographs, these irregularities can be attributed to artefacts introduced through errors in the automated matching process. Nevertheless, small volcanic features and the largest craters can be recognized. Landsat colour composites (e.g. true colour, Fig. 4b) allow identification of volcanic features, contrasting vegetation cover, and volcanic and sedimentary surfaces such as glacial deposits in the Mauna Kea summit area.
 limit identification of small topographic features, such as craters.")
17 20 M. KERVYN ET AL. Figure 6 illustrates the advantage of combining spectral data of a colour composite image and topographic data. The Landsat true colour composite draped over the SRTM DEM helps discriminate between cones, ash deposits and glacial moraines. To obtain a correctly draped image, georeferencing of the Landsat image had to be manually corrected using tie points, as it was offset by 200 m to the west. ASTER has the advantage that its spectral and topographic data are retrieved from the same dataset (and are therefore co-registered). The finer spatial resolution of the VNIR spectral bands (15 m) and the 30 m resolution ASTER DEM provide a combined high-quality volcano rendering. The comparison with an airphoto of the Mauna Kea summit with similar viewing conditions (Fig. 7) illustrates the level of detail that can be obtained through combination of multispectral (ASTER or Landsat) and topographic data (SRTM DEM or ASTER DEM). Visual analysis of integrated optical and topographic data proved to be the best easily available RS product to map small-scale volcanic features. It also identified a major arcuate structural feature, currently a focus of study, relating to volcano-scale spreading. The arcuate feature is incised by deep valleys extending in the NNE and SSW upper flanks of Mauna Kea, and passing through the summit where the valleys join and are widest (Fig. 4). We interpret this as a superficial graben from volcano-scale spreading in a preferential WNW ESE direction as a result of Mauna Kea s load over a mechanically weaker layer (Merle & Borgia 1996). Other, less well-defined graben structures, extending radially from the summit, are consistent with a volcano spreading interpretation. Directional spreading can be explained by the fact that the volcano is not buttressed by other large edifices in the WNW ESE direction. This example illustrates how integration of topographic and multispectral RS data allows identification of major structural features that were not identified through field work or airphoto interpretation. Morphometry of small-scale volcanic structures of Mauna Kea Cone morphometry parameters were independently collected from the Landsat scene, ASTER-derived DEM draped with ASTER VNIR bands, SRTM DEM and topographic maps. First we assessed the capabilities of each of these datasets to identify Fig. 7. Oblique view of Mauna Kea summit from north. (a) Colour airborne photography; (b) colour composite of the VNIR ASTER bands draped over the 30 m ASTER DEM; (c) 15 m resolution Landsat ETMþ panchromatic band and (d) colour composite of the three VIS Landsat ETMþ bands draped over the SRTM DEM at 30 m resolution. White areas in the bottom part of (c and d) are summit cones covered by snow.
.")
18 MAPPING VOLCANIC TERRAIN 21 % difference from mean estimate % difference from mean estimate % difference from mean estimate (a) Cone diameter SRTM ASTER TOPO LANDSAT (b) Crater diameter 100 (c) Cone height SRTM ASTER TOPO LANDSAT SRTM 30 ASTER 3D TOPO SRTM 90 Fig. 8. Comparison of cone diameter (a), crater diameter (b), and cone height (c) estimations from four different data sources. The boxes illustrate the range of differences between estimates and the mean estimated value from all the datasets (SRTM 90 m not considered in (c) for average calculation). The vertical line in each box is the median of the distribution. The extent of each box includes 50% of the data around this median value. Horizontal lines above and below each box indicate the 90th and 10th percentiles. Outliers are plotted as separate dots. Datasets: SRTM, SRTM 30 m DEM; ASTER, combined DEM and multispectral imagery; TOPO, estimate from paper topographic maps; LANDSAT, estimate from Landsat ETMþ multispectral imagery; SRTM90, SRTM 90 m DEM. pyroclastic constructs and vents, using the geological maps as a validation source. Pyroclastic constructs of the Mauna Kea cone field were identified by their common positive topographic relief. Importantly, specific spectral features of oxidized scoria also helped by allowing identification of constructs with little or no topographic relief and limited spatial extent (Davis et al. 1987). Quantitative parameters (e.g. namely the cone and crater diameters, the construct height, and the mean and maximum outer slope) were retrieved for all identified cones (c. 220) from the topographic maps and from the Landsat scene (i.e. elevation and slope estimates from topographic maps only). The same parameters were retrieved for a subset of 50 cones covering the entire range of cone sizes and shapes from the ASTER dataset and from the SRTM DEM. For the topographic maps, horizontal and vertical error ranges of c. 24 and 12 m, respectively, are expected as a result of small measurement errors and ambiguity in cone base location between two contour lines. For the RS datasets, an error range of 1 pixel (c m) is expected. The detailed volcanological interpretations will be the subject of another paper. Here we focus on methodological aspects and on comparison of the errors affecting the estimated parameters. The geological map used as the validation dataset shows 310 vent constructs on Mauna Kea. Constructs that are not systematically detected as small volcanic features on the topographic and RS datasets are invariably those with a very limited spatial extent (,200 m), low height (,20 m) and no distinctive spectral expression. Most are interpreted as spatter mounds and ramparts. Several of these deposits are mapped as highly elongated features, the result of fissure eruptions. These constructs are usually less than 15 m high (e.g. Riedel et al. 2003). Several processes may conceal the original truncated cone construct morphology, including intense weathering, compaction, mass wasting, and subsequent coverage of the lower slopes by lava flows or later pyroclastic products. These types of deposits, lacking a topographic expression, can only be identified by the combined use of high-resolution aerial photography and field work. All the datasets allowed us to identify pyroclastic constructs with near-equal success. Ninety-five percent of the scoria cones (cone base.250 m) less than 70 ka old were identified and mapped for each dataset. Between 65 and 72% of all vents (i.e. including not only cone vents but also some small metre-scale vents along fissures) were unambiguously identified. Although the average vent construct size on Mauna Kea is small relative to other cone fields in the world (Wood 1980a), the above-mentioned results are similar to those
 for average calculation).")
19 22 M. KERVYN ET AL. obtained by previous RS mapping of volcanic cones (e.g. Davis et al. 1987; Chagarlamudi & Moufti 1991). The constructs that could not be mapped were small spatter constructs (W co, 250 m) and a few larger cones ( m diameter deposits on the geological map) whose morphology has been obliterated by erosion and by later lava flows. Topographic maps and the Landsat image allowed similar results to be derived: 230 and 220 pyroclastic constructs were identified, respectively, from these data sources. However, only 199 of these could be simultaneously identified and mapped on both topographic maps and Landsat imagery. Cloud and snow cover are important factors that prevent cone mapping on the Landsat (or ASTER) image. Another limitation is the moderate spatial resolution of Landsat data, which hinders recognition and/or delineation of constructs less than 150 m wide with no specific spectral expression. Several pyroclastic features could not be recognized on the topographic maps because of the lack of distinct positive topography, but could be mapped on the satellite imagery by taking advantage of the high MIR reflectance typical of near-vent oxidized volcanic products (i.e. red scoria or spatter). The SRTM DEM allowed unambiguous identification of 218 of the 320 pyroclastic constructs. As with the Landsat data, the 30 m spatial resolution hindered recognition of the smallest constructs (those with width,200 m). The fact that the SRTM elevations correspond to the average height of the vegetation canopy also causes ambiguities in cone identification in places with discontinuous forest coverage. Small positive relief features can indeed be created by locally higher vegetation (e.g. a small forest in otherwise non-forested area). Ambiguity can be resolved by combining the SRTM DEM and multispectral data. The ASTER DEM allowed recognition of 171 out of 260 mapped pyroclastic features within the area covered by the ASTER scene (a success level of 65%). This poorer result is explained by the fact that the ASTER scene includes only the summit region, which happens to contain most of the small-size spatter mounds. We conclude that the ASTER dataset (i.e. multispectral data and ASTER DEM) has a capability similar to the three other datasets for mapping Mauna Kea pyroclastic constructs. The availability of good quality SWIR bands combined with an ASTER-derived DEM constrained by high-quality GCPs would further improve the mapping capabilities of the ASTER data. Quantitative morphological parameters For all the Mauna Kea constructs identified on the topographic maps and Landsat scene, the basal diameter, W co, was estimated (i.e. computed as the diameter of a circle having an area equivalent to that of the cone base). Results from the two datasets were similar over the entire cone field. On average, W co estimates derived from the Landsat image are c. 40 m greater than those derived from topographic maps. However, differences range from 280 m (underestimation of Landsat-derived W co relative to the topographic map-derived estimate) to 280 m. For 66% of the features, this difference ranges between 220 and þ80 m. A key result is that the magnitude of the discrepancy is not dependent on construct size, but rather on the degree of irregularity of the cone outline. Using the geological map as a validation reference, a comparison of the spatial extent of each feature between the Landsat and topographic map datasets was undertaken for 75 features for which discrepancies in W co values were high. For 40 cones the Landsatderived W co was found to be more accurate than the topographic map-derived value. Importantly, the results from the topographic map were usually ambiguous because of the lack of a well-defined basal break in slope for those cones. In only eight cases were the cones less accurately delineated with the Landsat data. This was due to misinterpretation of the cones spatial extent, as a result of vegetation cover or absence of topographic information. The last 27 cones were very small features (W co, 200 m) and the estimate from the geological map was halfway between those from the topographic map- and Landsat-derived estimates. The average 40 m discrepancy between estimates from the two data sources is to be expected. It falls within the estimated error ranges for the two estimates. Considering the 1: scale of the topographic map and the finite spatial resolution of the image, errors of c. 30 m are not abnormal, and a slightly larger error is likely to be related to limitations associated with defining the cone extent in those cases where the break in slope delimiting the cone base is not sharply defined. Figure 8a illustrates the differences in cone base estimates from the four datasets for a subset of 50 cones. On average, all the datasets lead to similar cone size estimation, even if major discrepancies do sometimes occur as a result of misinterpretation in the spatial extent of the cones. The box-plots illustrate that for all the datasets, more than 50% of the estimates are within 10% of the mean estimate (i.e. average of the estimates from the four datasets). The same observation holds for the crater size estimation, although a larger relative error range is observed. Figure 8a and b suggests that topographic maps, with no spatially continuous data coverage, tend to lead to underestimated cone size values, whereas the opposite is true for the Landsat image, which lacks topographic

20 MAPPING VOLCANIC TERRAIN 23 information. Both the ASTER and SRTM datasets lead to estimates that are generally close to the average value. The discrepancy range is the smallest with ASTER, thanks to the combined use of multispectral and topographic data, although some large errors are obtained for a few cones for which the spatial extent of the cone and/or crater is ambiguous. These results suggest that reasonably accurate quantitative morphology description through W cr /W co ratios can be derived from any one of the datasets assessed here. The height of volcanic cones is of interest because it is controlled both by the cone age (Wood 1980b) and by cone particle characteristics (Riedel et al. 2003). The height of 50 Mauna Kea scoria cones was estimated by subtracting the average cone base elevation from the average crater rim elevation. Results were independently extracted from the topographic maps, SRTM and ASTER DEMs. Results (Fig. 8c) illustrate that SRTM provides the smallest discrepancies (i.e. difference from the average of the three results). Elevations on topographic maps were recorded at only four locations each for the base and crater rims, and topographic map cone height estimates tend to be higher than the average. For 70% of the cones, the heights from the ASTER DEM are between 80 and 110% of the average estimated height. For constructs,50 m high (25% of the constructs), ASTER DEM height estimates are as much as 50% less than the average estimate. Although the ASTER-derived DEM has a lower vertical accuracy than the SRTM DEM, it still provides reasonable cone height estimates for large constructs (H co. 60 m). Finally, it should be noted that the capabilities of the SRTM dataset would be greatly reduced if it were available only at 90 m spatial resolution (as is the case for non-usa locations; see Fig. 8c). The cone height estimates are significantly lower with the 90 m SRTM and the range of discrepancy compared with the average value is larger. Rungwe Volcanic Province case study Many volcanoes in developing countries remain poorly known and it is typically difficult to acquire good-quality maps and airphotos for them. Satellite RS allows us to rapidly explore volcano morphology and identify evidence of recent activity (e.g. Dubbi volcano, Ethiopia; Wiart et al. 2000). The Rungwe Volcanic Province illustrates the type of information that can be retrieved from different RS datasets, including SRTM DEM, multispectral datasets and SAR interferometry. The objective here is to illustrate what can be done with RS, including deriving hazard-relevant information that can be evaluated in the field, as well as to highlight some remaining challenges for RS. The Rungwe Volcanic Province lies at the intersection of the west, east and south branches of the East African Rift in SW Tanzania (Fig. 9). The most recent eruption in the province was at Kiejo volcano 200 years ago. Little is known about other recent eruptions, either at Kiejo or at the other centres (especially at Rungwe or Ngosi volcanoes), although there are numerous Rungwe Volcanic Province ash layers in lakes within a few hundreds of kilometres, indicating frequent explosive eruptions in the province in the last 40 ka. In , a series of tectonic or volcanic earthquakes of moderate magnitude caused damage to villages. Tectonic activity is inferred along the Mbaka Fault (Fig. 9) but no surface rupture has been observed since the event. The only geological mapping of the Rungwe Volcanic Province was by Harkin (1960) in the 1950s at 1: A preliminary re-exploration of this poorly studied volcanic region was conducted using the 90 m SRTM DEM (Fig. 9) and a Landsat TM image. Combined use of these two datasets enhances our capability to understand the geology of the province. The three main eruptive centres are Ngozi volcano, directly south of Mbeya city, Rungwe volcano and the Kiejo volcano. The case of Rungwe volcano is here discussed for illustrative purposes. Rungwe culminates at 2962 m a.s.l. and, like Ngozi, is densely vegetated on its flanks. The Rungwe crater is bordered by a steep semi-circular wall on its NNW to SSE flanks, breached to the SW. Aligned pit craters and scarps, recognizable by their elevation and lack of vegetation, extend along the volcano flanks and are virtually uneroded. From the amphitheatre crater rim, Rungwe is much steeper and with a shorter slope to the NE compared with the SW. These features are interpreted as evidence for a large sector collapse (c. 2 3 km 3 ) that produced a debris avalanche. This is corroborated by Harkin s (1960) observations of a striking mound field including perfectly conical m diameter hills made up of very poorly sorted, breccia-like material some c km SW from the crater. The RS data spatial resolution, especially that of the 90 m SRTM DEM, does not allow mapping of individual hummocks in itself, but our reinterpretation of Harkin s work using the RS data allowed the mapping of the debris avalanche extent. RS also allows us to establish that several large phonolite trachyte domes were subsequently emplaced in the Rungwe amphitheatre crater with lava flowing down the breached flank. Lack of vegetation on the most recent flows points to a recent emplacement age, at most of the order of a few centuries. A field campaign is now necessary

A remote sensing instrument collects information about an object or phenomenon within the
 Satellite Remote Sensing GE 4150- Natural Hazards Some slides taken from Ann Maclean: Introduction to Digital Image Processing Remote Sensing the art, science, and technology of obtaining reliable information
High Resolution Information from Seven Years of ASTER Data
 High Resolution Information from Seven Years of ASTER Data Anna Colvin Michigan Technological University Department of Geological and Mining Engineering and Sciences Outline Part I ASTER mission Terra
Information Contents of High Resolution Satellite Images
 Information Contents of High Resolution Satellite Images H. Topan, G. Büyüksalih Zonguldak Karelmas University K. Jacobsen University of Hannover, Germany Keywords: satellite images, mapping, resolution,
2.3 Spatial Resolution, Pixel Size, and Scale
 Section 2.3 Spatial Resolution, Pixel Size, and Scale Page 39 2.3 Spatial Resolution, Pixel Size, and Scale For some remote sensing instruments, the distance between the target being imaged and the platform,
Monitoring and modelling volcanoes with assessment of their hazards by means of remote sensing and analogue modelling
 FACULTY of SCIENCES Department of Geology and Soil Sciences Monitoring and modelling volcanoes with assessment of their hazards by means of remote sensing and analogue modelling by Matthieu KERVYN 2008
Notable near-global DEMs include
 Visualisation Developing a very high resolution DEM of South Africa by Adriaan van Niekerk, Stellenbosch University DEMs are used in many applications, including hydrology [1, 2], terrain analysis [3],
Monitoring a Changing Environment with Synthetic Aperture Radar. Alaska Satellite Facility National Park Service Don Atwood
 Monitoring a Changing Environment with Synthetic Aperture Radar Don Atwood Alaska Satellite Facility 1 Entering the SAR Age 2 SAR Satellites RADARSAT-1 Launched 1995 by CSA 5.6 cm (C-Band) HH Polarization
3D VISUALIZATION OF GEOTHERMAL WELLS DIRECTIONAL SURVEYS AND INTEGRATION WITH DIGITAL ELEVATION MODEL (DEM)
") Presented at Short Course VII on Exploration for Geothermal Resources, organized by UNU-GTP, GDC and KenGen, at Lake Bogoria and Lake Naivasha, Kenya, Oct. 27 Nov. 18, 2012. GEOTHERMAL TRAINING PROGRAMME
Presented at Short Course VII on Exploration for Geothermal Resources, organized by UNU-GTP, GDC and KenGen, at Lake Bogoria and Lake Naivasha, Kenya, Oct. 27 Nov. 18, 2012. GEOTHERMAL TRAINING PROGRAMME
Digital Remote Sensing Data Processing Digital Remote Sensing Data Processing and Analysis: An Introduction and Analysis: An Introduction
 Digital Remote Sensing Data Processing Digital Remote Sensing Data Processing and Analysis: An Introduction and Analysis: An Introduction Content Remote sensing data Spatial, spectral, radiometric and
Hyperspectral Satellite Imaging Planning a Mission
 Hyperspectral Satellite Imaging Planning a Mission Victor Gardner University of Maryland 2007 AIAA Region 1 Mid-Atlantic Student Conference National Institute of Aerospace, Langley, VA Outline Objective
Resolutions of Remote Sensing
 Resolutions of Remote Sensing 1. Spatial (what area and how detailed) 2. Spectral (what colors bands) 3. Temporal (time of day/season/year) 4. Radiometric (color depth) Spatial Resolution describes how
Remote Sensing Satellite Information Sheets Geophysical Institute University of Alaska Fairbanks
 Remote Sensing Satellite Information Sheets Geophysical Institute University of Alaska Fairbanks ASTER Advanced Spaceborne Thermal Emission and Reflection Radiometer AVHRR Advanced Very High Resolution
The most widely used active remote sensing systems include:
 Active and Passive Remote Sensing Passive remote sensing systems record EMR that is reflected (e.g., blue, green, red, and near-infrared light) or emitted (e.g., thermal infrared energy) from the surface
Andrea Bondì, Irene D Urso, Matteo Ombrelli e Paolo Telaroli (Thetis S.p.A.) Luisa Sterponi e Cesar Urrutia (Spacedat S.r.l.) Water Calesso (Marco
 Luisa Sterponi e Cesar Urrutia (Spacedat S.r.l.) Water Calesso (Marco") Generation of a digital elevation model of the Wadi Lebda basin, Leptis Magna - Lybia Andrea Bondì, Irene D Urso, Matteo Ombrelli e Paolo Telaroli (Thetis S.p.A.) Luisa Sterponi e Cesar Urrutia (Spacedat
Generation of a digital elevation model of the Wadi Lebda basin, Leptis Magna - Lybia Andrea Bondì, Irene D Urso, Matteo Ombrelli e Paolo Telaroli (Thetis S.p.A.) Luisa Sterponi e Cesar Urrutia (Spacedat
Active and Passive Microwave Remote Sensing
 Active and Passive Microwave Remote Sensing Passive remote sensing system record EMR that was reflected (e.g., blue, green, red, and near IR) or emitted (e.g., thermal IR) from the surface of the Earth.
SAMPLE MIDTERM QUESTIONS
 Geography 309 Sample MidTerm Questions Page 1 SAMPLE MIDTERM QUESTIONS Textbook Questions Chapter 1 Questions 4, 5, 6, Chapter 2 Questions 4, 7, 10 Chapter 4 Questions 8, 9 Chapter 10 Questions 1, 4, 7
Automated Spacecraft Scheduling The ASTER Example
 Automated Spacecraft Scheduling The ASTER Example Ron Cohen ronald.h.cohen@jpl.nasa.gov Ground System Architectures Workshop 2002 Jet Propulsion Laboratory The Concept Scheduling by software instead of
Remote Sensing an Introduction
 Remote Sensing an Introduction Seminar: Space is the Place Referenten: Anica Huck & Michael Schlund Remote Sensing means the observation of, or gathering information about, a target by a device separated
Focus Earth The Velingara Circular Structure A meteorite impact crater?
 Focus Earth The Velingara Circular Structure A meteorite impact crater? S. Wade Institut des Sciences de la Terre, Faculté des Sciences et Techniques, Université Cheikh Anta Diop, Dakar-Fann, Sénégal M.
Map World Forum Hyderabad, India Introduction: High and very high resolution space images: GIS Development
 Very high resolution satellite images - competition to aerial images Dr. Karsten Jacobsen Leibniz University Hannover, Germany jacobsen@ipi.uni-hannover.de Introduction: Very high resolution images taken
Remote sensing is the collection of data without directly measuring the object it relies on the
 Chapter 8 Remote Sensing Chapter Overview Remote sensing is the collection of data without directly measuring the object it relies on the reflectance of natural or emitted electromagnetic radiation (EMR).
The RapidEye optical satellite family for high resolution imagery
 'Photogrammetric Week 01' D. Fritsch & R. Spiller, Eds. Wichmann Verlag, Heidelberg 2001. Scherer, Krischke 139 The RapidEye optical satellite family for high resolution imagery STEFAN SCHERER and MANFRED
Passive remote sensing systems record electromagnetic energy that was reflected (e.g., blue, green, red, and near-infrared light) or emitted (e.g.
 or emitted (e.g.") CHAPTER 9: Active and Passive Microwave RS REFERENCE: Remote Sensing of the Environment John R. Jensen (2007) Second Edition Pearson Prentice Hall Passive Remote Sensing Passive remote sensing systems
CHAPTER 9: Active and Passive Microwave RS REFERENCE: Remote Sensing of the Environment John R. Jensen (2007) Second Edition Pearson Prentice Hall Passive Remote Sensing Passive remote sensing systems
TerraSAR-X Applications Guide
 TerraSAR-X Applications Guide Extract: Maritime Monitoring: Oil Spill Detection April 2015 Airbus Defence and Space Geo-Intelligence Programme Line Maritime Monitoring: Oil Spill Detection Issue As the
Geospatial Software Solutions for the Environment and Natural Resources
 Geospatial Software Solutions for the Environment and Natural Resources Manage and Preserve the Environment and its Natural Resources Our environment and the natural resources it provides play a growing
Field Techniques Manual: GIS, GPS and Remote Sensing
 Field Techniques Manual: GIS, GPS and Remote Sensing Section A: Introduction Chapter 1: GIS, GPS, Remote Sensing and Fieldwork 1 GIS, GPS, Remote Sensing and Fieldwork The widespread use of computers
The premier software for extracting information from geospatial imagery.
 Imagery Becomes Knowledge ENVI The premier software for extracting information from geospatial imagery. ENVI Imagery Becomes Knowledge Geospatial imagery is used more and more across industries because
LiDAR for vegetation applications
 LiDAR for vegetation applications UoL MSc Remote Sensing Dr Lewis plewis@geog.ucl.ac.uk Introduction Introduction to LiDAR RS for vegetation Review instruments and observational concepts Discuss applications
16 th IOCCG Committee annual meeting. Plymouth, UK 15 17 February 2011. mission: Present status and near future
 16 th IOCCG Committee annual meeting Plymouth, UK 15 17 February 2011 The Meteor 3M Mt satellite mission: Present status and near future plans MISSION AIMS Satellites of the series METEOR M M are purposed
Spectral Response for DigitalGlobe Earth Imaging Instruments
 Spectral Response for DigitalGlobe Earth Imaging Instruments IKONOS The IKONOS satellite carries a high resolution panchromatic band covering most of the silicon response and four lower resolution spectral
A KNOWLEDGE-BASED APPROACH FOR REDUCING CLOUD AND SHADOW ABSTRACT
 A KNOWLEDGE-BASED APPROACH FOR REDUCING CLOUD AND SHADOW Mingjun Song, Graduate Research Assistant Daniel L. Civco, Director Laboratory for Earth Resources Information Systems Department of Natural Resources
Review for Introduction to Remote Sensing: Science Concepts and Technology
 Review for Introduction to Remote Sensing: Science Concepts and Technology Ann Johnson Associate Director ann@baremt.com Funded by National Science Foundation Advanced Technological Education program [DUE
Radar interferometric techniques and data validation Terrafirma Essen, March 2011. Page 1
 Radar interferometric techniques and data validation Terrafirma Essen, March 2011 Page 1 Agenda Introduction to InSAR technology Different radarinterferometric techniques Validation of InSAR technology
LIDAR and Digital Elevation Data
 LIDAR and Digital Elevation Data Light Detection and Ranging (LIDAR) is being used by the North Carolina Floodplain Mapping Program to generate digital elevation data. These highly accurate topographic
High Resolution Digital Surface Models and Orthoimages for Telecom Network Planning
 Renouard, Lehmann 241 High Resolution Digital Surface Models and Orthoimages for Telecom Network Planning LAURENT RENOUARD, S ophia Antipolis FRANK LEHMANN, Berlin ABSTRACT DLR of Germany and ISTAR of
Geography 403 Lecture 7 Scanners, Thermal, and Microwave
 Geography 403 Lecture 7 Scanners, Thermal, and Microwave Needs: Lect_403_7.ppt A. Basics of Passive Electric Sensors 1. Sensors absorb EMR and produce some sort of response, such as voltages differences
Appendix B. Introduction to Landslide Evaluation Tools Mapping, Remote Sensing, and Monitoring of Landslides
 Appendix B. Introduction to Landslide Evaluation Tools Mapping, Remote Sensing, and Monitoring of Landslides 66 The Landslide Handbook A Guide to Understanding Landslides Part 1. Mapping Maps are a useful
Two primary advantages of radars: all-weather and day /night imaging
 Lecture 0 Principles of active remote sensing: Radars. Objectives: 1. Radar basics. Main types of radars.. Basic antenna parameters. Required reading: G: 8.1, p.401-40 dditional/advanced reading: Online
Exploitation of historical satellite SAR archives for mapping and monitoring landslides at regional and local scale
 Exploitation of historical satellite SAR archives for mapping and monitoring landslides at regional and local scale (A. Ferretti (TRE), A. Tamburini (TRE), M. Bianchi (TRE), M. Broccolato (Regione Valle
Using Remotely Sensed Data From ASTER to Look Impact of Recent Earth Quakes in Gujarat, India.
 Using Remotely Sensed Data From ASTER to Look Impact of Recent Earth Quakes in Gujarat, India. A major earth quake occurred in Gujarat, India on January 26,2000. (Origin time 03:16 GMT, Location 23.399N
Mapping Earth from Space Remote sensing and satellite images. Remote sensing developments from war
 Mapping Earth from Space Remote sensing and satellite images Geomatics includes all the following spatial technologies: a. Cartography "The art, science and technology of making maps" b. Geographic Information
Chapter Contents Page No
 Chapter Contents Page No Preface Acknowledgement 1 Basics of Remote Sensing 1 1.1. Introduction 1 1.2. Definition of Remote Sensing 1 1.3. Principles of Remote Sensing 1 1.4. Various Stages in Remote Sensing
5. GIS, Cartography and Visualization of Glacier Terrain
 5. GIS, Cartography and Visualization of Glacier Terrain 5.1. Garhwal Himalayan Glaciers 5.1.1. Introduction GIS is the computer system for capturing, storing, analyzing and visualization of spatial and
Preface. Ko Ko Lwin Division of Spatial Information Science University of Tsukuba 2008
 1 Preface Remote Sensing data is one of the primary data sources in GIS analysis. The objective of this material is to provide fundamentals of Remote Sensing technology and its applications in Geographical
Radar Interferometric and Polarimetric Possibilities for Determining Sea Ice Thickness
 Radar Interferometric and Polarimetric Possibilities for Determining Sea Ice Thickness by Scott Hensley, Ben Holt, Sermsak Jaruwatanadilok, Jeff Steward, Shadi Oveisgharan Delwyn Moller, Jim Reis, Andy
The USGS Landsat Big Data Challenge
 The USGS Landsat Big Data Challenge Brian Sauer Engineering and Development USGS EROS bsauer@usgs.gov U.S. Department of the Interior U.S. Geological Survey USGS EROS and Landsat 2 Data Utility and Exploitation
APPLICATION OF TERRA/ASTER DATA ON AGRICULTURE LAND MAPPING. Genya SAITO*, Naoki ISHITSUKA*, Yoneharu MATANO**, and Masatane KATO***
 APPLICATION OF TERRA/ASTER DATA ON AGRICULTURE LAND MAPPING Genya SAITO*, Naoki ISHITSUKA*, Yoneharu MATANO**, and Masatane KATO*** *National Institute for Agro-Environmental Sciences 3-1-3 Kannondai Tsukuba
Analysis of Landsat ETM+ Image Enhancement for Lithological Classification Improvement in Eagle Plain Area, Northern Yukon
 Analysis of Landsat ETM+ Image Enhancement for Lithological Classification Improvement in Eagle Plain Area, Northern Yukon Shihua Zhao, Department of Geology, University of Calgary, zhaosh@ucalgary.ca,
LANDSAT 7 - GROUND SEGMENT ACTIVITIES AT THE GERMAN REMOTE SENSING DATA CENTER. Deutsches Fernerkundungsdatenzentrum (DFD) DLR (*)
 DLR (*)") LANDSAT 7 - GROUND SEGMENT ACTIVITIES AT THE GERMAN REMOTE SENSING DATA CENTER Günter Strunz (*), Hans-Dietrich Bettac (**), Jörg Gredel (*), Klaus-Dieter Reiniger (*) & Gunter Schreier (*) Deutsches Fernerkundungsdatenzentrum
LANDSAT 7 - GROUND SEGMENT ACTIVITIES AT THE GERMAN REMOTE SENSING DATA CENTER Günter Strunz (*), Hans-Dietrich Bettac (**), Jörg Gredel (*), Klaus-Dieter Reiniger (*) & Gunter Schreier (*) Deutsches Fernerkundungsdatenzentrum
D.S. Boyd School of Earth Sciences and Geography, Kingston University, U.K.
 PHYSICAL BASIS OF REMOTE SENSING D.S. Boyd School of Earth Sciences and Geography, Kingston University, U.K. Keywords: Remote sensing, electromagnetic radiation, wavelengths, target, atmosphere, sensor,
RESOLUTION MERGE OF 1:35.000 SCALE AERIAL PHOTOGRAPHS WITH LANDSAT 7 ETM IMAGERY
 RESOLUTION MERGE OF 1:35.000 SCALE AERIAL PHOTOGRAPHS WITH LANDSAT 7 ETM IMAGERY M. Erdogan, H.H. Maras, A. Yilmaz, Ö.T. Özerbil General Command of Mapping 06100 Dikimevi, Ankara, TURKEY - (mustafa.erdogan;
LANDSAT 8 Level 1 Product Performance
 Réf: IDEAS-TN-10-QualityReport LANDSAT 8 Level 1 Product Performance Quality Report Month/Year: January 2016 Date: 26/01/2016 Issue/Rev:1/9 1. Scope of this document On May 30, 2013, data from the Landsat
CASE STUDY LANDSLIDE MONITORING
 Introduction Monitoring of terrain movements (unstable slopes, landslides, glaciers, ) is an increasingly important task for today s geotechnical people asked to prevent or forecast natural disaster that
AUTOMATED DEM VALIDATION USING ICESAT GLAS DATA INTRODUCTION
 AUTOMATED DEM VALIDATION USING ICESAT GLAS DATA Mary Pagnutti Robert E. Ryan Innovative Imaging and Research Corp. Building 1103, Suite 140C Stennis Space Center, MS 39529 mpagnutti@i2rcorp.com rryan@i2rcorp.com
'Developments and benefits of hydrographic surveying using multispectral imagery in the coastal zone
 Abstract With the recent launch of enhanced high-resolution commercial satellites, available imagery has improved from four-bands to eight-band multispectral. Simultaneously developments in remote sensing
POTENTIALS OF HIGH RESOLUTION TERRASAR-X IMAGES IN INSAR PROCESSING
 POTENTIALS OF HIGH RESOLUTION TERRASAR-X IMAGES IN INSAR PROCESSING FOR EARTH DEFORMATION AND ENVIRONMENTAL STUDIES Magdalena Niemiec 1 Abstract Accurate determination of topography and surface deformation
How To Make An Orthophoto
 ISSUE 2 SEPTEMBER 2014 TSA Endorsed by: CLIENT GUIDE TO DIGITAL ORTHO- PHOTOGRAPHY The Survey Association s Client Guides are primarily aimed at other professionals such as engineers, architects, planners
DEM products from TerraSAR-X & TanDEM-X. Nora Meyer zu Erpen // 25.01.2011
 DEM products from TerraSAR- & TanDEM- Nora Meyer zu Erpen // 25.01.2011 GEO-Information Services within Astrium and EADS Airbus Eurocopter Cassidian Astrium Turnover 2009: 4.8 billion Staff 2009: 15,000*
APPLICATION OF GOOGLE EARTH FOR THE DEVELOPMENT OF BASE MAP IN THE CASE OF GISH ABBAY SEKELA, AMHARA STATE, ETHIOPIA
 APPLICATION OF GOOGLE EARTH FOR THE DEVELOPMENT OF BASE MAP IN THE CASE OF GISH ABBAY SEKELA, AMHARA STATE, ETHIOPIA Abineh Tilahun Department of Geography and environmental studies, Adigrat University,
Adaptation of High Resolution Ikonos Images to Googleearth for Zonguldak Test Field
 Adaptation of High Resolution Ikonos Images to Googleearth for Zonguldak Test Field Umut G. SEFERCIK, Murat ORUC and Mehmet ALKAN, Turkey Key words: Image Processing, Information Content, Image Understanding,
Sentinel-1 Mission Overview
 Sentinel-1 Mission Overview Pierre Potin Sentinel-1 Mission Manager, ESA Advanced Course on Radar Polarimetry ESRIN, Frascati, 19 January 2011 Global Monitoring for Environment and Security GMES is established
ENVIRONMENTAL MONITORING Vol. I - Remote Sensing (Satellite) System Technologies - Michael A. Okoye and Greg T. Koeln
 System Technologies - Michael A. Okoye and Greg T. Koeln") REMOTE SENSING (SATELLITE) SYSTEM TECHNOLOGIES Michael A. Okoye and Greg T. Earth Satellite Corporation, Rockville Maryland, USA Keywords: active microwave, advantages of satellite remote sensing, atmospheric
REMOTE SENSING (SATELLITE) SYSTEM TECHNOLOGIES Michael A. Okoye and Greg T. Earth Satellite Corporation, Rockville Maryland, USA Keywords: active microwave, advantages of satellite remote sensing, atmospheric
Myths and misconceptions about remote sensing
 Myths and misconceptions about remote sensing Ned Horning (graphics support - Nicholas DuBroff) Version: 1.0 Creation Date: 2004-01-01 Revision Date: 2004-01-01 License: This document is licensed under
2003 INTERNATIONAL CONFERENCE AIRPORTS: PLANNING, INFRASTRUCTURE & ENVIRONMENT
 AIRPORTS: PLANNING, INFRASTRUCTURE & ENVIRONMENT AIRBORNE AND SPACEBORNE REMOTE SENSING TERRAIN MAPPING FOR PLANNING AND DESIGN OF TRANSPORTATION INFRASTRUCTURE ASSETS Waheed Uddin Associate Professor
Passive Remote Sensing of Clouds from Airborne Platforms
 Passive Remote Sensing of Clouds from Airborne Platforms Why airborne measurements? My instrument: the Solar Spectral Flux Radiometer (SSFR) Some spectrometry/radiometry basics How can we infer cloud properties
Rosaly Lopes, Jet Propulsion Laboratory, California Institute of Technology
 Saturn s Moon Titan: Cassini-Huygens Reveals a New World Rosaly Lopes, Jet Propulsion Laboratory, California Institute of Technology The year 2005 will be remembered in the history of space exploration
REMOTE SENSING AND ENVIRONMENTAL MONITORING. P. M. Mather School of Geography, The University of Nottingham, U.K.
 REMOTE SENSING AND ENVIRONMENTAL MONITORING P. M. Mather School of Geography, The University of Nottingham, U.K. Keywords: Earth observation, image processing, lidar, pattern recognition, radar Contents
Files Used in this Tutorial
 Generate Point Clouds Tutorial This tutorial shows how to generate point clouds from IKONOS satellite stereo imagery. You will view the point clouds in the ENVI LiDAR Viewer. The estimated time to complete
SPOT Satellite Earth Observation System Presentation to the JACIE Civil Commercial Imagery Evaluation Workshop March 2007
 SPOT Satellite Earth Observation System Presentation to the JACIE Civil Commercial Imagery Evaluation Workshop March 2007 Topics Presented Quick summary of system characteristics Formosat-2 Satellite Archive
ENVI THE PREMIER SOFTWARE FOR EXTRACTING INFORMATION FROM GEOSPATIAL IMAGERY.
 ENVI THE PREMIER SOFTWARE FOR EXTRACTING INFORMATION FROM GEOSPATIAL IMAGERY. ENVI Imagery Becomes Knowledge ENVI software uses proven scientific methods and automated processes to help you turn geospatial
TerraColor White Paper
 TerraColor White Paper TerraColor is a simulated true color digital earth imagery product developed by Earthstar Geographics LLC. This product was built from imagery captured by the US Landsat 7 (ETM+)
Landsat Monitoring our Earth s Condition for over 40 years
 Landsat Monitoring our Earth s Condition for over 40 years Thomas Cecere Land Remote Sensing Program USGS ISPRS:Earth Observing Data and Tools for Health Studies Arlington, VA August 28, 2013 U.S. Department
TUTORIAL Extraction of Geospatial Information from High Spatial Resolution Optical Satellite Sensors
 TUTORIAL Extraction of Geospatial Information from High Spatial Resolution Optical Satellite Sensors E. Baltsavias 1,L. Zhang 2, D. Holland 3, P.K. Srivastava 4, B. Gopala Krishna 4, T.P. Srinivasan 4
COMPARISON OF SRTM AND 25K TOPOGRAPHIC MAPS IN TURKEY
 COMPARISON OF SRTM AND 25K TOPOGRAPHIC MAPS IN TURKEY Oztug Bildirici 1, Aydin Ustun, Necla Ulugtekin 2, H. Zahit Selvi 1, Alpay Abbak 1, Ilkay Bugdayci 1, A. Ozgur Dogru 2 1 Selcuk University, Faculty
A tiered reconnaissance approach toward flood monitoring utilising multi-source radar and optical data
 5 th International Workshop on Remote Sensing for Disaster Response A tiered reconnaissance approach toward flood monitoring utilising multi-source radar and optical data Anneley McMillan Dr. Beverley
Possibilities of applying CORONA archive satellite images in forest cover change detection example of the Fruška Gora mountain
 ISSN 0354-8724 (hard copy) ISSN 1820-7138 (online) Possibilities of applying CORONA archive satellite images in forest cover change detection example of the Fruška Gora mountain Minucsér Mészáros A *,
EVALUATION OF AIRBORNE LIDAR DIGITAL TERRAIN MAPPING FOR HIGHWAY CORRIDOR PLANNING AND DESIGN
 Waheed Uddin Director, Center for Advanced Infrastructure Technology, Carrier Hall 203 The University of Mississippi, University, MS 38677-1848, USA cvuddin@olemiss.edu KEY WORDS: Terrain, mapping, airborne,
GEOENGINE MSc in Geomatics Engineering (Master Thesis) Anamelechi, Falasy Ebere
 Anamelechi, Falasy Ebere") Master s Thesis: ANAMELECHI, FALASY EBERE Analysis of a Raster DEM Creation for a Farm Management Information System based on GNSS and Total Station Coordinates Duration of the Thesis: 6 Months Completion
Master s Thesis: ANAMELECHI, FALASY EBERE Analysis of a Raster DEM Creation for a Farm Management Information System based on GNSS and Total Station Coordinates Duration of the Thesis: 6 Months Completion
ForeCAST : Use of VHR satellite data for forest cartography
 ForeCAST : Use of VHR satellite data for forest cartography I-MAGE CONSULT UCL- Dpt Sciences du Milieu et de l Aménagement du Territoire Description of the partnership I-MAGE Consult Private partner Team
METHODOLOGY FOR LANDSLIDE SUSCEPTIBILITY AND HAZARD MAPPING USING GIS AND SDI
 The 8th International Conference on Geo-information for Disaster Management Intelligent Systems for Crisis Management METHODOLOGY FOR LANDSLIDE SUSCEPTIBILITY AND HAZARD MAPPING USING GIS AND SDI T. Fernández
Lidar Remote Sensing for Forestry Applications
 Lidar Remote Sensing for Forestry Applications Ralph O. Dubayah* and Jason B. Drake** Department of Geography, University of Maryland, College Park, MD 0 *rdubayah@geog.umd.edu **jasdrak@geog.umd.edu 1
Selecting the appropriate band combination for an RGB image using Landsat imagery
 Selecting the appropriate band combination for an RGB image using Landsat imagery Ned Horning Version: 1.0 Creation Date: 2004-01-01 Revision Date: 2004-01-01 License: This document is licensed under a
Imagery. 1:50,000 Basemap Generation From Satellite. 1 Introduction. 2 Input Data
 1:50,000 Basemap Generation From Satellite Imagery Lisbeth Heuse, Product Engineer, Image Applications Dave Hawkins, Product Manager, Image Applications MacDonald Dettwiler, 3751 Shell Road, Richmond B.C.
White Paper. PlanetDEM 30. PlanetObserver 25/11/2014 - Update
 White Paper PlanetDEM 30 PlanetObserver 25/11/2014 - Update PlanetObserver France www.planetobserver.com msat@planetobserver.com Tel. +33 4 73 44 19 00 1. Introduction PlanetObserver presents PlanetDEM
Image Analysis CHAPTER 16 16.1 ANALYSIS PROCEDURES
 CHAPTER 16 Image Analysis 16.1 ANALYSIS PROCEDURES Studies for various disciplines require different technical approaches, but there is a generalized pattern for geology, soils, range, wetlands, archeology,
WATER BODY EXTRACTION FROM MULTI SPECTRAL IMAGE BY SPECTRAL PATTERN ANALYSIS
 WATER BODY EXTRACTION FROM MULTI SPECTRAL IMAGE BY SPECTRAL PATTERN ANALYSIS Nguyen Dinh Duong Department of Environmental Information Study and Analysis, Institute of Geography, 18 Hoang Quoc Viet Rd.,
GPS Precise Point Positioning as a Method to Evaluate Global TanDEM-X Digital Elevation Model
 GPS Precise Point Positioning as a Method to Evaluate Global TanDEM-X Digital Elevation Model 7 th FIG Regional Conference TS 1C Advances in GNSS Positioning and Applications I Volker Schwieger 1, Jürgen
DESCW: PC Software Supporting Remote Sensing Data
 r bulletin 97 march 1999 DESCW: PC Software Supporting Remote Sensing Data S. D Elia Earth Remote Sensing Exploitation Division, ESA Directorate for Application Programmes, ESRIN, Frascati, Italy R. Biasutti
High Resolution 3D Earth Observation Data Analysis for Safeguards Activities
 High Resolution 3D Earth Observation Data Analysis for Safeguards Activities Pablo d'angelo a1, Cristian Rossi a, Christian Minet a, Michael Eineder a, Michael Flory b, Irmgard Niemeyer c a German Aerospace
Regents Questions: Plate Tectonics
 Earth Science Regents Questions: Plate Tectonics Name: Date: Period: August 2013 Due Date: 17 Compared to the oceanic crust, the continental crust is (1) less dense and more basaltic (3) more dense and
The use of Earth Observation technology to support the implementation of the Ramsar Convention
 Wetlands: water, life, and culture 8th Meeting of the Conference of the Contracting Parties to the Convention on Wetlands (Ramsar, Iran, 1971) Valencia, Spain, 18-26 November 2002 COP8 DOC. 35 Information
Upgrading a Landforms Analysis Activity for an Introductory Planetary Science Course Using MGS/Mars Odyssey Imagery resources and Google Earth/Mars
 Upgrading a Landforms Analysis Activity for an Introductory Planetary Science Course Using MGS/Mars Odyssey Imagery resources and Google Earth/Mars Jeffrey G. Ryan, Ph.D., University of South Florida,
The Role of SPOT Satellite Images in Mapping Air Pollution Caused by Cement Factories
 The Role of SPOT Satellite Images in Mapping Air Pollution Caused by Cement Factories Dr. Farrag Ali FARRAG Assistant Prof. at Civil Engineering Dept. Faculty of Engineering Assiut University Assiut, Egypt.
DIFFERENTIAL INSAR MONITORING OF THE LAMPUR SIDOARJO MUD VOLCANO (JAVA, INDONESIA) USING ALOS PALSAR IMAGERY
 USING ALOS PALSAR IMAGERY") DIFFERENTIAL INSAR MONITORING OF THE LAMPUR SIDOARJO MUD VOLCANO (JAVA, INDONESIA) USING ALOS PALSAR IMAGERY Adam Thomas (1), Rachel Holley (1), Richard Burren (1), Chris Meikle (2), David Shilston (2)
DIFFERENTIAL INSAR MONITORING OF THE LAMPUR SIDOARJO MUD VOLCANO (JAVA, INDONESIA) USING ALOS PALSAR IMAGERY Adam Thomas (1), Rachel Holley (1), Richard Burren (1), Chris Meikle (2), David Shilston (2)
California Standards Grades 9 12 Boardworks 2009 Science Contents Standards Mapping
 California Standards Grades 912 Boardworks 2009 Science Contents Standards Mapping Earth Sciences Earth s Place in the Universe 1. Astronomy and planetary exploration reveal the solar system s structure,
Laboratory 6: Topographic Maps
 Name: Laboratory 6: Topographic Maps Part 1: Construct a topographic map of the Egyptian Pyramid of Khafre A topographic map is a two-dimensional representation of a three-dimensional space. Topographic
Satellites for Terrain Motion Mapping Terrafirma User Workshop Mining. Nico Adam
 Satellites for Terrain Motion Mapping Terrafirma User Workshop Mining Nico Adam Outline SAR / InSAR observation characteristic Sensors TSX, TDX ERS-1, ERS-2 Processing techniques D-InSAR PSI SBAS Acquisition
How Landsat Images are Made
 How Landsat Images are Made Presentation by: NASA s Landsat Education and Public Outreach team June 2006 1 More than just a pretty picture Landsat makes pretty weird looking maps, and it isn t always easy
Estimating Firn Emissivity, from 1994 to1998, at the Ski Hi Automatic Weather Station on the West Antarctic Ice Sheet Using Passive Microwave Data
 Estimating Firn Emissivity, from 1994 to1998, at the Ski Hi Automatic Weather Station on the West Antarctic Ice Sheet Using Passive Microwave Data Mentor: Dr. Malcolm LeCompte Elizabeth City State University
Robot Perception Continued
 Robot Perception Continued 1 Visual Perception Visual Odometry Reconstruction Recognition CS 685 11 Range Sensing strategies Active range sensors Ultrasound Laser range sensor Slides adopted from Siegwart