GROWTH INITIATIVES: AQUISITIONS - GREENFIELDS - ORGANIC - MODERNIZATION
|
|
|
- Rosalyn Day
- 8 years ago
- Views:
Transcription
1 2013 ANNUAL REPORT
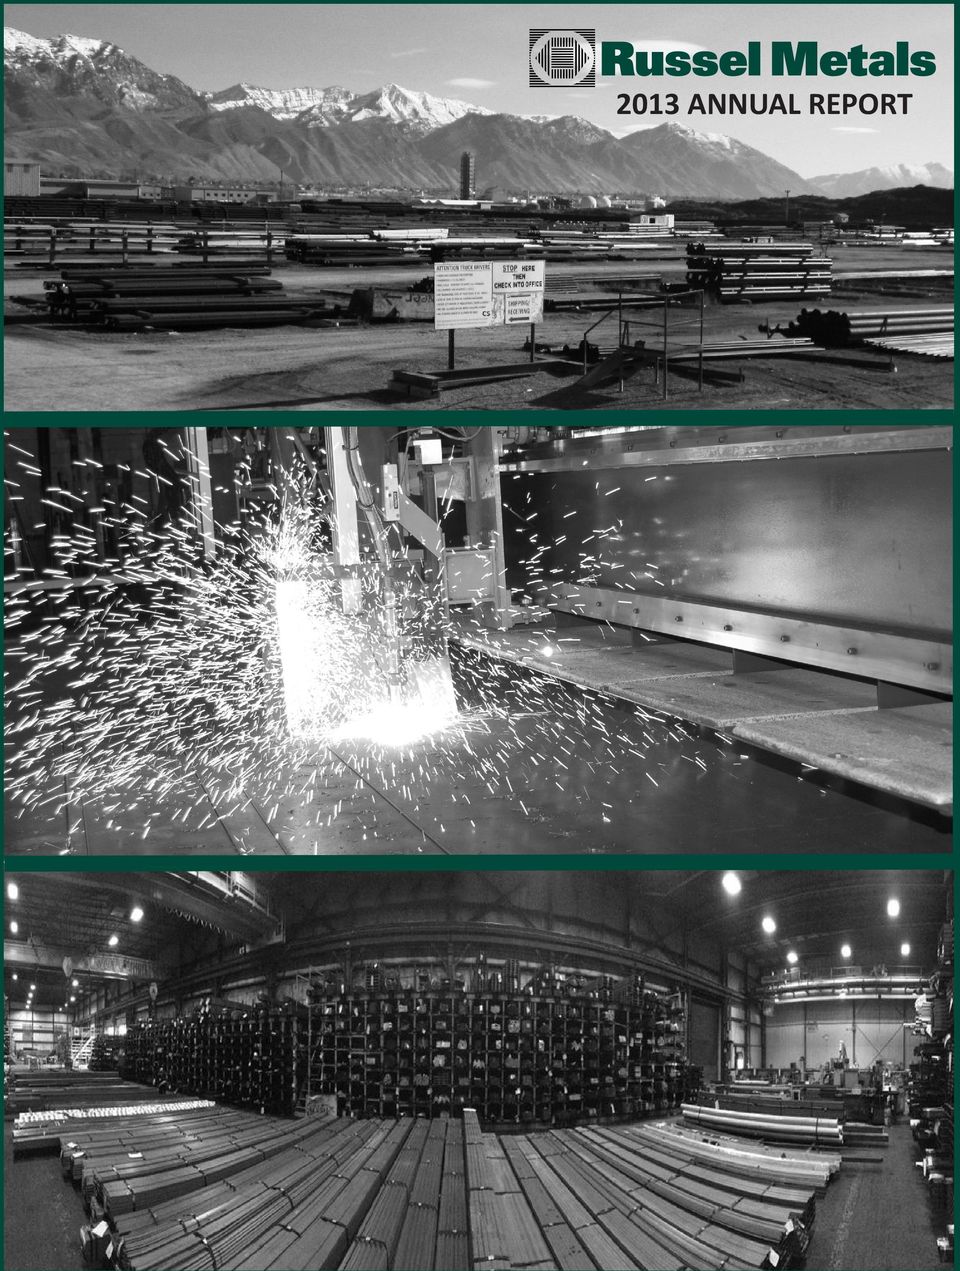
2 2013 GROWTH INITIATIVES: AQUISITIONS - GREENFIELDS - ORGANIC - MODERNIZATION METALS SERVICE CENTERS Our network of metals service centers carries a broad line of metal products in a wide range of sizes, shapes and specifications, including carbon hot rolled and cold finished steel, pipe and tubular prooducts, stainless steel and aluminum. We purchase these products primarily from North American steel producers and package and sell them to end users in accordance with their specific needs. We service all major geographical regions of Canada and the Southeastern and Midwestern regions of the United States. Organic Growth High Definition Plasma Cutting & Machining - Saskatoon ENERGY PRODUCTS These operations distribute oil country tubular goods (OCTG), line pipe, tubes, valves and fittings in Canada and in the United States. We purchase these products either from the pipe division of North American steel mills or from independent manufacturers of pipe and pipe accessories. Aquisitions / Greenfields Apex Monarch / Apex Remington STEEL DISTRIBUTORS Our steel distributors act as master distributors, selling steel in large volumes to other steel service centers and large equipment manufacturers mainly on an as is basis. The main steel products sourced by this segment are carbon steel plate, beams, channel, flat rolled products, rails and pipe products. Modernization Stretcher Levellers - Winnipeg North & B&T Steel Cut-To-Length Line - Arrow Steel TABLE OF CONTENTS Organic Growth High Definition Plasma Cutting & Machining - A.J. Forsyth A Message from our President & CEO 1 Four Year Financial Summary 3 Management s Responsibility for Financial Reporting 4 Management s Discussion & Analysis 5 Consolidated Financial Statements 20

3 A MESSAGE FROM OUR PRESIDENT AND CHIEF EXECUTIVE OFFICER As illustrated by our cover this year, metals distribution is a basic, industrial, gritty business was a difficult year as we navigated the uneven and rapidly changing economic conditions where margins were under pressure and every piece of business was hotly contested. Despite the challenging business conditions, we utilized our flexible and strong balance sheet to grow and enhance our operations and were well positioned to take advantage of opportunities that presented themselves. These growth initiatives included additional acquisitions and expansion of our processing capabilities at our metals service centers. Brian R. Hedges President & Chief Executive Officer GROWTH During 2013 we made three acquisitions that augmented our Apex Distribution operations - Keystone Oilfield in Manitoba, Northern Valve Services in northern British Columbia and, the largest one, Monarch Supply in Drayton Valley, Alberta. Apex Remington, the U.S. operation, also opened new store locations in Asherton and Midland, Texas. Our capital expenditures for 2013 were $27 million and we expect to expand this to approximately $40 million per annum for the next couple of years as we invest in new equipment and open new locations. The new locations will primarily be located in the United States, with our metals service centers expanding their geographic footprint around their existing locations and Apex Remington opening new field stores in the fast growing shale energy plays in the United States. We also plan to expand and upgrade our existing Canadian metals service center facilities, starting with a new facility to replace our current multi-location operation in Edmonton, Alberta. In 2013, we upgraded our cut-to-length capabilities at Arrow Processing in Houston, added stretcher leveler capabilities in Winnipeg, Manitoba and Stoney Creek, Ontario and enhanced our plate processing capabilities with the addition of plasma cutting and machining equipment at our Saskatoon, Saskatchewan and Prince George, B.C. locations. In the future, we will continue to invest in industry-leading equipment to enhance our process capabilities. OPERATIONS In our 2012 Message to Shareholders, we predicted that the economy would continue to lack direction for 2013 which will equate to flat volumes and steel prices that will be flat or slightly stronger. Volumes were indeed flat but steel pricing was lower than 2012 leaving our reported earnings lower than last year. Operationally, I am pleased to report that Apex Distribution s performance has met our expectations in all areas in light of the challenging economic conditions. We look forward to continued success. GOVERNANCE Following the Apex Distribution acquisition in late 2012, our primary focus was introducing Apex Distribution to the reporting and governance requirements of a public company, while maintaining the entrepreneurial culture that was a key driver in Apex Distribution s success and made them such a desirable acquisition. I would like to thank Don White and his Apex Distribution team for the professional way they have addressed and implemented these requirements. RUSSEL METALS INC ANNUAL REPORT

4 I would like to take this opportunity to personally thank our retiring Chair, Anthony (Tony) Griffiths. Tony became Chair almost 17 years ago on June 2, 1997 when our shares traded at $4.30 per share, we had not paid common share dividends since 1992 and our market capitalization was $220 million. During his tenure, we have returned almost $800 million to shareholders in the form of dividends, and our market capitalization is now $1.7 billion with the share price at $30. Tony provided the leadership that encouraged management to take a long term perspective on running the Company and at the same time provided the governance and moral compass that enabled one of the great Canadian turnaround stories to materialize and prosper. Tony, we thank you for your leadership and wise counsel during the past 17 years and please accept my personal appreciation for the mentorship that you have provided to me and the rest of our Russel Metals team. I would also like to welcome our newest Board member, John Tulloch, to our Board of Directors. John brings 40 years of experience in the steel industry primarily with IPSCO in various roles including Executive Vice President and Chief Commercial Officer. MANAGEMENT In our management ranks, I would like to welcome some key individuals who joined our management team in David Allan has joined us as General Manager of our Fedmet Tubular operation. John MacLean has joined us, with 33 years with of industry experience, and heads our Manitoba and Saskatchewan region of metals service centers. In addition, I would like to welcome the management teams from Keystone Oilfield, Northern Valve and Monarch Supply. THE FUTURE Looking forward to 2014, the influence of the shale-based energy fields has dramatically changed the landscape, providing potential energy self-sufficiency in North America; a situation that was previously unimagined. The products and services needed to service these markets have changed which has impacted our energy products segment. We have been and will continue to evaluate and adapt to this market. In 2014, even though steel prices have started to recover, we believe the uncertainty for the last two years will continue but the overall tone should improve. We believe the signs of improvement in various manufacturing and construction markets will continue to strengthen and give an overall positive direction to the results. Brian R. Hedges President & Chief Executive Officer RUSSEL METALS INC ANNUAL REPORT

5 Russel Metals Inc. FINANCIAL HIGHLIGHTS < Years ended > OPERATING RESULTS (millions) Revenues $3,187.8 $3,000.1 $2,693.3 $2,178.0 Net earnings (2) EBIT (2) Adjusted EBIT (Note) (1) (2) (1) Adjusted EBIT as a % of revenue 4.7% 5.8% 7.3% 5.1% Adjusted EBITDA (Note) (1) (1) EBITDA as a % of revenue 5.8% 6.7% 8.2% 6.3% Basic earnings per common share ($) $1.37 $1.63 (2) $1.97 $0.96 BALANCE SHEET INFORMATION (millions) Metals Accounts receivable $455.9 $455.6 $381.7 $300.5 Inventories Prepaid expenses and other assets Accounts payable and accruals (383.7) (381.5) (343.6) (259.8) Net working capital - Metals Fixed assets Goodwill and intangibles Net assets employed in metals operations 1, , Other operating assets Net income tax assets (liabilities) (11.3) (8.2) (12.0) (11.5) Pension and benefit assets (liabilities) (23.1) (38.7) (33.3) (17.2) Other corporate assets and liabilities (42.6) (47.3) (22.1) (11.9) Total net assets employed $1,224.6 $1,184.4 $846.5 $776.8 CAPITALIZATION (millions) Bank indebtedness, net of (cash) ($116.2) ($100.8) ($270.7) ($323.7) Long-term debt (incl. current portion) Total interest bearing debt, net of (cash) (4.0) Market capitalization 1, , , ,373.5 Total firm value $2,255.3 $2,017.2 $1,373.9 $1,369.5 OTHER INFORMATION (Notes) Shareholders' equity (millions) $882.4 $829.4 $819.4 $772.8 Book value per share ($) $14.48 $13.78 $13.64 $12.88 Free cash flow (millions) $91.9 $99.4 $129.5 $85.7 Capital expenditures (millions) $27.2 $33.7 $18.1 $11.6 Depreciation and amortization (millions) $33.6 $25.5 $23.5 $25.3 Earnings multiple Firm value as a multiple of EBIT (1) Firm value as a multiple of EBITDA (1) Interest bearing debt/ebitda (1) Debt as a % of capitalization 34% 35% 27% 29% Market capitalization as a % of book value 217% 200% 164% 178% Return on equity 9% 12% 14% 7% Return on capital employed 12% 15% 23% 14% (1) COMMON SHARE INFORMATION Ending outstanding common shares 60,946,393 60,204,636 60,071,698 59,978,173 Average outstanding common shares 60,780,520 60,128,534 60,043,222 59,717,629 Dividend yield 4.5% 5.1% 5.4% 4.8% Dividend per share $1.40 $1.40 $1.20 $1.10 Share price - High $31.62 $28.97 $27.75 $23.94 Share price - Low $23.23 $22.52 $18.90 $16.25 Share price - Ending $31.39 $27.61 $22.42 $22.90 Notes: (1) Adjusted EBIT excludes the asset impairment charge in 2013 of $5.2 million and the inventory reversal of $1.9 million and plant closure costs of $2.6 million in (2) Restated due to adoption of IAS 19 (Amended 2011) (3) This chart includes certain financial measures that are not prescribed by International Financial Reporting Standards (IFRS) or have standardized meanings, and thus, may not be comparable to similar measures presented by other companies, for example EBIT and EBITDA and Other Information. Management believes that EBIT and EBITDA may be useful in assessing our operating performance and as an indicator of our ability to service or incur indebtedness, make capital expenditures and finance working capital requirements. EBIT and EBITDA should not be considered in isolation or as an alternative to cash from operating activities or other combined income or cash flow data prepared in accordance with IFRS. EBIT, EBITDA and a number of the ratios provided under Other Information are used by debt and equity analysts to compare our performance against other public companies. This terminology is defined on the inside back cover. See financial statements for IFRS earnings. RUSSEL METALS INC ANNUAL REPORT
 Metals Accounts receivable $455.9 $455.6 $381.7 $300.5 Inventories 766.3 764.0 645.6 544.1 Prepaid expenses and other assets 5.9 7.1 4.3 2.")
6 MANAGEMENT'S RESPONSIBILITY FOR FINANCIAL REPORTING The accompanying consolidated financial statements, Management's Discussion and Analysis of Financial Condition and all information in the Annual Report have been prepared by management and approved by the Audit Committee and the Board of Directors of the Company. These consolidated financial statements were prepared in accordance with International Financial Reporting Standards, as issued by the International Accounting Standards Board, and, where appropriate, reflect management's best estimates and judgements. Management is responsible for the accuracy, integrity and objectivity of the consolidated financial statements and Management's Discussion and Analysis of Financial Condition within reasonable limits of materiality and for the consistency of financial data included in the text of the Annual Report with that contained in the consolidated financial statements. To assist management in the discharge of these responsibilities, the Company has developed, documented and maintained a system of internal controls in order to provide reasonable assurance that its assets are safeguarded; that only valid and authorized transactions are executed; and that accurate, timely and comprehensive financial information is prepared in accordance with International Financial Reporting Standards. In addition, the Company has developed and maintained a system of disclosure controls in order to provide reasonable assurance that the financial information is relevant, reliable and accurate. The Company has evaluated its internal and disclosure controls for the year ended December 31, 2013, and has disclosed the results of this evaluation in its Management Discussion and Analysis of Financial Condition. The Company's Audit Committee is appointed annually by the Board of Directors. The Audit Committee, which is composed entirely of outside directors, meets with management to satisfy itself that management is properly discharging its financial reporting responsibilities and to review the consolidated financial statements and the Management's Discussion and Analysis of Financial Condition. The Audit Committee reports its findings to the Board of Directors for consideration in approving the consolidated financial statements and the Management's Discussion and Analysis of Financial Condition for presentation to the shareholders. The consolidated financial statements have been audited on behalf of the shareholders by the external auditors, Deloitte LLP, in accordance with Canadian generally accepted auditing standards. Deloitte LLP has full and free access to the Audit Committee. February 19, 2014 B. R. Hedges M. E. Britton President and Executive Vice President and Chief Executive Officer Chief Financial Officer RUSSEL METALS INC ANNUAL REPORT

7 RUSSEL METALS INC. MANAGEMENT'S DISCUSSION AND ANALYSIS OF FINANCIAL CONDITION AND RESULTS OF OPERATIONS FOR THE YEAR ENDED DECEMBER 31, 2013 This Management's Discussion and Analysis of Financial Condition and Results of Operations ("MD&A") of Russel Metals Inc. and its subsidiaries provides information to assist readers of our audited Consolidated Financial Statements for the year ended December 31, 2013, including the notes thereto and should be read in conjunction with these financial statements. All dollar references in our financial statements and in this report are in Canadian dollars unless otherwise stated. Additional information related to Russel Metals Inc., including our Annual Information Form, may be obtained from SEDAR at or on our website at Unless otherwise stated, the discussion and analysis contained in this MD&A are as of February 19, FORWARD-LOOKING STATEMENTS Certain statements contained in this MD&A constitute forward-looking statements or information within the meaning of applicable securities laws, including statements as to our future capital expenditures, our outlook, the availability of future financing and our ability to pay dividends. Forward-looking statements relate to future events or our future performance. All statements, other than statements of historical fact, are forward-looking statements. Forward-looking statements are often, but not always, identified by the use of words such as "seek", "anticipate", "plan", "continue", "estimate", "expect", "may", "will", "project", "predict", "potential", "targeting", "intend", "could", "might", "should", "believe" and similar expressions. Forward-looking statements are necessarily based on estimates and assumptions that, while considered reasonable by us, inherently involve known and unknown risks, uncertainties and other factors that may cause actual results or events to differ materially from those anticipated in such forward-looking statements, including the factors described below. We are subject to a number of risks and uncertainties which could have a material adverse effect on our future profitability and financial position, including the risks and uncertainties listed below, which are important factors in our business and the metals distribution industry. Such risks and uncertainties include, but are not limited to: the current economic climate; volatility in metal prices; volatility in oil and natural gas prices; cyclicality of the metals industry and the industries that purchase our products; lack of credit availability that may limit the ability of our customers to obtain credit or expand their businesses; significant competition that could reduce our market share; the interruption in sources of metals supply; the integration of future acquisitions, including successfully adapting to a public company control environment and retaining key acquisition management personnel; failure to renegotiate any of our collective agreements and work stoppages; disruption in our customer or suppliers' operations due to labour disruptions or the existence of events or circumstances that cause a force majeure; environmental liabilities; environmental concerns or changes in government regulations in general, and those related to oil sands production, shale fracking or oil distribution in particular; changes in government regulations relating to workplace safety and worker health; currency exchange risk, particularly between the Canadian and U.S. dollar; the failure of our key computer-based systems, including our enterprise resource and planning systems; the failure to implement new technologies; the loss of key individuals; the inability to access affordable financing, capital or insurance; interest rate risk; dilution; and change of control. While we believe that the expectations reflected in our forward-looking statements are reasonable, no assurance can be given that these expectations will prove to be correct, and our forward-looking statements included in this MD&A should not be unduly relied upon. These statements speak only as of the date of this MD&A and, except as required by law, we do not assume any obligation to update our forward-looking statements. Our actual results could differ materially from those anticipated in our forward-looking statements including as a result of the risk factors described above and under the heading "Risk" later in this MD&A, and in our filings with securities regulatory authorities which are available on SEDAR at Specific reference is made to our most recent Annual Information Form for a further discussion of some of the factors underlying our forward-looking statements. RUSSEL METALS INC ANNUAL REPORT

8 NON-GAAP MEASURES This MD&A includes a number of measures that are not prescribed by Canadian generally accepted accounting principles ("GAAP") and as such may not be comparable to similar measures presented by other companies. We believe these measures are commonly employed to measure performance in our industry and are used by analysts, investors, lenders and other interested parties to evaluate financial performance and our ability to incur and service debt to support our business activities. The measures we use are specifically defined where they are first used in this report. While we believe that non-gaap measures are helpful supplemental information, they should not be considered in isolation as an alternative to net income, cash flows generated by operating, investing or financing activities, or other financial statement data presented in accordance with GAAP. OVERVIEW We are one of the largest metals distribution companies in North America. We conduct business primarily in three metals distribution segments: metals service centers, energy products, and steel distributors. We were again active in 2013 completing three acquisitions to complement our Apex Distribution operation in the energy products segment. The following summarizes these activities: (i) (ii) (iii) On December 2, 2013, we completed the acquisition of Monarch Supply, a oilfield supply operation located in Drayton Valley, Alberta for a purchase price consisting of a cash payment of $32 million and future cash payments contingent on future earnings over the next five years ending December 31, 2018 estimated at $10 million. On September 14, 2013, we completed the acquisition of Northern Valve Services, a valve service center with a store in Fort St. John, British Columbia. On September 12, 2013, we completed the acquisition of Keystone Oilfield, an oilfield supply company with stores operating in Virden, Manitoba and Moosomin and Wawaota, Saskatchewan. The purchase price for Northern Valve Services and Keystone Oilfield totaled $11 million. Our 2013 revenues increased 6%, mainly due to the acquisition of Apex Distribution in November 2012 which generated revenues of $455 million in On a same store basis we experienced declining volumes and lower selling prices resulting in a decline in revenue. Gross margin dollars are up year over year due to revenue increases in our energy products segment. Operating expenses in our energy products segment increased due to volumes and our acquisitions in 2012 and Earnings were negatively impacted by an asset impairment charge of $5 million at our Thunder Bay Terminal operation and inventory write-downs of $19 million at our energy products operations. We recorded finance income of $4 million related to a fair value adjustment reducing the Apex Distribution contingent consideration liability. This income included $10 million relating to a decrease in the expected payments offset by imputed interest on expected payments. Our earnings for 2013 were $83 million compared to $98 million in Earnings per share were $1.37 for 2013 compared to $1.63 for Our return on equity was 9%. RUSSEL METALS INC ANNUAL REPORT

9 SUMMARIZED FINANCIAL INFORMATION The table discloses selected information related to revenues, earnings and common share information over the last eight quarters Quarters Ended Year (in millions, except Ended per share data and volumes) Mar. 31 June 30 Sept. 30 Dec. 31 Dec. 31 Revenues $ $ $ $ $ 3,187.8 Earnings from operations Net earnings Basic earnings per common share $ 0.36 $ 0.33 $ 0.31 $ 0.37 $ 1.37 Diluted earnings per common share $ 0.36 $ 0.33 $ 0.31 $ 0.37 $ 1.37 Market price of common shares High $ $ $ $ $ Low $ $ $ $ $ Shares outstanding end of quarter 60,818,240 60,866,902 60,890,252 60,946,393 60,946,393 Number of common shares traded 9,940,048 12,806,749 7,978,646 9,523,684 40,249, Quarters Ended (restated) Year (in millions, except Ended per share data and volumes) Mar. 31 June 30 Sept. 30 Dec. 31 Dec. 31 Revenues $ $ $ $ $ 3,000.1 Earnings from operations Net earnings Basic earnings per common share $ 0.55 $ 0.37 $ 0.37 $ 0.34 $ 1.63 Diluted earnings per common share $ 0.53 $ 0.37 $ 0.37 $ 0.34 $ 1.62 Market price of common shares High $ $ $ $ $ Low $ $ $ $ $ Shares outstanding end of quarter 60,102,823 60,129,973 60,155,948 60,204,636 60,204,636 Number of common shares traded 14,759,969 9,475,372 10,831,800 10,378,377 45,445,518 RUSSEL METALS INC ANNUAL REPORT

10 RESULTS OF OPERATIONS The following table provides operating profits before interest, other finance income or expense, asset impairment and income taxes. The corporate expenses included are not allocated to specific operating segments. Gross margins (revenue minus cost of sales) as a percentage of revenues for the operating segments are also shown below. The table shows the segments as they are reported to management and are consistent with the segment reporting in our consolidated financial statements Change (in millions, except percentages) 2013 (restated) as a % of 2012 Segment Revenues Metals service centers $ 1,455.6 $ 1,581.1 (8%) Energy products 1, , % Steel distributors (19%) Other $ 3,187.8 $ 3, % Segment Operating Profits Metals service centers $ 71.7 $ (30%) Energy products % Steel distributors (37%) Corporate expenses (17.8) (21.1) (16%) Other (1.0) 0.5 Operating profits $ $ (14%) Segment Gross Margin as a % of Revenues Metals service centers 20.5% 20.5% Energy products 15.4% 13.5% Steel distributors 12.5% 14.0% Total operations 17.7% 17.4% Segment Operating Profit as a % of Revenues Metals service centers 4.9% 6.5% Energy products 5.5% 6.0% Steel distributors 6.7% 8.6% Total operations 4.7% 5.8% Note: 2012 restatement relates to adoption of a new Employee Benefits standard. See Note 2 of our 2013 financial statements. RUSSEL METALS INC ANNUAL REPORT

11 METALS SERVICE CENTERS a) Description of operations We provide processing and distribution services to a broad base of approximately 39,000 end users through a network of 53 Canadian locations and 12 U.S. locations. Our metals service centers carry a broad line of products in a wide range of sizes, shapes and specifications, including carbon hot rolled and cold finished steel, pipe and tubular products, stainless steel and aluminum. We purchase these products primarily from steel producers in North America and process and package them in accordance with end user specifications. We service all major geographic regions of Canada and the Southeastern and Midwestern regions in the United States. Within Canada, our service centers operate under the names Russel Metals, Métaux Russel, A.J. Forsyth, Acier Leroux, Acier Loubier, Acier Richler, Alberta Industrial Metals, B&T Steel, Leroux Steel, Mégantic Métal, Russel Metals Specialty Products, Métaux Russel Produits Spécialisés, McCabe Steel, Siemens Laserworks and York-Ennis. Our U.S. service centers operate under the names Russel Metals Williams Bahcall, JMS Russel Metals, Norton Metals and Baldwin International. b) Factors affecting results The following is a general discussion of the significant factors affecting our metals service centers results. More specific information on how these factors impacted 2013 and 2012 is found in the section that follows. Steel prices fluctuate significantly throughout the steel cycle. Steel prices are influenced by overall demand, trade sanctions, iron ore prices, scrap steel prices and product availability. Steel prices declined slightly during the first half of 2013 and stabilized in the third quarter of Supply side management, practiced by steel producers in North America, and international supply and demand, which impacts steel imports, affects product availability. Trade sanctions are initiated either by steel mills or by government agencies in North America. Demand for our product is significantly affected by economic cycles. Revenues and operating profits fluctuate with the level of general business activity in the markets served. We are most impacted by the manufacturing, resource and construction segments of the North American economy. Canadian service centers, which represent the majority of our metals service center operations, have operations in all regions of Canada and are affected by general regional economic conditions. Our large market share and our diverse customer base of approximately 22,000 customers mean that our results tend to mirror the performance of the regional economies of Canada. Our U.S. operations, which have approximately 17,000 customers, are impacted by the local economic conditions in the regions that they serve. The change in the Canadian dollar in 2013 versus 2012 resulted in a less than 1% increase in revenues and profits for our U.S. operations translated to Canadian dollars. Revenues and profits of our U.S. operations reported for 2013 were converted at $ per US$1 compared to $ per US$1 for The exchange rate at December 31, 2013 used to translate the balance sheet was $ per US$1 versus $ per US$1 at December 31, Our Canadian operations can be affected by the U.S. dollar exchange rate since some products are sourced outside of Canada and are priced in U.S. dollars. Movement in the Canadian dollar has a short-term impact on inventory prices. c) Metals service centers segment results compared to 2012 Revenues for 2013 decreased 8% to $1.5 billion compared to 2012 revenues of $1.6 billion. The average selling price of metal for 2013 was approximately 7% lower than the average selling price for The lower average selling price was a result of the general economic slowdown which started in 2012 and lower metal prices. Tons shipped in metals service centers approximated the tons shipped in Tons shipped in 2013 compared to 2012 increased 3% in our U.S. metal service centers and decreased by 2% in our Canadian metals service centers. The Metals Service Center Institute reported an increase in tons shipped for the industry of less than 1% in the U.S. for 2013; however, for Canada they reported a decrease of 6%. Gross margin dollars for 2013 were $25 million lower than 2012 due to lower selling prices. Gross margin as a percentage of revenues was 20.5% for 2013 and Our average revenue per invoice for 2013 was approximately $1,635 compared to $1,806 for 2012, reflecting lower selling prices. We handled approximately 3,562 transactions per day in 2013 compared to 3,502 per day for 2012, an increase of 2%. RUSSEL METALS INC ANNUAL REPORT

12 Operating expenses for 2013 increased $6 million or 3%, from 2012 mainly related to the effect of the decline in the Canadian dollar on the conversion of our U.S. operations and higher depreciation of $2 million due to investments in processing equipment. Operating expenses as a percentage of revenue increased from 14% for 2012 to 16% for 2013 due to lower revenues, but tons shipped compared to 2012 were consistent. Metals service centers operating profits for 2013 decreased by 30% to $72 million from $102 million in The decrease was due to lower gross margin dollars and higher operating expenses. ENERGY PRODUCTS a) Description of operations These operations distribute oil country tubular goods (OCTG), line pipe, tubes, valves and fittings, primarily to the energy industry in Western Canada and the United States. A significant portion of our business units are clustered in Alberta, Canada, and in the U.S., in Colorado and Texas. A large portion of our inventories are located in third party yards ready for distribution to customers throughout North America. In addition, we operate from 59 Canadian and 18 U.S. facilities mainly to support our valve and fitting operations. The majority of these facilities are oil field stores which form the Apex Distribution network. We purchase our products from the pipe division of North American steel mills, independent manufacturers of pipe, valves and fittings, international steel mills or other distributors. Our energy products segment operates under the names Apex Distribution, Apex Monarch, Apex Remington, Comco Pipe and Supply Company, Fedmet Tubulars, Triumph Tubular & Supply, Pioneer Pipe and Spartan Energy Tubulars. b) Factors affecting results The following is a general discussion of the factors affecting our energy products segment operations. More specific information on how these factors impacted 2013 and 2012 is found in the section that follows. The price of natural gas and oil can impact rig count and drilling activities, particularly in Western Canada. Rig activity affects demand for our products. The price of oil softened during 2013 compared to the levels in Rig activity for 2013 approximated that of Activity in Western Canada is dependent on Canadian oil prices which are below U.S. oil prices due to additional refining requirements and a shortage of pipeline capacity. Natural gas prices are at very low levels and thus drilling activity related to gas is well below historical levels. Fracking technology, applied to horizontal drilling, enables producers to economically drill in oil and gasrich shale fields and remains the focus of our OCTG sales efforts. The change to horizontal drilling as well as the reduction in gas drilling has required us to write-down inventory traditionally used in these areas. Sales of larger diameter pipe for use in mid-stream distribution feeder lines was a very active area for our U.S. operations in 2012 and early 2013 as new shale fields were developed and their output connected to existing pipelines. Prices for pipe products are influenced by overall demand, trade sanctions and product availability. Trade sanctions are initiated either by steel mills or by government agencies in North America. Both the Canadian and U.S. governments have imposed duties on certain Chinese pipe, which remain in effect and reduce imports of these products. The U.S. government has also initiated a review of pipe from India, South Korea and number of other countries. Pricing of valves and fittings are not as sensitive to steel price fluctuations. Our Canadian operations can be affected by the U.S. dollar exchange rate since some products are sourced outside of Canada and are priced in U.S. dollars. Movement in the Canadian dollar impacts the cost of inventory and cost of sales. Drilling related to oil and natural gas in Western Canada historically peaks during the period from October to March. c) Energy products segment results compared to 2012 Revenues increased to $1.4 billion for 2013, an increase of 36%, compared to 2012 primarily due to the Apex Distribution acquisition. On a same store basis revenues have decreased 7%, related to decreases at our Canadian operation servicing the oil sands and our U.S. line pipe operation, offset by increases at our operations servicing oil drilling activity in Canada. Gross margin as a percentage of revenue was 15.4% for 2013 compared to 13.5% in 2012 due to higher margins at the Apex Distribution operations. RUSSEL METALS INC ANNUAL REPORT

13 Operating expenses on a same store basis were consistent with Apex Distribution has higher operating expenses as a percentage of revenues. Operating profits increased to $79 million for 2013 compared to $63 million for 2012, related to strong earnings from Apex Distribution offset by lower earnings at our other energy products operations triggered by inventory write-downs. STEEL DISTRIBUTORS a) Description of operations Our steel distributors act as master distributors selling steel in large volumes to other steel service centers and equipment manufacturers mainly on an "as is" basis. Our U.S. operation has a cut-to-length facility in Houston, Texas where it processes coil for its customers. Our steel distributors source their steel both domestically and off shore. The main steel products sourced by this segment are structural beam, plate, coils, pipe and tubing; however, product volumes vary based on the economy and trade actions in North America. Our steel distributors operate under the names Wirth Steel and Sunbelt Group. Arrow Steel, a division of Sunbelt Group, processes coils. b) Factors affecting results The following is a general discussion of the significant factors affecting our steel distributors. More specific information on how these factors impacted 2013 and 2012 is found in the section that follows. Steel prices are influenced by overall demand, trade sanctions and product availability both domestically and worldwide. Trade sanctions are initiated either by steel mills or government agencies in North America. Trade actions currently exist on plate and pipe from specified countries. Steel imports are affected both by mill capacity by product line in North America, as well as international supply and demand. In addition, these factors significantly affect product availability in North America. During 2013, lead times for deliveries from North American mills remained short due to excess capacity which reduced demand for imports and increased price risk leading to decreased activity at steel distributors. Demand for steel that is sourced off shore fluctuates significantly and is mainly driven by price and product availability in North America. Our steel distributors have a significant number of customers who buy product from them on a periodic basis which can result in large fluctuations in revenues reported from period to period. Our Canadian operations source product outside of Canada that is priced in U.S. dollars and may be subject to movement in the Canadian dollar. c) Steel distributors segment results compared to 2012 Steel distributors revenues decreased 19% to $283 million for 2013 compared to 2012 due to short lead times and availability from North American mills coupled with lower demand and cautious inventory stocking positions in the service center industry and at equipment manufacturers. Gross margin as a percentage of revenues was 12.5% for 2013 compared to 14.0% for This decline related to compressed margins due to weaker demand for steel and lower prices in Operating expenses for 2013 were $2 million lower than 2012 as a result of lower variable compensation. Operating profits for 2013 were $19 million compared to $30 million in This decrease was mainly due to lower demand and lower gross margins. CORPORATE EXPENSES COMPARED TO 2012 Corporate expenses were $17 million in 2013 compared to $21 million in Corporate expenses were lower mainly due to lower variable compensation as a result of lower earnings, and lower legal and consulting fees related to smaller acquisitions in 2013 compared to RUSSEL METALS INC ANNUAL REPORT
 Description of operations Our steel distributors act as master distributors selling steel in large volumes to other steel service centers and equipment manufacturers mainly on")
14 CONSOLIDATED RESULTS COMPARED TO 2012 Operating profits from operations were $151 million in 2013 compared to $175 million in 2012 due to a reduction in selling prices at metals service centers, lower volumes at steel distributors and inventory losses at certain of our energy products operations. These decreases were offset by the positive contribution of Apex Distribution. ASSET IMPAIRMENT Our revenues and operating profits described as other in our reporting includes the operations of a bulk handling terminal in Thunder Bay, Ontario. This operation transfers coal, potash and other bulk products from rail to ship for movement on the Great Lakes. During 2013, volumes handled continued to deteriorate and expenses increased due to increased property taxes that we are currently challenging, resulting in operating losses. These changes were key indicators that led us to review the carrying value of these long-lived assets for impairment during the 2013 third quarter. This review resulted in a write-down of $5 million in the terminal's property, plant and equipment. INTEREST EXPENSE AND INCOME Net interest expense was $36 million for 2013 compared to $33 million for 2012, reflecting the higher debt outstanding after the issuance of our Canadian Senior Notes in April 2012 and utilization of available cash for our acquisitions. OTHER FINANCE INCOME AND EXPENSE Other finance income was $5 million for 2013 compared to an expense of $6 million for In 2013, we recorded income from a change in fair value of $4 million associated with the expected contingent consideration related to the Apex Distribution acquisition. This fair value adjustment is comprised of a reduction in the expected payment of $10 million offset by imputed interest on the expected future payments. The 2012 other finance expense primarily related to costs associated with the redemption of our U.S. Notes in INCOME TAXES We recorded a provision for income taxes of $32 million in 2013 compared to $39 million for Our effective income tax rate for 2013 was 27.6% compared to 28.4% for The effective income tax rate was lower due to the change in fair value of the contingent consideration related to the Apex Distribution acquisition which was not tax effected. NET EARNINGS Net earnings for 2013 were $83 million compared to $98 million in Basic earnings per share for 2013 were $1.37 per share compared to $1.63 per share in SHARES OUTSTANDING AND DIVIDENDS The weighted average number of common shares outstanding for 2013 was 60,780,520 compared to 60,128,534 for The weighted average number of common shares outstanding has increased as a result of the exercise of options. Common shares outstanding at December 31, 2013 were 60,946,393 and at February 12, 2014 were 60,949,528. We paid common share dividends of $85 million or $1.40 per share in 2013 compared to $81 million or $1.35 per share in We have $175 million of 7.75% Convertible Unsecured Subordinated Debentures outstanding which mature on September 30, Each debenture is convertible into common shares at the option of the holder at any time on or prior to the business day immediately preceding (i) the maturity date, or (ii) the date specified for redemption of the Convertible Debentures, at a conversion price of $25.75 per share being a conversion rate of common shares per $1,000 principal amount of Convertible Debentures. During the year ended December 31, 2013, Convertible Debentures having a principal amount of $132,000 were converted into 5,124 common shares. We issued $300 million 6.0% Senior Notes due April 19, The indenture for our Senior Notes has restrictions related to the payment of quarterly dividends in excess of $0.35 per share. We currently have a basket of approximately $157 million available for restricted payments, which is adjusted for 50% of our net earnings or losses on a quarterly basis. This basket would be available for increased dividend payments. RUSSEL METALS INC ANNUAL REPORT

15 Under our syndicated bank facility, the payment of dividends is subject to excess borrowing base availability of not less than four times the declared dividend. We do not believe this requirement will restrict our ability to pay dividends as our borrowing base, which is based on percentages of accounts receivable and inventories, has traditionally been in excess of our borrowings plus four times the current dividend. In addition, we believe we would be able to finance our short-term cash requirements with alternate financing structures and pay the dividend. EBITDA The following table shows the reconciliation of net earnings to EBITDA: (millions) (restated) Net earnings $ 83.3 $ 97.9 Provision for income taxes Interest and finance expense, net Asset impairment charges Adjusted earnings before interest, finance and income taxes Depreciation and amortization Adjusted earnings before interest, finance, income taxes, depreciation and amortization (adjusted EBITDA) $ $ We believe that EBITDA, a non-gaap measure, may be useful in assessing our operating performance and as an indicator of our ability to service or incur indebtedness, make capital expenditures and finance working capital requirements. The items excluded in determining adjusted EBITDA are significant in assessing our operating results and liquidity. Therefore, adjusted EBITDA should not be considered in isolation or as an alternative to cash from operating activities or other combined income or cash flow data prepared in accordance with GAAP. Depreciation and amortization increased due to increased fixed assets and customer intangibles, primarily as a result of the acquisition of Apex Distribution. CAPITAL EXPENDITURES Capital expenditures were $27 million in 2013 compared to $34 million in Depreciation expense was $27 million in 2013 compared to $24 million in The increase in depreciation expense relates to acquisitions made in 2012 and additional processing equipment acquired. We expect capital expenditures to exceed depreciation in the short term due to the purchase of additional processing equipment, the relocation and expansion of service center locations and an upgrade of our computer systems. LIQUIDITY At December 31, 2013, we had cash of $116 million compared to $115 million at December 31, We generated $119 million from operations during 2013 and $22 million from reduced working capital. We utilized $27 million investing in capital expenditures, utilized $43 million to complete three energy products segment acquisitions and returned $85 million to shareholders through dividends. We experience significant swings in working capital which impact cash flow. Inventory and accounts receivable represent a large percentage of our total assets employed and vary throughout each cycle. Accounts receivable and inventory comprise our largest liquidity risks. Our customers are impacted by the economic climate and thus it is possible to experience bad debts and increased days outstanding for accounts receivable, which may affect the timing of collections. Total assets were $1.8 billion at December 31, 2013 and At December 31, 2013 and 2012 current assets excluding cash represented 73% of our total assets excluding cash. RUSSEL METALS INC ANNUAL REPORT

16 Reductions in inventory generated cash of $22 million in Inventories reported at December 31, 2013 are higher due to acquisitions and the decline in the Canadian dollar increasing the value of inventories located in the U.S. when translated to Canadian dollars. Inventories represented 42% of our total assets at December 31, 2013 and Inventory by Segment Dec. 31 Sept. 30 June 30 Mar. 31 Dec. 31 (millions) Metals service centers $ 259 $ 247 $ 255 $ 268 $ 274 Energy products Steel distributors Total $ 766 $ 734 $ 770 $ 772 $ 764 Quarters Ended Inventory Turns Dec. 31 Sept. 30 June 30 Mar. 31 Dec Metals service centers Energy products Steel distributors Total At December 31, 2013, our metals service centers inventories were approximately 4% lower based on tons and were priced at lower values compared to December 31, This segment had reduced inventory levels due to price uncertainty. Our energy products operations had inventory at the end of 2013 higher than 2012 to support the anticipated stronger first quarter in Our steel distributors segment had lower inventory levels at lower values compared to the end of Lower revenues compared to fourth quarter 2012 reduced turns. Accounts receivable generated cash of $19 million due to strong collections at year end and represented 25% of our total assets at December 31, 2013 and During 2013, we made income tax payments of $35 million compared to $60 million for The balances disclosed in our consolidated cash flow statements are adjusted to remove the non-cash component related to foreign exchange rate fluctuations impacting inventory, accounts receivable, accounts payable and income tax balances of our U.S. operations. FREE CASH FLOW (millions) Cash from operating activities before non-cash working capital $ $ Purchase of property, plant and equipment (27.2) (33.7) $ 92.0 $ 99.4 We believe that free cash flow may be useful in assessing our ability to pay dividends, reduce outstanding debt and fund working capital growth. Free cash flow is a non-gaap measure regularly used by investors and analysts to evaluate companies RUSSEL METALS INC ANNUAL REPORT
 2013 2013 2013 2013 2012 Metals service centers $ 259 $ 247 $ 255 $ 268 $ 274 Energy products 433 420 427 420 411 Steel distributors 74 67 88 84 79 Total $ 766 $ 734 $ 770 $ 772 $ 764")
17 CASH, DEBT AND CREDIT FACILITIES Debt As at December 31 (millions) Long-term debt 6.0% $300 million Senior Notes due April 19, 2022 $ 294 $ % $175 million Convertible Debentures due September 30, Finance leases obligations, maturing 2014 to Current portion (1) (2) $ 457 $ 454 Our Convertible Debentures have been split between debt and equity. The debt allocated to equity is accreted as a charge through interest expense over the life of the debentures. The amount allocated to equity represented the valuation of the holders' option to convert the Convertible Debentures into common shares. Based on current share prices we would expect the Convertible Debentures to be converted to equity at redemption or maturity which would result in 6,790,602 common shares being issued. Cash and Bank Credit Facilities Russel Metals U.S. Subsidiary As at December 31, 2013 (millions) Facility Facility Total Bank loans $ - $ - $ - Cash net of outstanding cheques Net cash Letters of credit (24) (4) (28) $ 91 $ (3) $ 88 Facilities Borrowings and letters of credit $ 275 $ 21 $ 296 Letters of credit Facilities availability $ 325 $ 21 $ 346 Available line based on borrowing base $ 325 $ 21 $ 346 We have a credit facility with a syndicate of Canadian and U.S. banks totaling $325 million which was amended and extended to June 24, 2017 during The new syndicated facility consists of availability of $275 million under Tranche I to be utilized for borrowings and letters of credit, and $50 million under Tranche II to be utilized only for letters of credit. Letters of credit are issued under Tranche II first and additional needs are issued under Tranche I. The borrowings and letters of credit are available on a revolving basis, up to an amount equal to the sum of specified percentages of our eligible accounts receivable and inventories, to a maximum of $325 million. As of December 31, 2013, we were entitled to borrow and issue letters of credit totaling $325 million under this facility. At December 31, 2013, we had no borrowings and $24 million of letters of credit outstanding. At December 31, 2012 we had borrowings of $37 million and letters of credit of $37 million. In July 2013, we renewed our U.S. subsidiary facility with an expiry of July The maximum borrowings under this facility, including letters of credit, are US$20 million. At December 31, 2013, our U.S. subsidiary had no borrowings under this facility and had letters of credit of US$4 million. At December 31, 2012, this subsidiary had no borrowings under this facility and had letters of credit of US$21 million. With our cash, cash equivalents and our bank facilities we have access to approximately $409 million of cash based on our December 31, 2013 balances. The use of our bank facilities has been predominantly to fund working capital requirements, acquisitions and trade letters of credit for inventory purchases. These lines may be used to support increased working capital needs when volumes and steel prices increase. RUSSEL METALS INC ANNUAL REPORT

18 CONTRACTUAL OBLIGATIONS As at December 31, 2013, we were contractually obligated to make payments as per the following table: Contractual Obligations Payments due in and (millions) 2014 and 2016 and 2018 thereafter Total Accounts payable $ $ - $ - $ - $ Debt Long-term debt interest Finance lease obligations Operating leases Total $ $ $ 58.9 $ $ 1,168.5 As part of the purchase consideration for Apex Distribution we agreed to pay additional consideration during the five years ending 2017 based on earnings before interest and taxes and return on net assets. The fair value of this consideration was $38 million at December 31, The obligation was decreased by $4 million in 2013 related to the change in fair value. The change in fair value is comprised of a reduction of the expected payout of $10 million offset by an increase due to imputed interest of $5 million. The amount will be reviewed quarterly and adjusted through income for increases or decreases in the liability. We have obligations related to multiple defined benefit pension plans in Canada, as disclosed in Note 15 of our 2013 consolidated financial statements. During 2013, we contributed $6 million to these plans. We expect to contribute approximately $9 million to these plans during The defined benefit obligations reported in the financial statements use different assumptions than the going concern actuarial valuations prepared for funding. In addition, the actuarial valuations provide a solvency valuation, which is a valuation assuming the plan is wound up at the valuation date. Our funding obligations reported would increase by $6 million on a solvency basis and thus additional funding could be required based on solvency if the plans were wound up. We estimate the impact of a change in the discount rate on the solvency obligation would be similar to that disclosed in Note 15 of our 2013 consolidated financial statements. We have disclosed our obligations related to environmental litigation, regulatory actions and remediation in our Annual Information Form. These obligations relate to previously divested or discontinued operations and do not relate to the metals distribution business. During the second quarter of 2013, an agreement was reached with the purchasers of one of these businesses whereby $2 million was paid into escrow to fund remediation activities in return for an indemnification for any remediation expense beyond that amount. These escrow funds were fully depleted during the 2013 third quarter. OFF-BALANCE SHEET ARRANGEMENTS Our off-balance sheet arrangements consist of the letters of credit disclosed in the bank credit facilities table and operating lease obligations disclosed in the contractual obligations table. ACCOUNTING ESTIMATES The preparation of our financial statements requires management to make estimates and judgements that affect the reported amounts. On an ongoing basis, we evaluate our estimates, including those related to bad debts, inventory net realizable value and obsolescence, useful lives of fixed assets, asset impairment, fair values, income taxes, pensions and benefits obligations, guarantees, decommissioning liabilities, contingencies, contingent consideration, litigation and assigned values on net assets acquired. We base our estimates on historical experience and on various other assumptions that are believed to be reasonable under the circumstances, the results of which form the basis for making judgements about the carrying values of assets and liabilities that are not readily apparent from other sources. Actual results may differ from these estimates. Our most significant assets are accounts receivable and inventories. RUSSEL METALS INC ANNUAL REPORT

19 Accounts Receivable An allowance for doubtful accounts is maintained for estimated losses resulting from the inability of our customers to make required payments. Assessments are based on aging of receivables, legal issues (bankruptcy status), past collection experience, current financials, credit agency reports and the experience of our credit personnel. Accounts receivable which we determine to be uncollectible are reserved in the period in which the determination is made. If the financial condition of our customers was to deteriorate, resulting in an impairment of their ability to make payments, additional allowances may be required. Our reserve for bad debts at December 31, 2013 approximates our reserve at December 31, Bad debt expense for 2013 as a percentage of revenue approximates that of Inventories We review our inventories to ensure that the cost of inventories is not in excess of its estimated net realizable value and for obsolete and slow moving product. Inventory reserves or write-downs are recorded when cost exceeds the estimated selling price less cost to sell and when product is determined to be slow moving or obsolete. Our inventory reserve level at December 31, 2013 was $6 million higher than the level at December 31, Other areas involving significant estimates and judgements include: Income Taxes We believe that we have adequately provided for income taxes based on all of the information that is currently available. The calculation of income taxes in many cases requires significant judgement in interpreting tax rules and regulations, which are constantly changing. Our tax filings are also subject to audits, which could materially change the amount of current and future income tax assets and liabilities. Any change would be recorded as a charge or reduction in income tax expense. Business Combinations We review the fair value of assets acquired for acquisitions. Where we deem it appropriate, we hire outside business valuators to assist in the assessment of the fair value of property, plant, equipment, intangibles and contingent consideration of acquired businesses. The assessment of fair values for contingent consideration requires significant judgement and is fair valued quarterly. Employee Benefit Plans Our actuaries perform a valuation, at least every three years, for each defined benefit plan to determine the actuarial present value of the benefits. The valuation uses management's assumptions for the interest rate, rate of compensation increase, rate of increase in government benefits and expected average remaining years of service of employees. While we believe that these assumptions are reasonable, differences in actual results or changes in assumptions could materially affect employee benefit obligations and future net benefit plan cost. We account for differences between actual and assumed results by recognizing differences in benefit obligations and plan performance immediately in other comprehensive income. We had approximately $93 million in plan assets at December 31, 2013, which is an increase of approximately $7 million from December 31, Due to a change in the discount rate used, our accrued benefit obligation decreased by $9 million to $116 million at December 31, 2013 compared to $125 million at December 31, The rate increased from 4% in 2012 to 4.75% in 2013 which reflects the current interest rate environment. An actuarial gain on employee future benefit plans of $11 million, net of tax, was credited to other comprehensive income in 2013 compared to a $5 million loss in CONTROLS AND PROCEDURES Disclosure controls and procedures are designed to provide reasonable assurance that all relevant information is gathered and reported to senior management on a timely basis so that appropriate decisions can be made regarding public disclosure. The purpose of internal controls over financial reporting as defined by the Canadian Securities Administrators is to provide reasonable assurance that: (i) financial statements prepared for external purposes are in accordance with the Company's generally accepted accounting principles, RUSSEL METALS INC ANNUAL REPORT

20 (ii) transactions are recorded as necessary to permit the preparation of financial statements, and records are maintained in reasonable detail, (iii) receipts and expenditures of the Company are made only in accordance with authorizations of the Company's management and directors, and (iv) unauthorized acquisitions, uses or dispositions of the Company's assets that could have a material effect on the financial statements will be prevented or detected in order to prevent material error in financial statements. The President and Chief Executive Officer and the Executive Vice President and Chief Financial Officer have caused management and other employees to design and document our disclosure controls and procedures and our internal controls over financial reporting. An evaluation of the design and operating effectiveness of the disclosure controls and internal controls over financial reporting was conducted as at December 31, The design and evaluation of internal controls utilized the framework and criteria established in "Internal Control - Integrated Framework" issued by the Committee of Sponsoring Organizations of the Treadway Commission. Based on our evaluation, we have concluded that our disclosure controls and procedures and our internal controls over financial reporting were effective to provide reasonable assurance that information related to our consolidated results and decisions to be made on those results were appropriate. VISION AND STRATEGY The metals distribution business is a segment of a mature, cyclical industry. The use of service centers by both manufacturers and end users has grown over the last decade. We strive to deal with the cyclical nature of the business by operating with the lowest possible net assets throughout the course of a cycle. This intensive asset management reduces borrowings and therefore interest expense in declining periods in the economic cycle. This in turn creates higher, more stable returns on net assets over the course of the cycle. Our conservative management approach creates relatively stronger trough earnings but could cause peak earnings to be somewhat muted. Management believes that this strategy will result in higher profits throughout a cycle and we will have average earnings over the full range of the cycle in the top deciles of the industry. Growth from selective acquisitions is also part of our strategy. We focus on investment opportunities in metals businesses that have strong market niches or provide mass to our existing operations. New acquisitions could be either major stand-alone operations or ones that complement our existing operations. In 2013, we made three acquisition to add to our Apex Distribution operations. We continue to review opportunities for acquisitions. We believe that the steel-based pricing cycle will continue to be short and volatile, and a management structure and philosophy that allows the fastest reaction to changes that affect the industry will be the most successful. We will continue to invest in our business systems to enable faster reaction times to changing business conditions. In addition, management believes the high level of service and flexibility provided by service centers will enable this distribution channel to capture an increasing percentage of the total metal market allowing for increased growth within the sector. RISK The timing and extent of future price changes from steel producers and their impact on the market cannot be predicted with any certainty due to the inherent cyclical nature of the steel industry and current low capacity utilization numbers for North American steel producers. Our Apex Distribution acquisition in 2012 and our three acquisitions in 2013 were all similar and increase our exposure to the Western Canadian oil and gas segment. We believe that this continues to be an area of growth long term; however, our exposure to the cyclicality of oil and gas pricing has increased. Management believes the acquisition of Apex Distribution provides a more stable stream of revenues and earnings for the energy products segment. For additional information on risk, see the "Forward-looking Statements" at the beginning of this document and our Annual Information Form which includes a description of each of these risks related to our business. RUSSEL METALS INC ANNUAL REPORT

NEWS FOR IMMEDIATE RELEASE RUSSEL METALS ANNOUNCES STRONGER SECOND QUARTER 2010 NET EARNINGS
 NEWS FOR IMMEDIATE RELEASE RUSSEL METALS ANNOUNCES STRONGER SECOND QUARTER 2010 NET EARNINGS TORONTO, CANADA August 11, 2010 -- Russel Metals Inc. (RUS TSX) today announced second quarter earnings of $19
Western Energy Services Corp. Condensed Consolidated Financial Statements September 30, 2015 and 2014 (Unaudited)
") Condensed Consolidated Financial Statements September 30, 2015 and 2014 (Unaudited) Condensed Consolidated Balance Sheets (Unaudited) (thousands of Canadian dollars) Note September 30, 2015 December 31,
Condensed Consolidated Financial Statements September 30, 2015 and 2014 (Unaudited) Condensed Consolidated Balance Sheets (Unaudited) (thousands of Canadian dollars) Note September 30, 2015 December 31,
DATA GROUP LTD. ANNOUNCES SECOND QUARTER FINANCIAL RESULTS FOR 2015
 For Immediate Release DATA GROUP LTD. ANNOUNCES SECOND QUARTER FINANCIAL RESULTS FOR 2015 SECOND QUARTER HIGHLIGHTS Second quarter 2015 ( Q2 ) Revenues of $73.4 million, a decrease of 4.3% year over year
DATA GROUP LTD. ANNOUNCES FIRST QUARTER RESULTS FOR 2014
 For Immediate Release DATA GROUP LTD. ANNOUNCES FIRST QUARTER RESULTS FOR 2014 HIGHLIGHTS Q1 2014 First quarter 2014 ( Q1 ) Revenues of 77.9 million, Q1 Gross Profit of 18.8 million and Q1 Net Income of
ACADIAN TIMBER CORP. REPORTS FOURTH QUARTER AND YEAR-END RESULTS
 News Release Investors, analysts and other interested parties can access Acadian Timber Corp. s 2015 Fourth Quarter Results conference call via webcast on Thursday, February 11, 2016 at 1:00 p.m. ET at
How To Profit From A Strong Dollar
 For Immediate Release MERCER INTERNATIONAL INC. REPORTS STRONG 2015 THIRD QUARTER RESULTS ANNOUNCES QUARTERLY CASH DIVIDEND OF $0.115 NEW YORK, NY, October 29, 2015 - Mercer International Inc. (Nasdaq:
2004 THIRD QUARTER REPORT TO UNITHOLDERS
 2004 THIRD QUARTER REPORT TO UNITHOLDERS Report to Unitholders The North West Company Fund reports third quarter earnings to October 30, 2004 of $11.0 million, an increase of 3.2% compared to last year
Management s Discussion and Analysis
 Management s Discussion and Analysis of Financial Conditions and Results of Operations For the quarter and six months ended June 30, 2012 All figures in US dollars This Interim Management s Discussion
This discussion and analysis contains forward-looking statements. Please refer to the cautionary language on page 19.
 This discussion and analysis of financial condition and results of operation of Thompson Creek Metals Company Inc. ( Thompson Creek or the Corporation ) is prepared as at August 7, 2008, and should be
5N PLUS INC. Condensed Interim Consolidated Financial Statements (Unaudited) For the three month periods ended March 31, 2016 and 2015 (in thousands
 For the three month periods ended March 31, 2016 and 2015 (in thousands") Condensed Interim Consolidated Financial Statements (Unaudited) (in thousands of United States dollars) Condensed Interim Consolidated Statements of Financial Position (in thousands of United States dollars)
Condensed Interim Consolidated Financial Statements (Unaudited) (in thousands of United States dollars) Condensed Interim Consolidated Statements of Financial Position (in thousands of United States dollars)
First quarter ended March 31, 2013 Sales at $422 million and adjusted earnings at $7 million
 170 INDUSTRIEL BLVD. BOUCHERVILLE (QUÉBEC) CANADA, J4B 2X3 TEL: (450) 641-2440 FAX: (450) 449-4908 PRESS RELEASE First quarter ended March 31, 2013 Sales at $422 million and adjusted earnings at $7 million
Tower International Reports Solid Third Quarter And Raises Full Year Outlook
 FOR IMMEDIATE RELEASE Tower International Reports Solid Third Quarter And Raises Full Year Outlook LIVONIA, Mich., November 3, 2011 Tower International, Inc. [NYSE: TOWR], a leading integrated global manufacturer
Performance Food Group Company Reports First-Quarter Fiscal 2016 Earnings
 NEWS RELEASE For Immediate Release November 4, 2015 Investors: Michael D. Neese VP, Investor Relations (804) 287-8126 michael.neese@pfgc.com Media: Joe Vagi Manager, Corporate Communications (804) 484-7737
TORSTAR CORPORATION REPORTS SECOND QUARTER RESULTS
 PRESS RELEASE TORSTAR CORPORATION REPORTS SECOND QUARTER RESULTS TORONTO, ONTARIO (Marketwired July 30, 2014) Torstar Corporation (TSX:TS.B) today reported financial results for the second quarter ended
AMENDED CONDENSED INTERIM CONSOLIDATED FINANCIAL STATEMENTS PERIOD ENDED JULY 31, 2015. (Expressed in Canadian Dollars)
") AMENDED CONDENSED INTERIM CONSOLIDATED FINANCIAL STATEMENTS PERIOD ENDED JULY 31, 2015 1 NOTICE OF NO AUDITOR REVIEW OF CONDENSED INTERIM CONSOLIDATED FINANCIAL STATEMENTS Under National Instrument 51-102,
AMENDED CONDENSED INTERIM CONSOLIDATED FINANCIAL STATEMENTS PERIOD ENDED JULY 31, 2015 1 NOTICE OF NO AUDITOR REVIEW OF CONDENSED INTERIM CONSOLIDATED FINANCIAL STATEMENTS Under National Instrument 51-102,
ACADIAN TIMBER CORP. REPORTS FIRST QUARTER RESULTS
 News Release Investors, analysts and other interested parties can access Acadian Timber Corp. s 2012 First Quarter Results conference call via webcast on Wednesday, May 2, 2012 at 1:00 p.m. ET at www.acadiantimber.com
CEMATRIX CORPORATION Consolidated Financial Statements (in Canadian dollars) September 30, 2015
 September 30, 2015") Consolidated Financial Statements September 30, 2015 Management s Responsibility for Financial Reporting and Notice of No Auditor Review of the Interim Consolidated Financial Statements for the Three and
Consolidated Financial Statements September 30, 2015 Management s Responsibility for Financial Reporting and Notice of No Auditor Review of the Interim Consolidated Financial Statements for the Three and
WE ARE DEFINED BY OUR VALUES
 Q1 DATA GROUP LTD. Quarter One ended March 31, 2014 WE ARE DEFINED BY OUR VALUES Our success owes much to a set of corporate values which define and drive our culture. We will be innovative, indeed visionary,
MANAGEMENT S DISCUSSION AND ANALYSIS
 NEWS RELEASE Wednesday, July 31, 2002 ALGOMA STEEL INC. 105 West Street Sault Ste. Marie, Ontario, Canada P6A 7B4 TSE Symbol: AGA Financial Results for the Second Quarter Ended June 30, 2002 SAULT STE.
Thomas A. Bessant, Jr. (817) 335-1100
 335-1100") Additional Information: Thomas A. Bessant, Jr. (817) 335-1100 For Immediate Release ********************************************************************************** CASH AMERICA FIRST QUARTER NET INCOME
Additional Information: Thomas A. Bessant, Jr. (817) 335-1100 For Immediate Release ********************************************************************************** CASH AMERICA FIRST QUARTER NET INCOME
MANAGEMENT S DISCUSSION AND ANALYSIS OF FINANCIAL CONDITION AND RESULTS OF OPERATIONS FOR THE THREE AND NINE-MONTH PERIODS ENDED SEPTEMBER 30, 2010
 MANAGEMENT S DISCUSSION AND ANALYSIS OF FINANCIAL CONDITION AND RESULTS OF OPERATIONS FOR THE THREE AND NINE-MONTH PERIODS ENDED SEPTEMBER 30, 2010 The following management s discussion and analysis of
QUARTERLY REPORT Q3 2010. Third Quarter Report for the period ended September 30, 2010
 QUARTERLY REPORT Q3 2010 Third Quarter Report for the period September 30, 2010 CIRCA ENTERPRISES INC. 2 MANAGEMENT S DISCUSSION AND ANALYSIS AS AT AND FOR THE THREE AND NINE MONTH PERIODS ENDED SEPTEMBER
Waste Management Announces Second Quarter Earnings
 FOR IMMEDIATE RELEASE Waste Management Announces Second Quarter Earnings Collection and Disposal Income from Operations Grows 3.4% HOUSTON July 26, 2012 Waste Management, Inc. (NYSE: WM) today announced
Thomas A. Bessant, Jr. (817) 335-1100
 335-1100") Additional Information: Thomas A. Bessant, Jr. (817) 335-1100 For Immediate Release ********************************************************************************** CASH AMERICA FIRST QUARTER NET INCOME
Additional Information: Thomas A. Bessant, Jr. (817) 335-1100 For Immediate Release ********************************************************************************** CASH AMERICA FIRST QUARTER NET INCOME
Ternium Announces First Quarter 2015 Results
 Sebastián Martí Ternium - Investor Relations +1 (866) 890 0443 +54 (11) 4018 2389 www.ternium.com Ternium Announces First Quarter 2015 Results Luxembourg, April 29, 2015 Ternium S.A. (NYSE: TX) today announced
Nature of operations and basis of preparation (Note 1) Commitments and contingencies (Note 10) Subsequent events (Note 12)
 Commitments and contingencies (Note 10) Subsequent events (Note 12)") Unaudited Interim Consolidated Financial Statements For the nine months ended September 30, 2005 Contents Interim Consolidated Financial Statements Interim Consolidated Balance Sheets Interim Consolidated
Unaudited Interim Consolidated Financial Statements For the nine months ended September 30, 2005 Contents Interim Consolidated Financial Statements Interim Consolidated Balance Sheets Interim Consolidated
Oceaneering Reports First Quarter 2016 Results
 PRESS RELEASE Oceaneering Reports First Quarter 2016 Results April 25, 2016 Houston, Texas Oceaneering International, Inc. ( Oceaneering or the Company ) (NYSE:OII) today reported net income of $25.1 million,
Intel Reports Second-Quarter Results
 Intel Corporation 2200 Mission College Blvd. Santa Clara, CA 95054-1549 CONTACTS: Mark Henninger Amy Kircos Investor Relations Media Relations 408-653-9944 480-552-8803 mark.h.henninger@intel.com amy.kircos@intel.com
Altus Group Reports First Quarter Financial Results for 2015
 Street Smart. World Wise. Altus Group Reports First Quarter Financial Results for 2015 Altus Group Delivers 14% Revenue Growth, Including 43% Increase in Recurring Revenues from GAIM Businesses TORONTO,
CENTURY ENERGY LTD. FORM 51-102F1 MANAGEMENT DISCUSSION AND ANALYSIS FOR THE YEAR ENDED AUGUST 31, 2014
 CENTURY ENERGY LTD. FORM 51-102F1 MANAGEMENT DISCUSSION AND ANALYSIS FOR THE YEAR ENDED AUGUST 31, 2014 The following management s discussion and analysis ( MD&A ), prepared as of December 11, 2014, should
DOLLARAMA REPORTS STRONG SALES AND NET EARNINGS INCREASES TO CLOSE FISCAL YEAR 2011
 For immediate distribution DOLLARAMA REPORTS STRONG SALES AND NET EARNINGS INCREASES TO CLOSE FISCAL YEAR 2011 MONTREAL, Quebec, April 7, 2011 Dollarama Inc. (TSX: DOL) ( Dollarama or the Corporation )
(Formerly CVTech Group Inc.)
") (Formerly CVTech Group Inc.) Condensed Interim Consolidated Financial Statements For the three months ended, 2014 Consolidated Statement of Financial Position (in thousands of Canadian dollars) December
(Formerly CVTech Group Inc.) Condensed Interim Consolidated Financial Statements For the three months ended, 2014 Consolidated Statement of Financial Position (in thousands of Canadian dollars) December
IBI Group 2014 First-Quarter Management Discussion and Analysis
 IBI Group 2014 First-Quarter Management Discussion and Analysis THREE MONTHS ENDED MARCH 31, 2014 MANAGEMENT S DISCUSSION AND ANALYSIS IBI Group Inc. For the Three Months Ended March 31, 2014 The following
FOR IMMEDIATE RELEASE
 FOR IMMEDIATE RELEASE O-I REPORTS FULL YEAR AND FOURTH QUARTER 2014 RESULTS O-I generates second highest free cash flow in the Company s history PERRYSBURG, Ohio (February 2, 2015) Owens-Illinois, Inc.
BOYD GROUP INCOME FUND
 BOYD GROUP INCOME FUND INTERIM REPORT TO UNITHOLDERS Three Months Ended March 31, 2006 BOYD GROUP INCOME FUND INTERIM REPORT TO UNITHOLDERS Three Months Ended March 31, 2006 To our Unitholders, For the
Major Drilling Reports First Quarter Results and Declares Dividend
 NEWS RELEASE Major Drilling Reports First Quarter Results and Declares Dividend MONCTON, New Brunswick (September 3, 2014) Major Drilling Group International Inc. (TSX: MDI) today reported results for
INTERACTIVE DATA REPORTS FOURTH-QUARTER AND FULL- YEAR 2014 RESULTS
 Press Release INTERACTIVE DATA REPORTS FOURTH-QUARTER AND FULL- YEAR 2014 RESULTS New York February 12, 2015 Interactive Data Corporation today reported its financial results for the fourth quarter and
CONSOLIDATED FINANCIAL STATEMENTS
 CONSOLIDATED FINANCIAL STATEMENTS (Unaudited) (Expressed in Canadian Dollar) and 2007 Index Balance Sheets Statements of Operations, Comprehensive Loss and Deficit Statements of Cash Flows Notes to Financial
Forward-Looking Statements
 MANAGEMENT S DISCUSSION AND ANALYSIS For the three months ended March 31, 2010 Dated May 21, 2010 Management's Discussion and Analysis ( MD&A ) is intended to help shareholders, analysts and other readers
CORNING INCORPORATED AND SUBSIDIARY COMPANIES CONSOLIDATED STATEMENTS OF OPERATIONS (Unaudited; in millions, except per share amounts)
") CONSOLIDATED STATEMENTS OF OPERATIONS (Unaudited; in millions, except per share amounts) Three months ended March 31, 2006 2005 As Restated Net sales $ 1,262 $ 1,050 Cost of sales 689 621 Gross margin
CONSOLIDATED STATEMENTS OF OPERATIONS (Unaudited; in millions, except per share amounts) Three months ended March 31, 2006 2005 As Restated Net sales $ 1,262 $ 1,050 Cost of sales 689 621 Gross margin
FRANKLIN ELECTRIC REPORTS RECORD SECOND QUARTER 2013 SALES AND EARNINGS
 For Immediate Release For Further Information Refer to: John J. Haines 260-824-2900 FRANKLIN ELECTRIC REPORTS RECORD SECOND QUARTER 2013 SALES AND EARNINGS Bluffton, Indiana July 30, 2013 - Franklin Electric
TUCKAMORE CAPITAL MANAGEMENT INC.
 Consolidated Interim Financial Statements of TUCKAMORE CAPITAL MANAGEMENT INC. Three and Six Months Ended June 30, 2013 and 2012 (Unaudited) These statements have not been reviewed by an independent firm
AUDIOTECH HEALTHCARE CORPORATION
 Consolidated Financial Statements of AUDIOTECH HEALTHCARE CORPORATION Year ended September 30, 2008 1 CHARTERED ACCOUNTANTS MacKay LLP 1100 1177 West Hastings Street Vancouver, BC V6E 4T5 Tel: (604) 687-4511
PRESS RELEASE RELEASE DATE: February 24, 2015
 5N Plus Inc. Reports Results for Quarter and Fiscal Year Ended December 31, 2014 PRESS RELEASE RELEASE DATE: February 24, 2015 Montreal, Québec, February 24, 2015 5N Plus Inc. (TSX:VNP), the leading producer
Sierra Wireless Reports Second Quarter 2015 Results
 Sierra Wireless Reports Second Quarter 2015 Results Q2 2015 revenue of $158 million; 17% year-over-year growth Record revenue of $158.0 million, an increase of 17.0% compared to Q2 2014 Non-GAAP earnings
Brookfield financial Review q2 2010
 Brookfield financial Review q2 2010 Overview Operating cash flow and gains totalled $327 million in the second quarter or $0.53 per share compared to $294 million in the prior year. This brings operating
NIGHTINGALE REPORTS FISCAL 2014 RESULTS
 NIGHTINGALE REPORTS FISCAL 2014 RESULTS Markham, ON, July 31, 2014 Nightingale Informatix Corporation ( Nightingale or the Company ) (TSX-V: NGH), an application service provider (ASP) of electronic health
Consolidated financial statements of. BIOX Corporation. For the three month periods ended December 31, 2010 and 2009. (Unaudited)
") Consolidated financial statements of BIOX Corporation Table of contents Consolidated statements of operations and comprehensive income (loss)... 1 Consolidated statements of deficit... 2 Consolidated balance
Consolidated financial statements of BIOX Corporation Table of contents Consolidated statements of operations and comprehensive income (loss)... 1 Consolidated statements of deficit... 2 Consolidated balance
BlackBerry Reports Software and Services Growth of 106 Percent for Q4 and 113 Percent for Fiscal 2016
 April 1, FOR IMMEDIATE RELEASE BlackBerry Reports Software and Services Growth of 106 Percent for Q4 and 113 Percent for Fiscal Company reports positive free cash flow for eighth consecutive quarter and
- Company Also Expects Leverage Ratio to Drop Below 6x by the End of Fiscal 2016 and Below 5x by the End of Fiscal 2017 -
 Performance Sports Group Expects Working Capital and Profitability Improvement Initiatives to Reduce Debt by Approximately $40 Million in the Second Half of Fiscal 2016 - Company Also Expects Leverage
BlackBerry Reports Record Software and Services Revenue for Q1 Fiscal 2017
 June 23, 2016 FOR IMMEDIATE RELEASE BlackBerry Reports Record Software and Services Revenue for Q1 Fiscal 2017 Company delivers positive non-gaap operating income and breakeven non-gaap EPS Waterloo, ON
Pizza Pizza Limited Management s Discussion and Analysis
 Pizza Pizza Limited Management s Discussion and Analysis This Management s Discussion and Analysis ( MD&A ) of financial conditions and results of operations of Pizza Pizza Limited (the Company ) covers
RESULTS OF OPERATIONS
 Management s Discussion and Analysis of Financial Conditions and Results of Operations («MD & A») should be read in conjunction with the unaudited interim consolidated financial statements for the six
AcuityAds Inc. Condensed Consolidated Interim Financial Statements. Three months ended March 31, 2014 and 2013 (Unaudited)
") AcuityAds Inc. Condensed Consolidated Interim Financial Statements Condensed Consolidated Interim Statements of Financial Position March 31, December 31, 2014 2013 Assets Current assets: Cash $ 446,034
AcuityAds Inc. Condensed Consolidated Interim Financial Statements Condensed Consolidated Interim Statements of Financial Position March 31, December 31, 2014 2013 Assets Current assets: Cash $ 446,034
(unaudited expressed in Canadian Dollars)
") Condensed Consolidated Interim Financial Statements of CARGOJET INC. For the three month periods ended (unaudited expressed in Canadian Dollars) This page intentionally left blank Condensed Consolidated
Condensed Consolidated Interim Financial Statements of CARGOJET INC. For the three month periods ended (unaudited expressed in Canadian Dollars) This page intentionally left blank Condensed Consolidated
Non-GAAP Financial Measures. Second Quarter and First Half of Fiscal 2014. siemens.com. Energy efficiency. Intelligent infrastructure solutions
 Energy efficiency Next-generation healthcare Industrial productivity Intelligent infrastructure solutions Non-GAAP Financial Measures Second Quarter and First Half of Fiscal 2014 siemens.com second QUARTER
MOUNTAIN EQUIPMENT CO-OPERATIVE
 Consolidated Financial Statements of MOUNTAIN EQUIPMENT CO-OPERATIVE KPMG LLP PO Box 10426 777 Dunsmuir Street Vancouver BC V7Y 1K3 Canada Telephone (604) 691-3000 Fax (604) 691-3031 Internet www.kpmg.ca
BADGER DAYLIGHTING LTD. ANNOUNCES RESULTS FOR THE FIRST QUARTER ENDED MARCH 31, 2015
 PRESS RELEASE TSX-BAD FOR IMMEDIATE DISTRIBUTION May 13, 2015 BADGER DAYLIGHTING LTD. ANNOUNCES RESULTS FOR THE FIRST QUARTER ENDED MARCH 31, 2015 Calgary, Alberta Badger Daylighting Ltd. is pleased to
Unaudited Condensed Interim Financial Statements of H&R FINANCE TRUST
 Unaudited Condensed Interim Financial Statements of H&R FINANCE TRUST For the three months ended March 31, 2012 and 2011 H&R FINANCE TRUST Condensed Interim Statement of Financial Position (In thousands
Consolidated Balance Sheets
 Consolidated Balance Sheets March 31 2015 2014 2015 Assets: Current assets Cash and cash equivalents 726,888 604,571 $ 6,057,400 Marketable securities 19,033 16,635 158,608 Notes and accounts receivable:
N E W S R E L E A S E
 N E W S R E L E A S E FOR IMMEDIATE RELEASE Contact: Steven E. Nielsen, President and CEO H. Andrew DeFerrari, Senior Vice President and CFO (561) 627-7171 DYCOM INDUSTRIES, INC. ANNOUNCES FISCAL 2016
Interfor Corporation Vancouver, BC February 11, 2016
 Interfor Corporation Vancouver, BC February 11, 2016 Interfor Posts Improved Results in Q4 15 Adjusted EBITDA of $35.8 Million Reflects Higher Prices and Progress on Key Business Initiatives; Thomas V.
ATS AUTOMATION TOOLING SYSTEMS INC.
 Interim Consolidated Financial Statements For the period ended June 29, 2014 (Unaudited) (Condensed) Interim Consolidated Statements of Financial Position (in thousands of Canadian dollars unaudited) June
Interim Financial Statements. Opsens Inc. (after merger) Three-month period ended November 30, 2006
 Three-month period ended November 30, 2006") Interim Financial Statements Opsens Inc. (after merger) Three-month period ended Interim Financial Statements Three-month period ended Notice These interim financial statements have not been reviewed by
Interim Financial Statements Opsens Inc. (after merger) Three-month period ended Interim Financial Statements Three-month period ended Notice These interim financial statements have not been reviewed by
Q3 2014 SHAREHOLDERS REPORT. A leading provider of independent commercial real estate consulting and advisory services, software and data solutions.
 A leading provider of independent commercial real estate consulting and advisory services, software and data solutions. Q3 2014 SHAREHOLDERS REPORT THIRD QUARTER REPORT 2014 FOR THE NINE MONTHS ENDED SEPTEMBER
COTT ANNOUNCES FIRST QUARTER 2012 RESULTS AND SHARE REPURCHASE PROGRAM FOR UP TO $35 MILLION IN COMMON SHARES
 CONTACT: Michael C. Massi Investor Relations Tel: (813) 313-1786 Investor.relations@cott.com COTT ANNOUNCES FIRST QUARTER 2012 RESULTS AND SHARE REPURCHASE PROGRAM FOR UP TO $35 MILLION IN COMMON SHARES
FORACO INTERNATIONAL REPORTS Q3 2014
 NEWS RELEASE FORACO INTERNATIONAL REPORTS Q3 2014 Toronto, Ontario / Marseille, France Tuesday, November 4, 2014 Foraco International SA (TSX:FAR) (the Company or Foraco ), a leading global provider of
Condensed Interim Consolidated Financial Statements Six months ended October 31, 2011 (Unaudited)
") Condensed Interim Consolidated Financial Statements Six months ended October 31, 2011 (Unaudited) 500 435-4 th Avenue S.W. Calgary, AB T2P 3A8 Tel: 403-984-9798 NOTICE TO READER These condensed interim
Condensed Interim Consolidated Financial Statements Six months ended October 31, 2011 (Unaudited) 500 435-4 th Avenue S.W. Calgary, AB T2P 3A8 Tel: 403-984-9798 NOTICE TO READER These condensed interim
ENGINEERING.COM INCORPORATED 2002 FINANCIAL STATEMENTS
 ENGINEERING.COM INCORPORATED 2002 FINANCIAL STATEMENTS 2 MANAGEMENT S RESPONSIBILITY FOR FINANCIAL REPORTING To the Shareholders of ENGINEERING.com Incorporated: The consolidated financial statements and
For the three months ended March 31, 2013
 For the three months ended March 31, 2013 This Management s Discussion and Analysis ( MD&A ) comments on the financial condition and results of operations of Torstar Corporation ( Torstar or the Company
Tower International Posts Third Quarter 2010 Adjusted EBITDA of $39.1 million
 For Immediate Release Derek Fiebig Director, Investor & External Relations (248) 675-6457 fiebig.derek@towerautomotive.com Tower International Posts Third Quarter 2010 of $39.1 million LIVONIA, Mich.,
Performance Food Group Company Reports Second-Quarter and First-Half Fiscal 2016 Results; Reaffirms Full-Year Fiscal 2016 Adjusted EBITDA Outlook
 NEWS RELEASE For Immediate Release February 3, 2016 Investors: Michael D. Neese VP, Investor Relations (804) 287-8126 michael.neese@pfgc.com Media: Joe Vagi Manager, Corporate Communications (804) 484-7737
Village Farms International Announces Year End 2014 Results and Adoption of Advance Notice By-Law
 March 18, 2015 TRADING SYMBOL: The Toronto Stock Exchange: Village Farms International, Inc. VFF Village Farms International Announces Year End 2014 Results and Adoption of Advance Notice By-Law Vancouver,
DST SYSTEMS, INC. ANNOUNCES THIRD QUARTER 2015 FINANCIAL RESULTS
 ANNOUNCES THIRD QUARTER 2015 FINANCIAL RESULTS KANSAS CITY, MO - October 22, 2015 DST Systems, Inc. (NYSE: DST) reported consolidated net income of $75.1 million ($2.08 per diluted share) for the third
W.W. Grainger, Inc. First Quarter 2015 Results Page 1 of 9
 W.W. Grainger, Inc. First Quarter 2015 Results Page 1 of 9 News Release GRAINGER REPORTS RESULTS FOR THE 2015 FIRST QUARTER Revises 2015 Guidance Quarterly Summary Sales of $2.4 billion, up 2 percent Operating
Xtreme Coil Reports Record Quarter and Updates Operations
 1402, 500 Fourth Avenue SW, Calgary, AB T2P 2V6 tel: 403.262 9500; fax: 403.262 9522 Xtreme Coil Reports Record Quarter and Updates Operations Page 1 of 24 For Immediate Release Calgary, Alberta (TSX:
ACI Worldwide, Inc. Reports Financial Results for the Quarter Ended March 31, 2014
 News Release ACI Worldwide, Inc. Reports Financial Results for the Quarter Ended March 31, 2014 HIGHLIGHTS SNET bookings of $122 million, up 59% from Q1 last year Recurring revenue up 57% from last year,
Management Discussion and Analysis. For the three months ended March 31, 2014
 Management Discussion and Analysis For the three months ended March 31, 2014 Dated: May 2, 2014 Trez Capital Mortgage Investment Corporation Interim Management Discussion and Analysis Table of Contents
2010 Second Quarter Report Leading the Evolution of Global Stock Plan Management
 2010 Second Quarter Report Leading the Evolution of Global Stock Plan Management Management s Discussion and Analysis For the Quarter Ended Special Note Regarding Forward-Looking Statements This Management
Greif Reports Fourth Quarter 2014 Results
 Contacts Analyst: Robert Lentz Media: Scott Griffin 614-876-2000 740-657-6516 Greif Reports Fourth Quarter 2014 Results Net sales for the fourth quarter 2014 were flat compared to the fourth quarter 2013
MECHEL REPORTS THE 1Q 2015 FINANCIAL RESULTS
 MECHEL REPORTS THE 1Q 2015 FINANCIAL RESULTS amounted to $1.1 billion Consolidated EBITDA(a) * amounted to $211 million Net loss attributable to shareholders of Mechel OAO amounted to $273 million Moscow,
FORWARD-LOOKING STATEMENTS
 This Management s Discussion and Analysis ( MD&A ) has been prepared as of February 3, 2016, and should be read in conjunction with the audited consolidated financial statements of EEStor Corporation (the
APX GROUP HOLDINGS, INC. REPORTS FIRST QUARTER 2015 RESULTS
 APX GROUP HOLDINGS, INC. REPORTS FIRST QUARTER 2015 RESULTS First Quarter 2015 Financial and Portfolio Highlights APX Group Reports Total Revenue of $149.9 Million, up 14.9% Year over Year Adjusted EBITDA
CFO Commentary on Full Year 2015 and Fourth-Quarter Results
 Intel Corporation 2200 Mission College Blvd. Santa Clara, CA 95054-1549 CFO Commentary on Full Year 2015 and Fourth-Quarter Results Summary The fourth quarter was a strong finish to the year with record
eqube Gaming Limited Management Discussion and Analysis For the Three and Nine Month Periods Ended November 30, 2015
 FORM 51-102F1 1. Introduction The following management s discussion and analysis ( MD&A ) for eqube Gaming Limited (the Company ) should be read in conjunction with the Company s unaudited condensed interim
Financial Statement Analysis: An Introduction
 Financial Statement Analysis: An Introduction 2014 Level I Financial Reporting and Analysis IFT Notes for the CFA exam Contents 1. Introduction... 3 2. Scope of Financial Statement Analysis... 3 3. Major
FIRST QUARTER CONFERENCE CALL MAY 4, 2010
 FIRST QUARTER CONFERENCE CALL MAY 4, 2010 1 Cautionary Statement CAUTIONARY NOTE REGARDING FORWARD-LOOKING STATEMENTS: This presentation contains or incorporates by reference forwardlooking statements
Interim Condensed Consolidated Financial Statements TEXADA SOFTWARE INC. For the three months ended March 31, 2012 and 2011 (Unaudited)
") Interim Condensed Consolidated Financial Statements TEXADA SOFTWARE INC. For the three months ended March 31, 2012 and 2011 (Unaudited) MANAGEMENT S COMMENTS ON UNAUDITED INTERIM CONSOLIDATED FINANCIAL
Interim Condensed Consolidated Financial Statements TEXADA SOFTWARE INC. For the three months ended March 31, 2012 and 2011 (Unaudited) MANAGEMENT S COMMENTS ON UNAUDITED INTERIM CONSOLIDATED FINANCIAL
Consolidated Financial Statements
 Q Consolidated Financial Statements Management s Discussion and Analysis The following Management s Discussion and Analysis ( MD&A ) of financial condition and results of operations of Empire Industries
Westmoreland Reports First Quarter 2016 Results and Affirms Full-year Guidance
 News Release Westmoreland Reports First Quarter 2016 Results and Affirms Full-year Guidance Englewood, CO May 10, 2016 - Westmoreland Coal Company (NasdaqGM:WLB) today reported financial results for the
HP Inc. Reports Hewlett-Packard Company Fiscal 2015 Full-Year and Fourth Quarter Results
 HP Inc. 1501 Page Mill Road Palo Alto, CA 94304 hp.com News Release HP Inc. Reports Hewlett-Packard Company Fiscal 2015 Full-Year and Fourth Quarter Results Editorial contacts HP Inc. Media Relations MediaRelations@hp.com
SUPPLEMENTAL INVESTOR INFORMATION. Fourth Quarter 2012
 SUPPLEMENTAL INVESTOR INFORMATION Fourth Quarter 2012 Kevin Bryant Tony Carreño VP Investor Relations and Strategic Director Investor Relations Planning & Treasurer 816-556-2782 816-654-1763 anthony.carreno@kcpl.com
United Rentals Announces Fourth Quarter and Full Year 2015 Results and Provides 2016 Outlook
 United Rentals Announces Fourth Quarter and Full Year 2015 Results and Provides 2016 Outlook United Rentals, Inc. 100 First Stamford Place Suite 700 Stamford, CT 06902 Telephone: 203 622 3131 203 622 6080
Walmart reports Q1 FY 16 EPS of $1.03
 Walmart reports Q FY 6 EPS of.03 Q diluted EPS from continuing operations was.03, within guidance of 0.95 to.0. Currency negatively impacted EPS by approximately 0.03. Walmart U.S..% comp includes positive
SunGard Announces Fourth Quarter 2014 Results
 For more information, contact: Henry Miller - financial contact George Thomas - media contact Tel: 484-582-5445 Tel: 484-582-5635 henry.miller@sungard.com george.thomas@sungard.com SunGard Announces Fourth
CONSOLIDATED FINANCIAL STATEMENTS
 CONSOLIDATED FINANCIAL STATEMENTS JUNE 30, 2010 BANKERS PETROLEUM LTD. CONSOLIDATED BALANCE SHEETS (Unaudited, expressed in thousands of US dollars) ASSETS June 30 2010 December 31 2009 Current assets
NOTICE OF NO AUDITOR REVIEW OF INTERIM FINANCIAL STATEMENTS
 Condensed Interim Consolidated Financial Statements of THE BRICK LTD. For the three months ended March 31, 2013 NOTICE OF NO AUDITOR REVIEW OF INTERIM FINANCIAL STATEMENTS Under National Instrument 51-102,
BIOX ANNOUNCES 2016 FIRST QUARTER RESULTS
 PRESS RELEASE TSX symbol: BX BIOX ANNOUNCES 2016 FIRST QUARTER RESULTS TORONTO, February 4, 2016 - BIOX Corporation (BIOX) (TSX: BX), a renewable energy company that designs, builds, owns and operates
NUVISTA ENERGY LTD. Consolidated Statements of Financial Position (unaudited)
") NUVISTA ENERGY LTD. Consolidated Statements of Financial Position (unaudited) ($Cdn thousands) Assets Current assets Cash and cash equivalents $ - $ - Accounts receivable and prepaids 42,980 30,317 Assets
NUVISTA ENERGY LTD. Consolidated Statements of Financial Position (unaudited) ($Cdn thousands) Assets Current assets Cash and cash equivalents $ - $ - Accounts receivable and prepaids 42,980 30,317 Assets
TUCKAMORE CAPITAL MANAGEMENT INC.
 TUCKAMORE CAPITAL MANAGEMENT INC. MANAGEMENT S DISCUSSION AND ANALYSIS QUARTER ENDED SEPTEMBER 30, 2015 Tuckamore Capital Management Inc. 1 Third Quarter Report 2015 DEAR SHAREHOLDERS Although the financial