Top. U.S. Export. Markets. Free Trade Agreement and Country Fact Sheets
|
|
|
- Blaze Hines
- 8 years ago
- Views:
Transcription
1 Top U.S. Export Markets Free Trade Agreement and Country Fact Sheets Summer 2008

2 Top U.S. Export Markets 2008 Table of Contents Market Access and Compliance Overview... 1 Organizational Chart...2 Top U.S. Trading Partners...3 Free Trade Agreements and Top 50 Export Markets...5 Free Trade Agreement Fact Sheets Australia... 8 Bahrain Central America-Dominican Republic (CAFTA-DR)...12 Chile...14 Colombia...16 Israel...18 Jordan...20 Korea Morocco North American Free Trade Agreement Oman Panama Peru Singapore Country Fact Sheets Data Sources Argentina Australia...40 Austria Belgium Brazil Canada Chile China Colombia Costa Rica Denmark Dominican Republic...60 Ecuador Egypt The European Union (27) Finland France Germany Guatemala Honduras Hong Kong India...80 Indonesia Ireland Israel Italy...88 Japan...90 Malaysia Mexico The Netherlands New Zealand Top U.S. Export Markets 2008
... 66 Finland.")
3 Table of Contents Country Fact Sheets continued Nigeria Norway Panama Peru Philippines Poland Russia Saudi Arabia Singapore South Africa South Korea Spain Sweden Switzerland Taiwan Thailand Turkey United Arab Emirates The United Kingdom Venezuela ii

4 Market Access and Compliance Overview The mission of Market Access and Compliance (MAC), a unit of the International Trade Administration, is to: 1) advance U.S. commercial interests by fostering an open global economic environment in which U.S. firms have an equal opportunity to compete and win; and 2) champion American businesses and workers by eliminating foreign barriers to trade, investment and operations; enforcing trade agreements; and, promoting global growth. MAC s country desk officers are experts on the commercial, economic, and political climates in their assigned countries. They focus on resolving trade complaints and market access issues, such as those related to: Intellectual Property and Piracy Quotas Standards Customs Transparency and Contract Sanctity Discriminatory Treatment Good Governance Sanitary and Phytosanitary Standards MAC coordinates efforts with ITA s Commercial Service staff and industry sector experts, as well as with other foreign policy and trade-related government agencies to achieve meaningful results rapidly for U.S. exporters and investors. MAC s Trade Compliance Center (TCC) works with businesses to ensure that they receive the benefits of the more than 270 trade agreements that open up foreign markets to U.S. goods and services. If you believe your company is being treated unfairly in a foreign market, contact the TCC by calling (202) or visiting < which contains a wealth of information about U.S. exporter rights under our trade agreements. Top U.S. Export Markets 2008

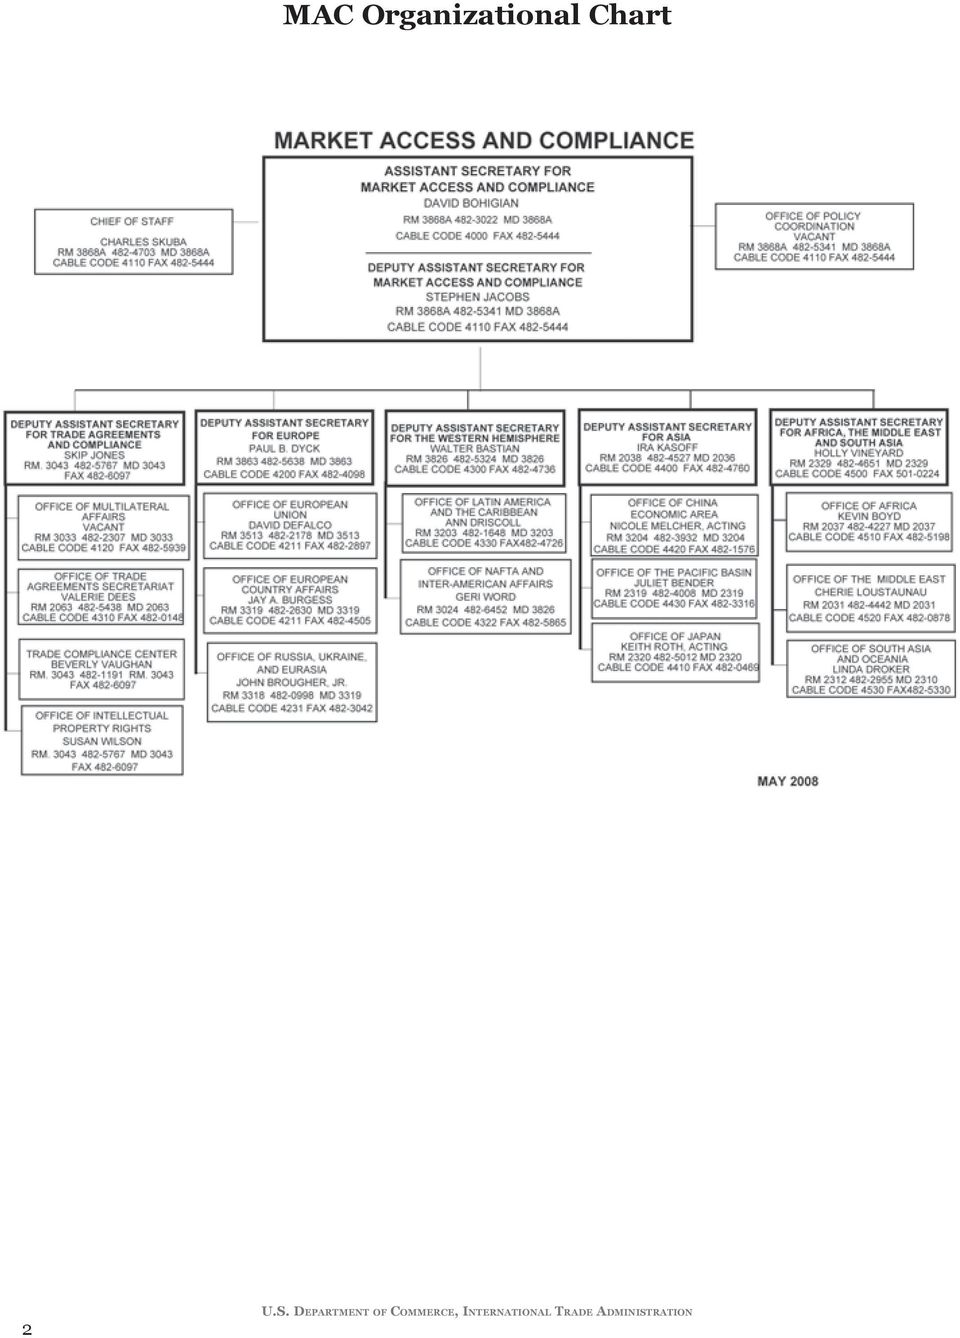
5 MAC Organizational Chart 2
6 Top U.S. Trade Partners Ranked by 2007 U.S. Total Export Value for Goods (in millions of U.S. dollars) Exports Imports Through Through Through Through Rank Country % Change Apr Apr % Change % Change Apr Apr % Change 1 Canada 230, , % 78,365 87, % 302, , % 102, , % 2 Mexico 133, , % 43,069 48, % 198, , % 64,962 71, % 3 China 55,186 65, % 19,408 23, % 287, , % 95,644 98, % 4 Japan 59,613 62, % 20,750 21, % 148, , % 48,663 50, % 5 United Kingdom 45,410 50, % 17,149 19, % 53,513 56, % 17,193 18, % 6 Germany 41,319 49, % 15,906 18, % 89,082 94, % 30,055 33, % 7 Korea 32,442 34, % 11,177 11, % 45,804 47, % 16,079 16, % 8 Netherlands 31,129 32, % 11,553 13, % 17,342 18, % 5,098 6, % 9 France 24,217 27, % 9,178 9, % 37,040 41, % 13,143 14, % 10 Taiwan 23,047 26, % 7,769 9, % 38,212 38, % 11,948 12, % 11 Singapore 24,684 26, % 8,720 10, % 17,768 18, % 6,172 5, % 12 Belgium 21,340 25, % 7,758 9, % 14,405 15, % 4,817 6, % 13 Brazil 19,231 24, % 7,424 9, % 26,367 25, % 8,109 9, % 14 Hong Kong 17,776 20, % 6,112 6, % 7,947 7, % 2,012 2, % 15 Australia 17,779 19, % 5,909 7, % 8,204 8, % 2,587 3, % 16 India 10,056 17, % 3,658 5, % 21,831 24, % 7,807 8, % 17 Switzerland 14,375 17, % 5,059 8, % 14,230 14, % 4,629 5, % 18 Italy 12,546 14, % 4,609 5, % 32,655 35, % 10,778 12, % 19 Israel 10,965 13, % 3,909 5, % 19,167 20, % 6,267 7, % 20 Malaysia 12,544 11, % 3,842 4, % 36,533 32, % 10,655 10, % 21 United Arab Emirates 11,648 11, % 3,162 4, % 1,385 1, % % 22 Saudi Arabia 7,640 10, % 2,557 3, % 31,689 35, % 8,877 16, % 23 Venezuela 9,002 10, % 3,050 3, % 37,134 39, % 10,618 15, % 24 Spain 7,426 9, % 3,006 4, % 9,778 10, % 3,189 3, % 25 Ireland 8,516 9, % 3,278 3, % 28,526 30, % 10,915 10, % 26 Colombia 6,709 8, % 2,517 3, % 9,266 9, % 2,626 4, % 27 Thailand 8,147 8, % 2,536 2, % 22,466 22, % 7,131 7, % 28 Chile 6,786 8, % 2,300 3, % 9,565 8, % 3,363 3, % 29 Philippines 7,617 7, % 2,522 2, % 9,694 9, % 2,949 2, % 30 Russia 4,701 7, % 1,930 3, % 19,828 19, % 5,681 7, % 40 Peru 2,927 4, % 1,083 1, % 5,880 5, % 1,509 1, % 42 Panama 2,701 3, % 1,012 1, % % % CAFTA-DR 19,585 22, % 6,860 8, % 18,578 18, % 5,984 6, % ASEAN 57,307 60, % 19,443 23, % 111, , % 35,432 36, % Top 30 Total 916,486 1,014, % 318, , % 1,596,077 1,681, % 524, , % World Merchandise Total 1,036,635 1,162, % 363, , % 1,853,938 1,956, % 608, , % Top 30% Share 88.4% 87.3% % 86.6% -86.1% 85.9% % 84.5% - - U.S. Services Trade 433, , % 154, , % 348, , % 122, , % U.S. Total Trade* 1,457,014 1,645, % 515, , % 2,210,298 2,345, % 755, , % *Notes: U.S. Total Trade is calculated on a Balance of Payments (BOP) basis, merchandise trade is calculated on a Census basis. Export figures are for Total Exports on a Free Alongside Ship basis. Import figures are the Customs value of U.S. General Imports. Percent changes calculated using millions of dollars. Source: U.S. Department of Commerce, Census Bureau, Foreign Trade Division. Top U.S. Export Markets 2008

7 Top U.S. Trade Partners Ranked by 2007 U.S. Total Import Value for Goods (in millions of U.S. dollars) Imports Exports Through Through Through Through Rank Country % Change Apr Apr % Change % Change Apr Apr % Change 1 China 287, , % 95,644 98, % 55,186 65, % 19,408 23, % 2 Canada 302, , % 102, , % 230, , % 78,365 87, % 3 Mexico 198, , % 64,962 71, % 133, , % 43,069 48, % 4 Japan 148, , % 48,663 50, % 59,613 62, % 20,750 21, % 5 Germany 89,082 94, % 30,055 33, % 41,319 49, % 15,906 18, % 6 United Kingdom 53,513 56, % 17,193 18, % 45,410 50, % 17,149 19, % 7 Korea 45,804 47, % 16,079 16, % 32,442 34, % 11,177 11, % 8 France 37,040 41, % 13,143 14, % 24,217 27, % 9,178 9, % 9 Venezuela 37,134 39, % 10,618 15, % 9,002 10, % 3,050 3, % 10 Taiwan 38,212 38, % 11,948 12, % 23,047 26, % 7,769 9, % 11 Saudi Arabia 31,689 35, % 8,877 16, % 7,640 10, % 2,557 3, % 12 Italy 32,655 35, % 10,778 12, % 12,546 14, % 4,609 5, % 13 Nigeria 27,863 32, % 9,050 14, % 2,233 2, % 794 1, % 14 Malaysia 36,533 32, % 10,655 10, % 12,544 11, % 3,842 4, % 15 Ireland 28,526 30, % 10,915 10, % 8,516 9, % 3,278 3, % 16 Brazil 26,367 25, % 8,109 9, % 19,231 24, % 7,424 9, % 17 India 21,831 24, % 7,807 8, % 10,056 17, % 3,658 5, % 18 Thailand 22,466 22, % 7,131 7, % 8,147 8, % 2,536 2, % 19 Israel 19,167 20, % 6,267 7, % 10,965 13, % 3,909 5, % 20 Russia 19,828 19, % 5,681 7, % 4,701 7, % 1,930 3, % 21 Netherlands 17,342 18, % 5,098 6, % 31,129 32, % 11,553 13, % 22 Singapore 17,768 18, % 6,172 5, % 24,684 26, % 8,720 10, % 23 Algeria 15,456 17, % 5,325 6, % 1,102 1, % % 24 Belgium 14,405 15, % 4,817 6, % 21,340 25, % 7,758 9, % 25 Switzerland 14,230 14, % 4,629 5, % 14,375 17, % 5,059 8, % 26 Indonesia 13,425 14, % 4,576 4, % 3,078 4, % 1,222 2, % 27 Sweden 13,870 13, % 4,595 4, % 4,126 4, % 1,492 1, % 28 Angola 11,719 12, % 4,073 5, % 1,550 1, % % 29 Iraq 11,546 11, % 3,111 7, % 1,491 1, % % 30 Austria 8,304 10, % 3,222 3, % 2,986 3, % 1, % 43 Peru 5,880 5, % 1,509 1, % 2,927 4, % 1,083 1, % 97 Panama % % 2,701 3, % 1,012 1, % CAFTA-DR 18,578 18, % 5,984 6, % 19,585 22, % 6,860 8, % ASEAN 111, , % 35,432 36, % 57,307 60, % 19,443 23, % Top 30 Total 1,642,421 1,738, % 541, , % 857, , % 298, , % World Merchandise Total 1,853,938 1,956, % 608, , % 1,036,635 1,162, % 363, , % Top 30% Share 88.6% 88.8% % 88.4% % 81.6% % 80.7% - U.S. Services Trade 348, , % 122, , % 433, , % 154, , % U.S. Total Trade* 2,210,298 2,345, % 755, , % 1,457,014 1,645, % 515, , % *Notes: U.S. Total Trade is calculated on a Balance of Payments (BOP) basis, merchandise trade is calculated on a Census basis. Export figures are for Total Exports on a Free Alongside Ship basis. Import figures are the Customs value of U.S. General Imports. Percent changes calculated using millions of dollars. Source: U.S. Department of Commerce, Census Bureau, Foreign Trade Division. 4

8 Free Trade Agreements and Top 50 Export Markets Top U.S. Export Markets 2008

9

10 Free Trade Agreement Fact Sheets Top U.S. Export Markets

11 U.S. Australia Free Trade Agreement (FTA) Analysis Commentary: The U.S. Australia FTA went into effect on January 1, The FTA is comprehensive: It covers industrial and agricultural goods and streamlines market access for services, government procurement, e-commerce, and investment. As a result of the FTA, more than 99 percent of U.S. exports of manufactured goods to Australia are now duty-free. Remaining tariffs on manufactured goods will be phased out within 10 years. Before and After the U.S. Australia FTA: Overall Trade in Goods between the U.S. and Australia grew from $21.8 billion in 2004 to $27.8 billion in 2007, an increase of 27.5 percent. U.S. exports to Australia grew from $14.2 billion in 2004 to $19.2 billion in 2007, an increase of percent. U.S. imports from Australia grew from $7.5 billion in 2004 to $8.6 billion in 2007, an increase of 14.7 percent. In 2007, Australia was our 24th largest trading partner (exports and imports combined). Benefits of the U.S. Australia FTA: Investment: The FTA establishes a secure, predictable legal framework for U.S. investors operating in Australia. All U.S. investment in new businesses is exempted from screening under Australia s Foreign Investment Review Board. Thresholds for acquisitions by U.S. investors in nearly all sectors have been raised significantly, from A$50 million to A$800 million (indexed annually), exempting the vast majority of transactions from screening. U.S. FDI into Australia grew from $48.4 billion in 2003 to $122.6 billion in 2006, an increase of 153 percent. [Australian FDI into the United States fell from $37.1 billion in 2003 to $25.7 billion in 2006, a decrease of 31 percent.] Services: The FTA gives U.S. companies expanded access to Australia s services market, including the advertising, asset management, audio-visual, computer and related services, education and training, energy, express delivery, financial services, professional services, telecommunications, and tourism sectors. The FTA sets high standards for regulatory transparency, including procedures applying to licensing systems. Government Procurement: Under the FTA s government procurement provisions, U.S. firms can compete for Australian government purchases at both the Commonwealth and State level on a nondiscriminatory basis, a change from previous policy. The FTA requires the use of tendering procedures that will ensure that procurements are conducted in a transparent, predictable, and fair manner. IPR: The FTA complements and enhances existing international standards for the protection of intellectual property and provides better means for enforcing those rights. The FTA includes increased copyright term; prohibition on circumvention of technological protection measures; criminalization of end-user piracy; and measures to prevent marketing of pharmaceutical products that infringe patents. 8

12 U.S. Trade in Goods with Australia Leading U.S. Exports to Australia in in 2007 and Change from 2006 Top U.S. Export Markets

13 U.S. Bahrain Free Trade Agreement (FTA) Analysis Commentary: The U.S. Bahrain Free Trade Agreement entered into force on August 1, This FTA is a significant step in advancing President Bush s proposal to establish a Middle East Free Trade Area by 2013, and is the first with a Persian Gulf state and the third with an Arab state. All U.S. consumer, industrial, and agricultural exports except for alcohol and tobacco now enter Bahrain dutyfree. There is significant market access in the services sector in addition to stronger IPR enforcement. Before and After the U.S. Bahrain FTA: Overall Trade in Goods in the first full year of the FTA (August 2006 July 2007), increased from $1.04 billion to $1.17 billion, a 12 percent increase. U.S. exports to Bahrain in the first full year of the FTA, increased from $414.5 million to $528.9 million, a 27 percent increase. U.S. imports from Bahrain in the first full year of the FTA increased from $623.7 million to $638.2 million, a two percent increase. Total bilateral trade with Bahrain in 2007 surpassed $1.2 billion, breaking the $1 billion mark for the first time ever. The U.S. trade deficit with Bahrain dropped from $209.2 million to $109.2 million in the first full year of the FTA, a 48 percent decrease. Benefits of the U.S. Bahrain FTA: Investment: There is no investment chapter in this FTA. The U.S. and Bahrain signed a bilateral investment treaty in 1999; it went into force in U.S. FDI into Bahrain went from $70 million in 2002 to $194 million in 2005, an increase of over 150 percent. Reported FDI into Bahrain decreased to $107 million in Figures for Bahraini FDI into the U.S. are not available. Services: Bahrain s services sector accounts for roughly 50 percent of Bahrain s GDP. Bahrain is the financial center of the Middle East and a large provider of various services to the surrounding region. U.S. financial, insurance, legal, and medical service providers stand to reap large gains from the U.S. Bahrain FTA as barriers to entry are removed. Government Procurement: The FTA requires that covered Bahraini government purchasers not discriminate against U.S. firms, or in favor of Bahraini firms, when making covered government purchases in excess of agreed monetary thresholds. U.S. and Bahraini suppliers have increased certainty due to strong and transparent disciplines on procurement procedures, such as requiring advance public notice of purchases, as well as timely and effective bid review procedures. IPR: The FTA ensures that authors, composers and other copyright owners have the exclusive right to make their works available online. It also ensures that copyright owners have rights to temporary copies of their works on computers, which is important in protecting music, videos, software and text from widespread unauthorized sharing via the Internet. The FTA ensures that government marketingapproval agencies will not grant approval to patent-infringing pharmaceuticals. Each government will be required to establish transparent procedures for the registration of trademarks, including geographical indications, and to develop an on-line system for the registration and maintenance of trademarks, as well as a searchable database. 10

14 U.S. Trade in Goods with Bahrain Leading U.S. Exports to Bahrain in 2007 and Change from 2006 Top U.S. Export Markets

15 U.S. Central America Dominican Republic Free Trade Agreement (CAFTA-DR) Analysis Commentary: Then USTR Robert Zoellick signed the CAFTA DR FTA on August 5, The agreement includes the five countries of Central America (Costa Rica, El Salvador, Guatemala, Honduras, and Nicaragua), and the Dominican Republic. This agreement creates new commercial opportunities for the United States while promoting regional stability, economic integration, stronger democratic institutions, and economic development for an important group of U.S. neighbors. CAFTA DR: Overall Trade in Goods between the United States and the CAFTA DR countries grew from $35.0 billion in 2005 to $41.2 billion in 2007, an increase of 17.7 percent. Export Market: U.S. exports to the CAFTA DR region were $22.4 billion in 2007, up 32.7 percent from Import Market: U.S. imports from the CAFTA DR countries were $18.8 billion in 2007, up 3.8 percent from Status: The United States has implemented the FTA on a rolling basis as countries complete their commitments under the agreement. During 2006, CAFTA DR went into force between the United States and four of our partner countries El Salvador in March, Honduras and Nicaragua in April, and Guatemala in July. The agreement went into force for the Dominican Republic on March 1, Costa Rica, approved the agreement in a national public referendum on October 7, 2007, although entry into force is pending passage of necessary implementation legislation by the Costa Rican legislature. In 2007, the CAFTA DR region was our 14th largest global market trading partner and the 21st largest source of U.S. imports. Benefits of CAFTA DR: Tariffs: More than 80 percent of U.S. exports of consumer and industrial goods became duty-free in Central America and the Dominican Republic immediately upon implementation, with remaining tariffs phased out over 10 years. Key U.S. export sectors benefit, such as information technology products, agricultural and construction equipment, paper products, chemicals, and medical and scientific equipment. Investment: The agreement establishes a secure, predictable legal framework for U.S. investors in Central America and the Dominican Republic. All forms of investment are protected under the FTA, including real property, enterprises, debt, concessions, and intellectual property. U.S. direct investment in the CAFTA DR countries was $4.4 billion in Services: Central America and the Dominican Republic accord substantial market access across the entire services regime. In addition, the agreement loosens restrictive dealer protection regimes that had previously locked U.S. firms into exclusive or inefficient distributor arrangements. IPR: Once fully implemented, CAFTA DR will establish the highest level of intellectual property protection in the Latin American region and will support the growth of trade in valuable digital and other intellectual property-based products. 12

16 U.S. Trade in Goods with CAFTA-DR Leading U.S. Exports to CAFTA-DR in 2007 and Change from 2006 Top U.S. Export Markets

17 U.S. Chile Free Trade Agreement (FTA) Analysis Commentary: When the U.S. Chile FTA took effect on January 1, 2004, more than 85 percent of two-way trade in consumer and industrial products immediately became duty-free. The majority of remaining industrial and consumer items became duty-free within four years, and all tariffs on these goods will be phased out within 10 years. Customs duties on all goods originating in either Party will be eliminated within 12 years. Key export sectors that benefit from the FTA include mining and construction equipment, automobiles and auto parts, medical equipment, paper products, computers, and other information technology products. Before and After the U.S. Chile FTA: Overall Trade in Goods between the United States and Chile grew from $6.42 billion in 2003 to $17.31 billion in 2007, an increase of 170 percent. U.S. exports to Chile grew from $2.72 billion in 2003 to $8.31 billion in 2007, an increase of 206 percent. U.S. imports from Chile grew from $3.71 billion in 2003 to $8.99 billion in 2007, an increase of 143 percent. In 2007, Chile was the 28th largest global market for U.S. exports and was the 36th largest source of U.S. imports. Benefits of the U.S. Chile FTA: Investment: The FTA helped consolidate Chile s status as a secure location for foreign investment. All forms of investments are covered by the FTA including direct ownership of companies, real estate, intellectual property rights, government concessions, and debt instruments. U.S. foreign direct investment in Chile reached $10.2 billion in 2006, up from $9.0 billion in Chilean foreign direct investment in the U.S. totaled $162 million in 2006, up from $70.0 million in Services: The FTA provides new access for service industries, including groundbreaking transparency rules to ensure that service regulators operate fairly. Among the wide range of sectors benefiting from the agreement are such key areas as computer and related services, telecommunications services, financial services, construction and engineering, express delivery, professional services (architects, engineers, accountants, legal services), and distribution services (wholesaling, retailing, franchising), with very few limitations or restrictions. Government Procurement: The government procurement obligations in the FTA include requirements for publishing procurement opportunities, developing technical specifications, setting qualification procedures, and sharing contract award information while ensuring confidentiality. U.S. companies can access the government of Chile procurement website ( which was established to increase transparency, enhance opportunities and reduce government procurement costs. The site serves as a central source for all Chilean government procurement. IPR: The intellectual property rights provisions of the FTA clarify and build on existing international standards, with an emphasis on new and emerging technologies. The FTA includes state-of-the-art protection for trademarks and copyrights, as well as expanded protection for patents and undisclosed information. The FTA also calls for strong enforcement mechanisms. 14

18 U.S. Trade in Goods with Chile Leading U.S. Exports to Chile in 2007 and Change from 2006 Top U.S. Export Markets

19 U.S. Colombia Trade Promotion Agreement (TPA) Analysis Commentary: The U.S. Colombia TPA will help foster economic growth and create higher paying jobs in the United States by reducing and eliminating barriers to trade and investment between the United States and Colombia. This Agreement will successfully advance our goals of helping Colombia to combat narcotics trafficking, build democratic institutions and promote socio-economic development. The U.S. Colombia TPA would make permanent our unilateral trade preferences under the ATPDEA, set to expire in December U.S. Colombia TPA: Overall Trade in Goods between the United States and Colombia grew from $16 billion in 2006 to $18 billion in 2007, an increase of 12.5 percent. U.S. exports to Colombia totaled $8.6 billion in 2007, up 27.6 percent from U.S. imports from Colombia were $9.4 billion in 2007, up 2 percent from Status: Parties signed the U.S. Colombia TPA on November 22, The Agreement awaits consideration in the U.S. Congress. Rank: In 2007, Colombia was the 26th largest global market for U.S. exports and was the 33rd largest source of U.S. imports. Benefits of the U.S. Colombia TPA: Tariffs: 80 percent of U.S. industrial and consumer products exports will become duty-free immediately upon entry into force of the Agreement. Investment: The FTA will establish a secure, predictable legal framework for U.S. investors in the region. All forms of investment will be covered. In 2006, U.S. direct investment in Colombia totaled $4.9 billion. Services: Colombia has accorded substantial market access across its regimes, including financial services. Colombia agreed to eliminate measures that require U.S. firms to hire national professionals and measures requiring the purchase of local goods. Colombia also agreed that both mutual and pension funds in Colombia would be allowed to use portfolio managers in the U.S. IPR: The FTA will provide for improved standards for the protection and enforcement of a broad range of intellectual property rights. This includes state-of-the-art protections for digital products such as U.S. software, music, text and videos; stronger protection for U.S. patents, trademarks and test data; and further deterrence of piracy and counterfeiting by criminalizing end-user piracy. 16

20 U.S. Trade in Goods with Colombia Leading U.S. Exports to Colombia in 2007 and Change from 2006 Top U.S. Export Markets

21 U.S. Israel Free Trade Agreement (FTA) Analysis Commentary: The U.S. Israel FTA took effect on September 1, 1985, and was the first free trade agreement signed by the United States with another country. The FTA eliminated duties on manufactured goods as of January 1, It also allowed the United States and Israel to protect sensitive agricultural sub-sectors with non-tariff barriers, including import bans, quotas, and fees. Note: The United States and Israel signed an agreement on agriculture in The agreement was set to expire in 2008, and is currently being re-negotiated. The U.S. Israel FTA is outdated by today s standards because it has detailed obligations only on merchandise trade. The more recent FTAs include detailed obligations on agriculture, services, investment, intellectual property protection, standards, transparency, and rule of law. Before and After the U.S. Israel FTA: Overall Trade in Goods between the United States and Israel grew from $3.5 billion in 1985 to $34.0 billion in 2007, an increase of percent. U.S. exports to Israel grew from $2.58 billion in 1985 to $13.0 billion in 2007, an increase of 403.8%. U.S. imports from Israel grew from $2.20 billion in 1985 to $20.8 billion in 2007, an increase of 845.5%. In 2007, Israel was our 21st largest trading partner (exports and imports combined); in 1985, it ranked 30th. Benefits of the U.S. Israel FTA: Investment: U.S. investment in Israel reached $7.92 billion in U.S. companies have invested primarily in the Israeli communications, software, and life sciences sectors. Services: The FTA includes a non-binding statement of intent to eliminate barriers to trade in services such as tourism, communications, banking, insurance, management consulting, accounting, law, computer services, and advertising. Government Procurement: The FTA includes an agreement to eliminate all restrictions on government procurement, and calls on Israel to relax its offsets requirements for government agencies other than the Israeli Ministry of Defense. Most of Israel s open international public tenders are published in the local press. However, government-owned corporations make extensive use of selective tendering procedures. The added lack of transparency in the public procurement process often discourages U.S. companies from participating in major projects and disadvantages those that choose to compete. Enforcement of the public procurement laws and regulations is not consistent. IPR: The FTA reaffirms obligations under bilateral and multilateral agreements relating to intellectual property rights. However, Israel was elevated to the Priority Watch List (PWL) in the USTR s 2005 Special 301 Report due to continuing concerns regarding its policies on data protection for proprietary test data. Although Israel made some progress in 2008, it remained on the PWL with an Out-of-Cycle Review, to encourage further progress. 18
22 U.S. Trade in Goods with Israel Leading U.S. Exports to Israel in 2007 and Change from 2006 Top U.S. Export Markets
23 U.S. Jordan Free Trade Agreement (FTA) Analysis Commentary: The U.S. Jordan FTA entered into force on December 17, It was the fourth FTA signed by the United States, and the first ever with an Arab state. It will eliminate tariffs on virtually all trade between the United States and Jordan within ten years, and is the first FTA to include provisions on environment, labor, and electronic commerce. Before and After the U.S. Jordan FTA: Overall Trade in Goods between the United States and Jordan grew from $728 million in 2000 to $2.285 billion in 2007, an increase of 68 percent. U.S. exports to Jordan grew from $316.6 million in 2000 to $856 million in 2007, an increase of percent. U.S. imports from Jordan grew from $73 million in 2000 to $1.3 billion in 2007, an increase of 94.5 percent. Note: Most of the U.S. imports from Jordan come from Qualified Industrial Zones, which predate the FTA and allow for duty free access into the United States as long as there is Israeli input into those products. In 2007, Jordan was our 78th largest trading partner (exports and imports combined). Benefits of the U.S. Jordan FTA: Investment: The United States has a bilateral investment treaty with Jordan. The FTA, therefore, does not include an investment chapter. U.S. FDI into Jordan in 2005 was $50 million. Services: The FTA opened up trade in services, giving American service providers excellent opportunities in Jordan s financial, education, audio-visual, courier, and other services. Government Procurement: Under the FTA, Jordan is obligated to enter into negotiations with the United States on its accession to the World Trade Organization s (WTO) Government Procurement Agreement (GPA). Jordan submitted its initial offer to accede to the GPA to the WTO in February 2003, but has not yet completed its accession to the GPA. IPR: Jordan s pharmaceutical industry generally abides by the TRIPS-consistent patent law. In signing the FTA, Jordan committed to even stronger protection and enforcement of IPR, particularly in the pharmaceutical sector. It acceded to the World Intellectual Property Organization Treaties on Copyrights and Performances and Phonographs. The 2007 Special 310 report highlighted enforcement as a weakness, due to a lack of capacity in Jordanian law enforcement agencies. The Jordanian Government continues to examine means to provide more comprehensive IPR protection and enforcement, including through more stringent enforcement of existing laws, introduction of new regulations based on existing laws, and the creation of an independent IP body. 20
24 U.S. Trade in Goods with Jordan Leading U.S. Exports to Jordan in 2007 and Change from 2006 Top U.S. Export Markets
25 U.S. Korea Free Trade Agreement (KORUS FTA) Analysis Commentary: The U.S.-Korea (KORUS) FTA will help foster economic growth and create higherpaying jobs in the United States by reducing barriers to trade and investment between the United States and the Republic of Korea. The KORUS FTA will be the United States most commercially significant FTA in 15 years. This comprehensive trade agreement will eliminate tariffs and non-tariff barriers to trade in goods and services, help accelerate the pace of regulatory reform in Korea, enhance intellectual property rights (IPR) protection, and boost trade. In addition, it will strengthen the overall U.S. - Korea relationship, one the most important strategic relationships in Asia. Korea has the world s 14th largest economy, valued at over $1 trillion, and is the United States 7th largest trading partner. Korea currently enjoys broad access to the U.S. market. The United States is Korea s third largest market, importing 17 percent of Korea s worldwide exported goods. In addition to market opening measures agreed to in the KORUS FTA, Korea is currently undertaking longneeded structural reform in the SME sector, the financial sector, and the labor market. These reforms, which will greatly benefit U.S. firms operating in Korea, should accelerate under President Lee Myungbak, who was inaugurated on February 25, U.S. Korea FTA: Overall Trade in Goods between the United States and Korea grew from $78.3 billion in 2006 to $82.3 billion in 2007, an increase of 5 percent. Export Market: U.S. exports to Korea totaled $34.7 billion in 2007, up 6.8 percent from Import Market: U.S. imports from Korea were $47.6 billion in 2007, up 4 percent from Status: Parties signed the U.S. Korea FTA on June 30, The Agreement awaits consideration in both the Korean and U.S. legislatures. In 2007, Korea s exports to the world grew 14 percent, the fourth consecutive year of double-digit growth. Benefits of the U.S. Korea FTA: Tariffs: Nearly 95 percent of U.S. industrial and consumer products exports to Korea will become duty-free within three years of entry into force of the agreement, and remaining tariffs will be phased out over 5- and 10-year periods. More than half (or $1.6 billion) of current U.S. farm exports to Korea will become duty-free immediately. Investment: The agreement establishes a stable legal framework for U.S. investors operating in Korea. All forms of investment are protected under the agreement. The investment protections in this FTA are as strong as in any U.S. FTA to date. In 2006, U.S. direct investment in Korea totaled $22.3 billion. Services: Korea vastly improved upon its WTO commitments in services, providing meaningful market access commitments that extend across virtually all major service sectors. IPR: The FTA will provide for improved standards for the protection and enforcement of a broad range of intellectual property rights, including trademarks, copyrights and patents. These IPR standards, which are consistent with U.S. standards, also cover emerging technologies, such as U.S. software, music, text, and videos. Additionally, the agreement provides for stronger rules on civil, criminal and customs enforcement, and a commitment for Korea to establish a patent linkage system to ensure adequate enforcement of pharmaceutical patent rights. 22
26 U.S. Trade in Goods with Korea Leading U.S. Exports to Korea in 2007 and Change from 2006 Top U.S. Export Markets
27 U.S. Morocco Free Trade Agreement (FTA) Analysis Commentary: The U.S. Morocco FTA entered into force on January 1, 2006, immediately eliminating 95 percent of tariffs on two-way industrial and consumer trade. The FTA will eliminate virtually all tariffs within 10 years. Before and After the U.S. Morocco FTA: Overall trade in goods between the U.S. and Morocco increased 101 percent between 2005 and 2007 from $970 million in 2005 to $1.4 billion in 2006, and $1.953 billion in U.S. exports to Morocco grew to $1.343 billion in 2007 compared to $521 million in 2005, an increase of 158 percent. U.S. imports from Morocco grew to $610 million in 2007 compared to $442 million in 2005, an increase of 38 percent. In 2007, Morocco was our 74th largest trading partner (exports and imports combined). Benefits of the U.S. Morocco FTA: Investment: The FTA expands the significant protections already afforded U.S. investors under a Bilateral Investment Treaty (BIT) signed in All forms of investment will be protected under the FTA, including enterprises, debt, concessions, contracts and intellectual property. U.S. investors will enjoy in almost all circumstances the right to establish, acquire and operate investments in Morocco on an equal footing with Moroccan investors, and with investors of other countries. U.S. investment in Morocco stood at $311 million in Services: Services (mainly tourism) represent 54 percent of Morocco s GDP. The FTA reinforces the on-going development of Morocco s legal and regulatory reforms and development plans for many sectors of interest to U.S. service providers: telecommunications, e-commerce, engineering and infrastructure services, environmental and energy services among others. The FTA provides for transparency in Morocco s regulatory framework for services in three areas: standard setting; the regulatory application process; and judicial, arbitral, and administrative procedures. These reinforce services and investment reforms already underway in many services sectors by lowering, phasing out, or making more transparent barriers to services trade and inward investment. Government Procurement: Morocco s nearly $5 billion government procurement market accounts for approximately 17 percent of the country s GDP. The FTA prohibits Moroccan government procurers from discriminating against U.S. firms, or favoring Moroccan firms, when purchasing more than $175,000 in goods or services or $6.73 million in construction services. Morocco has covered 30 central government entities in its government procurement offer. IPR: The FTA requires each government to criminalize end-user piracy, providing strong deterrence against piracy and counterfeiting. The FTA provides significant new protection for U.S. patent, trademark, and copyright owners. 24
28 U.S. Trade in Goods with Morocco Leading U.S. Exports to Morocco in 2007 and Change from 2006 Top U.S. Export Markets
29 North American Free Trade Agreement (NAFTA) Analysis Commentary: NAFTA is a comprehensive trade agreement that improves virtually all aspects of doing business between Canada, Mexico, and the United States. Upon NAFTA s entry into force on January 1, 1994, Mexico immediately eliminated tariffs on nearly 50 percent of all industrial goods imported from the United States and removed many non-tariff barriers. Virtually all tariffs on industrial goods were eliminated by 2003 and tariffs on U.S. exports of certain agricultural products to Mexico were phased out on January 1, With the exception of tariff rate quotas on certain supply-managed agricultural products, all Canada-U.S. trade has been duty free since Canada and Mexico are the first and second largest export markets for U.S. goods. Before and After NAFTA: Overall Trade in Goods among the United States, Canada and Mexico has grown from $297 billion in 1993 to $930 billion in 2007, an increase of 213 percent. U.S. goods exports to Canada and Mexico grew from $142 billion in 1993 to $385.4 billion in 2007, an increase of 171 percent. U.S. goods imports from Canada and Mexico grew from $151 billion in 1993 to $523.9 billion in 2007, an increase of 247 percent. Benefits of NAFTA: Investment: With limited exceptions, NAFTA requires U.S. investors to be treated in Mexico and Canada as well as those countries treat their own investors or investors of any other country in the establishment, acquisition, and operation of investments. NAFTA also guarantees investors the right to receive fair market value for property in the event of an expropriation. The protections of NAFTA s Investment Chapter are backed by a transparent, binding international arbitration mechanism, under which investors may, at their own initiative, bring claims against a NAFTA government for an alleged breach of the chapter. The NAFTA Parties have agreed to make public their submissions in investorstate disputes, and to make arbitral hearings open to the public. Tribunals are also authorized to accept amicus submissions from non-disputing parties. Services: NAFTA establishes a solid framework for trade in services through the elimination of barriers in nearly all service sectors and enhancement of regulatory transparency. U.S. firms have been well positioned to take advantage of NAFTA s new market access opportunities services exports have more than doubled under NAFTA and greatly exceed services imports. With service industries often highly regulated, regulatory transparency is essential. Under NAFTA, regulatory authorities are to use open and transparent administrative procedures, consult with interested parties, and publish all regulations. Government Procurement: The government procurement provisions of NAFTA apply to the procurement of goods, services, and construction services. U.S. suppliers are granted nondiscriminatory rights to bid on contracts to supply most Canadian and Mexican central government entities. This increases opportunities for U.S. exports to Canada and Mexico in such sectors as construction, environmental and computer software and design services, oil and gas field equipment and services, heavy electrical equipment, communications and computer systems, electronic, pharmaceutical products, and medical equipment. IPR: NAFTA recognized early the importance of intellectual property protection and enforcement within the context of international trade agreements, having been signed nearly two years before the WTO Agreement on Trade-Related Aspects of Intellectual Property Rights (TRIPS). NAFTA provides for the protection and enforcement of a broad range of intellectual property rights, including patents, trademarks, copyrights and test data. 26
30 U.S. Trade in Goods with NAFTA FTA implemented 1/1/1994 Leading U.S. Exports to the NAFTA Region in 2007 and Change from 2006 Top U.S. Export Markets
31 U.S. Oman Free Trade Agreement (FTA) Analysis Commentary: The U.S. Oman Free Trade Agreement was signed in January 2006 and is pending implementation. This FTA is a significant step in advancing President Bush s proposal to establish a Middle East Free Trade Area by 2013, and is the second with a Persian Gulf state. 100 percent of bilateral trade in industrial and consumer products will become duty-free immediately upon entry into force. The FTA provides reciprocal market access for U.S. textile and apparel producers. U.S. Oman Trade: Overall trade in goods between the U.S. and Oman in 2007 was $2.1 billion, an increase of 21 percent over 2006 figures. U.S. exports to Oman from January through April 2008 totaled $550.7 million, an increase of 124 percent over the same period the previous year. Major exports were machinery, aircraft, vehicles, and arms & ammunition. U.S. imports from Oman from January through April of 2008 were $130.9 million, an increase of 67 percent over the same period the previous year. Major imports were oil, inorganic chemicals, jewelry, and organic chemicals. Benefits of the U.S. Oman FTA: Tariffs: 100 percent of bilateral trade in industrial and consumer products will become duty-free immediately upon entry into force. The FTA provides reciprocal market access for U.S. textile and apparel producers. Investment: U.S. financial service suppliers will have the right to establish subsidiaries, branches and joint ventures in Oman, expand their operations throughout Oman, and offer a full range of financial services. All forms of investment will be protected under the FTA, including enterprises, debt, concessions, contracts, and intellectual property. U.S. direct investment in Oman in 2006 stood at $819 million, up from $615 million the previous year, an increase of 25 percent. Services: Oman will provide substantial market access across its entire services regime, including key service sectors such as audiovisual, express delivery, telecommunications, computer and related services, distribution, healthcare, services incidental to mining, construction, architecture and engineering. Government Procurement: Under the FTA, U.S. suppliers are granted nondiscriminatory rights to bid on contracts to supply most Omani government entities. The Agreement requires that covered Omani government purchasers not discriminate against U.S. firms, or in favor of Omani firms, when making covered government purchases in excess of agreed monetary thresholds. U.S. and Omani suppliers will have increased certainty due to transparent, predictable and fair procurement procedures, such as requiring advance public notice of purchases, as well as timely and effective bid review procedures. IPR: The FTA requires expanded intellectual property rights protections and strengthened enforcement of intellectual property rights. U.S. industry currently reports a total loss $14 million in IPR damages in Oman. 28
32 U.S. Trade in Goods with Oman Leading U.S. Exports to Oman in 2007 and Change from 2006 Top U.S. Export Markets
33 U.S. Panama Trade Promotion Agreement (TPA) Analysis Commentary: The U.S. Panama TPA will eliminate tariffs and other barriers to trade, open Panama s market for service providers, and promote investment. This Agreement will also ensure that U.S. firms have an opportunity to participate on a competitive basis in the $5.25 billion Panama Canal expansion project. U.S. Panama TPA: Overall Trade in Goods between the United States and Panama grew from $3.1 billion in 2006 to $4.1 billion in 2007, an increase of 33 percent U.S. exports to Panama grew from $2.7 billion in 2006 to $3.7 billion in 2007, an increase of 38 percent. U.S. imports from Panama shrank from $379 million in 2006 to $365 million in 2007, a decrease of 3.6 percent. Status: Parties concluded negotiations on December 19, 2006, and signed the Agreement on June 28, The Panamanian Congress ratified the Agreement on July 11, The President is ready to send the U.S.-Panama TPA implementing legislation to Congress for its approval. However, congressional leadership said that it will not take up the U.S.-Panama TPA until the Pedro Miguel Gonzalez (PMG) issue is resolved. PMG was elected President of Panama s National Assembly on September 1, Although PMG was acquitted in 1997 by a Panamanian court, he has an outstanding warrant for his arrest in the United States for the murder of a U.S. service officer in Panama in PMG has promised that he will not seek re-election as President of the National Assembly when his term expires on September 1, Panama also needs to address a few outstanding concerns on labor. Rank: Panama was the 42th largest market for U.S. exports in Benefits of the U.S. Panama TPA: Tariffs: Over 88 percent of U.S. exports of consumer and industrial goods to Panama will become duty-free immediately upon the Agreement s entry into force. Investment: The Agreement will cover all forms of investment. It will establish a secure, predictable legal framework for U.S. investors, including rules to protect investors against unfair or discriminatory government actions. It includes both the investments existing when the U.S.-Panama TPA enters into force and future investments. The stock of U.S. FDI in Panama was $5.7 billion in Services: The U.S.-Panama TPA will provide market access in several service sectors where Panama s economy has large potential for growth (i.e., telecommunications, tourism, restaurant and hotels, construction, and energy). The services chapter also affirms existing competitive opportunities in Panama and prevents cross-subsidization from a postal monopoly. Government Procurement: The government procurement provisions guarantee nondiscriminatory access and a fair and transparent process to sell goods and services to all important Panamanian government entities, including the Panama Canal Authority. IPR: The U.S.-Panama TPA will establish high levels of intellectual property protection in Panama, including procedures for registering and maintaining trademarks, and stronger copyright enforcement. It will also provide patent and marketing data protection that will support the growth of trade in valuable digital and other intellectual property-based products. 30
34 U.S. Trade in Goods with Panama Leading U.S. Exports to Panama in 2007 and Change from 2006 Top U.S. Export Markets
35 U.S. Peru Trade Promotion Agreement (TPA) Analysis Commentary: The U.S. Peru TPA will help foster economic growth and create higher paying jobs in the United States by reducing and eliminating barriers to trade and investment between the United States and Peru. The Agreement will successfully advance our goals of helping Peru to combat narcotics trafficking, build democratic institutions, and promote socioeconomic development. The U.S. Peru TPA will make permanent our unilateral trade preferences under the Andean Trade Preference Act (ATPA), which will expire at the end of U.S. Peru TPA: Overall Trade in Goods between the United States and Peru totaled $9.4 billion in 2007, up from $8.8 billion in U.S. exports to Peru totaled $4.1 billion in 2007, up 40.8 percent from U.S. imports from Peru totaled $5.3 billion in 2007, down 10.4 percent from Status: Parties concluded the U.S. Peru TPA on December 7, 2005, and signed the Agreement on April 12, The Peruvian Congress ratified the Agreement in June 2006 and a protocol of amendment in June Shorty after the U.S. Congress approved the Agreement, on December 14, 2007, President Bush signed the U.S. Peru TPA Implementation Act. The Agreement will enter into force once Peru has taken the necessary steps to ensure implementation of its obligations. Rank: In 2007, Peru was the 4oth largest global market for U.S. exports and was the 43rd largest source of U.S. imports. Benefits of the U.S. Peru TPA: Tariffs: 80 percent of bilateral trade in industrial and consumer products will become duty-free upon the Agreement s entry into force. Investment: The Agreement will establish a secure, predictable legal framework for U.S. investors in the region. All forms of investment will be covered. In 2005, U.S. direct investment in Peru totaled $3.9 billion. Services: Peru has accorded substantial market access to its regimes, including financial services. Peru has agreed to eliminate measures that require U.S. firms to hire national professionals, as well as measures that require U.S. firms to purchase local goods. Peru has also agreed that Peruvian mutual and pension funds will be allowed to use portfolio managers in the United States. IPR: The U.S. Peru TPA will provide for improved standards for the protection and enforcement of a broad range of intellectual property rights. This includes state-of-the-art protections for digital products such as U.S. software, music, text, and videos; stronger protection for U.S. patents, trademarks, and test data; and further deterrence of piracy and counterfeiting by criminalizing enduser piracy. 32
U.S. Trade Overview, 2013
 U.S. Trade Overview, 213 Stephanie Han & Natalie Soroka Trade and Economic Analysis Industry and Analysis Department of Commerce International Trade Administration October 214 Trade: A Vital Part of the
Appendix 1: Full Country Rankings
 Appendix 1: Full Country Rankings Below please find the complete rankings of all 75 markets considered in the analysis. Rankings are broken into overall rankings and subsector rankings. Overall Renewable
List of tables. I. World Trade Developments
 List of tables I. World Trade Developments 1. Overview Table I.1 Growth in the volume of world merchandise exports and production, 2010-2014 39 Table I.2 Growth in the volume of world merchandise trade
Know the Facts. Aon Hewitt Country Profiles can help: Support a decision to establish or not establish operations in a specific country.
 Aon Hewitt Country Profiles Your eguide to employment requirements and practices Profiles for nearly 90 countries worldwide Risk. Reinsurance. Human Resources. Know the Facts Whether you are a newcomer
The face of consistent global performance
 Building safety & security global simplified accounts The face of consistent global performance Delivering enterprise-wide safety and security solutions. With more than 500 offices worldwide Johnson Controls
Global Effective Tax Rates
 www.pwc.com/us/nes Global s Global s April 14, 2011 This document has been prepared pursuant to an engagement between PwC and its Client. As to all other parties, it is for general information purposes
U.S. Trading Companies, 2012
 U.S. Trading Companies, 2012 Natalie Soroka Trade and Economic Analysis Industry and Analysis Department of Commerce International Trade Administration November 2014 U.S. Trading Companies: 2012 Highlights
I. World trade developments
 I. World trade developments The value of world merchandise exports increased by 20 per cent in 2011 while exports of commercial services grew by 11 per cent. Key developments in 2011: a snapshot Trade
World Consumer Income and Expenditure Patterns
 World Consumer Income and Expenditure Patterns 2014 14th edi tion Euromonitor International Ltd. 60-61 Britton Street, EC1M 5UX TableTypeID: 30010; ITtableID: 22914 Income Algeria Income Algeria Income
Introducing GlobalStar Travel Management
 Introducing GlobalStar Travel Management GlobalStar is a worldwide travel management company owned and managed by local entrepreneurs. In total over 80 market leading enterprises, representing over US$13
EL SALVADOR TRADE SUMMARY IMPORT POLICIES
 EL SALVADOR TRADE SUMMARY The U.S. goods trade balance with El Salvador went from a trade deficit of $134 million in 2005 to a trade surplus of $301 million in 2006. U.S. goods exports in 2006 were $2.2
Foreign Taxes Paid and Foreign Source Income INTECH Global Income Managed Volatility Fund
 Income INTECH Global Income Managed Volatility Fund Australia 0.0066 0.0375 Austria 0.0045 0.0014 Belgium 0.0461 0.0138 Bermuda 0.0000 0.0059 Canada 0.0919 0.0275 Cayman Islands 0.0000 0.0044 China 0.0000
The big pay turnaround: Eurozone recovering, emerging markets falter in 2015
 The big pay turnaround: Eurozone recovering, emerging markets falter in 2015 Global salary rises up compared to last year But workers in key emerging markets will experience real wage cuts Increase in
YTD 2015-27 CS AWARDS IN AMERICAS
 YTD 2015-27 CS AWARDS IN AMERICAS Argentina Bolivia Brazil Frontline Customer Service Team of the Year, All Industries (Bronze) Customer Service Department of the Year, Airlines, Distribution & Transportation
Consolidated International Banking Statistics in Japan
 Total (Transfer Consolidated cross-border claims in all currencies and local claims in non-local currencies Up to and including one year Maturities Over one year up to two years Over two years Public Sector
Energy Briefing: Global Crude Oil Demand & Supply
 Energy Briefing: Global Crude Oil Demand & Supply November 6, 215 Dr. Edward Yardeni 516-972-7683 eyardeni@ Debbie Johnson 48-664-1333 djohnson@ Please visit our sites at www. blog. thinking outside the
Negotiation of a Free Trade Agreement between Hong Kong and the Association of Southeast Asian Nations. Consultation Document
 Negotiation of a Free Trade Agreement between Hong Kong and the Association of Southeast Asian Nations Consultation Document INTRODUCTION The Government of the Hong Kong Special Administrative Region will
Raveh Ravid & Co. CPA. November 2015
 Raveh Ravid & Co. CPA November 2015 About Us Established in 1986 by Abir Raveh, CPA & Itzhak Ravid, CPA 6 Partners, 80 employees Located in Tel Aviv, Israel wide range of professional services highly experienced
Australia s position in global and bilateral foreign direct investment
 Australia s position in global and bilateral foreign direct investment At the end of 213, Australia was the destination for US$592 billion of global inwards foreign direct investment (FDI), representing
2015 Country RepTrak The World s Most Reputable Countries
 2015 Country RepTrak The World s Most Reputable Countries July 2015 The World s View on Countries: An Online Study of the Reputation of 55 Countries RepTrak is a registered trademark of Reputation Institute.
Logix5000 Clock Update Tool V2.00.36. 12/13/2005 Copyright 2005 Rockwell Automation Inc., All Rights Reserved. 1
 Logix5000 Clock Update Tool V2.00.36. 1 Overview Logix5000 Clock Update Tool 1. 1. What is is it? it? 2. 2. How will it it help me? 3. 3. How do do I I use it? it? 4. 4. When can I I get get it? it? 2
Consumer Credit Worldwide at year end 2012
 Consumer Credit Worldwide at year end 2012 Introduction For the fifth consecutive year, Crédit Agricole Consumer Finance has published the Consumer Credit Overview, its yearly report on the international
FDI performance and potential rankings. Astrit Sulstarova Division on Investment and Enterprise UNCTAD
 FDI performance and potential rankings Astrit Sulstarova Division on Investment and Enterprise UNCTAD FDI perfomance index The Inward FDI Performance Index ranks countries by the FDI they receive relative
Guidelines for Enforcing Money Judgments Abroad
 The article was originally published in International Business Lawyer, Volume 21, Number 11, pages 509-512. The International Business Lawyer is published by the Section on Business Law of the International
Region Country AT&T Direct Access Code(s) HelpLine Number. Telstra: 1 800 881 011 Optus: 1 800 551 155
 HelpLine Number. Telstra: 1 800 881 011 Optus: 1 800 551 155") Mondelēz International HelpLine Numbers March 22, 2013 There are many ways to report a concern or suspected misconduct, including discussing it with your supervisor, your supervisor s supervisor, another
Mondelēz International HelpLine Numbers March 22, 2013 There are many ways to report a concern or suspected misconduct, including discussing it with your supervisor, your supervisor s supervisor, another
Digital TV Research. http://www.marketresearch.com/digital-tv- Research-v3873/ Publisher Sample
 Digital TV Research http://www.marketresearch.com/digital-tv- Research-v3873/ Publisher Sample Phone: 800.298.5699 (US) or +1.240.747.3093 or +1.240.747.3093 (Int'l) Hours: Monday - Thursday: 5:30am -
CMMI for SCAMPI SM Class A Appraisal Results 2011 End-Year Update
 CMMI for SCAMPI SM Class A 2011 End-Year Update Software Engineering Institute Carnegie Mellon University Pittsburgh, PA 15213 1 Outline Introduction Current Status Community Trends Organizational Trends
Office of the United States Trade Representative June 2007. Free Trade with Colombia Summary of the United States Colombia Trade Promotion Agreement
 Trade Facts Office of the United States Trade Representative www.ustr.gov June 2007 Free Trade with Colombia Summary of the United States Colombia Trade Promotion Agreement The United States Colombia Trade
Market Briefing: S&P 500 Revenues & the Economy
 Market Briefing: S&P Revenues & the Economy December 14, 2 Dr. Edward Yardeni 16-972-7683 eyardeni@ Joe Abbott 732-497-36 jabbott@ Mali Quintana 48-664-1333 aquintana@ Please visit our sites at www. blog.
HP Priority Services - Overview
 HP Priority Services - Overview Premium enterprise-level global support for your entire Install base. May 2016 1 Overview Priority Services: Premium enterprise-level global support for your entire Install
Sybase Solutions for Healthcare Adapting to an Evolving Business and Regulatory Environment
 Sybase Solutions for Healthcare Adapting to an Evolving Business and Regulatory Environment OVERVIEW Sybase Solutions for Healthcare Adapting to an Evolving Business and Regulatory Environment Rising medical
Global Education Office University of New Mexico MSC06 3850, Mesa Vista Hall, Rm. 2120 Tel. 505 277 4032, Fax 505 277 1867, geo@unm.
 Global Education Office University of New Mexico MSC06 3850, Mesa Vista Hall, Rm. 220 Tel. 505 277 4032, Fax 505 277 867, geo@unm.edu Report on International Students, Scholars and Study Abroad Programs
THE ICSID CASELOAD STATISTICS (ISSUE 2015-1)
") THE ICSID CASELOAD STATISTICS (ISSUE 05-) The ICSID Caseload Statistics (Issue 05-) This issue of the ICSID Caseload Statistics updates the profile of the ICSID caseload, historically and for the calendar
THE ICSID CASELOAD STATISTICS (ISSUE 05-) The ICSID Caseload Statistics (Issue 05-) This issue of the ICSID Caseload Statistics updates the profile of the ICSID caseload, historically and for the calendar
Senate Committee: Education and Employment. QUESTION ON NOTICE Budget Estimates 2015-2016
 Senate Committee: Education and Employment QUESTION ON NOTICE Budget Estimates 2015-2016 Outcome: Higher Education Research and International Department of Education and Training Question No. SQ15-000549
Intellectual Property Rights and Exporting: A Step-by-Step Guide
 Intellectual Property Rights and Exporting: A Step-by-Step Guide Bijou Mgbojikwe Office of Intellectual Property Rights International Trade Administration May 1, 2014 Session Objectives After this session,
OCTOBER 2010. Russell-Parametric Cross-Sectional Volatility (CrossVol ) Indexes Construction and Methodology
 Indexes Construction and Methodology") OCTOBER 2010 Russell-Parametric Cross-Sectional Volatility (CrossVol ) Indexes Construction and Methodology SEPTEMBER 2010 Russell-Parametric Cross-Sectional Volatility (CrossVol) Indexes Construction
OCTOBER 2010 Russell-Parametric Cross-Sectional Volatility (CrossVol ) Indexes Construction and Methodology SEPTEMBER 2010 Russell-Parametric Cross-Sectional Volatility (CrossVol) Indexes Construction
360 o View of. Global Immigration
 360 o View of Global Immigration In a fast moving global economy, remaining compliant with immigration laws, being informed and in control is more challenging than ever before. We are a globally linked
PERU TRADE BARRIERS FREE TRADE NEGOTIATIONS
 PERU TRADE BARRIERS The U.S. trade deficit with Peru was $1.6 billion in 2004, an increase of $895 million from $710 million in 2003. U.S. goods exports in 2004 were $2.1 billion, up 23.4 percent from
The Role of Banks in Global Mergers and Acquisitions by James R. Barth, Triphon Phumiwasana, and Keven Yost *
 The Role of Banks in Global Mergers and Acquisitions by James R. Barth, Triphon Phumiwasana, and Keven Yost * There has been substantial consolidation among firms in many industries in countries around
Sulfuric Acid 2013 World Market Outlook and Forecast up to 2017
 Brochure More information from http://www.researchandmarkets.com/reports/2547547/ Sulfuric Acid 2013 World Market Outlook and Forecast up to 2017 Description: Sulfuric Acid 2013 World Market Outlook and
Global Dialing Comment. Telephone Type. AT&T Direct Number. Access Type. Dial-In Number. Country. Albania Toll-Free 00-800-0010 888-426-6840
 Below is a list of Global Access Numbers, in order by country. If a Country has an AT&T Direct Number, the audio conference requires two-stage dialing. First, dial the AT&T Direct Number. Second, dial
Contact Centers Worldwide
 A Contact Centers Worldwide Country Tel.no. Supported lang. Contact Center Albania Algeria 852 665 00 +46 10 71 66160 Angola 89900 +34 91 339 2121 (Port) and Portuguese +34 913394044 +34 913394023 (Por)
Free Trade Agreements and State-Level Trade. By Joan Shipps Office of Trade Policy Analysis Industry Analysis
 Free Trade Agreements and State-Level Trade By Joan Shipps Office of Trade Policy Analysis Industry Analysis February 7, 2013 Free Trade Agreements and State-Level Trade Executive Summary: OTPA has conducted
Global Media Report. Global Industry Overview
 Global Media Report 203 Global Industry Overview McKinsey & Company Global Media Report 203 McKinsey & Company s Global Media and Entertainment Practice Never before has an integrated view across the media
ANNUAL REPORT ON DISCRIMINATION IN FOREIGN GOVERNMENT PROCUREMENT April 30, 2001
 ANNUAL REPORT ON DISCRIMINATION IN FOREIGN GOVERNMENT PROCUREMENT April 30, 2001 I. Introduction A longstanding objective of U.S. trade policy has been to open opportunities for U.S. suppliers to compete
THE BILATERAL FREE TRADE AGREEMENT BETWEEN CHINA AND SWITZERLAND A NEW WORLD OF OPPORTUNITIES
 November 2014 THE BILATERAL FREE TRADE AGREEMENT BETWEEN CHINA AND SWITZERLAND A NEW WORLD OF OPPORTUNITIES Studio Fiam S.A. Gestioni e consulenze aziendali DFK (SWITZERLAND) SA Via Frasca, 3 CH 6901 LUGANO
How Much Do U.S. Multinational Corporations Pay in Foreign Income Taxes?
 FISCAL FACT May. 2014 No. 432 How Much Do U.S. Multinational Corporations Pay in Foreign Income Taxes? By Kyle Pomerleau Economist Key Findings The United States worldwide system of corporate taxation
THE LOW INTEREST RATE ENVIRONMENT AND ITS IMPACT ON INSURANCE MARKETS. Mamiko Yokoi-Arai
 THE LOW INTEREST RATE ENVIRONMENT AND ITS IMPACT ON INSURANCE MARKETS Mamiko Yokoi-Arai Current macro economic environment is of Low interest rate Low inflation and nominal wage growth Slow growth Demographic
Reporting practices for domestic and total debt securities
 Last updated: 4 September 2015 Reporting practices for domestic and total debt securities While the BIS debt securities statistics are in principle harmonised with the recommendations in the Handbook on
The VAT & Invoicing Requirements Update March 2012
 The VAT & Invoicing Requirements Update March 2012 Indirect taxes are a massive potential expense. For buyers and sellers of goods and services, how invoices are prepared and processed can affect a company's
2012 Country RepTrak Topline Report
 2012 Country RepTrak Topline Report The World s View on Countries: An Online Study of the Reputation of 50 Countries RepTrak is a registered trademark of Reputation Institute. Global Reputation Knowledge
Outlines of the Trans-Pacific Partnership Agreement
 Page 1 of 5 Outlines of the Trans-Pacific Partnership Agreement ENHANCING TRADE AND INVESTMENT, SUPPORTING JOBS, ECONOMIC GROWTH AND DEVELOPMENT: OUTLINES OF THE TRANS-PACIFIC PARTNERSHIP AGREEMENT On
Non-Resident Withholding Tax Rates for Treaty Countries 1
 Non-Resident Withholding Tax Rates for Treaty Countries 1 firms Non-Resident Withholding Tax Rates for Treaty Countries 1 Country 2 Interest 3 Dividends 4 Royalties 5 Annuities 6 Pensions/ Algeria 15%
Clinical Trials. Local Trial Requirements
 Clinical Trials Clinical trials insurance covers the legal liabilities of the insured in respect of clinical trials for bodily injury arising from the trial. The coverage provided by Newline is on the
Fall 2015 International Student Enrollment
 Fall 2015 International Student Enrollment Prepared by The Office of International Affairs Nova Southeastern University Nova Southeastern University International Student Statistics Fall 2015 International
Faster voice/data integration for global mergers and acquisitions
 Global agility in technology solutions. sm Faster voice/data integration for global mergers and acquisitions >The InTech Group, Inc. Worldwide in-country technical resources for newly merged companies
Doing Business in Australia and Hong Kong SAR, China
 Doing Business in Australia and Hong Kong SAR, China Mikiko Imai Ollison Private Sector Development Specialist Nan Jiang Private Sector Development Specialist Washington, DC October 29, 2013 What does
Carnegie Mellon University Office of International Education Admissions Statistics for Summer and Fall 2013
 Carnegie Mellon University Admissions Statistics for and Fall 2013 New International Students and Fall 2012 Undergraduate 270 14.3% Master's 1301 68.7% Doctorate 192 10.1% Exchange 99 5.2% 31 1.6% Total
International Financial Reporting Standards
 International Financial Reporting Standards Of Growing Importance for U.S. Companies Assurance Services there is no longer a choice Three factors may influence your need to consider IFRS. First, many organizations
Cisco Global Cloud Index Supplement: Cloud Readiness Regional Details
 White Paper Cisco Global Cloud Index Supplement: Cloud Readiness Regional Details What You Will Learn The Cisco Global Cloud Index is an ongoing effort to forecast the growth of global data center and
Manpower Employment Outlook Survey Singapore Q3 2014. A Manpower Research Report
 Manpower Employment Outlook Survey Singapore Q3 14 A Manpower Research Report Contents Q3/14 Singapore Employment Outlook 2 Sector Comparisons Global Employment Outlook 6 International Comparisons - Asia
The World Market for Medical, Surgical, or Laboratory Sterilizers: A 2013 Global Trade Perspective
 Brochure More information from http://www.researchandmarkets.com/reports/2389480/ The World Market for Medical, Surgical, or Laboratory Sterilizers: A 2013 Global Trade Perspective Description: This report
BIS CEMLA Roundtable on Fiscal Policy, public debt management and government bond markets: issues for central banks
 BIS CEMLA Roundtable on Fiscal Policy, public debt management and government bond markets: issues for central banks Is monetary policy constrained by fiscal policy? by Carlos Montoro 26-27 November 212
INTERNATIONAL BUSINESS DEVELOPMENT -- STRATEGIC PLANNING ISSUES
 INTERNATIONAL BUSINESS DEVELOPMENT -- STRATEGIC PLANNING ISSUES April 15, 2009 Thomas B. McVey Williams Mullen 1666 K Street, NW Washington, D.C. 202.293.8118 tmcvey@williamsmullen.com IS THE COMPANY AT
Composition of Premium in Life and Non-life Insurance Segments
 2012 2nd International Conference on Computer and Software Modeling (ICCSM 2012) IPCSIT vol. 54 (2012) (2012) IACSIT Press, Singapore DOI: 10.7763/IPCSIT.2012.V54.16 Composition of Premium in Life and
Dow Jones Titans Indices Methodology
 Dow Jones Titans Indices Methodology March 2014 S&P Dow Jones Indices: Index Methodology Table of Contents Introduction 4 Highlights and Index Family 4 Eligibility Criteria and Index Construction 7 Dow
Carnegie Mellon University Office of International Education Admissions Statistics for Summer and Fall 2010
 Carnegie Mellon University Admissions Statistics for and Fall 2010 New International Students and Fall 2010 Undergraduate 208 16.1% Master's 799 61.7% Doctorate 177 13.7% Exchange 80 6.2% 31 2.4% Total
The Determinants of Global Factoring By Leora Klapper
 The Determinants of Global Factoring By Leora Klapper Factoring services can be traced historically to Roman times. Closer to our own era, factors arose in England as early as the thirteenth century, as
2013 NORTH CAROLINA ANNUAL TRADE REPORT
 NORTH CAROLINA ANNUAL TRADE REPORT Overview: North Carolina s steady export growth continued in North Carolina s exports reported steady gains again in, building on four years of growth since the bottom
Section 4 Automotive policies in Mexico, Thailand and India
 Section 4 Automotive policies in Mexico, Thailand and India World automobile sales volume of declined in 2008 and 2009 due to sales drops in advanced economies but resumed growing in 2010. Since then,
BT Premium Event Call and Web Rate Card
 BT Managed Event and BT Self-Managed Event (also referred to as Express, Plus and Premium) Conference Bridge and Call for Booked Audio Conferencing Services will comprise the following for each phone-conference:
SUPPLEMENTAL EXECUTIVE RETIREMENT PLANS IN CANADA
 HEALTH WEALTH CAREER SUPPLEMENTAL EXECUTIVE RETIREMENT PLANS IN CANADA KEY FINDINGS FROM THE MERCER SERP DATABASE (2014 UPDATE) APRIL 2015 b CONTENTS 1. Introduction...2 2. Highlights of the Mercer SERP
Investing in the United States
 Investing in the United States 13 May 2015 ehealth Week 2015 Global Markets: Tools for Transatlantic Trade Kim Tuminaro Senior Trade Officer U.S. Department of State SelectUSA.gov U.S. Investment and Business
Global AML Resource Map Over 2000 AML professionals
 www.pwc.co.uk Global AML Resource Map Over 2000 AML professionals January 2016 Global AML Resources: Europe France Italy Jersey / Guernsey 8 Ireland 1 Portugal 7 Luxembourg 5 United Kingdom 1 50 11 Spain
41 T Korea, Rep. 52.3. 42 T Netherlands 51.4. 43 T Japan 51.1. 44 E Bulgaria 51.1. 45 T Argentina 50.8. 46 T Czech Republic 50.4. 47 T Greece 50.
 Overall Results Climate Change Performance Index 2012 Table 1 Rank Country Score** Partial Score Tendency Trend Level Policy 1* Rank Country Score** Partial Score Tendency Trend Level Policy 21 - Egypt***
How To Get A New Phone System For Your Business
 Cisco Phone Systems Telemarketing Script Cold Call 1. Locate Contact: Name listed Owner General Manager / Office Manager Chief BDM (Business Decision Maker) Note: Avoid talking to IT since this is not
MAUVE GROUP GLOBAL EMPLOYMENT SOLUTIONS PORTFOLIO
 MAUVE GROUP GLOBAL SOLUTIONS PORTFOLIO At Mauve Group, we offer a variety of complete employee management services such as Global Employment Solutions (GES), Professional Employment Outsourcing (PEO),
SuccessFactors Employee Central: Cloud Core HR Introduction, Overview, and Roadmap Update Joachim Foerderer, SAP AG
 Orange County Convention Center Orlando, Florida June 3-5, 2014 SuccessFactors Employee Central: Cloud Core HR Introduction, Overview, and Roadmap Update Joachim Foerderer, SAP AG SESSION CODE: 1812 Cloud
HAS BRAZIL REALLY TAKEN OFF? BRAZIL LONG-RUN ECONOMIC GROWTH AND CONVERGENCE
 HAS BRAZIL REALLY TAKEN OFF? BRAZIL LONG-RUN ECONOMIC GROWTH AND CONVERGENCE COUNTRY PROFILE: A COUNTRY IN TRANSFORMATION POLICY RECOMENDATIONS COUNTRY PROFILE Brazilian Equivalent Population in The World
Chart 1: Zambia's Major Trading Partners (Exports + Imports) Q4 2008 - Q4 2009. Switzernd RSA Congo DR China UAE Kuwait UK Zimbabwe India Egypt Other
 Q4 2008 - Q4 2009. Switzernd RSA Congo DR China UAE Kuwait UK Zimbabwe India Egypt Other") Bank of Zambia us $ Million 1. INTRODUCTION This report shows Zambia s direction of merchandise trade for the fourth quarter of 2009 compared with the corresponding quarter in 2008. Revised 1 statistics,
Bank of Zambia us $ Million 1. INTRODUCTION This report shows Zambia s direction of merchandise trade for the fourth quarter of 2009 compared with the corresponding quarter in 2008. Revised 1 statistics,
A Bird s Eye View of Global Real Estate Markets: 2012 Update
 A Bird s Eye View of Global Real Estate Markets: 2012 Update FEBRUARY 2012 US Research Paul Fiorilla Vice President paul.fiorilla@prudential.com Manidipa Kapas, CFA Director manidipa.kapas@prudential.com
Triple-play subscriptions to rocket to 400 mil.
 Triple-play criptions to rocket to 400 mil. Global triple-play criptions will reach 400 million by 2017; up by nearly 300 million on the end-2011 total and up by 380 million on the 2007 total, according
ishares MSCI ACWI ex US Consumer Discretionary Sector Index Fund ishares MSCI ACWI ex US Energy Sector Index Fund
 Date: July 19, 2010 BZX Information Circular 10-075 Re: ishares MSCI ACWI ex US Sector Index Funds ETFs (Nine Funds) Pursuant to Rule 14.1(c)(2) of the Rules of BATS Exchange, Inc. ( BATS or the Exchange
Building on +60 GW of experience. Track record as of 31 December 2013
 Building on +60 GW of experience Track record as of 31 December 2013 Can data and analysis make a difference on turbine performance? Proven technology. For Vestas, it is more than a saying it is something
DSV Air & Sea, Inc. Aerospace Sector. DSV Air & Sea, Inc. Aerospace
 DSV Air & Sea, Inc. Aerospace Sector DSV Air & Sea, Inc. Aerospace Introduction to DSV DSV is a global supplier of transport and logistics services. We have offices in more than 70 countries and an international
Excerpt Sudan Fixed Telecommunications: Low Penetration Rates Get a Boost from Broadband Internet and VoIP Services
 Excerpt Sudan Fixed Telecommunications: Low Penetration Rates Get a Boost from Broadband Internet and VoIP Services This report is part of Pyramid Research s series of Africa & Middle East Country Intelligence
Malta Companies in International Tax Structuring February 2015
 INFORMATION SHEET No. 126 Malta in International Tax Structuring February 2015 Introduction Malta is a reputable EU business and financial centre with an attractive tax regime and sound legislative framework.
Colombia in the world
 Colombia in the world Proexport around the world Process of attracting Foreign Direct Investment Proexport offers detailed and professional assistance for investors that find interesting business opportunities
Global Network Access International Access Rates
 Global Network Access International Access Rates We know that you need to communicate with your partners, colleagues and customers around the world. We make every effort to understand the difficulties
Global Dynamism Index (GDI) 2013 summary report. Model developed by the Economist Intelligence Unit (EIU)
 2013 summary report. Model developed by the Economist Intelligence Unit (EIU)") Global Dynamism Index (GDI) 2013 summary report Model developed by the Economist Intelligence Unit (EIU) What is the Global Dynamism Index (GDI)? the GDI assesses the dynamism of 60 of the world's largest
Global Dynamism Index (GDI) 2013 summary report Model developed by the Economist Intelligence Unit (EIU) What is the Global Dynamism Index (GDI)? the GDI assesses the dynamism of 60 of the world's largest
Schedule of Accreditation issued by United Kingdom Accreditation Service 21-47 High Street, Feltham, Middlesex, TW13 4UN, UK
 Schedule of United Kingdom Service 21-47 High Street, Feltham, Middlesex, TW13 4UN, UK ISO/IEC 17021:2011 to provide environmental management systems certification Kitemark Court Davy Avenue Knowlhill
SUBMISSIONS TO THE PORTFOLIO COMMITTEE ON TRADE & INDUSTRY ON THE PROMOTION AND PROTECTION OF INVESTMENT BILL, 2015
 SUBMISSIONS TO THE PORTFOLIO COMMITTEE ON TRADE & INDUSTRY ON THE PROMOTION AND PROTECTION OF INVESTMENT BILL, 2015 ANGLO AMERICAN SOUTH AFRICA LIMITED 15 September 2015 ABOUT ANGLO AMERICAN SOUTH AFRICA
SURVEY 2015. The Italian Construction Companies in the World EDITED BY ANCE - ITALIAN CONTRACTORS ASSOCIATION
 SURVEY 2015 The Italian Construction Companies in the World EDITED BY ANCE - ITALIAN CONTRACTORS ASSOCIATION Ten years of international growth The international turnover of the Italian Construction Companies
SEPTEMBER 2012 TALENT ASSESSMENT IN M&A THE PEOPLE FACTOR
 SEPTEMBER 2012 TALENT ASSESSMENT IN M&A THE PEOPLE FACTOR It is critical to assess the target company s human capital with the same rigor that s applied toward assessing pension liabilities, inventories,
ADVOC. the international network of independent law firms
 ADVOC the international network of independent law firms About ADVOC ADVOC is an international network of independent law firms, sharing international expertise in jurisdictions across the globe Our member
EXPORT-IMPORT BANK OF INDIA: Catalysing India s Trade and Investment. July 01, 2015
 EXPORT-IMPORT BANK OF INDIA: Catalysing India s Trade and Investment July 01, 2015 INDIAN ECONOMY SNAPSHOT PARAMETER FY 2010 FY 2013 FY 2014 FY 2015 GDP (current prices, US$ bn) 1365.4 1835.8 1875.9 2050.6
TAZEEM PASHA MANAGER, BUSINESS RETENTION AND EXPANSION SELECTUSA U.S. DEPARTMENT OF COMMERCE
 TAZEEM PASHA MANAGER, BUSINESS RETENTION AND EXPANSION SELECTUSA U.S. DEPARTMENT OF COMMERCE Tazeem Pasha serves as Manager, Business Retention and Expansion at SelectUSA. Established by Executive Order
Software Tax Characterization Helpdesk Quarterly June 2008
 & McKenzie Software Tax Characterization Helpdesk Quarterly June 2008 Characterizing foreign software revenues is a complex challenge for large and small software firms alike. Variations in the rules around
A Nielsen Report Global Trust in Advertising and Brand Messages. April 2012
 A Nielsen Report Global Trust in Advertising and Brand Messages April 2012 CONSUMER TRUST IN EARNED ADVERTISING GROWS IN IMPORTANCE Earned media sources remain most credible Trust in traditional paid advertising
Business Phone. Product solutions. Key features
 Product solutions Enjoy free calls and significant savings on your business landline bills with from International. Set-up is simple and you don t need to change your existing telephone numbers, plus there