Group Financial Overview and Trends for the Quarter ended 31 January 2012
|
|
|
- Melanie Tyler
- 8 years ago
- Views:
Transcription
1 Group Financial Overview and Trends for the Quarter ended 31 January 2012 Page Overview of Quarter Results 1 to 3 Consolidated Profit and Loss Account 4 Key Performance Indicators Profit and Loss Account 5 Consolidated Balance Sheet 6 Key Performance Indicators Balance Sheet 7 Primary Segment Information 8 Analysis of Revenues 9 to 11 Tower Information 11 & 12 Client wins & hedge 13 Trends
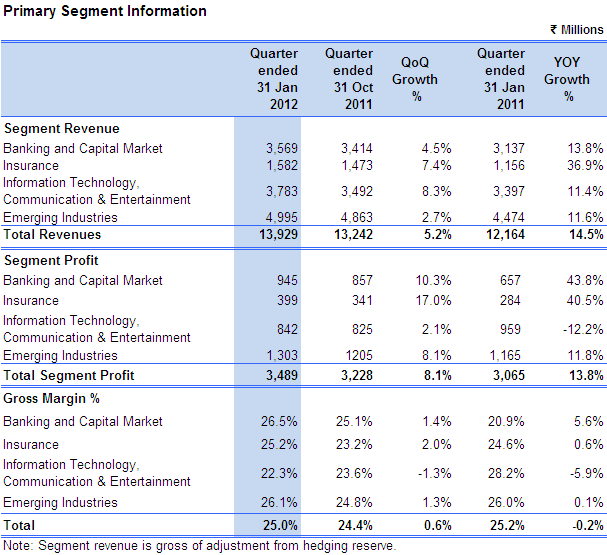
2 Overview of Quarter Results Safe Harbor: Certain statements in this document may be forward-looking statements. Such forward-looking statements are subject to certain risks and uncertainties like regulatory changes, local political or economic developments, and many other factors that could cause our actual results to differ materially from those contemplated by the relevant forward-looking statements. MphasiS will not be in any way responsible for any action taken based on such statements and undertakes no obligation to publicly update these forward-looking statements to reflect subsequent events or circumstances. 1. Key Highlights Net revenues grew 4.1% QoQ Direct business revenues witnessed robust growth of 14.4% QoQ 60 bps improvement in EBITDA Cash generated from operations during the quarter was at ` 2,383 million 2. Strategy in action a. Direct Business The Company s results demonstrate that its focus on strategic business areas is gaining ground. Sustained momentum in Direct business delivered sequential growth of 14.4% in Rupee terms. Net of Rupee depreciation, revenues grew by 8.8% QoQ. Significant Direct business expansion continued in Mature as well as Emerging markets, which grew by 10.4% and 27.7% respectively QoQ. 17 new Direct business clients of the 28 clients added during the quarter. HP/Direct business mix shifted from 62:38 (Q4) to 58:42 (Q1), a significant step towards addressing single client concentration risk. Infrastructure services within the Direct business saw strong momentum this quarter, growing 48.9% sequentially. MphasiS-Wyde's Wynsure system recently went live at Symetra Life Insurance Company to support its growing group life and disability income insurance business. This was the first implementation following the acquisition of Wyde. 1
3 b. HP Business Key highlights of the HP related business for the Company: HP business revenues witnessed QoQ decline of 0.5%. o Net of rupee depreciation, revenues declined by 4.0% o Seasonally subdued quarter on account of annual shutdown at HP o Revenues also impacted due to ramp downs in certain projects 11 new clients added during the quarter in HP business 3. Financial indicators a. Revenues Revenues (net of hedge) grew by 4.1% in Rupee terms to ` 13,672 million o Net of rupee depreciation, revenues grew by 0.9% Strong traction seen in key strategic verticals of Banking & Capital Markets (BCM) and Insurance which grew sequentially by 4.5% and 7.4% respectively. b. Gross Profit Gross profit increased by 3.5% to ` 3,232 million in the current quarter from ` 3,124 million in Q4. This increase can be attributed mainly to the Company s cost optimization drive which is yielding significant results. Increase in offshore utilization, proactive planning to reduce the impact of the annual holiday shutdown period, new initiatives such as the US employee medical insurance policy re-negotiations reflect the improvement seen in the quarter. c. Selling Expenses Selling expenses for the quarter increased by 0.3% to ` 669 million, higher by ` 2 million as compared to ` 667 million in the preceding quarter. During the quarter the Company strengthened its sales team by adding 18 sales personnel. d. General and Administrative Expenses General and administrative expenses for the quarter were at ` 509 million, lower by ` 11 million as compared to ` 520 million in the preceding quarter. This reduction is the result of tight controls on discretionary expenses and hiring freeze on non-billable and non-sales personnel resulting in a G&A headcount decline of 33 during the quarter. e. EBITDA EBITDA margins improved 60 basis points from 17.9% in Q4 to 18.5% in Q1 FY12 despite being a seasonally weak quarter. This represents a reversal of the trend of declining EBITDA margins over the last three quarters. The Company is now within its target margin band of 18% to 21%. 2
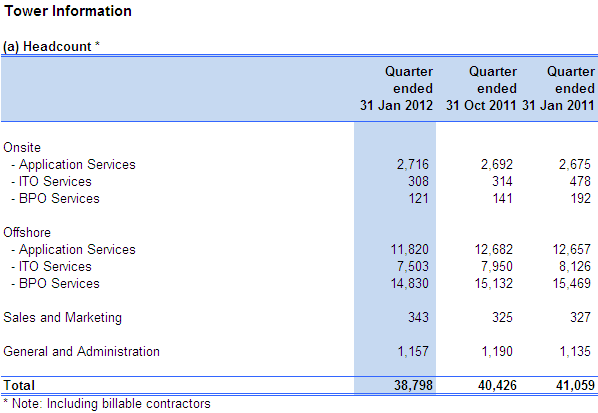
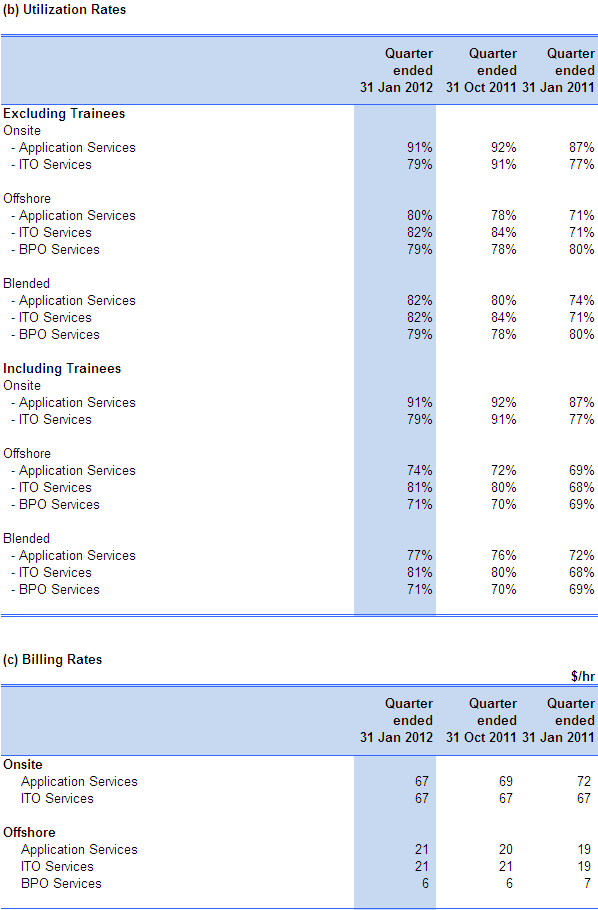
4 f. Other income / (expense), net Other income for the quarter was ` 288 million against ` 301 million the previous quarter. The reduction is due to cash outflow for the Wyde acquisition in Q4 FY11. g. Cash Management Cash and cash equivalents increased by ` 1,158 million during the quarter to ` 21,819 million. Cash of ` 510 million was utilized as earnest money deposits for various Government tenders. Gross increase in cash balance during the quarter was around US$ 34 million. 4. Operational indicators a. Billing Rates Offshore average Application billing rates witnessed an increase from $ 20 per hour to $ 21 per hour mainly driven by optimal deployment of resources leading to efficient project execution. b. Utilization Onsite Application services utilization drop restricted to 100 basis points despite annual holiday shutdown in onsite locations. Utilization in offshore Application services witnessed an increase of 200 basis points and offshore BPO services increased by 100 basis points. Offshore ITO services utilization decreased by 200 basis points due to annual holiday shutdown and ramp down of projects in the HP channel. c. Unbilled Revenues Unbilled revenues showed an 11% reduction of ` 749 million in Q1 FY12 driven by operational efficiencies. Tower Financials: MphasiS embarked on a three-year transformation process in FY2011, following which the company has started evaluating its financial performance on the basis of key industry vertical segments. However, to maintain continuity of data, contribution from its three business Towers was being provided in quarterly financial releases through FY Starting Q1 FY2012, provision of Tower revenues is being discontinued as the company no longer evaluates its performance on the basis of this parameter. 3

5 * Cost of Revenue for the quarter ended Q1 FY12 are net of reversal of certain provisions which are no longer required amounting to ` Nil (Q4 FY11: ` Nil; Q1 FY11: ` 258 million). **General & Administrative expenses for the quarter ended Q1 FY12 are net of reversal of certain provisions which are no longer required amounting to ` Nil (Q4 FY11: ` Nil; Q1 FY11: ` 176 million). 4

6 5

7 6

8 Cash and bank balance and Investment of cash surplus Cash and cash equivalents consists of cash & bank balances and short-term investments that are readily convertible to known amounts of cash and which are subject to an insignificant risk of changes in value. It also includes restricted deposits amounting ` 31 million (Q4 FY11 - `55 million, Q1 FY11 - `71 million) The Group s treasury policy calls for investing only in fixed deposits of highly rated banks, units of debt mutual funds and fixed maturity plans (FMP) for maturities up to 6 months. Stringent guidelines have been set for de-risking counter party exposures. The Group maintains balances both in Indian Rupee and foreign currency accounts in India and overseas. The investment philosophy of the Group is to ensure capital preservation and liquidity in preference to returns. 7
9 8

10 9
11 10
12 11
13 12

14 Our exposure to foreign exchange risk arises principally on account of non-functional monetary assets/liabilities at the balance sheet date and highly probable forecast transactions denominated in USD, GBP, EUR, AUD, CAD & SGD. We have sought to reduce the effect of foreign exchange risk arising from the exposures on our results by purchasing forward foreign exchange contracts. These contracts are entered into in a systematic manner over the lifecycle of the exposure in accordance with the FX Risk Management Policy as laid down by the Treasury Committee of the Board of Directors. These instruments typically have maturities of one to twenty four months. We use these instruments as hedges and not for speculative purposes and all of them qualify for hedge accounting under AS-30 published by the Institute of Chartered Accountants of India. 13
15 EBITDA Net Margin 14
16 Utilization Group Client Concentration 15
17 Cash and cash equivalents - ` Million Debtors Days 16
For Immediate Release February 9, 2016. Hinduja Global Solutions Limited
 PRESS RELEASE For Immediate Release February 9, 2016 Hinduja Global Solutions Limited FY2016 Consolidated Performance Highlights Net Sales of Rs. 8,829 million, an increase of 20.5% y-o-y EBITDA of Rs.
NEXJ SYSTEMS INC. MANAGEMENT S DISCUSSION AND ANALYSIS OF FINANCIAL CONDITION AND RESULTS OF OPERATIONS
 NEXJ SYSTEMS INC. MANAGEMENT S DISCUSSION AND ANALYSIS OF FINANCIAL CONDITION AND RESULTS OF OPERATIONS This management s discussion and analysis of financial condition and results of operations (the MD&A
STATEMENT OF STANDALONE UNAUDITED RESULTS FOR THE QUARTER AND SIX MONTHS ENDED SEPTEMBER 30, 2015
 Hinduja Global Solutions Limited (CIN: L92199MH1995PLC084610) Regd. Office : 171, Dr. Annie Besant Road, Worli, Mumbai - 400018. Contact no.: 022-2496 0707, Fax: 022-2497 4208 Website: www.teamhgs.com
INR Volatility - Hedging Options & Effective Strategies
 INR Volatility - Hedging Options & Effective Strategies The purpose of the article is to draw attention on the recent volatility in Indian Rupee, various hedging options and effective hedging strategies.
News Release January 28, 2016. Performance Review: Quarter ended December 31, 2015
 News Release January 28, 2016 Performance Review: Quarter ended December 31, 20% year-on-year growth in total domestic advances; 24% year-on-year growth in retail advances 18% year-on-year growth in current
Second Quarter 2015 Investor Conference Call
 Second Quarter 2015 Investor Conference Call August 20, 2015 December 13, 2012 DRAFT 5 Safe Harbor Basis of Presentation Unless otherwise noted or unless the context otherwise requires, all references
FY15 Supplemental Information January 5, 2016
 FY15 Supplemental Information January 5, 2016 Safe Harbor This document contains certain forward-looking statements. These statements are based on the company s current expectations as to the outcome and
IFGL REFRACTORIES LTD. RESULT UPDATE PRESENTATION, February 2016
 IFGL REFRACTORIES LTD RESULT UPDATE PRESENTATION, February 2016 Safe Harbor This presentation and the accompanying slides (the Presentation ), has been prepared by IFGL Refractories Limited (the Company
Three Months Ended March 31, 2015 Revenues $ 15,420 $ 17,258 Increase in revenues year over year 19% 12%
 Exhibit 99.1 Google Inc. Announces First Quarter 2015 Results MOUNTAIN VIEW, Calif. April 23, 2015 - Google Inc. (NASDAQ: GOOG, GOOGL) today announced financial results for the quarter ended. Google s
Software AG Results 1 st Quarter 2015 (IFRS, unaudited)
") Software AG Results 1 st Quarter (IFRS, unaudited) April 29, 1 Safe Harbor This presentation includes forward-looking statements based on the beliefs of Software AG management. Such statements reflect
Software AG Results 1 st Quarter (IFRS, unaudited) April 29, 1 Safe Harbor This presentation includes forward-looking statements based on the beliefs of Software AG management. Such statements reflect
FINANCIAL INFORMATION CONSOLIDATED FINANCIAL STATEMENTS. Risk management
 167 Risk management Group risk management Group Risk Management supports the Board of Directors, the Executive Committee and the management teams of the Group companies in their strategic decisions. Group
MphasiS Limited Q1 FY2012 Results Conference Call
 MphasiS Limited Q1 FY2012 Results Conference Call MphasiS Participants March 2, 2012 Mr. CEO, MphasiS Limited Mr. CFO, MphasiS Limited Page 1 of 21 Ladies and gentlemen, good day and welcome to the MphasiS
Indian Accounting Standard (Ind AS) 7 Statement of Cash Flows
 7 Statement of Cash Flows") Contents Indian Accounting Standard (Ind AS) 7 Statement of Cash Flows Paragraphs OBJECTIVE SCOPE 1 3 BENEFITS OF CASH FLOW INFORMATION 4 5 DEFINITIONS 6 9 Cash and cash equivalents 7 9 PRESENTATION OF
Contents Indian Accounting Standard (Ind AS) 7 Statement of Cash Flows Paragraphs OBJECTIVE SCOPE 1 3 BENEFITS OF CASH FLOW INFORMATION 4 5 DEFINITIONS 6 9 Cash and cash equivalents 7 9 PRESENTATION OF
Electronic Arts Inc. Q3 FY 2016 Results. January 28, 2016
 Electronic Arts Inc. Q3 FY 2016 January 28, 2016 Safe Harbor Statement Please review our risk factors on Form 10-K and Form 10-Q filed with the SEC. Some statements set forth in this document, including
Consolidated Interim Earnings Report
 Consolidated Interim Earnings Report For the Six Months Ended 30th September, 2003 23th Octorber, 2003 Hitachi Capital Corporation These financial statements were prepared for the interim earnings release
2014 Half-Year Results
 2014 Half-Year Results July 30, 2014 Amsterdam Nancy McKinstry Chief Executive Officer and Chairman Kevin Entricken Chief Financial Officer Forward-looking Statements This presentation contains forward-looking
Consolidated Financial Statements for the Third Quarter of the Fiscal Year Ending March 31, 2008
 February 5, 2008 Consolidated Financial Statements for the Third Quarter of the Fiscal Year Ending March 31, 2008 Corporate Name: Alfresa Holdings Corporation (Code: 2784, 1st sections of Tokyo Stock Exchange
Unless otherwise stated, references to 2007 are made in relation to the first half of the year.
 Standard Chartered PLC Pre-close Trading Update 26 June 2008 Standard Chartered PLC will be holding discussions with analysts and investors ahead of its close period for the half year ending 30 June 2008.
Key performance indicators
 The information included in the following sheets of this Excel file forms an integral part of the Aegon press release on the Q2 results 2013 as published on August 8, 2013. Cautionary note regarding non-ifrs
2004 THIRD QUARTER REPORT TO UNITHOLDERS
 2004 THIRD QUARTER REPORT TO UNITHOLDERS Report to Unitholders The North West Company Fund reports third quarter earnings to October 30, 2004 of $11.0 million, an increase of 3.2% compared to last year
Metsä Board Metsä Board
 Metsä Board Financial 215 Financial statements statements review review 215 Highlights in 215 Paperboard delivery volumes increased by 12% compared to 214 Operating profit improved 32% Strong operating
Financial Results Q1 2014. Jacques Purnode, Chief Finance Officer
 Financial Results 2014 Jacques Purnode, Chief Finance Officer Forward Looking Statements This Presentation may include forward-looking statements. Forward-looking statements are statements regarding or
NEPAL ACCOUNTING STANDARDS ON CASH FLOW STATEMENTS
 NAS 03 NEPAL ACCOUNTING STANDARDS ON CASH FLOW STATEMENTS CONTENTS Paragraphs OBJECTIVE SCOPE 1-3 BENEFITS OF CASH FLOWS INFORMATION 4-5 DEFINITIONS 6-9 Cash and cash equivalents 7-9 PRESENTATION OF A
First Quarter 2015 Earnings Conference Call. April 28, 2015
 First Quarter 2015 Earnings Conference Call April 28, 2015 Forward-looking Statements This presentation contains forward-looking statements. These forward-looking statements include statements related
Walmart reports Q1 FY 16 EPS of $1.03
 Walmart reports Q FY 6 EPS of.03 Q diluted EPS from continuing operations was.03, within guidance of 0.95 to.0. Currency negatively impacted EPS by approximately 0.03. Walmart U.S..% comp includes positive
Postbank Group Interim Management Statement as of September 30, 2013
 Postbank Group Interim Management Statement as of September 30, 2013 Preliminary Remarks Macroeconomic Development Business Performance Preliminary Remarks This document is an interim management statement
Fourth Quarter 2008 Earnings Acquisition of Communication Services Group Supplemental Information
 Fourth Quarter 2008 Earnings Acquisition of Communication Services Group Supplemental Information Forward Looking Statements The statements contained in this release that are not historical facts are forward-looking
Oceaneering Reports First Quarter 2016 Results
 PRESS RELEASE Oceaneering Reports First Quarter 2016 Results April 25, 2016 Houston, Texas Oceaneering International, Inc. ( Oceaneering or the Company ) (NYSE:OII) today reported net income of $25.1 million,
Ricoh Company, Ltd. INTERIM REPORT (Non consolidated. Half year ended September 30, 2000)
") Ricoh Company, Ltd. INTERIM REPORT (Non consolidated. Half year ended September 30, 2000) *Date of approval for the financial results for the half year ended September 30, 2000, at the Board of Directors'
Ricoh Company, Ltd. INTERIM REPORT (Non consolidated. Half year ended September 30, 2000) *Date of approval for the financial results for the half year ended September 30, 2000, at the Board of Directors'
Sri Lanka Accounting Standard-LKAS 7. Statement of Cash Flows
 Sri Lanka Accounting Standard-LKAS 7 Statement of Cash Flows CONTENTS SRI LANKA ACCOUNTING STANDARD-LKAS 7 STATEMENT OF CASH FLOWS paragraphs OBJECTIVE SCOPE 1 3 BENEFITS OF CASH FLOW INFORMATION 4 5 DEFINITIONS
SUB: STANDARD CHARTERED PLC (THE "COMPANY") STOCK EXCHANGE ANNOUNCEMENT
 STOCK EXCHANGE ANNOUNCEMENT") April 26, 2016 To, Ms. D'souza AVP, Listing Department National Stock Exchange of India Exchange Plaza Bandra Complex Bandra (East) 400 001 Limited SUB: STANDARD CHARTERED PLC (THE "COMPANY") STOCK EXCHANGE
April 26, 2016 To, Ms. D'souza AVP, Listing Department National Stock Exchange of India Exchange Plaza Bandra Complex Bandra (East) 400 001 Limited SUB: STANDARD CHARTERED PLC (THE "COMPANY") STOCK EXCHANGE
Delta Galil Reports 2016 First Quarter Results
 Delta Galil Reports 2016 First Quarter Results Sales Rise to $256.7 Million; Net Income to Shareholders is $7.9 Million Reaffirms 2016 Guidance; Sales Expected to Reach $1,090 Million-$1,110 Million and
SHL Telemedicine Reports First Quarter 2015 Financial Results
 Press release SHL Telemedicine Reports First Quarter 2015 Financial Results Revenues of USD 9.5 million in the first quarter 2015, up 4.7% at constant exchange rates EBIT of USD 1.3 million (13.7% of revenues)
Q2 2014 Earnings Presentation July 30, 2014
 Q2 2014 Earnings Presentation July 30, 2014 1 Safe Harbor Statement Certain statements in the Business Update and Order Backlog sections contain forward-looking statements within the meaning of the safe
This has reference to our letter of even date (copy enclosed). We enclose the following: Press Release being issued by the Company
. We enclose the following: Press Release being issued by the Company") February 09,2016 BSE Limited Corporate Relation Dept. P. J. Towers, Dalal Street Mumbai 400 001. Scrip Code : 532859 National Stock Exchange of lndia Ltd. "Exchange Plaza", Bandra Kurla Complex, Bandra
February 09,2016 BSE Limited Corporate Relation Dept. P. J. Towers, Dalal Street Mumbai 400 001. Scrip Code : 532859 National Stock Exchange of lndia Ltd. "Exchange Plaza", Bandra Kurla Complex, Bandra
Results Presentation. Half-Year Ended 31 December 2011. ASX Code: SAI. Tony Scotton Chief Executive Officer. 15 February 2011
 Our compliance business has driven profit growth across the group despite reduced activity levels in our property business and the currency headwinds Tony Scotton Chief Executive Officer Results Presentation
Supplementary Material on Consolidated Financial Results for the First Six Months of the Fiscal Year Ending December 31, 2015
 Supplementary Material on Consolidated Financial Results for the First Six Months of the Fiscal Year Ending December 31, 2015
Alphabet Announces Fourth Quarter and Fiscal Year 2015 Results
 Exhibit 99.1 Alphabet Announces Fourth Quarter and Fiscal Year 2015 Results MOUNTAIN VIEW, Calif. February 1, 2016 Alphabet Inc. (NASDAQ: GOOG, GOOGL) today announced financial results for the quarter
ICANN Foreign Exchange Risk Management Policy May 2009
 ICANN Foreign Exchange Risk Management Policy May 2009 Table of Contents Page Number 1. Purpose 2 2. Scope 2 3. Objectives and Strategy 2 4. Definitions 2 5. FAS 133 and FAS 52 Accounting 4 6. Authorized
Firstsource Solutions Limited. August 2011
 Firstsource Solutions Limited August 2011 Disclaimer Certain statements in this presentation concerning our future growth prospects are forward-looking statements, which involve a number of risks, and
1Q15 Earnings Release. April 29 th 2015 LG Electronics
 1Q15 Earnings Release April 29 th 2015 LG Electronics All information regarding management performance and financial results of LG Electronics (the Company ) during the 1 st quarter of 2015 as contained
Nokia Conference Call Third Quarter 2004 Financial Results. Jorma Ollila Chairman and CEO Rick Simonson Senior Vice President and CFO
 Nokia Conference Call Third Quarter 2004 Financial Results Jorma Ollila Chairman and CEO Rick Simonson Senior Vice President and CFO Ulla James Vice President, Investor Relations October 14, 2004 15.00
Roche Capital Market Ltd Financial Statements 2014
 Roche Capital Market Ltd Financial Statements 2014 1 Roche Capital Market Ltd - Financial Statements 2014 Roche Capital Market Ltd, Financial Statements Roche Capital Market Ltd, statement of comprehensive
IGAS 3. Cash Flow Statements. Government Accounting Standards Advisory Board. Contents
 Cash Flow Statements Government Accounting Standards Advisory Board Contents Description Page Number 1. Introduction 3 2. Objective 3 3. Scope 3 4. Benefits of Cash Flow Information 4 5. Definitions 4
ACL International Ltd.
 ACL International Ltd. (formerly Anthony Clark International Insurance Brokers Ltd.) MANAGEMENT S DISCUSSION AND ANALYSIS FOR THE YEAR ENDED MARCH 31, 2014 June 26, 2014 MANAGEMENT S DISCUSSION AND ANALYSIS
Second Quarter 2015 Trading Update. 28 September 2015
 Second Quarter 2015 Trading Update 28 September 2015 Disclaimer This communication and the information contained herein has been approved by the Board of Directors of Eurobank Ergasias S.A. ( Eurobank
(2) Application of special accounting treatments for quarterly financial statements: Yes
 Application of special accounting treatments for quarterly financial statements: Yes") Name of listed company: JSR Corporation Code # 4185 Representative: Mitsunobu Koshiba, President Consolidated Business Results for the 1st Half, FY March 2015 Stock Exchange: Tokyo URL http://www.jsr.co.jp
Name of listed company: JSR Corporation Code # 4185 Representative: Mitsunobu Koshiba, President Consolidated Business Results for the 1st Half, FY March 2015 Stock Exchange: Tokyo URL http://www.jsr.co.jp
Q2 2015 Earnings Conference Call. July 30, 2015
 Q2 2015 Earnings Conference Call July 30, 2015 Industry Data and Forward-Looking Statements Disclaimer Broadwind obtained the industry and market data used throughout this presentation from our own research,
Walmart reports Q2 FY 16 EPS of $1.08, updates guidance Walmart U.S. delivered 1.5% comps, and improved customer experience scores
 Walmart reports Q2 FY 6 EPS of.08, updates guidance Walmart U.S. delivered.5% comps, and improved customer experience scores Q2 diluted EPS from continuing operations was.08. Currency exchange rates negatively
News Release April 29, 2016. Performance Review: Quarter ended March 31, 2016
 News Release April 29, Performance Review: Quarter ended March 31, 16% year-on-year growth in domestic advances; retail portfolio crossed ` 2,00,000 crore (US$ 30.2 billion) during the quarter ended March
Walmart reports Q3 FY 16 EPS of $1.03, Walmart U.S. added $2.7 billion in sales, comp sales of 1.5%
 Walmart reports Q3 FY 6 EPS of.03, Walmart U.S. added 2.7 billion in sales, comp sales of.5% Q3 diluted EPS from continuing operations was.03, benefited by approximately 0.04 from an adjustment for certain
Turnover of the foreign exchange and derivatives market in Hong Kong
 Turnover of the foreign exchange and derivatives market in Hong Kong by the Banking Policy Department Hong Kong advanced one place to rank sixth in the global foreign exchange market and seventh when taking
Klöckner & Co SE. Q3 2014 Results
 Klöckner & Co SE A Leading Multi Metal Distributor Gisbert Rühl CEO Marcus A. Ketter CFO Results Analysts and Investors Conference November 6, Disclaimer This presentation contains forward-looking statements
Trxade Group, Inc. (TCQB: TRXD): Record Revenues in Q3
: Record Revenues in Q3") Siddharth Rajeev, B.Tech, MBA, CFA Analyst November 5, 2015 Trxade Group, Inc. (TCQB: TRXD): Record Revenues in Q3 Sector/Industry: E-commerce Market Data (as of November 5, 2015) Current Price $1.15 Fair
Siddharth Rajeev, B.Tech, MBA, CFA Analyst November 5, 2015 Trxade Group, Inc. (TCQB: TRXD): Record Revenues in Q3 Sector/Industry: E-commerce Market Data (as of November 5, 2015) Current Price $1.15 Fair
NOTES TO CONSOLIDATED FINANCIAL STATEMENTS
 NOTES TO CONSOLIDATED FINANCIAL STATEMENTS (For consolidated balance sheets) (As of March 31, 2007) (As of March 31, 2008) 1. *1 Accumulated depreciation of property, plant and equipment 4,349,349 The
Summary of Financial Statements (J-GAAP) (Consolidated)
 (Consolidated)") Summary of Financial Statements (J-GAAP) (Consolidated) February 10, 2016 Company Name: Sodick Co., Ltd. Stock Exchange: Tokyo Stock Exchange, 1st Section Code Number: 6143 URL: http://www.sodick.co.jp
Summary of Financial Statements (J-GAAP) (Consolidated) February 10, 2016 Company Name: Sodick Co., Ltd. Stock Exchange: Tokyo Stock Exchange, 1st Section Code Number: 6143 URL: http://www.sodick.co.jp
Measuring performance Update to Insurance Key Performance Indicators
 Measuring performance Update to Insurance Key Performance Indicators John Hele Member of Executive Board and CFO of ING Group Madrid 19 September 2008 www.ing.com Agenda Performance Indicators: Background
KINAXIS INC. MANAGEMENT S DISCUSSION AND ANALYSIS FOR THE YEAR ENDED DECEMBER 31, 2014
 KINAXIS INC. MANAGEMENT S DISCUSSION AND ANALYSIS FOR THE YEAR ENDED DECEMBER 31, DATED: February 24, 2015 Unless the context requires otherwise, all references in this management s discussion and analysis
Debt Investors Call First Quarter 2015. Walldorf, Germany Monday, May 4, 2015
 Debt Investors Call First Quarter 2015 Walldorf, Germany Monday, May 4, 2015 Safe Harbor Statement Any statements contained in this document that are not historical facts are forward-looking statements
1Q16 Earnings Release. April 28 th 2016 LG Electronics
 1Q16 Earnings Release April 28 th 2016 LG Electronics All information regarding management performance and financial results of LG Electronics (the Company ) during the 1 st quarter of 2016 as contained
Interim Report January June 2001
 556025-5001 31 July 2001 Interim Report January June 2001 Quarter January-June MSEK 2001 II 2001 I 2000 II 2001 2000 Net turnover, MSEK 1,742 1,840 1,612 3,582 3,200 Operating profit, MSEK 319 469 290
O KEY GROUP ANNOUNCES AUDITED FINANCIAL RESULTS FOR 2014
 Press Release 19 March 2015 O KEY GROUP ANNOUNCES AUDITED FINANCIAL RESULTS FOR 2014 O KEY Group S.A (LSE: OKEY), a leading food retailer in Russia, today released audited consolidated financial results
Sunora Foods Inc. Condensed Interim Consolidated Financial Statements For the three months ended March 31, 2016 (unaudited)
") Condensed Interim Consolidated Financial Statements For the three months ended March 31, 2016 (unaudited) 1 Consolidated Balance Sheet (audited) March 31, December 31, Assets 2016 2015 Current assets Cash
Condensed Interim Consolidated Financial Statements For the three months ended March 31, 2016 (unaudited) 1 Consolidated Balance Sheet (audited) March 31, December 31, Assets 2016 2015 Current assets Cash
Q1 Fiscal Year 2016 Earnings Conference Call
 NASDAQ: CMCO Q1 Fiscal Year 2016 Earnings Conference Call July 31, 2015 Timothy T. Tevens President & Chief Executive Officer Gregory P. Rustowicz Vice President - Finance & Chief Financial Officer 2015
Forward-Looking Statements
 MANAGEMENT S DISCUSSION AND ANALYSIS For the three months ended March 31, 2010 Dated May 21, 2010 Management's Discussion and Analysis ( MD&A ) is intended to help shareholders, analysts and other readers
Roche Capital Market Ltd Financial Statements 2012
 R Roche Capital Market Ltd Financial Statements 2012 1 Roche Capital Market Ltd - Financial Statements 2012 Roche Capital Market Ltd, Financial Statements Reference numbers indicate corresponding Notes
Standard Chartered today releases its Interim Management Statement for the third quarter of 2015.
 Standard Chartered PLC Interim Management Statement 3 November 2015 Standard Chartered today releases its Interim Management Statement for the third quarter of 2015. Bill Winters, Group Chief Executive,
Financial Risk Management
 176 Financial Risk Management For the year ended 31 December 2014 1. FINANCIAL RISK MANAGEMENT OBJECTIVES AND POLICIES s major financial instruments include cash and bank balances, time deposits, principal-protected
APX GROUP HOLDINGS, INC. REPORTS FIRST QUARTER 2015 RESULTS
 APX GROUP HOLDINGS, INC. REPORTS FIRST QUARTER 2015 RESULTS First Quarter 2015 Financial and Portfolio Highlights APX Group Reports Total Revenue of $149.9 Million, up 14.9% Year over Year Adjusted EBITDA
First-Quarter 2014 Financial Results
 First-Quarter 2014 Financial Results www.unisys.com/investor Ed Coleman Chairman & CEO Janet Haugen SVP & CFO April 22, 2014 Disclaimer Statements made by Unisys during today's presentation that are not
HTC CORPORATION 4Q15 BUSINESS REVIEW. CHIALIN CHANG, CFO & PRESIDENT OF GLOBAL SALES EDWARD WANG, VP OF FINANCE February 3, 2016
 HTC CORPORATION 4Q15 BUSINESS REVIEW CHIALIN CHANG, CFO & PRESIDENT OF GLOBAL SALES EDWARD WANG, VP OF FINANCE February 3, 2016 DISCLAIMER STATEMENT This presentation and release contain forward-looking
Fiscal 4Q15 Results Conference Call
 Fiscal 4Q15 Results Conference Call May 3, 2016 Cautionary Statement SAFE HARBOR This release includes forward-looking statements within the meaning of the securities laws. The words may, could, should,
COMPUTERSHARE LIMITED (ASX:CPU) FINANCIAL RESULTS FOR THE FULL YEAR ENDED 30 JUNE 2014. 13 August 2014
 FINANCIAL RESULTS FOR THE FULL YEAR ENDED 30 JUNE 2014. 13 August 2014") COMPUTERSHARE LIMITED (ASX:CPU) FINANCIAL RESULTS FOR THE FULL YEAR ENDED 30 JUNE 2014 13 August 2014 NOTE: All figures (including comparatives) are presented in US Dollars (unless otherwise stated). The
COMPUTERSHARE LIMITED (ASX:CPU) FINANCIAL RESULTS FOR THE FULL YEAR ENDED 30 JUNE 2014 13 August 2014 NOTE: All figures (including comparatives) are presented in US Dollars (unless otherwise stated). The
Chapter 16: Financial Risk Management
 Chapter 16: Financial Risk Management Introduction Overview of Financial Risk Management in Treasury Interest Rate Risk Foreign Exchange (FX) Risk Commodity Price Risk Managing Financial Risk The Benefits
American International Group, Inc. First Quarter 2013 Results Conference Call Presentation. May 3, 2013
 American International Group, Inc. First Quarter 2013 Results Conference Call Presentation May 3, 2013 Cautionary Statement Regarding Projections and Other Information About Future Events This document
Zensar revenues up 12.8% in Third Quarter
 Zensar revenues up 12.8% in Third Quarter Infrastructure Management deals over 27 Mn USD signed Pune, India Jan 21, 2013: Zensar Technologies today announced its third Quarter results, reporting revenues
2 N D Q U A R T E R 2 0 1 6. O s l o, 1 8 J u l y 2 0 1 6
 2 N D Q U A R T E R 2 1 6 O s l o, 1 8 J u l y 2 1 6 Agenda Per A Sørlie, President & CEO Highlights Business areas Outlook Per Bjarne Lyngstad, CFO Financial performance 2 Highlights 2 nd quarter 216
3rd Quarter Fiscal 2016 Results Conference Call May 25, 2016
 3rd Quarter Fiscal 2016 Results Conference Call May 25, 2016 Looking Statements and Non-GAAP Information This presentation contains forward-looking statements. Other than statements of historical facts,
GrandVision reports Revenue growth of 13.8% and EPS growth of 31.7%
 GrandVision reports Revenue of 13.8% and EPS of 31.7% Schiphol, the Netherlands 16 March 2015. GrandVision NV (EURONEXT: GVNV) publishes Full Year and Fourth Quarter 2015 results. 2015 Highlights Revenue
GrandVision reports 2.8 billion Revenue and 449 million EBITDA for 2014
 GrandVision reports 2.8 billion Revenue and 449 million EBITDA for 2014 Schiphol, the Netherlands 18 March 2015. GrandVision N.V. publishes Full Year and Quarter 2014 results. 2014 Highlights Revenue grew
Consolidated and Non-Consolidated Financial Statements
 May 13, 2016 Consolidated and Non-Consolidated Financial Statements (For the Period from April 1, 2015 to March 31, 2016) 1. Summary of Operating Results (Consolidated) (April 1,
Vehicles on hire growth of 2,600 (8.1%) in Spain (2013 reduction of 1,900);
 in Spain (2013 reduction of 1,900);") 25 June 2014 NORTHGATE PLC PRELIMINARY RESULTS FOR THE YEAR ENDED 30 APRIL 2014 Results in line with Board s expectations, return to growth in both countries, significant increase in dividend Northgate
25 June 2014 NORTHGATE PLC PRELIMINARY RESULTS FOR THE YEAR ENDED 30 APRIL 2014 Results in line with Board s expectations, return to growth in both countries, significant increase in dividend Northgate
Applus+ Group Results Presentation Third Quarter 2014 November 3rd 2014
 Applus+ Group Results Presentation Third Quarter 2014 November 3rd 2014 DISCLAIMER This document may contain statements that constitute forward looking statements about Applus Services, SA ( Applus+ or
2Q14 Earnings Release
 2Q14 Earnings Release 2012년 July 24 th 2월 2014 1일 0 All information regarding management performance and financial results of LG Electronics (the Company ) during the 2 nd quarter of 2014 as contained
2012 LENOVO CONFIDENTIAL. ALL RIGHTS RESERVED.
 2 Record Fiscal Year All-time highs in revenue, market share and PTI Revenue $29.6 billion; Market Share 12.9%; PTI 582 million USD, up over 60% YTY Net income of 473 million USD, up over 70% YTY $30 Revenue
HP Inc. Reports Hewlett-Packard Company Fiscal 2015 Full-Year and Fourth Quarter Results
 HP Inc. 1501 Page Mill Road Palo Alto, CA 94304 hp.com News Release HP Inc. Reports Hewlett-Packard Company Fiscal 2015 Full-Year and Fourth Quarter Results Editorial contacts HP Inc. Media Relations MediaRelations@hp.com
Half year results 2011
 Half year results 2011 29 July 2011 Bert De Graeve, Chief Executive Officer Bruno Humblet, Chief Financial Officer Address by Bert De Graeve, Chief Executive Officer Introductory remark The consolidated
ACADIAN TIMBER CORP. REPORTS FOURTH QUARTER AND YEAR-END RESULTS
 News Release Investors, analysts and other interested parties can access Acadian Timber Corp. s 2015 Fourth Quarter Results conference call via webcast on Thursday, February 11, 2016 at 1:00 p.m. ET at
How To Sell An Investment Bank
 RESULTS PRESENTATION Half year ended 30 November 2013 IG H1 FY14 RESULTS PRESENTATION P1 DISCLAIMER This presentation, prepared by IG Group Holdings plc (the Company ), may contain forward-looking statements
Mr. N. S. Kannan s opening remarks for analyst call on January 28, 2016
 Mr. N. S. Kannan s opening remarks for analyst call on January 28, 2016 Good evening and welcome to the conference call on the financial results of ICICI Bank for the quarter ended December 31, 2015, that
Diluted net income per share. Six months ended Sep. 30, 2012 0.40 0.39 Six months ended Sep. 30, 2011 (1.09) -
 -") November 9, 2012 Summary of Consolidated Financial Results for the Second Quarter of Fiscal Year Ending March 31, 2013 (Six Months Ended September 30, 2012) [Japanese GAAP] Company name: Japan System Techniques
November 9, 2012 Summary of Consolidated Financial Results for the Second Quarter of Fiscal Year Ending March 31, 2013 (Six Months Ended September 30, 2012) [Japanese GAAP] Company name: Japan System Techniques
Mphasis. FY17 could be a year of revenue growth. Source: Company Data; PL Research
 FY17 could be a year of revenue growth February 08, 2016 Govind Agarwal govindagarwal@plindia.com +91 22 66322300 Rating Accumulate Price Rs440 Target Price Rs510 Implied Upside 15.9% Sensex 24,617 Nifty
Jerónimo Martins SGPS, S.A. First Quarter 2014 Results
 Jerónimo Martins SGPS, S.A. First Quarter 2014 In the first three months of the year, consolidated sales grew by 5.6% at constant exchange rates. This performance incorporates the negative calendar effect
Cash Flow Statements
 Compiled Accounting Standard AASB 107 Cash Flow Statements This compiled Standard applies to annual reporting periods beginning on or after 1 July 2007. Early application is permitted. It incorporates
Q3 Fiscal Year 2015 Earnings Conference Call
 NASDAQ: CMCO Q3 Fiscal Year 2015 Earnings Conference Call January 29, 2015 Timothy T. Tevens President & Chief Executive Officer Gregory P. Rustowicz Vice President - Finance & Chief Financial Officer
SBERBANK GROUP S IFRS RESULTS. March 2015
 SBERBANK GROUP S IFRS RESULTS 2014 March 2015 SUMMARY OF PERFORMANCE FOR 2014 STATEMENT OF PROFIT OR LOSS Net profit reached RUB 290.3bn (or RUB 13.45 per ordinary share), compared to RUB 362.0bn (or RUB
NEWS FOR IMMEDIATE RELEASE RUSSEL METALS ANNOUNCES STRONGER SECOND QUARTER 2010 NET EARNINGS
 NEWS FOR IMMEDIATE RELEASE RUSSEL METALS ANNOUNCES STRONGER SECOND QUARTER 2010 NET EARNINGS TORONTO, CANADA August 11, 2010 -- Russel Metals Inc. (RUS TSX) today announced second quarter earnings of $19
The Annual Analyst Conference will take place in London, on November 9, at 11 a.m. UK time, and will be webcast on www.siemens.com/investorrelations
 Siemens Q4 FY07 Flashlight The Annual Analyst Conference will take place in London, on November 9, at 11 a.m. UK time, and will be webcast on www.siemens.com/investorrelations The Press Conference will
Forward Looking Statement
 Forward Looking Statement This presentation contains forward-looking statements which are statements that refer to expectations and plans for the future and include, without limitation, statements regarding
As of December 31, 2014. As of December 31, 2015. Assets Current assets:
 Assets Current assets: Alphabet Inc. CONSOLIDATED BALANCE SHEETS (In millions, except share and par value amounts which are reflected in thousands, and par value per share amounts) As of December 31, 2014