A common carbon footprint approach for dairy The IDF guide to standard lifecycle assessment methodology for the dairy sector
|
|
|
- Harold Rice
- 8 years ago
- Views:
Transcription
1 Bulletin of the International Dairy Federation 445/ A common carbon footprint approach for dairy The IDF guide to standard lifecycle assessment methodology for the dairy sector

2 VIEW THE UPCOMING IDF EVENTS AT: Bulletin of the International Dairy Federation 445/ , International Dairy Federation GENERAL TERMS AND CONDITIONS FOR USING THIS ELECTRONIC PUBLICATION Introduction Use of the material provided in this publication is subject to the Terms and Conditions in this document. These Terms and Conditions are designed to make it clear to users of this material what they may and may not do with the content provided to them. Our aim has been to make the Terms and Conditions unambiguous and fair to all parties, but if further explanation is required, please send an to with your question. Permitted Use The User may make unlimited use of the Content, including searching, displaying, viewing on-screen and printing for the purposes of research, teaching or private study but not for commercial use. Copyright Site layout, design, images, programs, text and other information (collectively, the Content ) is the property of the International Dairy Federation and is protected by copyright and other intellectual property laws. Users may not copy, display, distribute, modify, publish, reproduce, store, transmit, create derivative works from, or sell or license all or any part of the content obtained from this publication. Copyright notices must not be modified or removed from any Content obtained under the terms of this licence. Any questions about whether a particular use is authorized and any requests for permission to publish, reproduce, distribute, display or make derivative works from any Content should be directed to info@fil-idf.org Availability Although the International Dairy Federation publications are developed in view of maximum user-friendliness, the International Dairy Federation cannot guarantee any of these products to work on or with any particular computer system. Liability Although the International Dairy Federation has taken reasonable care to ensure that the information, data and other material made available in its publication is error-free and up-to-date, it accepts no responsibility for corruption to the information, data and other material thereafter, including but not limited to any defects caused by the transmission or processing of the information, data and other material. The information made available in this publication, has been obtained from or is based upon sources believed by the International Dairy Federation to be reliable but is not guaranteed as to accuracy or completeness. The information is supplied without obligation and on the understanding that any person who acts upon it or otherwise changes his/her position in reliance thereon does so entirely at his/her own risk. Send any comments or inquiries to: International Dairy Federation (I.N.P.A.) Diamant Building Boulevard Auguste Reyers Brussels Belgium Phone: Fax: info@fil-idf.org Web:

3 FIL/IDF ISSN Bulletin of the International Dairy Federation CONTENTS PRICE: Free of charge 445/2010 methodology for the dairy sector Foreword 1 1. Introduction Background About this guide Who should use this guide? Attributional and consequential methods What you need before starting Future reviews and enhancements Summary 5 2. LCAs and carbon footprints: the basics Definition of a product carbon footprint The challenges of carbon footprinting Existing international standardization processes ISO series, encompassing ISO 14040, and future PAS 2050 (2008) Greenhouse Gas protocol Product/Supply Chain initiative of the WBCSD Summary 7 3. The steps in an LCA A summary of the steps Mapping the process Setting the scope and boundaries Collecting the data Calculating the carbon footprint Evaluating and reporting Mapping the process Creating a process Defining the process The Functional Unit Farming Processing Setting the Scope and Boundaries Farming Processing Emissions to be included Collecting data Data quality Emission Factors Allocation Co-products Production of feed Production of milk and meat Manufacture of dairy products On-site energy generation Summary for handling co-products Land use change and sequestration Land use change Carbon sequestration Calculating the footprint Evaluating and Reporting Report evaluation Reporting Key parameters in the report Glossary of terms Acknowledgements References Appendices 34 A. Functional Unit for Farming 34 B. Allocation Milk:Meat the scientific basis for the approach 35 C. Technical Data 38 Subscription Price for the electronic version of the 2010 Bulletin : 335 Euro for all issues. Adress orders to : INTERNATIONAL DAIRY FEDERATION / FEDERATION INTERNATIONALE DE LAITERIE Diamant Building, Boulevard Auguste Reyers, Brussels (Belgium) Telephone : Telefax : info@fil-idf.org -
 7 2.3.3 Greenhouse Gas protocol Product/Supply Chain initiative of the WBCSD 7 2.")
4 A common carbon footprint approach for dairy The IDF guide to standard lifecycle assessment methodology for the dairy sector Foreword Go green developments around the world in recent years have resulted in increasing interest from civil society, respective governments and individual consumers in how food is produced and the environmental impact of its production. In response to this, the dairy value chain has been actively working towards reducing greenhouse gas emissions associated with the production, collection and processing of milk and delivery of dairy products, while satisfying the needs of the marketplace in the most sustainable manner. In recent years, IDF has been particularly active in putting environmental concerns at the top of its priorities, through scientific research and a close dialogue with various key stakeholders worldwide. This IDF Guide will play a major contribution in supporting the evolution of efficient and sustainable businesses that strive to continually reduce their GHG emissions, and in helping the dairy industry to demonstrate a conscientious and accountable focus on environmental issues to all stakeholders. The IDF expresses its gratitude to the experts from the Action Team on Life Cycle Analysis / Life Cycle Management and Carbon Foot printing in the Dairy Sector for their outstanding commitment and hard work in developing and publishing this crucial document. Members of the Action Team include: Jim Barnett, Sophie Bertrand, Peter Roger Darlington, Robin Dickinson, Jean-Baptiste Dolle, Onur Durmus, Anna Flysjö, Thais H Passos Fonseca, Chris Foster, Pierre Gerber, Jan Dalsgaard Johannesen, Park Kyuhyun, Brian Lindsay, Sven Lundie, Daniel Massé, Anna-Karin Modin Edman, Rick Naczi, Tim Nicolaï, Sarah Paterson, Nico Peiren, Cyrus Poupoulis, Marcin Preidl, Jean-Pierre Rennaud, Maartje Sevenster, Olaf Thieme, Greg Thoma, Janusz Turowski, Neil Van Buuren, Theun Vellinga, Harald Volden, Erika Wallén, Ying Wang and Mr. Peter Erik Ywema. The IDF also wishes to particularly thank its two partner organizations the Food and Agriculture Organization of the United Nations (FAO) and the Sustainable Agricultural Initiative (SAI) Platform for their valuable contribution. A special word of thanks is due to Sophie Bertrand for her outstanding leadership in producing this essential Guide to help the global dairy sector to calculate and subsequently estimate the reduction of its carbon foot print. Christian Robert Director General November

5 1. Introduction 1.1 Background Most industries are now being challenged to quantify and reduce their carbon footprints, or emissions of greenhouse gases (GHGs) to the atmosphere; businesses in agriculture and food production are no exception. Both food processors and farming organizations within the international dairy industry have recognised the need to calculate their impact on the environment in terms of GHGs, and this has led many to proactively engage professional bodies or specialist organizations to review and calculate the carbon footprints of their products. Others have developed their own systems and some governments have even devised high level evaluation tools to support policy development. This guide has been developed at the request of the 56 IDF member countries representing 86 per cent of the world s milk, since it has become evident that the wide range of figures resulting from the differing methodologies and data is leading to inconsistencies. This poses a very real danger of confusion and contradiction, which in turn could create a false impression that the industry is failing to actively engage with the issue of climate change. This guide was developed by the IDF Standing Committee on Environment (SCENV) with active participation of the Food and Agriculture Organization of the United Nations (FAO) and the Sustainable Agriculture Initiative Platform (SAI Platform). Creating consistency and a clear message is important for the reputation of the industry as a global whole, to highlight the high level of engagement that is already taking place in relation to this issue, and to identify practices that will further reduce greenhouse gas emissions. 1.2 About this guide This guide was developed through a consultation and review process to address the issues of credibility and consistency in how the carbon footprint of milk production or a dairy product is developed. The solution was to develop clear guidance on functional unit, boundaries, change of land use, co-products and other well-debated aspects within the methodology. An IDF workshop involving leading experts was initially held in Brussels in June 2009 to capture the latest knowledge about Life Cycle Assessments (LCAs) in general and carbon footprinting in particular in the dairy sector. Following this, and to resolve the issues that emerged, small working groups were formed to debate the most robust and appropriate route forward in each case based on current scientific knowledge and report back to the wider group. This resulting guide: Identifies an approach, based on current best knowledge, to address the common LCA challenges of co-products and land use change Identifies the key areas in which there is currently ambiguity or differing views on approach Recommends a practical yet scientific approach that can also be inserted into existing or developing methodologies Adopts an approach that can be applied equally in developing and developed dairy industries across the world. It does not: Re-create knowledge: where the science is available, references have been provided to support the approach; where a suitable model is already in existence, this has been used. The importance of incorporating existing knowledge and collaborating with organizations that were already involved in improving the standardization of LCA methodology was recognised from the start. The organizations include: International Organization for Standardization (ISO), responsible for ISO 14040, 2

6 14044 and 14067, which were the original standards for producing carbon footprints for products; almost all existing methodology is in line with these protocols. British Standards Institution (BSI) in collaboration with Britain s Department for Environment, Food and Rural Affairs (Defra) and the Carbon Trust, which developed Publicly Available Specification 2050 (PAS2050), the specification for the assessment of the lifecycle greenhouse gas emissions of goods and services. The World Business Council for Sustainable Development (WBCSD) and the World Resources Institute (WRI), which are developing the Greenhouse Gas Protocol Product Life Cycle Standard and the Scope 3 (Supply Chain) Standard. Intergovernmental Panel on Climate Change (IPCC) is the leading body for the assessment of climate change, established by the United Nations Environment Programme (UNEP) and the World Meteorological Organization (WMO) Food and Agriculture Organization of the United Nations (FAO), whose methodology for calculating the greenhouse gas emissions from the dairy sector (FAO, 2009) was developed at the same time as this guide. Figure 1. The IDF common methodology embraces a comprehensive range of international knowledge and aspects of existing standards. While the dairy-specific approach adopted by the IDF means its views differ from these organizations in some areas, it has worked collaboratively with all of them in developing the methodology in this guide. 3
 and the World Resources Institute (WRI), which are developing the Greenhouse Gas Protocol Product Life Cycle Standard and the Scope 3")
7 Finally, this guide focuses on GHG emissions but there are other important issues such as water and ecosystem quality, that need to be taken into account to the enable assessment of the impact of the dairy sector globally. Any new and relevant outcomes from research into these areas can be incorporated into future versions of this guide. 1.3 Who should use this guide? This guide has been developed by the IDF for use by the dairy cattle farming and dairy manufacturing sector, for those interested in defining a carbon footprint of their production systems and products using an LCA approach. By incorporating this approach, fair comparison can then be made across different production systems, regions and products as the result of applying a standard approach. At the moment, this guide only covers milk production from cattle, although work into milk production from other species is pending. The methodology developed in the guide aims to allow: comparison of GHG emissions between dairy products, for example cheese or liquid milk identification of GHG emissions from cradle to the manufacturing gate out (not including transport from manufacturing gate and retailer or consumer impacts) identification of particular areas where there is potential for reducing emissions if they are particularly large or the reductions are easy to realise 1.4 Attributional and consequential methods The purpose of these guidelines is to provide an attributional approach to calculating the carbon footprint of both dairy farming and manufacturing. Attributional LCAs focus on describing the environmentally relevant physical flows to and from the product or process; this is in contrast to consequential assessments which describe how relevant environmental flows will change in response to, for example, changes in demand. Attributional LCAs use average data, for example for electricity or other commodities traded on markets with no specific link to the supplier. For the purposes of establishing this common methodology for footprinting for the dairy industry, this is calculated to be both sufficient and practical. 1.5 What you need before starting IPCC Task Force on National Greenhouse Gas Inventories, 2006 IPCC Guidelines for National Greenhouse Gas Inventories, Volume 4: Agriculture, Forestry and Other Land Use (available at under NGGIP Publication on the website menu bar) TWO CHAPTERS 10&11 ISO and (available from searching in PAS 2050 (available from searching in WBCSD ( 1.6 Future reviews and enhancements The IDF is committed to continually reviewing new science, incorporating relevant outcomes into existing guidelines and informing members of advances in specific topics. The area of LCAs and the environmental impact of food production systems is one area of rapidly evolving science and knowledge. Therefore, the IDF, conscious that the recommended methodology in this guide focuses purely on GHG emissions, will continue to monitor developments and will seek to incorporate any relevant outcomes, for examples in the areas of water and biodiversity. It will also continue 4

8 to liaise closely with other organizations working in a similar field with the aim of sharing information, increasing consistency in approaches and remaining at the cutting edge of developments. 1.7 Summary By developing internationally harmonized standards and guidelines for the methodology for calculating the carbon footprint of milk and dairy products, the IDF is aiming to: support the production of consistent and comparable carbon footprint figures internationally, and enable the evaluation of dairy products on a consistent basis. These in turn will: support the evolution of efficient and sustainable businesses that are continually reducing their GHG emissions, and allow the dairy industry to demonstrate a credible focus on environmental issues to retailers, customers and potential critics. 5

9 2. LCAs and carbon footprints: the basics 2.1 Definition of a product carbon footprint Greenhouse gases are all gaseous substances for which the Intergovernmental Panel on Climate Change (IPCC) has defined a global warming potential coefficient. They are expressed in massbased CO 2 equivalents (CO 2 e). The main agricultural greenhouse gases are carbon dioxide (CO 2 ), nitrous oxide (N 2 O) and methane (CH 4 ). The product carbon footprint is the sum of the greenhouse gases emitted throughout the life cycle of a product within a set of system boundaries, in a specific application and in relation to a defined amount of a specified product. A product carbon footprint is usually based on an LCA methodology. LCAs were originally used to analyse industrial process chains, but have been adapted over the past 15 years to assess the environmental impacts of agriculture, although has mainly been in arable and less in livestock farming. The LCA method analyses production systems systemically to account for all inputs and outputs for a specific product and production system across a specified system boundary. The system boundary is largely dependent on the goal of the study. The reference unit that denotes the useful output is known as the functional unit and has a defined quantity and quality, for example a litre of milk of a defined fat and protein content. The application of LCA to agricultural systems is often complex because, in addition to the main product, there are usually co-products created, such as meat, energy etc. This requires appropriate partitioning of environmental impacts to each product from the system based on an allocation rule which can be based on different criteria such as value, product properties or system expansion. Calculation of the carbon footprint of a product using LCA methodology should be based on the ISO series, specifically ISO 14040, ISO 14044, and in future ISO 14067; the recommendations of PAS 2050 should also be taken into account where advised in this document. A decision to calculate a carbon footprint of a product is a conscious decision to focus on one indicator at a time. Other environmental impacts such as water quality and biodiversity are likely to be included in the future in order to address environmental impacts of the global dairy industry in a holistic manner. 2.2 The challenges of carbon footprinting There are many challenges in calculating a carbon footprint, and calculating one for milk or a dairy product is no exception. To date, there have been several LCA studies investigating and evaluating GHG emissions from milk production 1. However, comparison between these different studies is difficult and it is hard to identify where meaningful reductions in GHG emissions can be made when it is not clear whether a benefit really exists or only appears to exist because of a different method of calculation 2. The carbon footprint for milk and dairy products is dominated by the agricultural stage, where three quarters or more of the GHG emissions occur 3. This is why it is crucial to consider the variables in primary milk production that can affect the carbon footprint outcome, and to have a common approach for allocating the environmental burden from raw milk production between products such as milk, cream, cheese and butter, irrespective of the farm, system, country or even region. 1 eg Haas et al., 2000, Hospido 2005, Williams et al., 2006, Casey & Holden 2004, Thomasen et al., 2008, Basset-Mens et al., 2008, Cederberg & Flysjö 2004, Cederberg et al., 2007, Cederberg & Mattison 2000, Flysjö et al., Basset-Mens 2008, Flysjö et al., FAO

10 2.3 Existing international standardization processes From the outset, the IDF was committed to reviewing existing standardization work and collaborating with organizations that were already involved in improving the standardization of LCA methodology. As emphasized in the introduction, where a suitable model is already in existence, this has been used ISO series, encompassing ISO 14040, and future ISO Life cycle assessments provides an important basis for framework and principles, and ISO (2006) Environmental management life cycle assessment provides requirements and guidelines. ISO took up the task of preparing a standard for carbon footprints of products (ISO/NP 14067) in The standard will consist of two parts: one for assessment and quantification, and one for communication. The aim is to finalize ISO by 2012 and the IDF is engaged with these processes where practicable PAS 2050 (2008) The British Standards Institution, in collaboration with the UK s Department for Environment, Food and Rural Affairs (DEFRA) and the Carbon Trust, has produced a Publicly Available Specification 2050 Specification for the assessment of the life cycle greenhouse gas emissions of goods and services. This British pre-standard sets out an initial comprehensive proposal for the methodology of the product carbon footprint. The final version of the PAS, published in October 2008, is largely based on the LCA standard ISO It refers to this standard on a number of points but also deviates significantly from it in some areas. PAS thus represents the first attempt to create a standardized basis for the assessment of greenhouse gas emissions arising throughout the product carbon footprint Greenhouse Gas protocol Product/Supply Chain initiative of the WBCSD The Greenhouse Gas Protocol (GHG Protocol) is the most widely used international accounting tool that allows businesses to understand, quantify, and manage GHG emissions. It is a decadelong partnership between the World Resources Institute (WRI) and the World Business Council for Sustainable Development (WBCSD), and brings together stakeholders from business, government, NGOs and academic institutes, to develop internationally accepted GHG accounting and reporting standards. The GHG Protocol provides the methodology for nearly every GHG standard and programme in the world from the International Organization for Standardization, ISO, to The Climate Registry as well as hundreds of GHG inventories prepared by individual companies. Since 2008, the WRI and the WBCSD have convened over 1,600 stakeholders from around the world to develop new accounting and reporting standards. The GHG Protocol Product Life Cycle Standard and the Scope 3 (Supply Chain) Standard are expected to be finalized in late 2010, after undergoing road testing in over 70 companies and through a series of stakeholder consultations Summary The IDF guidelines contained in this document consitute a sector specific guideline and at a more precise level than the current GHG Protocol developments. Having said that, the IDF has liaised closely with the WBCSD throughout its respective programmes and will continue to do so in the future as developments in this field unfold. 7
 in 2009.")
11 Figure 2. ISO, PAS and WBCSD/WRI protocols feed into the IDF methodology. 8

12 3. The steps in an LCA 3.1 A summary of the steps Figure 3. The steps for conducting an LCA are similar, whether based upon ISO or PAS Mapping the process This first step is about identifying the goal of the project, then the functional unit that will be the subject of the analysis, and all materials, activities and processes that contribute to the chosen product s life cycle. It is also important to make a decision about which of two possible approaches will be adopted for modelling: attributional or consequential (as mentioned in introduction, in this guide it is recommended that the attributional approach is used). Establishing all these at the outset is important in ensuring that the aim is clear, that all parts of the process are included, but also that the project does not get bigger or start to expand into areas that are irrelevant. 9

13 3.3 Setting the scope and boundaries In the second step, the scope of the analysis is defined. The scope should address the overall approach used to establish the system boundary which determines which unit processes are included in the LCA and must reflect the goal of the study. 3.4 Collecting the data This phase involves data collection and modelling of the product (eg milk, cheese) system, as well as description and verification of data. This encompasses all data related to processes within the study boundaries. The data must be related to the functional unit. The list of the minimum technical data required to calculate to the emission is proposed in Appendix C. 3.5 Calculating the carbon footprint The fourth step is calculation of the carbon footprint using all the information gathered in the previous steps. All the GHG emissions are converted into CO 2 e figures and added together to give the carbon footprint, expressed as CO 2 e. 3.6 Evaluating and reporting It is important the information is presented correctly and accurately. 10

14 4. Mapping the process 4.1 Creating a process From the outset of an LCA exercise, it is important to be clear about the goal. Knowing the goal as in what is being measured (the functional unit) and why, the intended audience, and whether the results are intended to be used in public comparisons helps identify what is needed to conduct the analysis. Figure 4. The process for milk production and dairy processing starts at the creation of farm inputs and stops at the factory gate out. This is a typical Business-to-Business or cradle to gate model, as described in ISO If just part of the process is being studied, for example only milk production to the farm gate, then this process would be shortened accordingly. 4.2 Defining the process PAS 2050 explains that to build a process map, the following stages should take place: Define where the process being studied starts and finishes Define the functional unit List all the activities involved in the process Reflect on what might have been missed Identify any co-products or by-products List all inputs and their inputs from their origins (eg fertiliser used to grow feed for cow nutrition). This provides a framework which then feeds the next stage setting goals, scope and boundaries. 4 Environmental management Life cycle assessment Principles and framework. 11

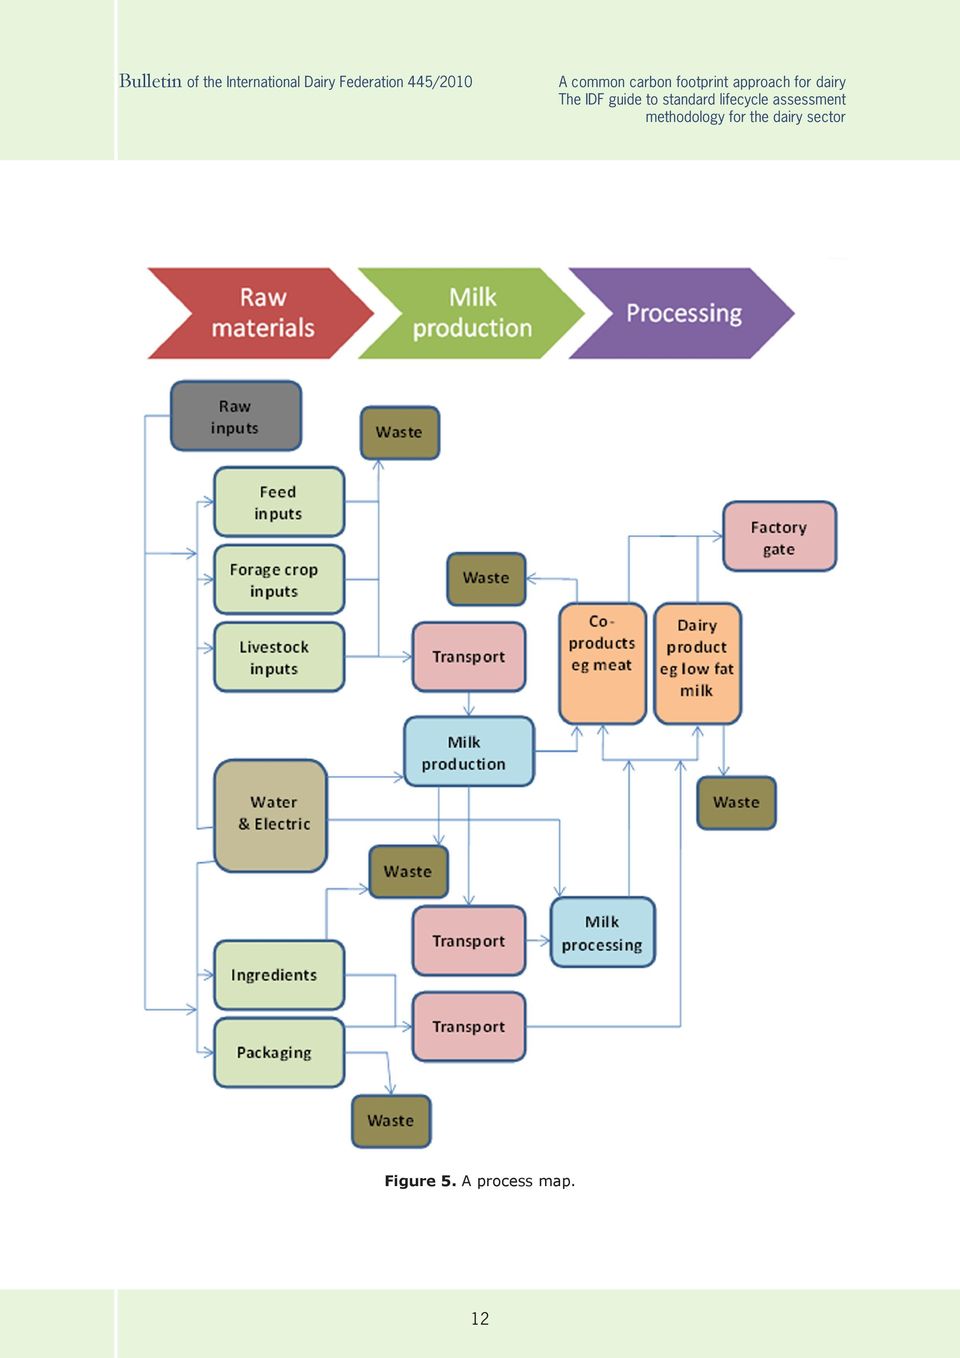
15 Figure 5. A process map. 12
16 4.3 The Functional Unit Farming If a study is conducted on-farm, the functional unit is one kilogram of fat and protein corrected milk (FPCM) at the farm gate in the country in which the analysis is taking place. Using FPCM as the basis for farm comparisons assures a fair comparison between farms with different breeds or feed regimes. FPCM is calculated by multiplying milk production by the ratio of the energy content of a specific farm s (or region s) milk, to the energy content of standard milk with 4 per cent fat and 3.3 per cent true protein content. FPCM (kg/yr) = Production (kg/yr) [ Fat% True Protein% ] Figure 6. Formula for calculating the Functional Unit for farming. If a different milk composition is needed for the standard milk, the energy equation (Appendix A) can be used to calculate the new standard milk energy and then used to recalculate the coefficients for the FPCM equation Processing At the processing gate, the recommended functional unit is one kilogram of product, with x per cent fat and y per cent protein, packaged at dairy factory gate ready to be distributed in the country in which the analysis is taking place. 13
 = Production (kg/yr) [0.1226 Fat% +0.0776 True Protein% + 0.2534] Figure 6. Formula for calculating the Functional Unit for farming.")
17 5. Setting the Scope and Boundaries 5.1 Farming The system boundaries are from feed production (and its inputs) to farm-gate and include, but are not limited to: Production of milk on-farm (methane from productive and replacement animals/enteric fermentation) including: - on-farm feed production (diesel, and direct and indirect emissions of nitrous oxide from soil) - farm dairy effluent management (methane and direct and indirect emissions of nitrous oxide) - cow management (diesel, petrol) - milk extraction (electricity, refrigerants) - water supply (electricity) Production and supply of supplementary feed Production of synthetic fertiliser and its delivery Production and delivery of any other crop and pasture inputs, eg pesticides Any activities which take place on other farms eg feed production for the dairy cow replacements and any cows grazed away over the winter Releases resulting from processes, including chemical and ingredients production on farm Refrigerant manufacturing and losses and other emissions sources on-farm Usage of energy that has greenhouse gas emissions associated with it Consumption of energy carriers that were themselves created using processes that have GHG emissions associated with them (eg electricity) Wastes that produce greenhouse gas emissions. This accounts for at least 95 per cent of the likely life cycle emissions from feed production to farm-gate thereby meeting one of the key requirements of the PAS2050 standard. A threshold of one per cent has been established to ensure that very minor sources of life cycle GHG emissions do not require the same treatment as more significant sources (PAS2050). So it is accepted that, for practicality, if any material or energy flow contributes less than one per cent of the total emissions, then these can be excluded provided the threshold of accounting for 95 per cent of emissions is met Processing The system boundary encompasses relevant processes within the system and includes, but is not limited to: The transport of the raw milk to the processing sites from the farm gate and inter-factory product transport Production, delivery and consumption of operating materials, eg chemicals, packaging materials and ingredients Freshwater usage on-site and wastewater treatment 5 Frischknecht et al.,
 - cow management (diesel, petrol) - milk extraction (electricity, refrigerants) - water supply (electricity) Production and supply of supplementary feed")
18 Releases resulting from processes, including chemical and ingredients production, refrigerant manufacturing and losses and other emissions sources Usage of energy that has greenhouse gas emissions associated with it Consumption of energy carriers that were themselves created using processes that have GHG emissions associated with them (eg electricity) Wastes that produce greenhouse gas emissions. It is possible to apply and refer to these guidelines also when calculating the carbon footprint of different parts within the system boundaries defined above. For example, when a dairy is planned to be enlarged or re-built, carbon footprint calculations can be performed on part of the processing system. Because the LCA may be undertaken in a series of phases each part of the dairy manufacturing system (farm and processing) is considered separately. The post-manufacturing transportation of milk and milk products also contributes to GHG emissions, but this guide does not include this as it is not specific to the milk production and milk processing. Figure 7. A summary of the flow of resources and input in dairy farming and processing. 5.3 Emissions to be included Main sources of emissions that should be included are: fossil carbon dioxide (energy use, eg combustion of diesel and electricity production) biogenic carbon dioxide from direct land use change (carbon released from deforestation and conversion of pasture and shrub lands to agricultural land, emissions both from above and below biomass, as well as carbon from soil) biogenic carbon stored in packaging material (carbon stored in biogenic material should be accounted for to be able to make a more fair comparison to material originated from fossil materials, eg plastic produced from fossil oil); biogenic carbon retained in packaging (paper, card etc) may be retained for a while if recycled, or if incinerated with energy recovery then the feedstock is essentially carbon neutral; carbon from fossil sources can be retained (eg in plastics which breakdown slowly or are recycled), otherwise it is generally a direct emission 15

19 fossil methane emissions (leakage from eg natural gas) biogenic methane emissions (enteric fermentation and manure management, storage and spreading/on field) nitrous oxide emissions (N 2 O emissions from production of N-fertiliser, direct N 2 O emissions from field and manure management/storing, indirect N 2 O emissions from field (NO 3 => N 2 O and NH 3 => N 2 O) and manure management/storing (NH 3 => N 2 O)) Emissions that should not be included are those that are accounted for in the short (biogenic) carbon cycle. Figure 8. Carbon cycle. Carbon absorbed by animals and crops is carbon neutral as it is re-released quickly (unless, for example, straw is used to build a house) as it is breathed out, burnt, excreted or decomposed. Biogenic carbon retained in packaging (paper, card etc) may be retained for a while if recycled. If incinerated with energy recovery then it is essentially carbon neutral. Carbon transformed into methane becomes a GHG; carbon from fossil sources can be retained (eg in plastics which breakdown slowly or are recycled), otherwise it is generally a direct emission. In the future, there is the potential for credits once it becomes possible to measure/verify carbon absorbed by plants/soil; in the meantime, carbon may be retained/sequestered or re-released rapidly (eg by burning, ploughing etc), so it remains carbon neutral. 16
 as it is breathed out, burnt, excreted or decomposed.")
20 6. Collecting data 6.1 Data quality One of the crucial issues in LCA calculations is transparency and reporting of the data used in the study. Ideally, the study should be reported in such a way that it allows for an independent practitioner to reproduce the results. It should clearly be stated if primary (collected) data (which are preferred) or secondary (database, article, report) data are used, and from where the data are taken (eg the reference, from which company, the site the data are collected from or from which database, article, report they are taken). The time-related 6, geographical 7 and technological 8 coverage should be stated as well as how representative 9 these are for the study. The completeness of the study should also be clearly stated; for example, if some major items are omitted, such as capital goods, this should be made clear. Additionally, the methodology and level of detail throughout the study should be consistent. Finally, the variation 10 and uncertainty 11 of data should be estimated, which could be done quantitatively through a sensitivity analysis or qualitatively through a discussion. The IDF recommends that data sourcing and utilisation are aligned with ISO 14044, which should be referred to for further detail. 6.2 Emission Factors Emission factors provide an indication of amount of GHGs emitted from a particular source or activity. There are various methods and sources for determining emissions, which are tiered according to their accuracy and detail. The simplest approach is described as Tier 1 and more detailed approaches where country specific information is available are described as Tier 2. Individual data constitute Tier 3. For example the 2006 IPCC Guidelines for National Greenhouse Gas Inventories have described all three tiers to estimate methane emission from enteric fermentation. On a Tier 1 basis, the emissions are calculated using standard emission factors from literature. The Tier 2 level calculation requires detailed country-specific data on gross energy intake and methane conversion factors for specific livestock categories. Tier 3 requires even more accurate and scientifically accepted data from direct experimental measurements concerning, for example, diet composition in detail, concentration of products arising from ruminant fermentation, seasonal variation in animal population or feed quality and availability and possible mitigation strategies. It is agreed for the purposes of achieving consistency in dairy LCAs, a Tier 2 minimum approach is necessary. Details of the Tier 1, Tier 2 and Tier 3 methodologies are given in: 2006 IPCC Guidelines for National Greenhouse Gas Inventories, Volume 4, Agriculture, Forestry and Other Land Use 6 Average data for a longer period or data from a specific year (for agricultural products it is important to have at least one year s average data, so seasonal variations during the year are accounted for) and are representative of this period for the study). 7 Are the data representative only locally, for a country or for eg European conditions? 8 Eg, are data used representative for a modern dairy or older dairy, a large scale or small scale dairy etc? 9 The data used should obviously be relevant for the study, ie CARBON FOOTPRINT data for milk produced in US cannot be seen as representative for African conditions, since the production system is totally different 10 Emissions of, eg, N 2 O are known to have large variations, both in time and space (between places), therefore it is important to conduct a sensitivity analysis analyse the uncertainties (possible variations) in the calculations. 11 The precision of data can often vary, eg feed intake can be difficult to estimate, and therefore this precision is important with sensitivity analysis of critical parameters, especially those for which it is difficult to get a precise estimate. 17
.")
21 Revised 1996 IPCC Guidelines for National Greenhouse Gas Inventories Software for Greenhouse Gas Inventories is available at: A Search of the IPCC Database of emission factors is available at: This guide makes recommendations for technical data requirements in Appendix C. For electricity, the recommendation is to use average electricity, including grid losses, in the country where the LCA is being conducted. 6.3 Allocation Co-products Handling of co-products is, in many cases, critical for the outcome of the LCA or carbon footprinting exercise. There are various ways to handle co-products, with some methods more pragmatic and others more scientific, but no single common or established method. The allocation procedure described by ISO follows. Step 1: Wherever possible, allocation should be avoided by a) dividing the unit process to be allocated into two or more sub-processes and collecting the input and output data related to these sub-processes, or b) expanding the product system (known as system expansion) to include the additional functions related to the co-products. Step 2: Where allocation cannot be avoided, the inputs and outputs of the system should be partitioned between its different products or functions in a way that reflects the underlying physical relationships between them, ie, they should reflect the way in which the inputs and outputs are changed by quantitative changes in the products or functions delivered by the system. Step 3: Where physical relationship alone cannot be established or used as the basis for allocation, the inputs should be allocated between the products and functions in a way that reflects other relationships between them. For example, input and output data might be allocated between co-products in proportion to the economic value of the products. Looking at the whole life cycle of milk and dairy products from farm to manufacturing gate out, there are several processes that involve multiple co-products: Production of feed (eg soy meal or soy oil) Production of milk and meat on farm (where meat and calves are a by-product, and sometimes also manure when it is exported from the farm) Manufacture of dairy products at the processing site Energy generation (for example biogas production at the farm or electricity produced at the dairy manufacturing site, where surplus electricity can be exported to the national grid Production of feed Many feed ingredients are co-products from a production system generating more than one product, and therefore the environmental burden should be distributed between the co-products. Some of the more commonly used feed ingredients for dairy cows where allocation situations occur are: soy meal (co-product to soy oil and soy hull, produced from soy beans) 18
22 rape-seed meal (co-product to rape seed oil, produced from rape-seed) palm kernel expels (co-product to palm kernel oil, produced from palm kernels, which is a co-product to palm oil, produced from oil palm) maize gluten meal (co-product to maize gluten feed, maize germ meal and maize starch, produced from maize) wheat bran (co-product to wheat flour, produced from grain), and dry distillers grains with solubles (DDGS), co-product to corn ethanol, produced from corn grain. The guidance here is to use economic allocation for co-product in feed production. This is identified as the most feasible allocation method to use at this stage because: subdivision of the system is not typically possible for feed products it can be difficult to identify the product/s that has/have been substituted by the by-products to apply the system expansion method, and it can be time-consuming it is difficult to find a physical relationship that reflects the relation between inputs and outputs, for example soy meal is typically used for its protein content, while soy oil is used for its energy content, hence applying allocation based on protein content or energy bases is not a allocation factor that is relevant for both products. Consequently, economic allocation is the recommended method in this situation. As many feed ingredients are produced regionally or locally, five year averages on prices are advised to minimize fluctuations between years. Example If meal and oil are co-products, and meal is part used for feed as part of the LCA, the economic allocation factor is calculated using the equation below. The output from the process is X kg meal (with the price of A Euro per kg meal) and Y kg oil (with the price of B Euro per kg oil). Figure 9. Example of allocation of co-products for feed. Therefore: Allocation factor (meal): (X A) / (X A + Y B) The allocation factor is then multiplied with the environmental impact from the process (eg emissions associated with cultivation and transporting of the raw material, energy used for processing) and then divided with X kg meal to get the carbon footprint for one kilogram of meal. 19
23 6.3.3 Production of milk and meat For the dairy farm system where the main focus is on production of milk, the meat generated from surplus calves and cull dairy cows is an important co-product. It is therefore necessary to determine total emissions and to allocate them between milk and meat. In some cases, manure can also be exported off-farm and in, these cases, this too, should be accounted for. The most appropriate approach here is to use a physical allocation method. This aligns with Step 2 in ISO and reflects the underlying use of feed energy by the dairy animals and the physiological feed requirements of the animal to produce milk and meat. The feed consumption by animals is also the main determinant of enteric methane emissions and of nitrous oxide and methane emissions from animal excreta which together can make up about 80 per cent of total on-farm GHG emissions. The allocation factor for milk and meat can be calculated using following equation (further explanation of details and background in Appendix B): AF= x R Figure 10. Formula for the allocation of milk and meat. Where AF = allocation factor for milk, R = M meat /M milk, M meat = sum of live weight of all animals sold including bull calves and culled mature animals and M milk = sum of milk sold corrected to 4 per cent fat and 3.3 per cent protein using equation in With this equation the determination of allocation factor is simple and involves the following steps: step 1a: collect/determine the total kg animal meat sold per year [kg meat ] step 1b: collect/determine the total kg milk 4% fat 3.3% protein equivalent produced per year step 1c: calculate the ratio R = kg meat /kg milk [-] step 2: Use the simple correlation: AF (allocation factor) to milk: AF = R step 3: Allocation factor to beef = 1 AF (allocation factor) to milk As a default value for R, we can fix a typical ratio of eg kg meat /kg milk, yielding a default allocation of 14.4 per cent to meat and a default allocation of 85.6 per cent to milk. Example This demonstrates the calculation, based on a physical method, of the allocation between milk and beef for a hypothetical farm that produces 1 million kg (1000 Mg) FPCM per year and exports kg beef/kg FPCM. For purposes of this example, the beef export is calculated as the sum of live weight of all animals exported, including bull calves and culled mature animals, but excluding animals culled but not sent to the beef market. Figure 11. Example of allocation of meat as a co-product. 20
24 For this example the US national average of 1.4 kg CO 2 e/kg FPCM unallocated GHG emissions will be assumed for different regions, the local value should be substituted. Based on the empirical equation for physical allocation (see Appendix B), the allocation to milk is: x(0.024) = Thus 0.86x1400 = 1204 Mg CO 2 e is allocated to 1000 Mg milk, yielding a farm-gate footprint of kg CO 2 e/kg FPCM and ( ) Mg CO 2 e / 24 Mg beef or 8.17 kg CO 2 e/kg beef (live weight). For a detailed explanation of this approach, refer to Appendix B. For export of manure from the farm the recommendation is to apply system expansion 12. This is in accordance with ISO When applying manure on farm land, chemical fertiliser requirements are reduced, hence less chemical fertiliser needs to be produced for systems using manure. It is important that data used for these purposes are highly accurate, be they primary or secondary, pertaining to local conditions. Also refer to section 6.1 Data quality Manufacture of dairy products Dairy manufacturing plants usually produce more than one product as the fat content in raw milk almost always exceeds the product specification for milk powders or fresh milk products (eg market milk, yoghurt or dairy desserts). The excess milk fat is normally further processed into butter or anhydrous milk fat (AMF). However, resource use or emissions data are typically only available on a whole of factory basis. Data collection for each unit process within the plant is resource intensive and there is typically insufficient metering to collect the required information. In addition, many of the unit processes are shared for different products (eg pasteurization, separation or spray drying). Such aggregation of data poses problems when undertaking an LCA or carbon footprinting exercise for a selected product within a multi-product setting. To compare the life cycle of one dairy product to another therefore requires identification of the material consumption and process energy (electricity and fuel) demand in addition to emissions from a plant for each product. The recommendation is to allocate raw milk intake and transportation on the basis of the milk solids of the final product. For all other operational materials, energy inputs (electricity and thermal energy) and emissions, more sophisticated allocation factors should be applied. Three possible scenarios have been identified: a) detailed process and co-product data are available: energy and material usage as well as emissions can be directly assigned to the specific products b) a mixture of detailed process and co-product data as well as whole of factory data are available: in this case assign detailed process and co-product data to specific products first, subtract assigned detailed process and co-product data from the factory total and then allocate the remainder based on milk solids. c) only whole of factory data are on hand: apply allocation coefficients as described in Table 1 13, which is an industry-specific physico-chemical allocation matrix to enable better allocation of resources to dairy products using whole of plant information (Feitz et al 2007) (see end of Appendix B.) 12 Cederberg & Stadig, This matrix (see Table 1) is a starting point that will be further developed in the future. 21
25 Table 1: Industry specific physico-chemical allocation factors relative to milk powder* (Feitz et al 2007) Raw milk Raw milk trasport Fuel for Total water use Electricity termal energy Alkaline cleaners Acid cleaners Total wastewater Milk powder Yoghurt Milk Cream Butter AMF/Ghee Cheese (cheddar) Whey powder UHT Ice cream WPC/lactose** * Coeficients based on factory average resource use and wastewater emissions for different dairy products from 17 multi-product dairy manufacturing sites. ** There was insufficient information to separate energy and mass flows for whey protein concentrate (WPC) and lactose. Some plants crystallize and dry lactose whereas others treated the lactose as a waste product. For allocation inputs and outputs at the manufacturing site (ie when two of more are produced from raw milk) physico-chemical allocation should be used. If only whole of plant data are available, the physico-chemical allocation matrix is applied by using the equation below. Figure 12. Formula for allocation of co-products during manufacturing. with AFi = allocation factor The allocation of one product (eg whole milk powder) is then multiplied with its specific resource use or environmental impact allocation factor and then divided the sum product of each product quantity and their respective allocation factor. 22
Environmental / Ecological Impact of the Dairy Sector:
 Bulletin of the International Dairy Federation 436/ 003 2005 2009 Environmental / Ecological Impact of the Dairy Sector: Literature review on dairy products for an inventory of key issues List of environmental
- focus on green house gas emission
 Life cycle assessment of milk at farm gate - focus on green house gas emission Troels Kristensen Institute of Agroecology Århus University, Denmark EAAP 2011 Stavanger Norway Session 7 Structure of the
GREENHOUSE GAS FOOTPRINTING USING OVERSEER THE WHOLE PICTURE
 GREENHOUSE GAS FOOTPRINTING USING OVERSEER THE WHOLE PICTURE David Wheeler, S Ledgard and M Boyes AgResearch, Hamilton Abstract The inputs into OVERSEER Nutrient Budgets (Overseer) allow farm-specific
The Greenhouse Gas Protocol
 The Greenhouse Gas Protocol Introduction to the Greenhouse Gas Protocol Corporate Accounting and Reporting Standard The Greenhouse Gas (GHG) Protocol Corporate Accounting and Reporting Standard provides
Farming at dairy farms (produktion på mælkelandbrug)
") Farming at dairy (produktion på mælkelandbrug) Process description The present data refer to production on eight typical Danish Dairy in 2000, which combines dairy and (cash) crop production in a mixed
Farming at dairy (produktion på mælkelandbrug) Process description The present data refer to production on eight typical Danish Dairy in 2000, which combines dairy and (cash) crop production in a mixed
Harvesting energy with fertilizers
 Harvesting energy with fertilizers Sustainable agriculture in Europe 1 Harvesting energy with fertilizers The reason for agriculture s existence is to supply energy to mankind. Agriculture converts solar
A comparison of greenhouse gas emissions from the New Zealand dairy sector calculated using either a national or a regional approach.
 A comparison of greenhouse gas emissions from the New Zealand dairy sector calculated using either a national or a regional approach December 2008 A comparison of greenhouse gas emissions from the New
It is a well-known fact that the dairy industry actively
 The Economic Importance of Dairying Dairy is a universal agricultural production: people milk dairy animals in almost every country across the world, and up to one billion people live on dairy farms. 1
THE PREPARATION. SUPPLY/UTILIZATION ACCOUNTS (SUAs)
") THE PREPARATION OF SUPPLY/UTILIZATION ACCOUNTS (SUAs) I. INTRODUCTION The statistical framework of SUAs has been developed with the aim of providing a useful statistical tool for the preparation, conduct
THE PREPARATION OF SUPPLY/UTILIZATION ACCOUNTS (SUAs) I. INTRODUCTION The statistical framework of SUAs has been developed with the aim of providing a useful statistical tool for the preparation, conduct
Calculating Greenhouse Gas Emissions
 GIIRS Emerging Market Assessment Resource Guide: What s in this Guide? I. Definition: What Are Greenhouse Gas (GHG) Emissions? II. Why Calculate GHGs? III. How to Calculate Company-wide GHGs IV. Outsourcing
MATCHING BOTTOM-UP AND TOP-
 MATCHING BOTTOM-UP AND TOP- DOWN FOR VERIFICATION AND INTEGRATION OF LCI DATABASES BY BO P. WEIDEMA, 2.-0 LCA CONSULTANTS, WWW.LCA-NET.COM International Workshop on LCI-Quality, Karlsruhe, 2003.10.20-21.
The Contribution of Global Agriculture to Greenhouse Gas Emissions
 The Contribution of Global Agriculture to Greenhouse Gas Emissions Dr. Tommy Boland, School of Agriculture and Food Science, University College Dublin, Belfield, Dublin 4 tommy.boland@ucd.ie Acknowledge
Reducing methane emissions through improved lamb production
 Reducing methane emissions through improved lamb production www.hccmpw.org.uk Hybu Cig Cymru / Meat Promotion Wales Tŷ Rheidol, Parc Merlin, Aberystwyth SY23 3FF Tel: 01970 625050 Fax: 01970 615148 Email:
Summary of the Final report: Farming Carbon Footprint of the Australian Dairy Industry
 Summary of the Final report: Farming Carbon Footprint of the Australian Dairy Industry Summary of the Final report: Farming Carbon Footprint of the Australian Dairy Industry Dairy Australia has produced
Making Sense of Climate Change - for businesses and consumers: measuring greenhouse gas emissions ( carbon footprint )
") 1 Making Sense of Climate Change - for businesses and consumers: measuring greenhouse gas emissions ( carbon footprint ) Anne Ferguson, BSI British Standards Contents 2 Some necessary definitions What
1 Making Sense of Climate Change - for businesses and consumers: measuring greenhouse gas emissions ( carbon footprint ) Anne Ferguson, BSI British Standards Contents 2 Some necessary definitions What
Bottom-up: Responding to climate change through livestock in integrated agriculture
 Bottom-up: Responding to climate change through livestock in integrated agriculture Katrien van t Hooft, ETC Adviesgroep, Netherlands Personal introduction Veterinary medicine in Utrecht, NL MSc Management
Emerging BioFuel Crops and Technology Kurt Thelen Michigan State University, East Lansing, Michigan ABSTRACT
 Emerging BioFuel Crops and Technology Kurt Thelen Michigan State University, East Lansing, Michigan ABSTRACT United States energy policy requires 36 billion gallons of ethanol by the year 2022, with 21
ClimatE leaders GrEENHOUsE Gas inventory PrOtOCOl COrE module GUidaNCE
 United States Environmental Protection Agency may 2008 EPa430-r-08-006 www.epa.gov/climateleaders Office of air and radiation ClimatE leaders GrEENHOUsE Gas inventory PrOtOCOl COrE module GUidaNCE Optional
A clean energy solution from cradle to grave
 Environmental Product Declaration A clean energy solution from cradle to grave Offshore wind power plant employing SWT-6.0-154 siemens.com / wind 2 Assessing the performance of a wind power plant The environmental
Greenhouse Gas Emissions from the Dairy Sector. A Life Cycle Assessment
 Greenhouse Gas Emissions from the Dairy Sector A Life Cycle Assessment Greenhouse Gas Emissions from the Dairy Sector A Life Cycle Assessment A report prepared by: FOOD AND AGRICULTURE ORGANIZATION OF
2012 Guidelines to Defra / DECC's GHG Conversion Factors for Company Reporting
 2012 Guidelines to Defra / DECC's Conversion Factors for Company Reporting Produced by AEA for the Department of Energy and Climate Change (DECC) and the Department for Environment, Food and Rural Affairs
Carbon footprinting on farms
 Carbon footprinting on farms Information sheet Soil Association Producer Support South Plaza, Marlborough Street, Bristol, BS1 3NX T 0117 914 2400 F 0117 314 5001 E producer.support@soilassociation.org
Scope 1 describes direct greenhouse gas emissions from sources that are owned by or under the direct control of the reporting entity;
 9 Greenhouse Gas Assessment 9.1 Introduction This chapter presents an assessment of the potential greenhouse gas emissions associated with the Simandou Railway and evaluates the significance of these in
Supplementary information on the Irish Dairy sector in support of
 Research and Information Service Paper 30/15 26 th January 2015 NIAR 21-15 Mark Allen Supplementary information on the Irish Dairy sector in support of 1 Background 29/15 NIAR 912-14 This briefing note
U.S. Dairy Life Cycle Assessment
 U.S. Dairy Life Cycle Assessment From Grass to Glass Dr. Ying Wang National Academy of Sciences November 17, 2011 The U.S. dairy LCA U.S. dairy from grass to glass Life Cycle Assessment What are the guiding
Draft Scope 2 Accounting Guidance: What it could mean for corporate decisions to purchase environmental instruments
 Draft Scope 2 Accounting Guidance: What it could mean for corporate decisions to purchase environmental instruments September 2014 Corporate Scope 2 accounting has traditionally been relatively straight
Renewable energy in transport
 Renewable energy in transport Source: http://worldwideed.staradvertiserblogs.com/2009/11/23/fun-day-monday-free-transport-from-naia-airport World transport energy use is growing rapidly Source: IEA Energy
Guidelines to Account for and Report on. or Institutional Purposes) in Hong Kong. 2010 Edition
 in Hong Kong. 2010 Edition") Guidelines to Account for and Report on Guidelines Greenhouse togas Account Emissions for and Report Removals on Greenhouse for Buildings Gas (Commercial, Emissions and Residential Removals for orinstitutional
Guidelines to Account for and Report on Guidelines Greenhouse togas Account Emissions for and Report Removals on Greenhouse for Buildings Gas (Commercial, Emissions and Residential Removals for orinstitutional
CleanMetrics TM. FoodCarbonScope. Product Technical Brief. CleanMetrics Corp. October 2011. Copyright 2011 by CleanMetrics Corp. All rights reserved.
 FoodCarbonScope Product Technical Brief CleanMetrics Corp. October 2011 Copyright 2011 by CleanMetrics Corp. All rights reserved. Contents What is FoodCarbonScope?... 3 Who is it for?... 3 Applications...
Using a Life Cycle Assessment Approach to Estimate the Net Greenhouse Gas Emissions of Bioenergy
 This strategic report was prepared by Mr Neil Bird, Joanneum Research, Austria; Professor Annette Cowie, The National Centre for Rural Greenhouse Gas Research, Australia; Dr Francesco Cherubini, Norwegian
5.5 QUALITY ASSURANCE AND QUALITY CONTROL
 0 0 0. QUALITY ASSURANCE AND QUALITY CONTROL.. Introduction The IPCC Good Practice Guidance and Uncertainty Management (GPG000, IPCC, 000), Chapter, Quality Assurance and Quality Control, defines quality
Fact sheet. Conversion factors. Energy and carbon conversions 2011 update
 Fact sheet Conversion factors Energy and carbon conversions 2011 update 1 Introduction This leaflet provides a number of useful conversion factors to help you calculate energy consumption in common units
Carbon Sequestration Tool Background and User Guide
 Carbon Sequestration Tool Background and User Guide Table of Contents Quick Start Methodology Content of Worksheets Frequently Asked Questions Quick Start 1. Determine which of the two carbon tools you
DSM Position on Sustainable Biomass
 Corporate Public Affairs Het Overloon 1, 6411 TE Heerlen, the Netherlands www.dsm.com April 2012 DSM Position on Sustainable Biomass Key messages DSM is a leading Life Sciences and Materials Sciences company
Category 5: Waste Generated in Operations
 5 Category 5: Waste Generated in Operations Category description C ategory 5 includes emissions from third-party disposal and treatment of waste generated in the reporting company s owned or controlled
Using LCA models to inform about industry-led efforts to reduce the ecological footprint of farmed salmon from feed and other inputs "
 Using LCA models to inform about industry-led efforts to reduce the ecological footprint of farmed salmon from feed and other inputs " Authors Jason Mann (EWOS Canada, presentation) Louise Buttle (EWOS
Green Power Accounting Workshop: Concept Note For discussion during Green Power Accounting Workshop in Mexico City, May 13th 2011
 Introduction As more companies and government organizations prepare greenhouse gas (GHG) inventories that reflect the emissions directly and indirectly associated with their operations, they increasingly
BES 6001 Issue 3 Guidance Document
 BES 6001 Issue 3 Guidance Document This guide is intended to give an understanding of BES6001:2014 Framework Standard for Responsible Sourcing. It is not a controlled document. 3.2.1 Responsible Sourcing
Liquid Biofuels for Transport
 page 1/11 Scientific Facts on Liquid Biofuels for Transport Prospects, risks and opportunities Source document: FAO (2008) Summary & Details: GreenFacts Context - Serious questions are being raised about
FARMING FOR THE FUTURE How mineral fertilizers can feed the world and maintain its resources in an Integrated Farming System
 How mineral fertilizers can feed the world and maintain its resources in an Integrated Farming System european fertilizer manufacturers association Global trends in population growth (Population 1000 million),
Guide to PAS 2050 How to assess the carbon footprint of goods and services
 Guide to PAS 2050 How to assess the carbon footprint of goods and services Guide to PAS 2050 How to assess the carbon footprint of goods and services Acknowledgements Acknowledgement is given to the following
Draft Large-scale Consolidated Methodology ACM00XX: Construction of a new natural gas power plant
 CLEAN DEVELOPMENT MECHANISM CDM-MP66-A01 Draft Large-scale Consolidated Methodology ACM00XX: Construction of a new natural gas power plant COVER NOTE 1. Procedural background 1. The Executive Board of
Greenhouse Gas Reporting Criteria
 Greenhouse Gas Reporting Criteria Version 2.0 Approved by AMP Environment Leadership Team October 2014 AMP Greenhouse Gas Reporting Criteria 2014 v2.0 (final) - 1-2/04/2015 Document Change Control The
www.defra.gov.uk Guidance on how to measure and report your greenhouse gas emissions
 www.defra.gov.uk Guidance on how to measure and report your greenhouse gas emissions September 2009 Department for Environment, Food and Rural Affairs Nobel House 17 Smith Square London SW1P 3JR Telephone:
Towards climate-smart agriculture
 Towards climate-smart agriculture Background notes for the informal meeting of the Ministers of Agriculture Luxembourg, 15 September 2015 Table of contents Agricultural impact on climate change Climate
LIFE CYCLE ASSESSMENT ON COTTON AND VISCOSE FIBRES FOR TEXTILE PRODUCTION
 LIFE CYCLE ASSESSMENT ON COTTON AND VISCOSE FIBRES FOR TEXTILE PRODUCTION Janka Dibdiakova, Volkmar Timmermann Norwegian Forest and Landscape Institute (NFLI) Ås, Norway COST FP1205 Innovative applications
CGD REPORTS. www.cgd.pt. https://www.cgd.pt/english/institutional/
 CGD REPORTS > Sustainability 2010 > CAIXA S SUSTAINABLE COMMITMENT 173 CGD REPORTS 2010 CARBON NEUTRALIty CAIXA CARBONO ZERO PROGRAMME www.cgd.pt 174 CGD REPORTS > Sustainability 2010 > CAIXA S SUSTAINABLE
New options for material flow accounting in the ecoinvent database
 New options for material flow accounting in the ecoinvent database Bo Weidema The ecoinvent Centre, CH-9014 St. Gallen, Switzerland weideme@ecoinvent.org Abstract Embedding the ecoinvent process database
- - - - - - - - - - - - - - - - - - - - - - - - - - - - - - - - - - - - - - - - - - - - - - - - - - - - - - - - - - - - - - - - - - -
 Levi Strauss & Co. Life Cycle Approach to Examine the Environmental Performance of its Products Levi Strauss & Co. (LS&Co.) is focused on building sustainability into everything we do. In 2007 LS&Co. commissioned
Communicating Your Commitment: Your Guide to Clean Energy Messaging
 Communicating Your Commitment: Your Guide to Clean Energy Messaging Congratulations on your recent purchase of clean energy from Renewable Choice! Whether you ve purchased green power in the form of renewable
Papapostolou 1, E. Kondili 1, J.K. Kaldellis 2
 Technological and Environmental Impacts Evaluation of Biomass and Biofuels Supply Chain Papapostolou 1, E. Kondili 1, J.K. Kaldellis 2 1 Optimisation of Production Systems Lab 2 Soft Energy Applications
CLEAN DEVELOPMENT MECHANISM CDM-MP62-A01
 CLEAN DEVELOPMENT MECHANISM CDM-MP62-A01 Draft Large-Scale Consolidated Methodology ACM00XX: Natural gas substitution by biogenic methane produced from the anaerobic digestion of organic waste COVER NOTE
The European Renewable Energy Directive and international Trade. Laurent Javaudin Delegation of the European Commission to the U.S.
 The European Renewable Energy Directive and international Trade Laurent Javaudin Delegation of the European Commission to the U.S. The European Union 27 Member States 490 million people 2 Outline The Present:
Carbon Disclosure Project CDP 2009 Small & Medium-sized Enterprises Information Request
 Carbon Disclosure Project 2009 Information Request April 2009 Carbon Disclosure Project CDP 2009 Small & Medium-sized Enterprises Information Request Please try to answer as many questions as possible.
GHG Protocol Product and Supply Chain Initiative. Proposed List of Technical Topics
 Page 1 World Business Council for Sustainable Development GHG Protocol Product and Supply Chain Initiative Proposed List of Technical Topics Seven technical working groups have been established to develop
Woodfibre Liquefied Natural Gas (LNG) Project. Review of Related Upstream Greenhouse Gas (GHG) Emissions Estimates
 Project. Review of Related Upstream Greenhouse Gas (GHG) Emissions Estimates") 1 February 2016 Woodfibre Liquefied Natural Gas (LNG) Project Review of Related Upstream Greenhouse Gas (GHG) Emissions Estimates Summary The Canadian Environmental Assessment Agency (the Agency) sought
1 February 2016 Woodfibre Liquefied Natural Gas (LNG) Project Review of Related Upstream Greenhouse Gas (GHG) Emissions Estimates Summary The Canadian Environmental Assessment Agency (the Agency) sought
Alternative fuels. The way forward
 Alternative fuels The way forward Contents Foreword Alternative fuels - an overview Different alternatives - with different prerequisites The five most promising fuels Energy efficiency Land use efficiency
A Guide to Woodland Carbon for Business
 A Guide to Woodland Carbon for Business Contents: 1. Investing in Woodland Carbon: an overview 2. Why Woodland Carbon? 3. How much does it cost? 4. Woodland Carbon Code 5. Woodland Carbon compliance 6.
This fact sheet provides an overview of options for managing solid
 What Is Integrated Solid Waste Management? This fact sheet provides an overview of options for managing solid waste, identifies the important issues you should consider when planning for solid waste management,
READING GUIDE FOR THE REPOSITORY ON SHOES BP X30-323-1. Contents. Introduction 2
 READING GUIDE FOR THE REPOSITORY ON SHOES BP X30-323-1 Contents Introduction 2 Background 2 Environmental labelling principles 2 Objective of the reading guide 2 Presentation of the product covered by
Reporting criteria for selected key performance indicators in the 2014 Responsible Business Report
 Reporting criteria for selected key performance indicators in the 2014 Responsible Business Report Introduction This Reporting Criteria document details the approach and scope applied to key environmental
Residential & Commercial Sectors Overview CLIMATE
 CLIMATE TECHBOOK Residential and Commercial Emissions in the United States Greenhouse gas (GHG) emissions data can be reported either by economic sector, which includes electric power generation as a separate
International Standard for Determining Greenhouse Gas Emissions for Cities
 International Standard for Determining Greenhouse Gas Emissions for Cities The Intergovernmental Panel on Climate Change (IPCC) advices that, to avoid the worst impacts from climate change, global CO 2
Agricultural Statistics ANNUAL REPORT OF MILK COLLECTION AND PRODUCTION OF DAIRY PRODUCTS
 MD 32 Methodological document ISSN 1840 488X Agricultural Statistics ANNUAL REPORT OF MILK COLLECTION AND PRODUCTION OF DAIRY PRODUCTS Bosnia and Herzegovina Agency for Statistics of Bosnia and Herzegovina
In 2013, the Spanish economy emits 316.9 million tonnes of greenhouse effect gases, 7.8% less than in 2012
 20 November 2015 Environmental accounts. Atmospheric Emission Accounts. Base 2010. Accounting series 2010-2013 In 2013, the Spanish economy emits 316.9 million tonnes of greenhouse effect gases, 7.8% less
The global need for sustainable food, fuel and fibre production
 The global need for sustainable food, fuel and fibre production Research, Education and Collaboration at the Swedish University of Agricultural Sciences Johan Schnürer, professor Assistant Vice-Chancellor
Nitrogen Management Project Protocol (NMPP) Special Topics Webinar & Project Developer Training
 Special Topics Webinar & Project Developer Training") Nitrogen Management Project Protocol (NMPP) Special Topics Webinar & Project Developer Training January 17 th 2013 Scott Hernandez Business Development Manager Teresa Lang Policy Manager & NMPP Lead Agenda
Nitrogen Management Project Protocol (NMPP) Special Topics Webinar & Project Developer Training January 17 th 2013 Scott Hernandez Business Development Manager Teresa Lang Policy Manager & NMPP Lead Agenda
Smart Facilities Management with Oracle Applications. Statement of Direction August 2011
 Smart Facilities Management with Oracle Applications Statement of Direction August 2011 Smart Facilities Management with Oracle Applications Introduction... 3 Basics of Carbon Accounting... 4 Carbon Accounting
Birmingham City University / Students Union Aspects and Impacts Register. Waste. Impacts description
 Birmingham City University / Students Union and Impacts Register Waste Production of non - hazardous waste Production of hazardous waste Storage of non - hazardous waste Potential for waste to be disposed
Regional Analysis of Greenhouse Gas Emissions from Milk Production Practices in the United States
 Regional Analysis of Greenhouse Gas Emissions from Milk Production Practices in the United States Greg Thoma 1,, Jennie Popp 2, Darin Nutter 3, David Shonnard 4, Richard Ulrich 1, Marty Matlock 5, Dae
TABLET DETERGENTS Towards A More Sustainable Future
 TABLET DETERGENTS Towards A More Sustainable Future Unilever Supports Sustainable Development of Detergents with Tablets THE CONTRIBUTION OF TABLETS Unilever is committed to meeting the needs of customers
Guide to Cereals in the UK
 Guide to Cereals in the UK WHEAT Wheat is the most widely grown arable crop in the UK. On average, it covers around 2 million hectares of land and produces about 15 million tonnes of wheat each year with
GHG data management issues in an Oil Company. Maria Mantini, Corporate HSE Leonardo Gelpi, Corporate M2M Oil & Gas Session New Delhi, 4 th March 2010
 GHG data management issues in an Oil Company Maria Mantini, Corporate HSE Leonardo Gelpi, Corporate M2M Oil & Gas Session New Delhi, 4 th March 2010 Agenda Boundaries and approaches definition GHG data
Dairy Industry Restructuring Act 2001: Review of Fonterra's 2012/13 base milk price calculation
 ISBN no. 978-1-869453-20-6 Public version Dairy Industry Restructuring Act 2001: Review of Fonterra's 2012/13 base milk price calculation Draft report Date: 15 August 2013 2 Confidential material in this
How to Earn the LEED Green Power Credit
 3D EG REES WH ITE PAPER How to Earn the LEED Green Power Credit Using on-site and off-site renewable energy to mitigate the impact of greenhouse gas emissions associated with a LEED project s energy use
February 24 2010 Biogas as a grid stabilising power source
 Biogas as a grid stabilising power source By Bruno Sander Nielsen Joint biogas plants Farm scale biogas plants Consultants Energy sector Sub-suppliers Secretariat: Chairman: N.J. Pedersen Secr.: Bruno
LCA of biofuels: developments and constraints
 LCA of biofuels: developments and constraints Dr. Julio C. Sacramento Rivero Faculty of Chemical Engineering Universidad Autonoma de Yucatan 1 Contents Scope of this presentation Brief overview of LCA
Agricultural Production and Research in Heilongjiang Province, China. Jiang Enchen. Professor, Department of Agricultural Engineering, Northeast
 1 Agricultural Production and Research in Heilongjiang Province, China Jiang Enchen Professor, Department of Agricultural Engineering, Northeast Agricultural University, Harbin, China. Post code: 150030
BT s supply chain carbon emissions a report on the approach and methodology
 BT s supply chain carbon emissions a report on the approach and methodology April 2015 1 BT s supply chain emissions metrics approach and methodology 1 Are supply chain emissions really the essential,
Musgrave Energy & Natural Resources Management Policy. Working together to deliver sustainability
 Musgrave Energy & Natural Resources Management Policy Working together to deliver sustainability Musgrave Energy & Natural Resources Management Policy Working together to deliver sustainability BACKGROUND
The Emissions Reduction Fund what it means for you. How Australian businesses and the community can benefit from the Emissions Reduction Fund
 The Emissions Reduction Fund what it means for you How Australian businesses and the community can benefit from the Emissions Reduction Fund Written and published by the Department of the Environment Copyright
Guide to managing commodity risk
 Guide to managing commodity risk October 2012 ISBN: 978-1-921742-33-0 CPA Australia Ltd ( CPA Australia ) is one of the world s largest accounting bodies representing more than 139,000 members of the financial,
CORN BY-PRODUCTS IN DAIRY COW RATIONS
 CORN BY-PRODUCTS IN DAIRY COW RATIONS Dennis Lunn, Ruminant Nutritionist Shur-Gain, Nutreco Canada Inc. CORN BY-PRODUCTS IN DAIRY COW RATIONS Dennis Lunn, Ruminant Nutritionist Shur-Gain, Nutreco Canada
ENVIRONMENTAL REPORT 2012 13
 ENVIRONMENTAL REPORT 2012 13 Education Services Australia Limited ABN 18 007 342 421 Education Services Australia Annual Report ISSN 1839-4930 First published November 2011 2013 Education Services Australia
AUSTRALIA. Submission to the SBSTA May 2013. Views on the Elaboration of a Framework for Various Approaches. I. Overview
 AUSTRALIA Submission to the SBSTA May 2013 Views on the Elaboration of a Framework for Various Approaches I. Overview This submission contains Australia s views on the matters referred to in paragraphs
Prudential plc. Basis of Reporting: GHG emissions data and other environmental metrics.
 Prudential plc. Basis of Reporting: GHG emissions data and other environmental metrics. This Basis of Reporting document supports the preparation and reporting of GHG emissions data and other environmental
HUGO BOSS ENVIRONMENTAL COMMITMENT. Our claim. Our approach
 HUGO BOSS ENVIRONMENTAL COMMITMENT HUGO BOSS assumes responsibility for future generations. This entails that we also pursue our high standards for quality and performance in environmental protection.
System Basics for the certification of sustainable biomass and bioenergy
 ISCC 201 System Basics System Basics for the certification of sustainable biomass and bioenergy ISCC 11-03-15 V 2.3-EU Copyright notice ISCC 2011 This ISCC document is protected by copyright. It is freely
LIFE-CYCLE IMPACTS AND COSTS OF MANGANESE LOSSES AND RECOVERY DURING FERROMANGANESE PRODUCTION
 LIFE-CYCLE IMPACTS AND COSTS OF MANGANESE LOSSES AND RECOVERY DURING FERROMANGANESE PRODUCTION L.A. Westfall 1, M.H. Cramer 1, J. Davourie 1, D. McGough 2 and M. Ali 1 1 Hatch Ltd., 2800 Speakman Drive,
Estimating emission inventories of French farms using the Farm Accountancy Data Network (FADN)
") Estimating emission inventories of French farms using the Farm Accountancy Data Network (FADN) M.S. Corson, J.F. Ruas, F. Levert, C. Guerrier, P. Dupraz, H.M.G. van der Werf SAS and SMART Research Units,
Estimating emission inventories of French farms using the Farm Accountancy Data Network (FADN) M.S. Corson, J.F. Ruas, F. Levert, C. Guerrier, P. Dupraz, H.M.G. van der Werf SAS and SMART Research Units,
Small Business Economic Impact Statement Chapter 173-441 WAC Reporting of Emission of Greenhouse Gases
 Small Business Economic Impact Statement Chapter 173-441 WAC Reporting of Emission of Greenhouse Gases September 2010 Publication no. 10-02-024 Publication and Contact Information This report is available
SCOTTISH DAIRY SUPPLY CHAIN GREENHOUSE GAS EMISSIONS
 SCOTTISH DAIRY SUPPLY CHAIN GREENHOUSE GAS EMISSIONS Jan 2011 Main project report A research project to assess global greenhouse gas emissions associated with the Scottish dairy supply chain and identify
How UK farmers could reduce greenhouse gas (GHG) emissions
 emissions") How UK farmers could reduce greenhouse gas (GHG) emissions Standard Note: SN/SC/4340 Last updated: 23 March 2012 Author: Section Christopher Barclay Science and Environment Section It is generally accepted
How UK farmers could reduce greenhouse gas (GHG) emissions Standard Note: SN/SC/4340 Last updated: 23 March 2012 Author: Section Christopher Barclay Science and Environment Section It is generally accepted
Summary: Apollo Group Greenhouse Gas Inventory (Worldwide)
") Summary: Apollo Group Greenhouse Gas Inventory (Worldwide) Table of Contents Overview... 1 Boundaries... 1 Scopes... 1 Estimated Components... 1 Calculation Methodologies and Assumptions... 2 Tables...
Summary: Apollo Group Greenhouse Gas Inventory (Worldwide) Table of Contents Overview... 1 Boundaries... 1 Scopes... 1 Estimated Components... 1 Calculation Methodologies and Assumptions... 2 Tables...
Office of Climate Change, Energy Efficiency and Emissions Trading. Business Plan
 Office of Climate Change, Energy Efficiency and Emissions Trading Business Plan April 1, 2011 - March 31, 2014 Table of Contents Message from the Premier...3 1.0 OVERVIEW...4 2.0 MANDATE...5 3.0 LINES
White Paper Life Cycle Assessment and Product Carbon Footprint
 White Paper Life Cycle Assessment and Product Carbon Footprint Fujitsu ESPRIMO E9900 Desktop PC Climate change is one of the most important global challenges that society of the 21st century faces. According
ECCM 2008 Calculations Steffie Broer - Trip to Austria - Greenhouse Gas Emissions Assessment
 Greenhouse Gas Emissions Assessment - Steffie Broer - THE APPROACH Climate change, caused by the emission of greenhouse gases (GHGs), threatens to have severe impacts on the environment and society over
Revealing the costs of air pollution from industrial facilities in Europe a summary for policymakers
 Revealing the costs of air pollution from industrial facilities in Europe a summary for policymakers A new European Environment Agency (EEA report, Revealing the costs of air pollution from industrial
Ontario Hydro. September 28, 1995
 Ontario Hydro Ontario Hydro 700 University Avenue Toronto, Ontario M5G 1X6 O. Allan Kupcis, President & CEO September 28, 1995 Honourable Anne McLellan Minister of Natural Resources Canada Sir William
The economics of micro-algae production
 The economics of micro-algae production and processing into biofuel December 2006 Thomas Schulz Research Economist Farming Systems, Department of Agriculture Western Australia Key Message The Research