Introduction to EELS
|
|
|
- Pauline Gilbert
- 8 years ago
- Views:
Transcription
1 Introduction to EELS Nestor J. Zaluzec Brief Review of Energy Loss Processes Instrumentation: Detector Systems Instrumentation: AEM Systems Data Analysis and Quantification: Advanced Topics 1

2 Brief Review of Energy Loss Processes Electron Excitation of Inner Shell & Continuum Processes Spectral Shapes Notation of Edges Electron Scattering Angular Distributions The Emission Process: 1-Excitation, 2-Relaxation, 3-Emission 2

3 Electron Energy Loss Spectroscopy Measure the changes in the energy distribution of an electron beam transmitted through a thin specimen. Each type of interaction between the electron beam and the specimen produces a characteristic change in the energy and angular distribution of scattered electrons. The energy loss process is the primary interaction event. All other sources of analytical information ( i.e. X-rays, Auger electrons, etc.) are secondary products of the initial inelastic event. Thus, EELS has the highest potential yield of information/inelastic event E V Electron Emission 3 Photon Emission 3 h E F M L K a b c 3
 are secondary products of the initial inelastic event.")
4 DOS L shell M shell d-band s-band } XEDS/XRF AES XPS/UPS EELS/XAS Incident Electrons Incident Photons Schematic Diagram Illustrating Sources of Inelastic Scattering Signals Experimental XEDS, XPS, and EELS data from the Copper L shell. Note the differences in energy resolution, and spectral features. Intensity (Arb Units) XEDS XPS EELS Energy (ev) 4

5 5

6 Comparision Light Element Spectroscopy Resolution XEDS vs EELS Comparision of WL XEDS Detector and EELS spectra taken from the same NiO specimen O K Relative Intensity (Arb. Units) XEDS NiL EELS Energy (ev) Note the enhanced spectral information in the EELS data. Vertical scale is arbitrary and chozen for clarity of presentation. 6

7 7
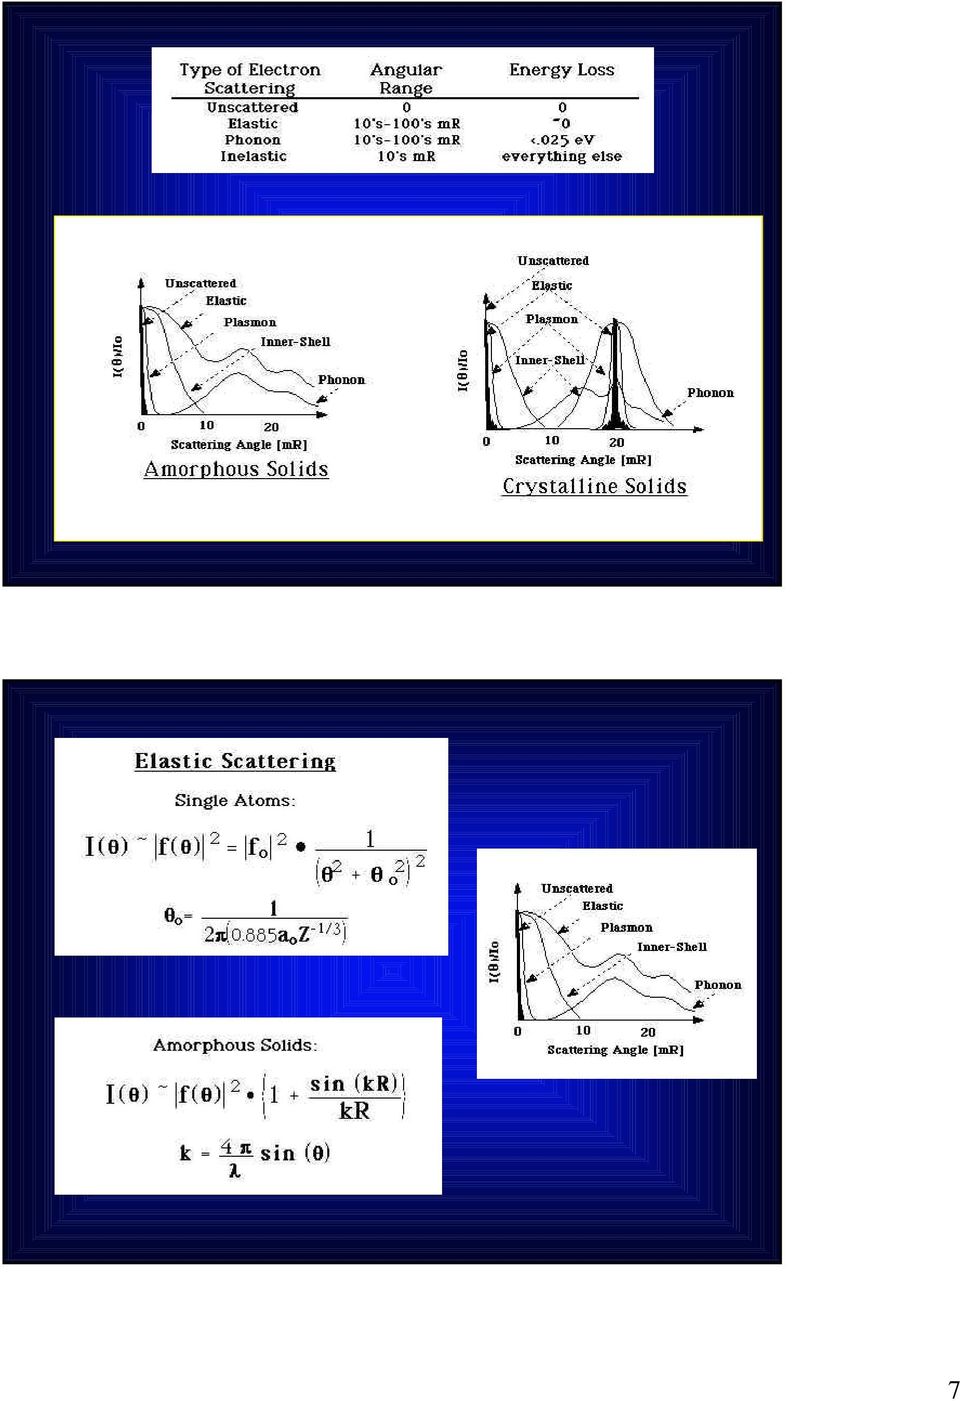
8 8

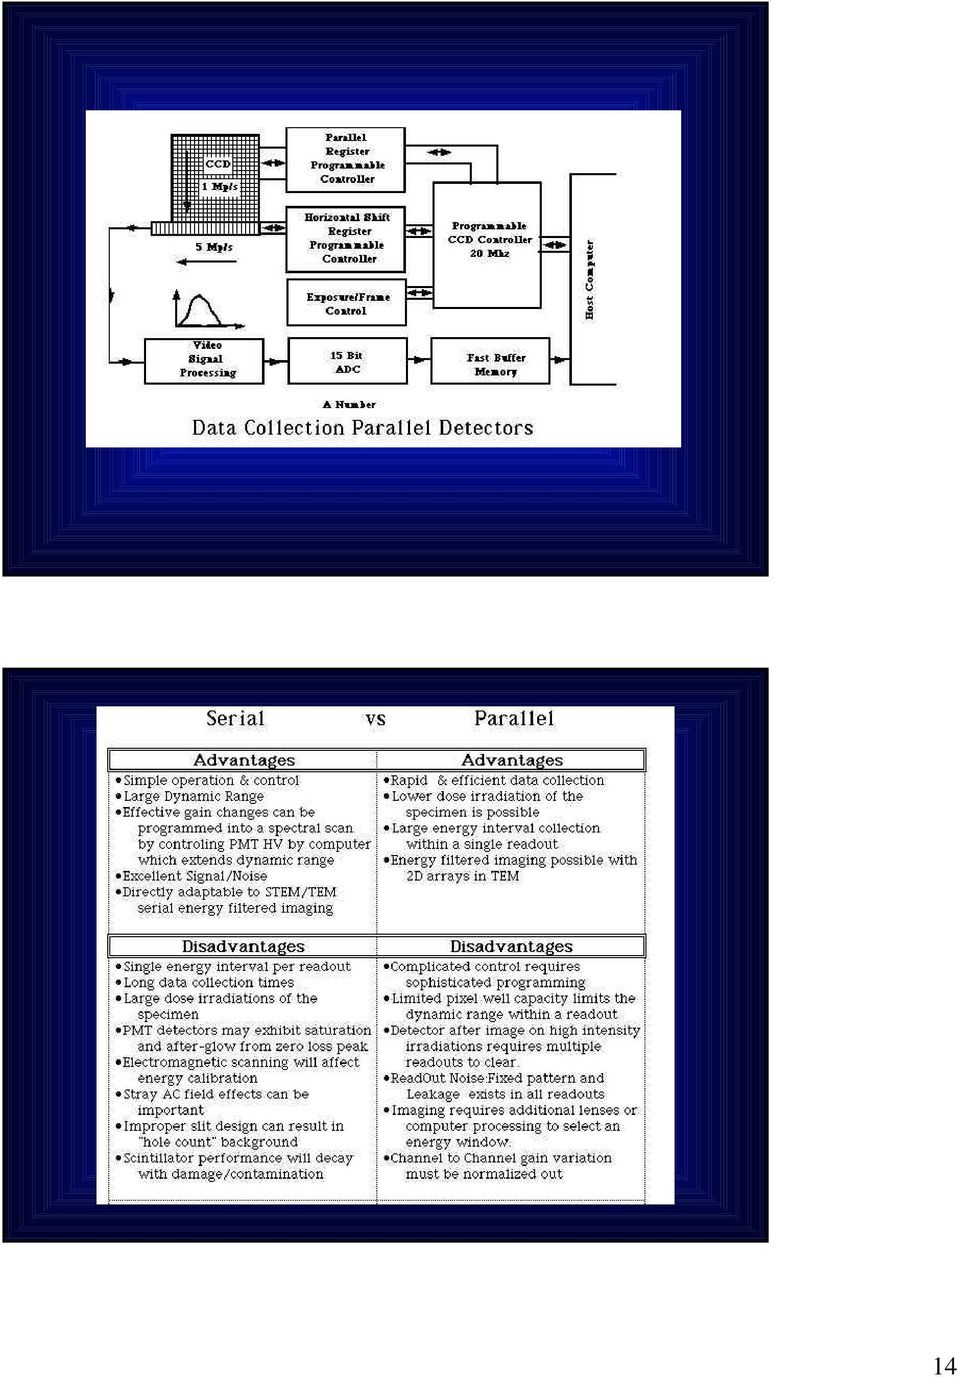
9 Instrumentation: Detector Systems Energy Loss Spectrometers Basic Principles Electrostatic/Electromagnetic Serial/Parallel Detector Systems Spectral Artifacts Multichannel Analyzers 9

10 10

11 11

12 12

13 13

14 14
15 Data Analysis and Quantification: Spectral Processing Thin Film Quantification Methods Specimen Thickness Effects 15

16 16

17 M 23 C 6 in Steel : Spectral Overlap 17

18 Spectral OverLap Problems also exist in EELS 18

19 Two Related Methods are sometimes used: Second Difference Filtering (Shuman( etal MAS,1983) Record 3 Energy Loss Spectra which are displaced in energy by de Mathematically combine in computer to form the Second Difference (SD) Spectrum SD(E) = I (E-dE) - 2 I 1 2 (E) + I 3 (E+dE) Digital Filtering Spectrum has the appearance of a derivitive, removes channel to channel gain variation in parallel EELS and slowly varying backgrounds. Sharp features are enhanced in visibility. This is related to a simple numerical differentiation of a single spectrum 19

20 I k = P k * I o I k = Number of electron having excited a kth inner shell P k = Probability of excitation of the kth shell I o = Incident electron current P k = N k N k = Number of atoms of the element analyzed = Ionization cross-section for the kth shell Alternatively; Consider the ratio of Intensities of any two Edges in the same spectrum I and I A B Invoke the Ratio Method and obtain the exact equation: Note the similiarity of this equation with that of Thin Film XEDS 20

21 But in the real world the assumptions used above simple arguments are never realized: in the Measure all scattered electrons ( = 180 0) Integration over all energy Losses Because we must measure over a finite energy window ( E) we modify the expression to: e - N A= I A( E) A( E)*I 0 we also measure over a finite angular window ( ) and therefore, we modify the expression to: Incident Beam Convergence α N A= I A( E, ) A( E, )*I 0 and the ratio equation becomes: N A IA( E, ) = kab N B I B( E, ) Specimen β Inelastic Scattering Angle with k AB = B( E, ) A( E, ) 21
22 Problems in EELS Quantification Cross-section Calculations 22
23 Problems In EELS Quantification Collection Angle Errors 23
24 Effects of Specimen Thickness Multiple Scattering Low Loss Core Loss -Visiblity Quantification Effects Effects of Specimen Thickness Low Loss Spectra Intensity τ/λ = 0.9 τ/λ =1.5 τ/λ = 1.9 τ/λ = 2.5 I P I o = t ln I T Io = t Energy Loss (ev) 24
25 Effects of Specimen Thickness Core Loss Spectra C o u n t s Energy (ev) Experimental EELS Edge/Background Ratio as a Function of Specimen Thickness at Constant Accelerating Voltage Variation in EELS Edge P/B with Thickness EELS Intensity Normalized to Pre-Edge Bgnd t/ = 0.23 t/ = 0.62 O K Edge in NiO t/ = Energy Loss (ev) 25
26 Mean Free Path Calculated Variation In Mean Free Path as a Function of Accelerating Voltage 2.5 T = m ov 2 2 E m 1 n 2 = m oc a o T ( ) ln 2 T c E m 1 + E o 2m = Eo o c E 2 o m o c 2 Normalized Mean Free Path Accelerating Voltage (kv) Experimental Measurement of MFP 26
27 Experimental EELS Edge/Background Ratio as a Function of Accelerating Voltage at Constant Specimen Thickness O K Edge in NiO Variation in EELS Edge P/B with kv EELS Intensity Normalized to Pre-Edge Background 300 kv 200 kv 100 kv Energy Loss (ev) Specimen Thickness Effects on EELS 27
28 Effects of Thickness and Voltage on EELS P/B Deconvolution of Multiple Scattering using Leapman/Swyt Method 28
29 This defines a "Thin Film Approximation" for EELS i.e. / < 1.0 Advanced Topics Low Loss Spectroscopy Plasmon Losses Studies Dielectric Properties Core Loss Spectroscopy Near Edge Structure Extended Fine Structure Radiation Damage 29
30 EELS Measurements of Valence Electron Densities Table 2 Experimental and Calculated Plasmon Shifts in Selected Metal-Hydrogen Systems Material Expt. E p (ev) Calculated FEM Ep/H/M Expt. Ep/H/M FEM Calc. Group II Mg MgH Group III Sc ev ScH Y YH Group IV Ti TiH Zr ZrH Group V V VH PseudoGroup VI FeTi /21.9 * FeTiH( β) /21.8 * /-0.3 * FeTiH 2 (γ ) /21.5 * * Calculated using modified FEM with m s =m e and m d =1.9 m e 30
31 Information in Core-Loss Profiles L3 L2 L1 M5 M4 M3 M2 M1 N 45.. O23.. K L M N & O 31
32 Oxygen K Shell in superconducting and non-superconducting specimens in the Bi 2 Sr 2 Ca n-1 Cu n O x system. Note the disappearance of the pre-edge peak in the non-superconducting specimen. Intensity CaSrBiCuO Non-SuperConducting 525 Energy Loss (ev) 575 O K Shell NES in Y-Ba-Cu-O Perpendicular to C Axis Parallel to C Axis Orientation dependance of the O K shell in Y 1 Ba 2 Cu 3 O 7- δ. The intensity variation of the pre-edge peak indicates that the hole state just above the Fermi level has p x,y symmetry. Parallel and perpendicular here refer to the momentum transfer directions which are by conservation perpendicular to the incident beam directions. 32
33 33
34 Copper L-shell Core Loss Spectroscopy in Metallic, Oxide and High Tc Superconductor Phases 34
35 35
36 Amorphous Fe x Ge 1-x Magnetic Materials x=0.2 x=0.3 x=0.4 x=0.5 x=0.6 x=1.0 Fe x Ge 1-x Energy Loss (ev) 36
37 Silicon 111 ZAP- Gamma Corrected Unfiltered Elastic 2nd Plasmon 1st Plasmon 37
38 Unscattered Elastic Plasmon I( )/Io Inner-Shell Phonon Scattering Angle [mr] Elastic Scattering : Crystalline Solids I( ) ~ F(hkl) 2 j F(hkl ) = f j ( ) exp (-2 ig r) V(r) = - g? V g exp (2πig.r) ; V g = h 2 2πmV e f(θ) Energy Filtered Convergent Beam Electron Diffraction Filtering Removes Inelastic Scattering Dynamical Calculations Used to Compare Experimental Data to Models Low Order Structure Factors Determined (Semi-Conductors, Metals) Applied to Ti-Al Intermetallics and Charge Density (Difference) Maps 38
39 Fig. 1a - (200) CBED dark field disk Experimental Calculated Difference Angular Dispersion in mrad
40 Radiation Damage in Materials Damage Creation Event/Process Mobile Vacancy & Interstitials Created Solid State Order/DisOrder/Amorphization/ Studies Lindemann Melting Criterion Perfect Crystals Melt: µ 2 vib = 9 h2 T 2 M k B θ c > µ 2 crit T m = M k B θ2 c µ 2 9 h 2 crit Defective Crystal Melt : µ 2 total = µ 2 vib + µ 2 static > µ 2 crit T d = M k 2 B θ d 2 µ 9 h 2 crit Materials Research Society Bulletin : 19 #7 (1994) - Lam & Okamoto P.C. Liu, P. R. Okamoto, 40
41 Solid State Order/DisOrder/Amorphization/ Studies We can experimentally measure < I( ) ~ F(hkl ) 2 1-e -2M M = 8 u2 sin ( ) using Energy Filtered Electron Diffraction P.C. Liu, P. R. Okamoto, Energy Filtered Electron Diffraction 41
42 Solid State Order/DisOrder/Amorphization/ Studies A A B B P.C. Liu, P. R. Okamoto, Solid State Order/DisOrder/Amorphization/ Studies P.C. Liu, P. R. Okamoto, 42
43 EELS / NES Measurements in Order/DisOrder/Amorphization Studies in TM Alloys Irradition Effects in TM alloys <---> Structure/Properties Mechanical Properties <---> Electronic Structure TM's have tightly bound valence d band which overlaps and hybridizes with broader nearly Free-electron sp band In TM's with partially filled d-bands the NES is readily measured. P.C. Liu, P. R. Okamoto, Phase Stablitiy of Ion Irradiated of Minerals for HLW Storage Materials Zirconolite ~ Ca ZrTi 2 O 7 Perovskite ~ Ca Ti O 3 Pyrochlore ~ VIII A 2 VI B 2 IV X 6 Y Candidate Phases for Immobilization of REE, & ACT in HLW forms Over Geologic Time Scales alpha decay causes the minerals to become metamict. In-situ Kr Ion Irradiation used in HVEM-Tandem to simulate long-term α-decay damage What is the Polytype, Dose, and Composition dependance? Are there other methods of measuring the damage and can they tell us about the structure? K.L. Smith 43
44 Zirconolite - 2M Illustrating the loss of crystallinity with irradiation dose (figure 1) Selected area diffraction patterns (SADs) of individual grains of various zirconolites were recorded as a function of dose to establish the critical dose for amorphisation (D ). c Phase Stablitiy of Ion Irradiated of Minerals for HLW Storage Materials Material Dc (10 14 ions/cm 2) Zirconolite - 2M Nd + Zirconolite- 2M Nd + Zirconolite - 3T Nd + Zirconolite - 4M U + Zirconolite - 2M U - Pyrochlore Th - Zirconolite 3T Perovskite Dc = f ( complexity/polytype) = f (dopant) but only by a factor of ~ 2 Additional studies planned Vary Ion Energy Fabrication Methodology(Sintering/Hot Pressing/Temperature) Dopant Partitioning K.L. Smith, 44
45 EELS Measurements 11 Figure 2. The Ti L edges of undoped zirconolite before and after ion irradiation, and two Ti standards (TiO 2 and Ti 2 O 3 ) EELS Results Comparison of the Zirconolite and Ti-oxide spectra suggests that Ti predominantly exhibits a valence of 4 + in both unirradiated and irradiated Zirconolite and that the bond lengths in zirconolite are similar to those in TiO 2. (figure 2) The electron energy loss near edge structure (ELNES) of the Ti L shell is consistent with the Ti changing from octahedral coordination to tetrahedral coordination (figure 3). 45
46 HR EELS of Zirconolite Ti L shell Figure 3. HR EELS of Ti L Shell in Zirconolite. EELS Results Specimen L2 /L 3- Spin L* 2 /L * 3- Energy Shift Orbit Molecular L3- L* 3 Ti 2O TiO CaTiO (CaxGdy)TiO (CaxGdy)(TinAl m)o CaZrTi 2O7(Zirconolite) UnIrrad Irradiated Table 2 46
47 EELS Results To quantitatively measure the changes due to irradiation, we fitted the zirconolite Ti-L spectra with four Lorentzians and calculated L 2 /L 3 and L* 2 / L* 3 and L 3 - L* 3 * (Table 2). L 2 /L 3 is the same before and after irradiation which suggests that radiation damage does not significantly affect the number of holes in the d-band (and hence valence). L* 2 / L* 3 increases and L 3 - L* 3 that radiation damage in zirconolite causes a distortion of the octahedral field around Ti atoms toward a tetrahedral configuration 47
X-Ray Diffraction HOW IT WORKS WHAT IT CAN AND WHAT IT CANNOT TELL US. Hanno zur Loye
 X-Ray Diffraction HOW IT WORKS WHAT IT CAN AND WHAT IT CANNOT TELL US Hanno zur Loye X-rays are electromagnetic radiation of wavelength about 1 Å (10-10 m), which is about the same size as an atom. The
PHYSICAL METHODS, INSTRUMENTS AND MEASUREMENTS Vol. III - Surface Characterization - Marie-Geneviève Barthés-Labrousse
 SURFACE CHARACTERIZATION Marie-Geneviève Centre d Etudes de Chimie Métallurgique, CNRS, Vitry-sur-Seine, France Keywords: Surface Analysis, Surface imaging, Surface composition, Surface chemical analysis,
Amptek Application Note XRF-1: XRF Spectra and Spectra Analysis Software By R.Redus, Chief Scientist, Amptek Inc, 2008.
 Amptek Application Note XRF-1: XRF Spectra and Spectra Analysis Software By R.Redus, Chief Scientist, Amptek Inc, 2008. X-Ray Fluorescence (XRF) is a very simple analytical technique: X-rays excite atoms
Electron Microscopy 3. SEM. Image formation, detection, resolution, signal to noise ratio, interaction volume, contrasts
 Electron Microscopy 3. SEM Image formation, detection, resolution, signal to noise ratio, interaction volume, contrasts 3-1 SEM is easy! Just focus and shoot "Photo"!!! Please comment this picture... Any
Solid State Detectors = Semi-Conductor based Detectors
 Solid State Detectors = Semi-Conductor based Detectors Materials and their properties Energy bands and electronic structure Charge transport and conductivity Boundaries: the p-n junction Charge collection
EDS system. CRF Oxford Instruments INCA CRF EDAX Genesis EVEX- NanoAnalysis Table top system
 EDS system Most common X-Ray measurement system in the SEM lab. Major elements (10 wt% or greater) identified in ~10 secs. Minor elements identifiable in ~100 secs. Rapid qualitative and accurate quantitative
X-ray thin-film measurement techniques
 Technical articles X-ray thin-film measurement techniques II. Out-of-plane diffraction measurements Toru Mitsunaga* 1. Introduction A thin-film sample is two-dimensionally formed on the surface of a substrate,
Properties of Electrons, their Interactions with Matter and Applications in Electron Microscopy
 Properties of Electrons, their Interactions with Matter and Applications in Electron Microscopy By Frank Krumeich Laboratory of Inorganic Chemistry, ETH Zurich, Vladimir-Prelog-Weg 1, 8093 Zurich, Switzerland
Electron spectroscopy Lecture 1-21. Kai M. Siegbahn (1918 - ) Nobel Price 1981 High resolution Electron Spectroscopy
 Nobel Price 1981 High resolution Electron Spectroscopy") Electron spectroscopy Lecture 1-21 Kai M. Siegbahn (1918 - ) Nobel Price 1981 High resolution Electron Spectroscopy 653: Electron Spectroscopy urse structure cture 1. Introduction to electron spectroscopies
Electron spectroscopy Lecture 1-21 Kai M. Siegbahn (1918 - ) Nobel Price 1981 High resolution Electron Spectroscopy 653: Electron Spectroscopy urse structure cture 1. Introduction to electron spectroscopies
Advanced Physics Laboratory. XRF X-Ray Fluorescence: Energy-Dispersive analysis (EDXRF)
") Advanced Physics Laboratory XRF X-Ray Fluorescence: Energy-Dispersive analysis (EDXRF) Bahia Arezki Contents 1. INTRODUCTION... 2 2. FUNDAMENTALS... 2 2.1 X-RAY PRODUCTION... 2 2. 1. 1 Continuous radiation...
Advanced Physics Laboratory XRF X-Ray Fluorescence: Energy-Dispersive analysis (EDXRF) Bahia Arezki Contents 1. INTRODUCTION... 2 2. FUNDAMENTALS... 2 2.1 X-RAY PRODUCTION... 2 2. 1. 1 Continuous radiation...
Electron Microscopy SEM and TEM
 Electron Microscopy SEM and TEM Content 1. Introduction: Motivation for electron microscopy 2. Interaction with matter 3. SEM: Scanning Electron Microscopy 3.1 Functional Principle 3.2 Examples 3.3 EDX
Chapter 8. Low energy ion scattering study of Fe 4 N on Cu(100)
") Low energy ion scattering study of 4 on Cu(1) Chapter 8. Low energy ion scattering study of 4 on Cu(1) 8.1. Introduction For a better understanding of the reconstructed 4 surfaces one would like to know
Low energy ion scattering study of 4 on Cu(1) Chapter 8. Low energy ion scattering study of 4 on Cu(1) 8.1. Introduction For a better understanding of the reconstructed 4 surfaces one would like to know
Preface Light Microscopy X-ray Diffraction Methods
 Preface xi 1 Light Microscopy 1 1.1 Optical Principles 1 1.1.1 Image Formation 1 1.1.2 Resolution 3 1.1.3 Depth of Field 5 1.1.4 Aberrations 6 1.2 Instrumentation 8 1.2.1 Illumination System 9 1.2.2 Objective
Defects Introduction. Bonding + Structure + Defects. Properties
 Defects Introduction Bonding + Structure + Defects Properties The processing determines the defects Composition Bonding type Structure of Crystalline Processing factors Defects Microstructure Types of
Vacuum Evaporation Recap
 Sputtering Vacuum Evaporation Recap Use high temperatures at high vacuum to evaporate (eject) atoms or molecules off a material surface. Use ballistic flow to transport them to a substrate and deposit.
Electron Microprobe Analysis X-ray spectrometry:
 Electron Microprobe Analysis X-ray spectrometry: 1. X-ray generation and emission 2. X-ray detection and measurement X-ray energy and wavelength E=hν h : Planck's constant (6.626x10⁻³⁴ Joule.sec or, 6.626x10⁻³⁴
MODERN ATOMIC THEORY AND THE PERIODIC TABLE
 CHAPTER 10 MODERN ATOMIC THEORY AND THE PERIODIC TABLE SOLUTIONS TO REVIEW QUESTIONS 1. Wavelength is defined as the distance between consecutive peaks in a wave. It is generally symbolized by the Greek
Introduction to Geiger Counters
 Introduction to Geiger Counters A Geiger counter (Geiger-Muller tube) is a device used for the detection and measurement of all types of radiation: alpha, beta and gamma radiation. Basically it consists
Ionic Bonding Pauling s Rules and the Bond Valence Method
 Ionic Bonding Pauling s Rules and the Bond Valence Method Chemistry 754 Solid State Chemistry Dr. Patrick Woodward Lecture #14 Pauling Rules for Ionic Structures Linus Pauling,, J. Amer. Chem. Soc. 51,,
X-ray Diffraction and EBSD
 X-ray Diffraction and EBSD Jonathan Cowen Swagelok Center for the Surface Analysis of Materials Case School of Engineering Case Western Reserve University October 27, 2014 Outline X-ray Diffraction (XRD)
X-ray photoelectron. Ba 0.5 Sr 0.5 Co 0.8 Fe 0.2 O 3 δ and La 0.6 Sr 0.4 Co 0.2 Fe 0.8 O 3 δ before and after thermal treatment and permeation test
 study on Ba 0.5 Sr 0.5 Co 0.8 Fe 0.2 O 3 δ and La 0.6 Sr 0.4 Co 0.2 Fe 0.8 O 3 δ before and after thermal treatment and permeation test Patrizia Rosa 1 1 Dipartimenti di Fisica Università degli Studi di
Crystal Structure of High Temperature Superconductors. Marie Nelson East Orange Campus High School NJIT Professor: Trevor Tyson
 Crystal Structure of High Temperature Superconductors Marie Nelson East Orange Campus High School NJIT Professor: Trevor Tyson Introduction History of Superconductors Superconductors are material which
Nanoelectronics 09. Atsufumi Hirohata Department of Electronics. Quick Review over the Last Lecture
 Nanoelectronics 09 Atsufumi Hirohata Department of Electronics 12:00 Wednesday, 4/February/2015 (P/L 006) Quick Review over the Last Lecture ( Field effect transistor (FET) ): ( Drain ) current increases
Lectures about XRF (X-Ray Fluorescence)
") 1 / 38 Lectures about XRF (X-Ray Fluorescence) Advanced Physics Laboratory Laurea Magistrale in Fisica year 2013 - Camerino 2 / 38 X-ray Fluorescence XRF is an acronym for X-Ray Fluorescence. The XRF technique
1 / 38 Lectures about XRF (X-Ray Fluorescence) Advanced Physics Laboratory Laurea Magistrale in Fisica year 2013 - Camerino 2 / 38 X-ray Fluorescence XRF is an acronym for X-Ray Fluorescence. The XRF technique
X-RAY FLUORESCENCE SPECTROSCOPY IN PLASTICS RECYCLING
 X-RAY FLUORESCENCE SPECTROSCOPY IN PLASTICS RECYCLING Brian L. Riise and Michael B. Biddle MBA Polymers, Inc., Richmond, CA, USA Michael M. Fisher American Plastics Council, Arlington, VA, USA X-Ray Fluorescence
Midterm Solutions. mvr = ω f (I wheel + I bullet ) = ω f 2 MR2 + mr 2 ) ω f = v R. 1 + M 2m
 = ω f 2 MR2 + mr 2 ) ω f = v R. 1 + M 2m") Midterm Solutions I) A bullet of mass m moving at horizontal velocity v strikes and sticks to the rim of a wheel a solid disc) of mass M, radius R, anchored at its center but free to rotate i) Which of
Midterm Solutions I) A bullet of mass m moving at horizontal velocity v strikes and sticks to the rim of a wheel a solid disc) of mass M, radius R, anchored at its center but free to rotate i) Which of
X Ray Flourescence (XRF)
") X Ray Flourescence (XRF) Aspiring Geologist XRF Technique XRF is a rapid, relatively non destructive process that produces chemical analysis of rocks, minerals, sediments, fluids, and soils It s purpose
X Ray Flourescence (XRF) Aspiring Geologist XRF Technique XRF is a rapid, relatively non destructive process that produces chemical analysis of rocks, minerals, sediments, fluids, and soils It s purpose
Structure Factors 59-553 78
 78 Structure Factors Until now, we have only typically considered reflections arising from planes in a hypothetical lattice containing one atom in the asymmetric unit. In practice we will generally deal
The interaction of Cu(100)-Fe surfaces with oxygen studied with photoelectron spectroscopy. I
-Fe surfaces with oxygen studied with photoelectron spectroscopy. I") 5 The interaction of Cu(100)-Fe surfaces with oxygen studied with photoelectron spectroscopy. I Mg Kα excited photoemission. Abstract The oxidation of Cu(100)-Fe surfaces was studied using XPS. Surfaces
5 The interaction of Cu(100)-Fe surfaces with oxygen studied with photoelectron spectroscopy. I Mg Kα excited photoemission. Abstract The oxidation of Cu(100)-Fe surfaces was studied using XPS. Surfaces
3. What would you predict for the intensity and binding energy for the 3p orbital for that of sulfur?
 PSI AP Chemistry Periodic Trends MC Review Name Periodic Law and the Quantum Model Use the PES spectrum of Phosphorus below to answer questions 1-3. 1. Which peak corresponds to the 1s orbital? (A) 1.06
Basic Concepts of X-ray X Fluorescence by Miguel Santiago, Scientific Instrumentation Specialist
 Basic Concepts of X-ray X Fluorescence by Miguel Santiago, Scientific Instrumentation Specialist University of Puerto Rico Mayagüez Campus Department of Geology X-ray / Microanalysis Laboratory F - 304
Crystalline solids. A solid crystal consists of different atoms arranged in a periodic structure.
 Crystalline solids A solid crystal consists of different atoms arranged in a periodic structure. Crystals can be formed via various bonding mechanisms: Ionic bonding Covalent bonding Metallic bonding Van
Chapter 5. Second Edition ( 2001 McGraw-Hill) 5.6 Doped GaAs. Solution
 5.6 Doped GaAs. Solution") Chapter 5 5.6 Doped GaAs Consider the GaAs crystal at 300 K. a. Calculate the intrinsic conductivity and resistivity. Second Edition ( 2001 McGraw-Hill) b. In a sample containing only 10 15 cm -3 ionized
Chapter 5 5.6 Doped GaAs Consider the GaAs crystal at 300 K. a. Calculate the intrinsic conductivity and resistivity. Second Edition ( 2001 McGraw-Hill) b. In a sample containing only 10 15 cm -3 ionized
PHOTOELECTRIC EFFECT AND DUAL NATURE OF MATTER AND RADIATIONS
 PHOTOELECTRIC EFFECT AND DUAL NATURE OF MATTER AND RADIATIONS 1. Photons 2. Photoelectric Effect 3. Experimental Set-up to study Photoelectric Effect 4. Effect of Intensity, Frequency, Potential on P.E.
High Open Circuit Voltage of MQW Amorphous Silicon Photovoltaic Structures
 High Open Circuit Voltage of MQW Amorphous Silicon Photovoltaic Structures ARGYRIOS C. VARONIDES Physics and EE Department University of Scranton 800 Linden Street, Scranton PA, 18510 United States Abstract:
Hard Condensed Matter WZI
 Hard Condensed Matter WZI Tom Gregorkiewicz University of Amsterdam VU-LaserLab Dec 10, 2015 Hard Condensed Matter Cluster Quantum Matter Optoelectronic Materials Quantum Matter Amsterdam Mark Golden Anne
X-ray diffraction techniques for thin films
 X-ray diffraction techniques for thin films Rigaku Corporation Application Laboratory Takayuki Konya 1 Today s contents (PM) Introduction X-ray diffraction method Out-of-Plane In-Plane Pole figure Reciprocal
Raman spectroscopy Lecture
 Raman spectroscopy Lecture Licentiate course in measurement science and technology Spring 2008 10.04.2008 Antti Kivioja Contents - Introduction - What is Raman spectroscopy? - The theory of Raman spectroscopy
Acousto-optic modulator
 1 of 3 Acousto-optic modulator F An acousto-optic modulator (AOM), also called a Bragg cell, uses the acousto-optic effect to diffract and shift the frequency of light using sound waves (usually at radio-frequency).
Lecture 3: Optical Properties of Bulk and Nano. 5 nm
 Lecture 3: Optical Properties of Bulk and Nano 5 nm The Previous Lecture Origin frequency dependence of χ in real materials Lorentz model (harmonic oscillator model) 0 e - n( ) n' n '' n ' = 1 + Nucleus
Ajit Kumar Patra (Autor) Crystal structure, anisotropy and spin reorientation transition of highly coercive, epitaxial Pr-Co films
 Crystal structure, anisotropy and spin reorientation transition of highly coercive, epitaxial Pr-Co films") Ajit Kumar Patra (Autor) Crystal structure, anisotropy and spin reorientation transition of highly coercive, epitaxial Pr-Co films https://cuvillier.de/de/shop/publications/1306 Copyright: Cuvillier Verlag,
Ajit Kumar Patra (Autor) Crystal structure, anisotropy and spin reorientation transition of highly coercive, epitaxial Pr-Co films https://cuvillier.de/de/shop/publications/1306 Copyright: Cuvillier Verlag,
Scanning Electron Microscopy: an overview on application and perspective
 Scanning Electron Microscopy: an overview on application and perspective Elvio Carlino Center for Electron Microscopy - IOM-CNR Laboratorio Nazionale TASC - Trieste, Italy Location of the Center for Electron
Chapter 7. Electron Structure of the Atom. Chapter 7 Topics
 Chapter 7 Electron Structure of the Atom Copyright The McGraw-Hill Companies, Inc. Permission required for reproduction or display. 1 Chapter 7 Topics 1. Electromagnetic radiation 2. The Bohr model of
Experiment: Crystal Structure Analysis in Engineering Materials
 Experiment: Crystal Structure Analysis in Engineering Materials Objective The purpose of this experiment is to introduce students to the use of X-ray diffraction techniques for investigating various types
13C NMR Spectroscopy
 13 C NMR Spectroscopy Introduction Nuclear magnetic resonance spectroscopy (NMR) is the most powerful tool available for structural determination. A nucleus with an odd number of protons, an odd number
Spectral distribution from end window X-ray tubes
 Copyright (C) JCPDS-International Centre for Diffraction Data 1999 393 Spectral distribution from end window X-ray tubes N. Broll 1, P. de Chateaubourg 2 1 FORTEX - E.N.S.A.I.S. 24, bld de la Victoire,
Introduction to X-Ray Powder Diffraction Data Analysis
 Introduction to X-Ray Powder Diffraction Data Analysis Center for Materials Science and Engineering at MIT http://prism.mit.edu/xray An X-ray diffraction pattern is a plot of the intensity of X-rays scattered
Reflection Electron Microscopy and Spectroscopy for Surface Analysis
 Reflection Electron Microscopy and Spectroscopy for Surface Analysis by Zhong Lin Wang 1 Introduction In 1986, E. Ruska was awarded the Nobel Physics Prize for his pioneering work of building the world's
The Physics of Energy sources Renewable sources of energy. Solar Energy
 The Physics of Energy sources Renewable sources of energy Solar Energy B. Maffei Bruno.maffei@manchester.ac.uk Renewable sources 1 Solar power! There are basically two ways of using directly the radiative
Instrumentation. (Figure 2)
") X-Ray Fluorescence Lab Report Nydia Esparza Victoria Rangel Physics of XRF XRF is a non destructive analytical technique that is used for elemental and chemical analysis. X-Ray Fluorescence Spectroscopy
X-Ray Fluorescence Lab Report Nydia Esparza Victoria Rangel Physics of XRF XRF is a non destructive analytical technique that is used for elemental and chemical analysis. X-Ray Fluorescence Spectroscopy
O6: The Diffraction Grating Spectrometer
 2B30: PRACTICAL ASTROPHYSICS FORMAL REPORT: O6: The Diffraction Grating Spectrometer Adam Hill Lab partner: G. Evans Tutor: Dr. Peter Storey 1 Abstract The calibration of a diffraction grating spectrometer
DO PHYSICS ONLINE FROM QUANTA TO QUARKS QUANTUM (WAVE) MECHANICS
 MECHANICS") DO PHYSICS ONLINE FROM QUANTA TO QUARKS QUANTUM (WAVE) MECHANICS Quantum Mechanics or wave mechanics is the best mathematical theory used today to describe and predict the behaviour of particles and waves.
DO PHYSICS ONLINE FROM QUANTA TO QUARKS QUANTUM (WAVE) MECHANICS Quantum Mechanics or wave mechanics is the best mathematical theory used today to describe and predict the behaviour of particles and waves.
Chapter 8 Atomic Electronic Configurations and Periodicity
 Chapter 8 Electron Configurations Page 1 Chapter 8 Atomic Electronic Configurations and Periodicity 8-1. Substances that are weakly attracted to a magnetic field but lose their magnetism when removed from
Formation of solids from solutions and melts
 Formation of solids from solutions and melts Solids from a liquid phase. 1. The liquid has the same composition as the solid. Formed from the melt without any chemical transformation. Crystallization and
Crystal Structure Determination I
 Crystal Structure Determination I Dr. Falak Sher Pakistan Institute of Engineering and Applied Sciences National Workshop on Crystal Structure Determination using Powder XRD, organized by the Khwarzimic
Energy band diagrams. Single atom. Crystal. Excited electrons cannot move. Excited electrons can move (free electrons)
") Energy band diagrams In the atoms, the larger the radius, the higher the electron potential energy Hence, electron position can be described either by radius or by its potential energy In the semiconductor
Energy band diagrams In the atoms, the larger the radius, the higher the electron potential energy Hence, electron position can be described either by radius or by its potential energy In the semiconductor
h e l p s y o u C O N T R O L
 contamination analysis for compound semiconductors ANALYTICAL SERVICES B u r i e d d e f e c t s, E v a n s A n a l y t i c a l g r o u p h e l p s y o u C O N T R O L C O N T A M I N A T I O N Contamination
Sputtering by Particle Bombardment I
 Sputtering by Particle Bombardment I Physical Sputtering of Single-Element Solids Edited by R. Behrisch With Contributions by H. H. Andersen H. L. Bay R. Behrisch M. T. Robinson H. E. Roosendaal P. Sigmund
Matter, Materials, Crystal Structure and Bonding. Chris J. Pickard
 Matter, Materials, Crystal Structure and Bonding Chris J. Pickard Why should a theorist care? Where the atoms are determines what they do Where the atoms can be determines what we can do Overview of Structure
3 - Atomic Absorption Spectroscopy
 3 - Atomic Absorption Spectroscopy Introduction Atomic-absorption (AA) spectroscopy uses the absorption of light to measure the concentration of gas-phase atoms. Since samples are usually liquids or solids,
Physics Notes Class 11 CHAPTER 6 WORK, ENERGY AND POWER
 1 P a g e Work Physics Notes Class 11 CHAPTER 6 WORK, ENERGY AND POWER When a force acts on an object and the object actually moves in the direction of force, then the work is said to be done by the force.
The accurate calibration of all detectors is crucial for the subsequent data
 Chapter 4 Calibration The accurate calibration of all detectors is crucial for the subsequent data analysis. The stability of the gain and offset for energy and time calibration of all detectors involved
Arrangement of Electrons in Atoms
 CHAPTER 4 PRE-TEST Arrangement of Electrons in Atoms In the space provided, write the letter of the term that best completes each sentence or best answers each question. 1. Which of the following orbital
Raman Scattering Theory David W. Hahn Department of Mechanical and Aerospace Engineering University of Florida (dwhahn@ufl.edu)
") Introduction Raman Scattering Theory David W. Hahn Department of Mechanical and Aerospace Engineering University of Florida (dwhahn@ufl.edu) The scattering of light may be thought of as the redirection
Introduction Raman Scattering Theory David W. Hahn Department of Mechanical and Aerospace Engineering University of Florida (dwhahn@ufl.edu) The scattering of light may be thought of as the redirection
Measurement of Charge-to-Mass (e/m) Ratio for the Electron
 Ratio for the Electron") Measurement of Charge-to-Mass (e/m) Ratio for the Electron Experiment objectives: measure the ratio of the electron charge-to-mass ratio e/m by studying the electron trajectories in a uniform magnetic
Measurement of Charge-to-Mass (e/m) Ratio for the Electron Experiment objectives: measure the ratio of the electron charge-to-mass ratio e/m by studying the electron trajectories in a uniform magnetic
Near-field scanning optical microscopy (SNOM)
") Adviser: dr. Maja Remškar Institut Jožef Stefan January 2010 1 2 3 4 5 6 Fluorescence Raman and surface enhanced Raman 7 Conventional optical microscopy-limited resolution Two broad classes of techniques
Adviser: dr. Maja Remškar Institut Jožef Stefan January 2010 1 2 3 4 5 6 Fluorescence Raman and surface enhanced Raman 7 Conventional optical microscopy-limited resolution Two broad classes of techniques
16th International Toki Conference on Advanced Imaging and Plasma Diagnostics
 16th International Toki Conference on Advanced Imaging and Plasma Diagnostics Temperature Diagnostics for Field-Reversed Configuration Plasmas on the Pulsed High Density (PHD) Experiment Hiroshi Gota,
Energy Dispersive Spectroscopy on the SEM: A Primer
 Energy Dispersive Spectroscopy on the SEM: A Primer Bob Hafner This primer is intended as background for the EDS Analysis on the SEM course offered by the University of Minnesota s Characterization Facility.
Using the Bruker Tracer III-SD Handheld X-Ray Fluorescence Spectrometer using PC Software for Data Collection
 Using the Bruker Tracer III-SD Handheld X-Ray Fluorescence Spectrometer using PC Software for Data Collection Scott A Speakman, Ph.D Center for Materials Science and Engineering at MIT speakman@mit.edu
Edited by. C'unter. and David S. Moore. Gauglitz. Handbook of Spectroscopy. Second, Enlarged Edition. Volume 4. WlLEY-VCH. VerlagCmbH & Co.
 Edited by C'unter Gauglitz and David S. Moore Handbook of Spectroscopy Second, Enlarged Edition Volume 4 WlLEY-VCH VerlagCmbH & Co. KGaA IX Volume 4 Section XII Applications 6: Spectroscopy at Surfaces
WAVELENGTH OF LIGHT - DIFFRACTION GRATING
 PURPOSE In this experiment we will use the diffraction grating and the spectrometer to measure wavelengths in the mercury spectrum. THEORY A diffraction grating is essentially a series of parallel equidistant
Sample Exercise 12.1 Calculating Packing Efficiency
 Sample Exercise 12.1 Calculating Packing Efficiency It is not possible to pack spheres together without leaving some void spaces between the spheres. Packing efficiency is the fraction of space in a crystal
Introduction to Energy Dispersive X-ray Spectrometry (EDS)
") Introduction to Energy Dispersive X-ray Spectrometry (EDS) 1. Introduction 1.1 Principles of the technique EDS makes use of the X-ray spectrum emitted by a solid sample bombarded with a focused beam of
Introduction to Energy Dispersive X-ray Spectrometry (EDS) 1. Introduction 1.1 Principles of the technique EDS makes use of the X-ray spectrum emitted by a solid sample bombarded with a focused beam of
EDXRF of Used Automotive Catalytic Converters
 EDXRF of Used Automotive Catalytic Converters Energy Dispersive X-Ray Fluorescence (EDXRF) is a very powerful technique for measuring the concentration of elements in a sample. It is fast, nondestructive,
Laue lens for Nuclear Medicine
 Laue lens for Nuclear Medicine PhD in Physics Gianfranco Paternò Ferrara, 6-11-013 Supervisor: prof. Vincenzo Guidi Sensors and Semiconductors Lab, Department of Physics and Earth Science, University of
Al 2 O 3, Its Different Molecular Structures, Atomic Layer Deposition, and Dielectrics
 Al 2 O 3, Its Different Molecular Structures, Atomic Layer Deposition, and Dielectrics Mark Imus Douglas Sisk, Ph.D., Mentor Marian High School RET Program University of Notre Dame Project Proposal Tunneling
The study of structural and optical properties of TiO 2 :Tb thin films
 Optica Applicata, Vol. XXXVII, No. 4, 2007 The study of structural and optical properties of TiO 2 :Tb thin films AGNIESZKA BORKOWSKA, JAROSLAW DOMARADZKI, DANUTA KACZMAREK, DAMIAN WOJCIESZAK Faculty of
The Basics of Scanning Electron Microscopy
 The Basics of Scanning Electron Microscopy The small scanning electron microscope is easy to use because almost every variable is pre-set: the acceleration voltage is always 15kV, it has only a single
Gamma Ray Detection at RIA
 Gamma Ray Detection at RIA Summary Report: Physics & Functional Requirements Cyrus Baktash Physics goals Experimental tools: Techniques & Reactions Functional Requirements Physics Questions (Discussed
View of ΣIGMA TM (Ref. 1)
") Overview of the FESEM system 1. Electron optical column 2. Specimen chamber 3. EDS detector [Electron Dispersive Spectroscopy] 4. Monitors 5. BSD (Back scatter detector) 6. Personal Computer 7. ON/STANDBY/OFF
Overview of the FESEM system 1. Electron optical column 2. Specimen chamber 3. EDS detector [Electron Dispersive Spectroscopy] 4. Monitors 5. BSD (Back scatter detector) 6. Personal Computer 7. ON/STANDBY/OFF
CHAPTER 9 ATOMIC STRUCTURE AND THE PERIODIC LAW
 CHAPTER 9 ATOMIC STRUCTURE AND THE PERIODIC LAW Quantum mechanics can account for the periodic structure of the elements, by any measure a major conceptual accomplishment for any theory. Although accurate
Fundamentals of modern UV-visible spectroscopy. Presentation Materials
 Fundamentals of modern UV-visible spectroscopy Presentation Materials The Electromagnetic Spectrum E = hν ν = c / λ 1 Electronic Transitions in Formaldehyde 2 Electronic Transitions and Spectra of Atoms
B) atomic number C) both the solid and the liquid phase D) Au C) Sn, Si, C A) metal C) O, S, Se C) In D) tin D) methane D) bismuth B) Group 2 metal
 atomic number C) both the solid and the liquid phase D) Au C) Sn, Si, C A) metal C) O, S, Se C) In D) tin D) methane D) bismuth B) Group 2 metal") 1. The elements on the Periodic Table are arranged in order of increasing A) atomic mass B) atomic number C) molar mass D) oxidation number 2. Which list of elements consists of a metal, a metalloid, and
1. The elements on the Periodic Table are arranged in order of increasing A) atomic mass B) atomic number C) molar mass D) oxidation number 2. Which list of elements consists of a metal, a metalloid, and
Time out states and transitions
 Time out states and transitions Spectroscopy transitions between energy states of a molecule excited by absorption or emission of a photon hn = DE = E i - E f Energy levels due to interactions between
High Resolution Spatial Electroluminescence Imaging of Photovoltaic Modules
 High Resolution Spatial Electroluminescence Imaging of Photovoltaic Modules Abstract J.L. Crozier, E.E. van Dyk, F.J. Vorster Nelson Mandela Metropolitan University Electroluminescence (EL) is a useful
2 Absorbing Solar Energy
 2 Absorbing Solar Energy 2.1 Air Mass and the Solar Spectrum Now that we have introduced the solar cell, it is time to introduce the source of the energy the sun. The sun has many properties that could
Lecture 3: Optical Properties of Bulk and Nano. 5 nm
 Lecture 3: Optical Properties of Bulk and Nano 5 nm First H/W#1 is due Sept. 10 Course Info The Previous Lecture Origin frequency dependence of χ in real materials Lorentz model (harmonic oscillator model)
University of California at Santa Cruz Electrical Engineering Department EE-145L: Properties of Materials Laboratory
 University of California at Santa Cruz Electrical Engineering Department EE-145L: Properties of Materials Laboratory Lab 8: Optical Absorption Spring 2002 Yan Zhang and Ali Shakouri, 05/22/2002 (Based
Production of X-rays. Radiation Safety Training for Analytical X-Ray Devices Module 9
 Module 9 This module presents information on what X-rays are and how they are produced. Introduction Module 9, Page 2 X-rays are a type of electromagnetic radiation. Other types of electromagnetic radiation
Activitity (of a radioisotope): The number of nuclei in a sample undergoing radioactive decay in each second. It is commonly expressed in curies
: The number of nuclei in a sample undergoing radioactive decay in each second. It is commonly expressed in curies") Activitity (of a radioisotope): The number of nuclei in a sample undergoing radioactive decay in each second. It is commonly expressed in curies (Ci), where 1 Ci = 3.7x10 10 disintegrations per second.
Activitity (of a radioisotope): The number of nuclei in a sample undergoing radioactive decay in each second. It is commonly expressed in curies (Ci), where 1 Ci = 3.7x10 10 disintegrations per second.
Experiment #5: Qualitative Absorption Spectroscopy
 Experiment #5: Qualitative Absorption Spectroscopy One of the most important areas in the field of analytical chemistry is that of spectroscopy. In general terms, spectroscopy deals with the interactions
Chapter Outline Dislocations and Strengthening Mechanisms
 Chapter Outline Dislocations and Strengthening Mechanisms What is happening in material during plastic deformation? Dislocations and Plastic Deformation Motion of dislocations in response to stress Slip
Chapter 5: Diffusion. 5.1 Steady-State Diffusion
 : Diffusion Diffusion: the movement of particles in a solid from an area of high concentration to an area of low concentration, resulting in the uniform distribution of the substance Diffusion is process
X-ray Photoelectron Spectroscopy
 X-ray Photoelectron Spectroscopy Roger Smart, Stewart McIntyre, Mike Bancroft, Igor Bello & Friends Department of Physics and Materials Science City University of Hong Kong Surface Science Western, UWO
Laboratory #3 Guide: Optical and Electrical Properties of Transparent Conductors -- September 23, 2014
 Laboratory #3 Guide: Optical and Electrical Properties of Transparent Conductors -- September 23, 2014 Introduction Following our previous lab exercises, you now have the skills and understanding to control
3) Of the following, radiation has the shortest wavelength. A) X-ray B) radio C) microwave D) ultraviolet E) infrared Answer: A
 Of the following, radiation has the shortest wavelength. A) X-ray B) radio C) microwave D) ultraviolet E) infrared Answer: A") 1) Which one of the following is correct? A) ν + λ = c B) ν λ = c C) ν = cλ D) λ = c ν E) νλ = c Answer: E 2) The wavelength of light emitted from a traffic light having a frequency of 5.75 1014 Hz is.
1) Which one of the following is correct? A) ν + λ = c B) ν λ = c C) ν = cλ D) λ = c ν E) νλ = c Answer: E 2) The wavelength of light emitted from a traffic light having a frequency of 5.75 1014 Hz is.
Name period AP chemistry Unit 2 worksheet Practice problems
 Name period AP chemistry Unit 2 worksheet Practice problems 1. What are the SI units for a. Wavelength of light b. frequency of light c. speed of light Meter hertz (s -1 ) m s -1 (m/s) 2. T/F (correct
Tutorial 4.6 Gamma Spectrum Analysis
 Tutorial 4.6 Gamma Spectrum Analysis Slide 1. Gamma Spectrum Analysis In this module, we will apply the concepts that were discussed in Tutorial 4.1, Interactions of Radiation with Matter. Slide 2. Learning
Electronic structure and magnetism of selected materials
 Electronic structure and magnetism of selected materials by Chiuzbăian Gheorghe Sorin Thesis presented to the Department of Physics Osnabrück University Osnabrück May, 2003 Thesis advisor: apl. Prof. Dr.
Graduate Student Presentations
 Graduate Student Presentations Dang, Huong Chip packaging March 27 Call, Nathan Thin film transistors/ liquid crystal displays April 4 Feldman, Ari Optical computing April 11 Guerassio, Ian Self-assembly