The Changing Gender Balance: An Overview
|
|
|
- Alicia Howard
- 8 years ago
- Views:
Transcription
1 Fewer Men on Campus A Puzzle for Liberal Arts Colleges and Universities November 15-16, 1999 Goucher College Baltimore, Maryland Thomas G. Mortenson Senior Scholar Center for the Study of Opportunity in Higher Education Council for Opportunity in Education 1025 Vermont Ave NW, Suite 900 Washington, DC Phone: (202) Higher Education Policy Analyst Postsecondary Education OPPORTUNITY P.O. Box 415 Oskaloosa, IA Phone: (515) Fax: (515) Internet: tom@postsecondary.org Postsecondary Education OPPORTUNITY 1
 673-3401 Fax: (515) 673-3411 Internet: tom@postsecondary.")
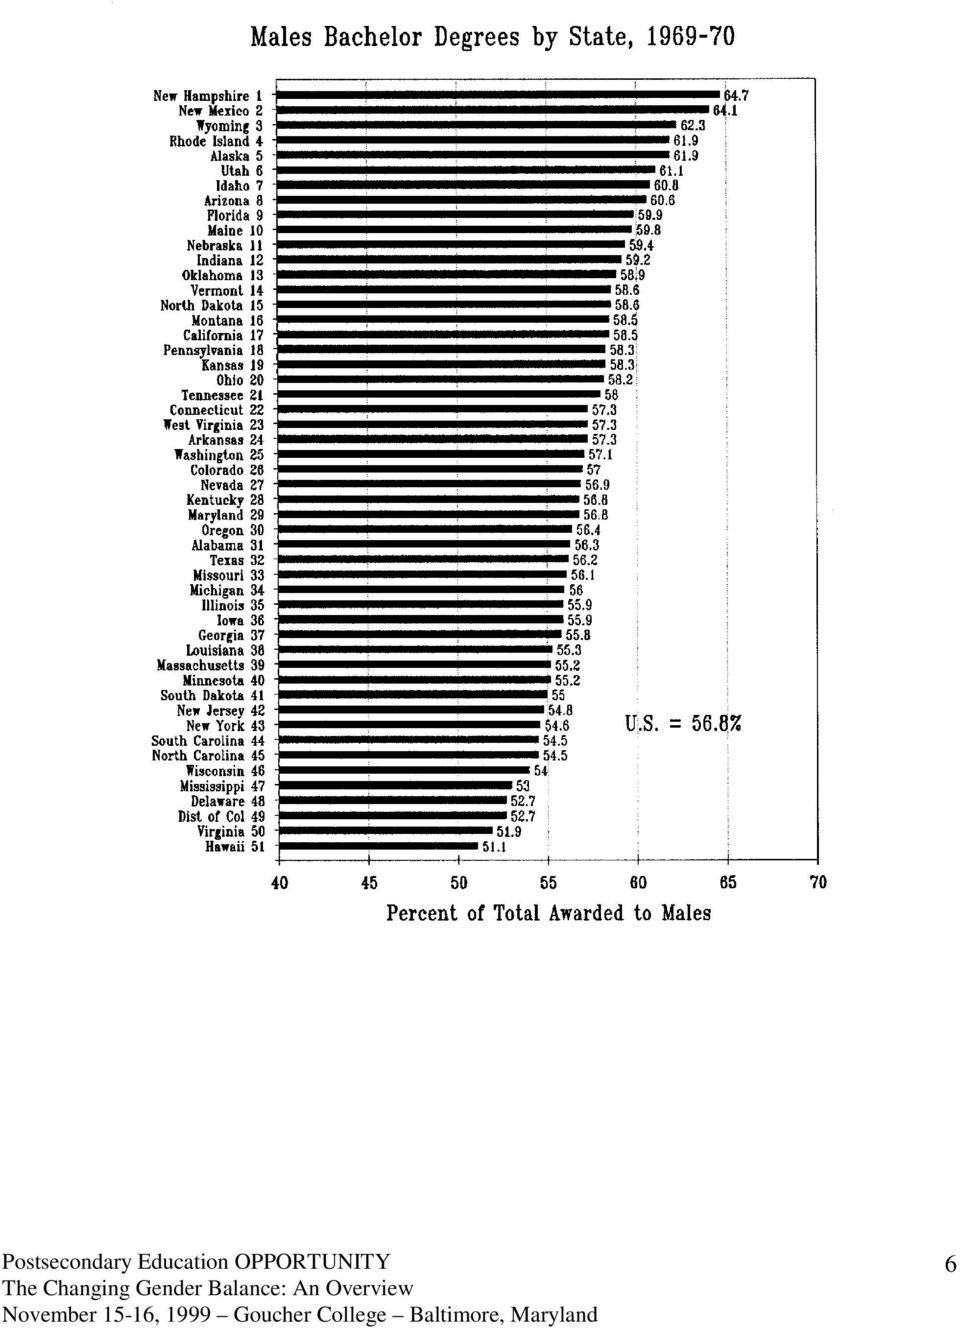
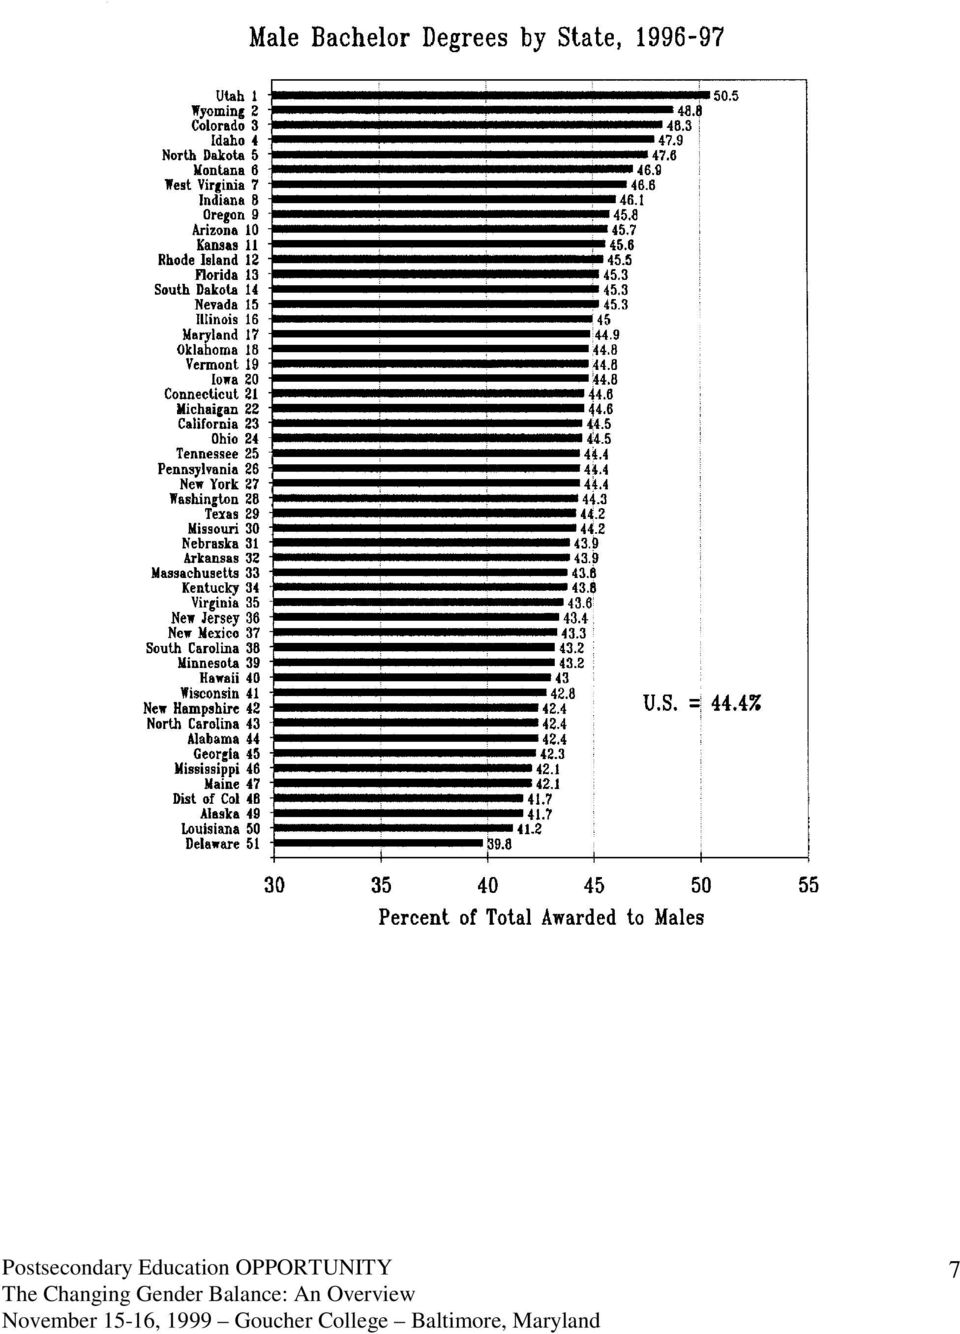
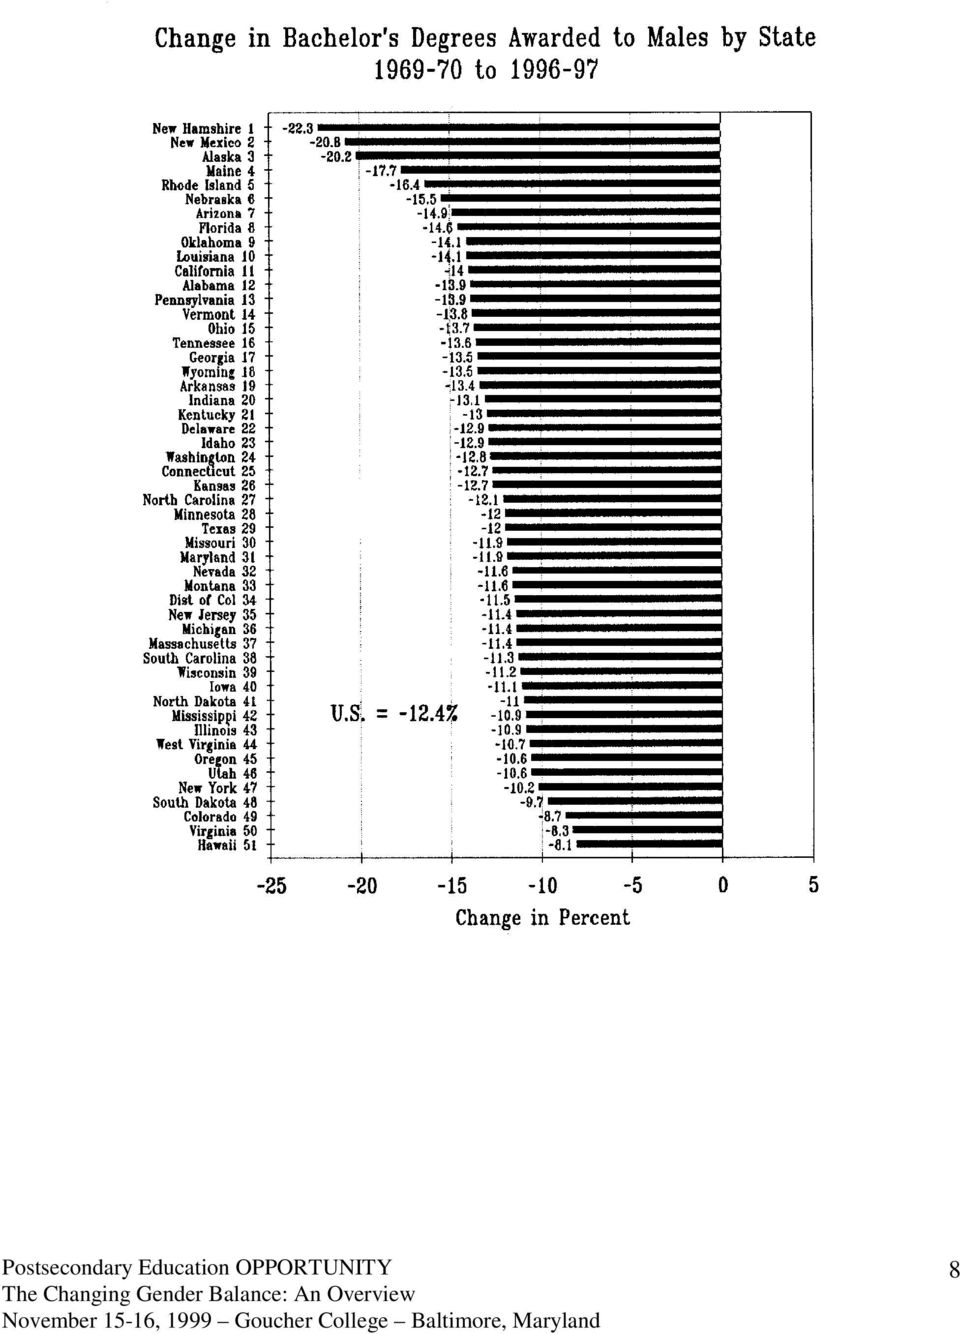
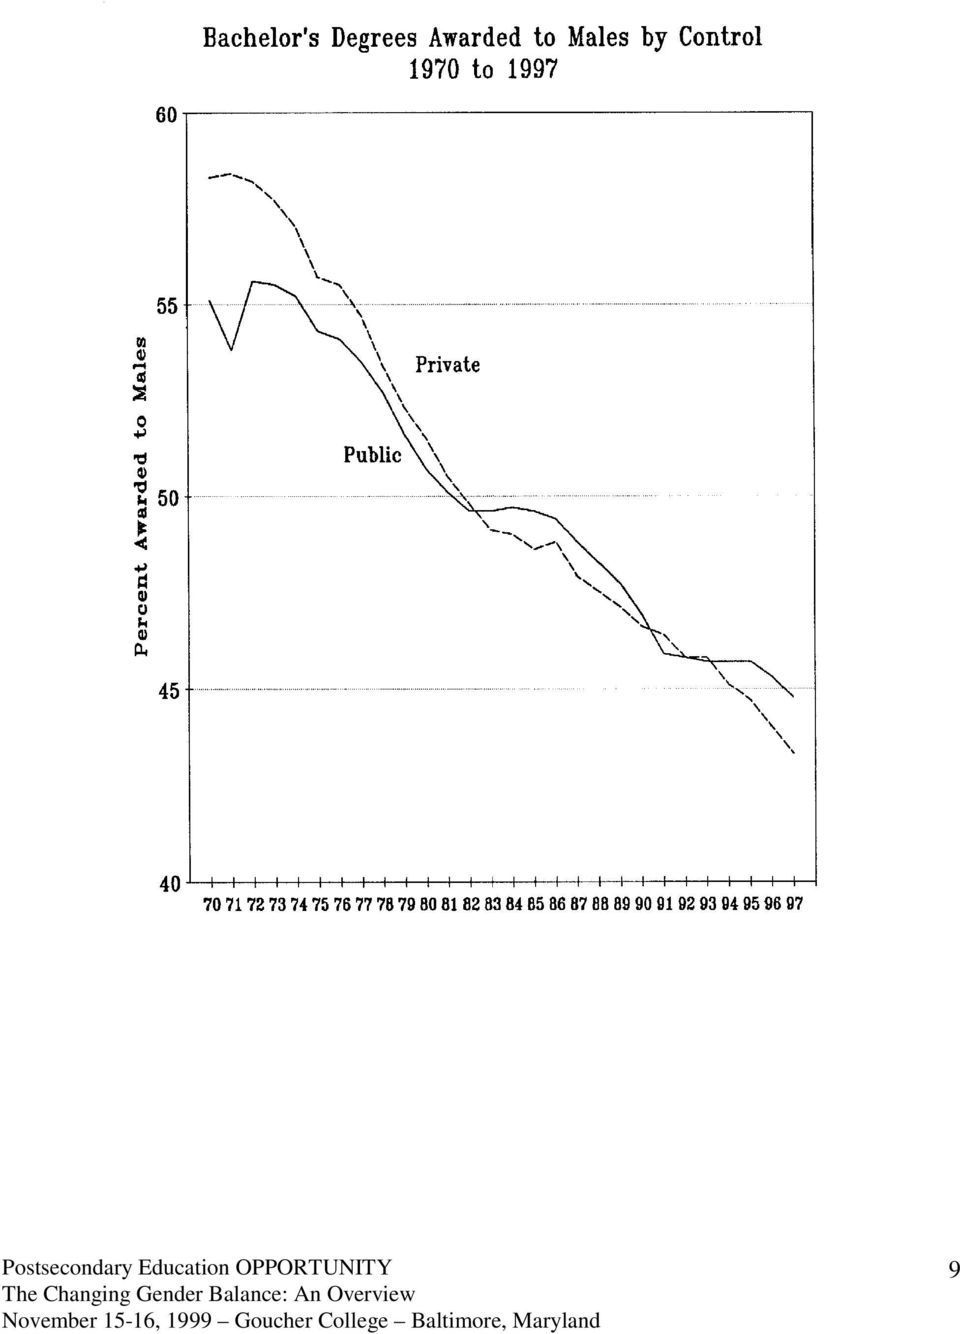
2 My objective: To start a national dialogue on the future of the male gender I. Introduction. A. I am especially grateful to President Judy Mohraz and to Debra Rubino of Goucher College for organizing this conference. It represents a clear breakthrough in awareness of the growing gender imbalance in American higher education. It is especially fitting that it be held at Goucher, a former women's college, that decided to become co-ed and has found it difficult to reach gender parity in its enrollments. B. I am a higher education policy analyst who has been studying the progress of women in higher education since About 1990 I began to notice that while women had made steady and substantial progress throughout the education system, males had not. 2. In March of 1992, when I began publishing my monthly research letter, Postsecondary Education OPPORTUNITY, the very first headline began: Equity of Higher Education Opportunity: Women Reached Equity with Men in In September 1995 I first summarized the issue in OPPORTUNITY under "What's Wrong with the Guys?" I have continued to analyze and report on these data in many subsequent issues of OPPORTUNITY. 4. More recently I have begun to speculate as to causes, such as in the August 1999 issue of The College Board Review. II. Distribution of bachelor degree awards. Note that 51.3 percent of the U.S. population up to about age 30 is male. A. Long-term trends, 1870 to 1997 (see chart 1) to 1940: Decline in the proportion of degrees awarded to males from 85.3 percent in 1870 to 58.7 percent by to 1970: 30 year disruption beginning with World War II to 1997: Decline resumes, from 56.9 percent in 1970 to 44.4 percent by B. States: Since 1970 shift has occurred in all 50 states (see charts 2-4). 1. In 1970 a majority of bachelor's degrees were awarded to males in all 50 states plus DC. 2. By 1997 a majority went to males in only one state, Utah. Next five states are all western states too, often Mormon like Utah. 3. Gender shift between 1970 and 1997 greatest in New Hampshire, New Mexico and Alaska. Gender shift least in Hawaii, Virginia, and Colorado. C. Control: Gender shift has occurred in both public and private colleges between 1970 and 1997 (see chart 5). 1. Public: from 55.1 to 44.8 percent. Crossover occurred in Postsecondary Education OPPORTUNITY 2

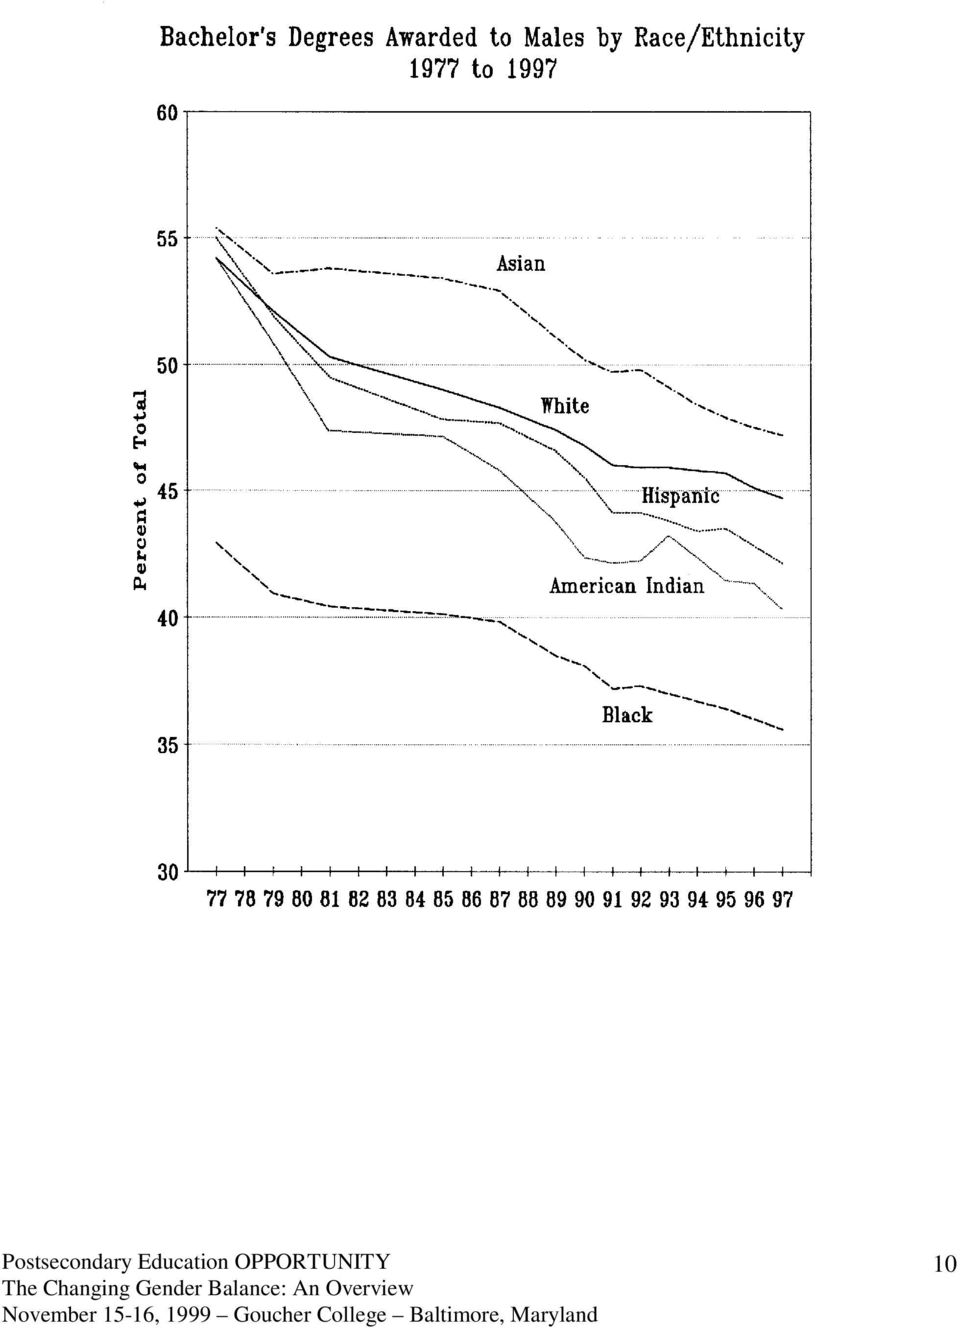
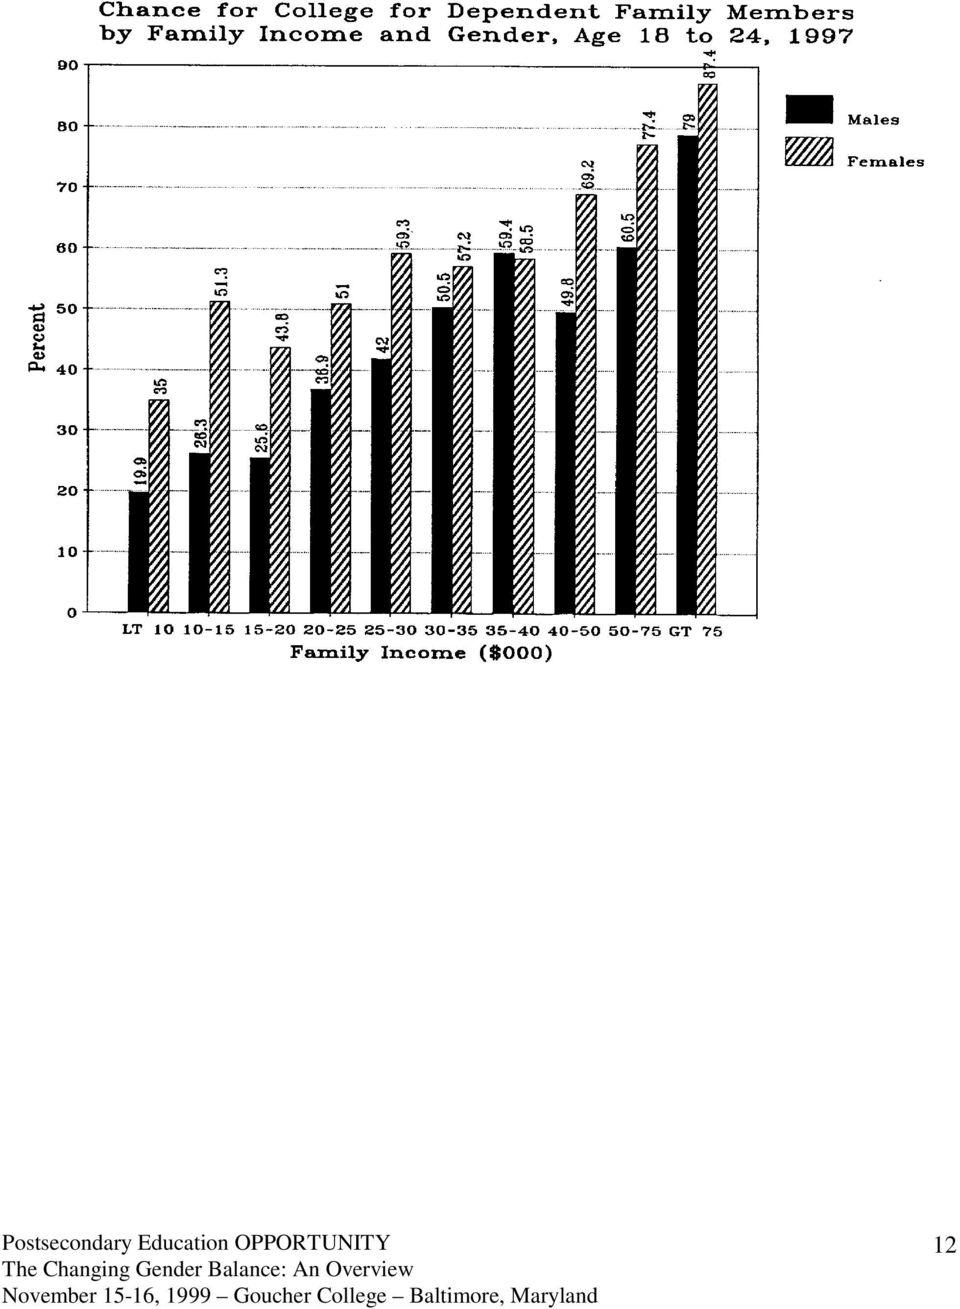
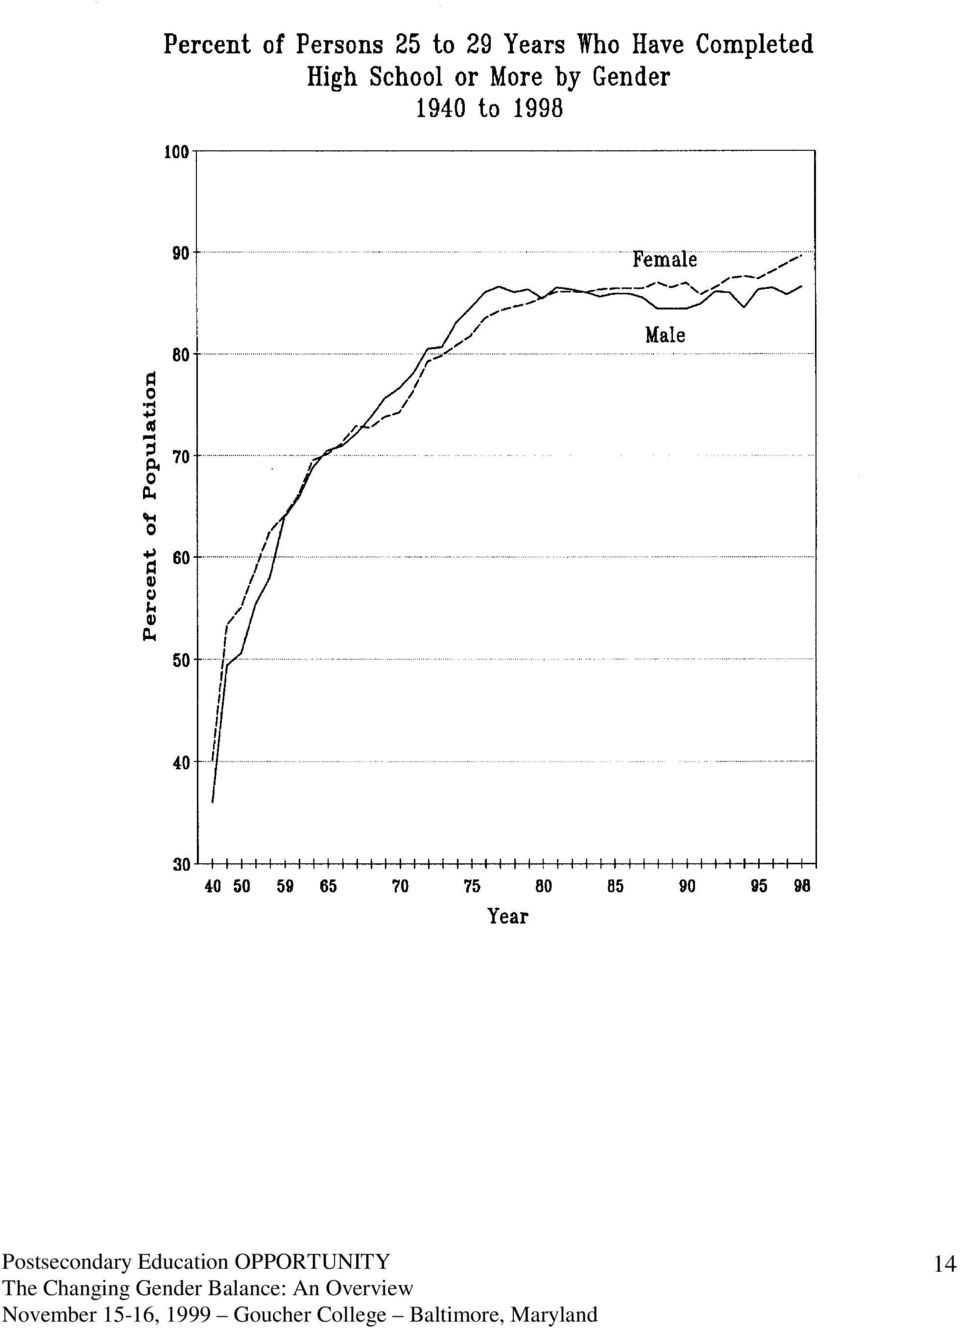
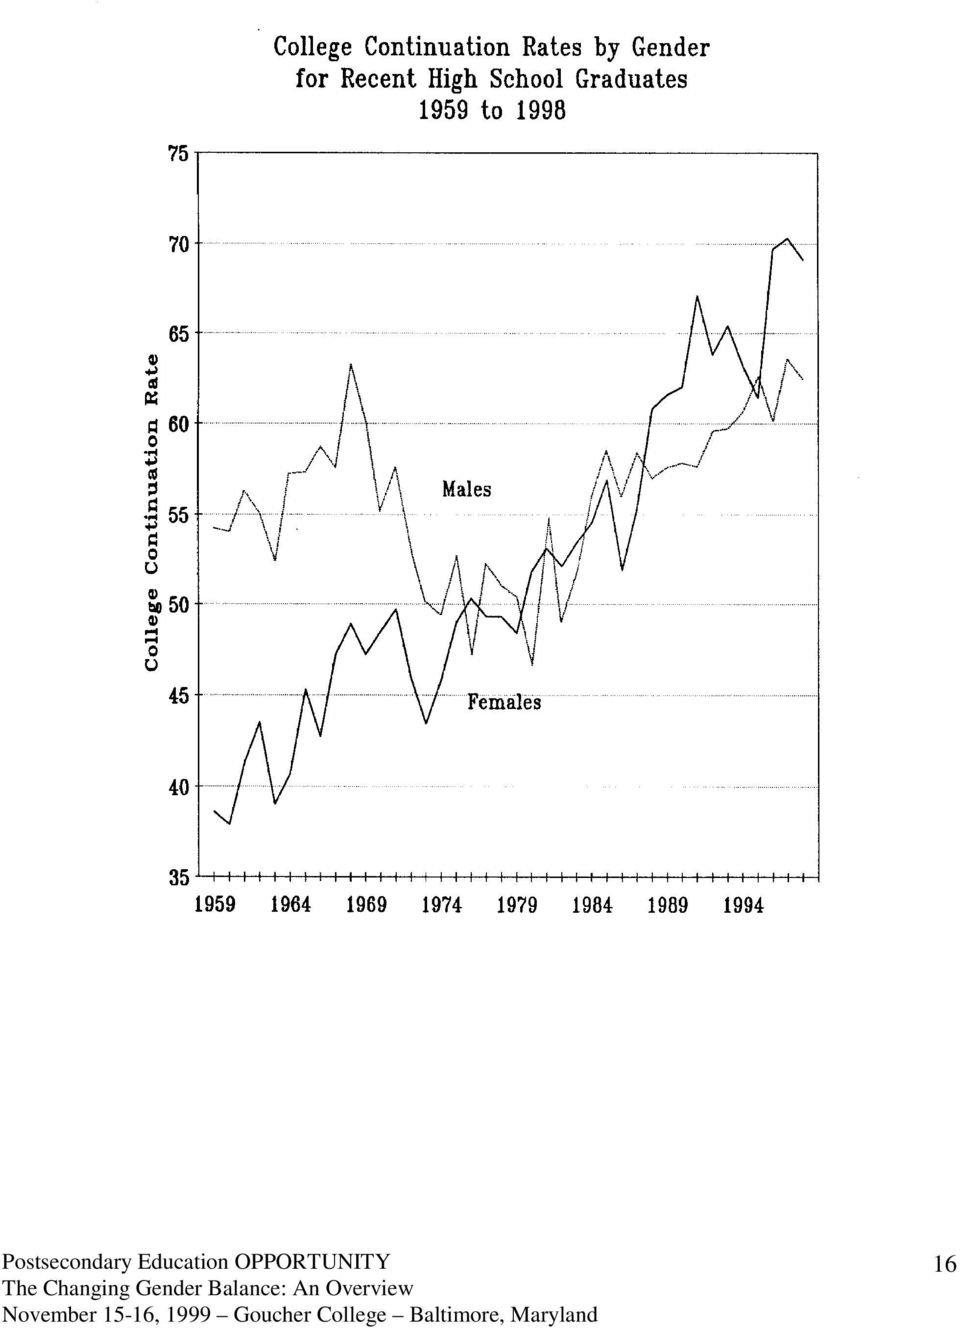
3 2. Private: from 58.3 to 43.3 percent. Crossover occurred in D. Race/ethnicity: Data are available from 1977 to 1997 (see chart 6). 1. Non-Hispanic whites: 54.2 to 44.7 percent. Crossover occurred about Black: 42.9 to 35.6 percent. 3. Hispanic: 55.0 to 42.1 percent. Crossover occurred about Asian: 55.4 to 47.2 percent. Crossover occurred in last group. 5. American Indian: 54.2 to 40.3 percent. Crossover occurred about E. Field of study. Male shares of bachelors degrees has shrunk sharply in all fields of study that were predominantly male in 1970 (see chart 7). 1. Business: from 91.3 percent male in 1970 to 51.6 percent by Engineering: in the bootcamp of higher education, from 98.6 percent in 1970 to 81.8 percent by Psychology: from 56.6 percent male in 1970 to 26.1 percent by F. Family income. Chance for college (product of high school graduation rate and college participation rates for those who graduate from high school) is less for males than females at all family income levels, but greatest for those from family incomes below about $20,000 per year (see chart 8). G. Parental educational attainment. Chance for college is less for males than females at all levels of parental educational attainment, but this difference is greatest for those from families with lowest levels of parental education (see chart 9). III. IV. Performance in the education pipeline. This describes the rates at which males and females move through the education pipeline over time. A. High school graduation. Proportion of population 25 to 29 years who have completed high school, 1940 to 1998 (see charts 10 and 11) : males 86.6 percent, females 89.6 percent. 2. Only between late 1960s (Vietnam) and early 1980s did males graduate from high school at higher rates than did women. B. College continuation for high school graduates. Women high school graduates have made simply stunning gains compared to men in the rates at which they pursue collegiate study directly after high school (see chart 12 and 13). 1. Males: from 54.2 to 62.4 percent, between 1959 and Gain: 8.2 percent. 2. Females: from 38.6 to 69.1 percent. Gain: 30.5 percent. From 15.6 percent behind males in 1959 to 6.7 percent ahead by C. Bachelor's degree attainment. The proportion of women ages 25 to 29 years with a bachelor's degree surpassed the male rate in 1991 and is now 3.4 percent ahead of males (see charts 14 and 15). Comments on data and conclusions. A. The canary in the coal mine. These data reflect what is occurring differently in the lives of boys and girls growing up for decades before they get to higher education. They are symptomatic of far larger changes that are occurring in the larger worlds. Postsecondary Education OPPORTUNITY 3
. 1. Business: from 91.3 percent male in 1970 to 51.6 percent by 1997. 2.")
4 B. Key findings from related research: 1. There is a significant decline in the presence of adult males in the lives of boys growing up. This occurs in their families (single parenthood, divorce) and in their schools, particularly elementary grades. Boys are losing adult male role models in key formative years. 2. Adult males are disengaging from traditional labor force, family and civic roles. 3. There are global changes afoot that appear to be affecting men and women differently. These changes are occurring in the labor force in a shift from goods-producing to private service sector jobs that favor women over men. These changes are also occurring as the population of the U.S. urbanizes. C. Higher education should search beyond symptomatic remedies for the growing gender imbalance on college campuses, and apply its superb intellectual horsepower to seeking causes and designing responses targeted on causes, not symptoms. D. Someday we may come to point to Goucher99 as the time and place when the issue emerged on the radar screen of public interest and policy. I commend Goucher for its vision. Postsecondary Education OPPORTUNITY 4

5 5

6 6
7 7
8 8
9 9
10 10
11 11

12 12
13 13

14 14
15 15

16 16
17 17

18 18

19 19

College Enrollment by Age 1950 to 2000
 College Enrollment by Age 1950 to 2000 Colleges compete with the labor market and other adult endeavors for the time and attention of young people in a hurry to grow up. Gradually, young adults drift away
Undergraduate Degree Completion by Age 25 to 29 for Those Who Enter College 1947 to 2002
 Undergraduate Degree Completion by Age 25 to 29 for Those Who Enter College 1947 to 2002 About half of those who start higher education have completed a bachelor's degree by the ages of 25 to 29 years.
Doctors 24,728 20,176 44,904 55.1% 44.9% First-Prof 42,862 36,845 79,707 53.8% 46.2%
 Earned Degrees Conferred by Gender 1870 to 2001 The growing gender imbalance in higher education is most apparent at college graduation. Throughout the education pipeline girls and young women are consistently
Parental Educational Attainment and Higher Educational Opportunity
 Parental Educational Attainment and Higher Educational Opportunity Federal higher education policy recognizes certain student characteristics as limiting higher educational opportunity, and has created
Women See Value and Benefits of College; Men Lag on Both Fronts, Survey Finds
 Social & Demographic Trends Wednesday, August 17, 2011 Women See Value and Benefits of College; Men Lag on Both Fronts, Survey Finds Paul Taylor, Director Kim Parker, Associate Director Richard Fry, Senior
UWEP Utah Women and Education Project
 Research and Policy Brief UWEP Utah Women and Education Project May 25, 2010 UWEP 2010-204 Women and Higher Education in Utah: A Glimpse at the Past and Present According to Lumina Foundation researchers,
THE FUTURE OF HIGHER EDUCATION IN TEXAS
 THE FUTURE OF HIGHER EDUCATION IN TEXAS WOODY L. HUNT, CHAIRMAN HIGHER EDUCATION STRATEGIC PLANNING COMMITTEE September 17, 2015 1 Let s talk about higher education in Texas and the educational competitiveness
Young Black America Part Four: The Wrong Way to Close the Gender Wage Gap
 Issue Brief August 2015 Young Black America Part Four: The Wrong Way to Close the Gender Wage Gap By Cherrie Bucknor* Young blacks in America have had significant improvements in educational attainment
COLLEGE ENROLLMENT AND WORK ACTIVITY OF 2014 HIGH SCHOOL GRADUATES
 For release 10:00 a.m. (EDT) Thursday, April 16, 2015 USDL-15-0608 Technical information: (202) 691-6378 cpsinfo@bls.gov www.bls.gov/cps Media contact: (202) 691-5902 PressOffice@bls.gov COLLEGE ENROLLMENT
College Enrollment Hits All-Time High, Fueled by Community College Surge
 Enrollment Hits All-Time High, Fueled by Community Surge FOR RELEASE: OCTOBER 29, 2009 Paul Taylor, Project Director Richard Fry, Senior Researcher Wendy Wang, Research Associate Daniel Dockterman, Research
Educational Attainment of Veterans: 2000 to 2009
 Educational Attainment of Veterans: to 9 January 11 NCVAS National Center for Veterans Analysis and Statistics Data Source and Methods Data for this analysis come from years of the Current Population Survey
University System of Georgia Enrollment Trends and Projections to 2018
 University System of Georgia Enrollment Trends and Projections to 2018 Introduction: Projections of USG Headcount Enrollment Enrollment projections use past trends and information on other variables to
Enhancing Educational Attainment in Arizona
 Enhancing Educational Attainment in Arizona Status Report on the 2002 Changing Directions Policy of the Arizona Board of Regents at Arizona State University February 2006 Chance for College in the U.S.
Over-Age, Under-Age, and On-Time Students in Primary School, Uganda
 Primary School Net and Gross Attendance Rates, Uganda More than three quarters of primary school age children in Uganda attend school and gender parity in attendance has been achieved. of children ages
LICENSED SOCIAL WORKERS IN THE UNITED STATES, 2004. Chapter 2 of 4. Demographics
 LICENSED SOCIAL WORKERS IN THE UNITED STATES, 2004 Chapter 2 of 4 Demographics Prepared by Center for Health Workforce Studies School of Public Health, University at Albany Rensselaer, NY and NASW Center
During the past century,
 Academic preparation is still a core function of community colleges. But today their mission is more comprehensive, thanks to a gradual shift toward vocational education, job training, and programs catering
Presentation for the Leading the Way Compact Forum West Virginia Higher Education Commission Laura W. Perna lperna@gse.upenn.
 Promoting College Access For All Students Presentation for the Leading the Way Compact Forum West Virginia Higher Education Commission Laura W. Perna lperna@gse.upenn.edu @lauraperna1 March 31, 2014 Improving
Educational Attainment in the United States: 2003
 Educational Attainment in the United States: 2003 Population Characteristics Issued June 2004 P20-550 The population in the United States is becoming more educated, but significant differences in educational
A New Measure of Educational Success in Texas. Tracking the Success of 8th Graders into and through College
 A New Measure of Educational Success in Texas Tracking the Success of 8th Graders into and through College National Center for Management Systems (NCHEMS) Contents Introduction 1 The Challenge 2 Purpose
BLACK MALE COLLEGE EXPLORERS PROGRAM Investing in the Future, for the Future
 BLACK MALE COLLEGE EXPLORERS PROGRAM Investing in the Future, for the Future Presented by Kareem J. Coney, Coordinator, Community Outreach and Retention/Director Black Male College Explorers Program Shawn
In 2013, 75.9 million workers age 16 and older in the. Characteristics of Minimum Wage Workers, 2013. Highlights CONTENTS
 U.S. BUREAU OF LABOR STATISTICS M A R C H 2 0 1 4 R E P O R T 1 0 4 8 Characteristics of Minimum Wage Workers, 2013 below the figure of 13.4 percent in 1979, when data were first collected on a regular
Census Data on Uninsured Women and Children September 2009
 March of Dimes Foundation Office of Government Affairs 1146 19 th Street, NW, 6 th Floor Washington, DC 20036 Telephone (202) 659-1800 Fax (202) 296-2964 marchofdimes.com nacersano.org Census Data on Uninsured
THE EDUCATIONAL PROGRESS OF BLACK STUDENTS
 NATIONAL CENTER FOR EDUCATION STATISTICS Findings from THE CONDITION OF EDUCATION 1994 NO. 2 THE EDUCATIONAL PROGRESS OF BLACK STUDENTS U.S. Department of Education Office of Educational Research and Improvement
Population, by Race and Ethnicity: 2000 and 2010
 Table 1 Population, by Race and Ethnicity: 2000 and 2010 Universe: 2000 and 2010 resident population 2010 population 2000 population Percent, 2010 Percent, 2000 Hispanic 50,729,570 35,204,480 16.4 12.5
STATE DATA CENTER. District of Columbia MONTHLY BRIEF
 District of Columbia STATE DATA CENTER MONTHLY BRIEF N o v e m b e r 2 0 1 2 District Residents Health Insurance Coverage 2000-2010 By Minwuyelet Azimeraw Joy Phillips, Ph.D. This report is based on data
Population, by Race and Ethnicity: 2000 and 2011
 Table 1 Population, by Race and Ethnicity: 2000 and 2011 Universe: 2000 and 2011 resident population 2011 population 2000 population Percent, 2011 Percent, 2000 Hispanic 51,927,158 35,204,480 16.7 12.5
Minorities in Higher Education. 2010 2011 Supplement. Young M. Kim
 Minorities in Higher Education 2010 Twenty-FOURTH Status Report 2011 Supplement Young M. Kim Minorities in Higher Education 2010 Twenty-FOURTH Status Report 2011 Supplement Young M. Kim PROJECT COORDINATOR:
CENTER FOR LABOR MARKET STUDIES
 The Complete Breakdown in the High Schoolto Work Transition of Young, Non College Enrolled High School Graduates in the U.S.; The Need for an Immediate National Policy Response Prepared by: Andrew Sum
Bowen, Chingos & McPherson, Crossing the Finish Line
 1 Bowen, W. G., Chingos, M. M., and McPherson, M. S. (2009). Crossing the Finish Line: Completing College at America s Public Universities. Princeton, N.J.: Princeton University Press. The authors begin
Changes in Self-Employment: 2010 to 2011
 Changes in Self-Employment: 2010 to 2011 American Community Survey Briefs By China Layne Issued January 2013 ACSBR/11-21 INTRODUCTION From December 2007 to June 2009, the United States experienced an economic
Starting Salaries of College Graduates 1947 to 1995
 Return... Starting Salaries of College Graduates 1947 to 1995... on Investment College freshmen report that among the many reasons they enroll in college the most important are economic: to prepare for
Reasons and Reservations for Enrolling in Forestry Degree Programs: A Survey of Undergraduate Students
 Western NAUFRP Meeting, June 19, 2008 Reasons and Reservations for Enrolling in Forestry Degree Programs: A Survey of Undergraduate Students Terry L. Sharik and Stacey Frisk Department of Environment and
National Sample Survey of Registered Nurses March 2004. Preliminary Findings
 The Registered Nurse Population: National Sample Survey of Registered Nurses March 2004 Preliminary Findings Preliminary Findings 2004 National Sample Survey of Registered Nurses The (NSSRN) is the Nation
recovery: Projections of Jobs and Education Requirements Through 2020 June 2013
 recovery: Projections of Jobs and Requirements Through June 2013 Projections of Jobs and Requirements Through This report projects education requirements linked to forecasted job growth by state and the
Highlights and Trends: ASHA Counts for Year End 2009
 Highlights and Trends: ASHA Counts for Year End 2009 Constituents -- How many are there? How have the numbers changed? v ASHA currently represents 140,039 speech-language pathologists, audiologists, and
Factors affecting bachelor s degree completion among Black males with prior attrition
 Factors affecting bachelor s degree completion among Black males with prior attrition ABSTRACT Rayna Matthews-Whetstone Richardson, Texas ISD Joyce A. Scott Texas A&M University-Commerce Black males lag
A Guide to the Methodology of the National Research Council Assessment of Doctorate Programs
 A Guide to the Methodology of the National Research Council Assessment of Doctorate Programs Jeremiah P. Ostriker, Paul W. Holland, Charlotte V. Kuh, and James A. Voytuk, editors Committee to Assess Research-Doctorate
Text table 4-1 Enrollment, degree attainment, and employment status of academic year 1996/97 and 1997/98 S&E bachelor s degree recipients: April 1999
 Chapter 4 Graduate Enrollment Overview Graduate enrollment in science and engineering 1 rose in after 5 consecutive years of decline. (See appendix table 4-1.) The growth was entirely attributable to increases
Changes in the Cost of Medicare Prescription Drug Plans, 2007-2008
 Issue Brief November 2007 Changes in the Cost of Medicare Prescription Drug Plans, 2007-2008 BY JOSHUA LANIER AND DEAN BAKER* The average premium for Medicare Part D prescription drug plans rose by 24.5
The goal is to transform data into information, and information into insight. Carly Fiorina
 DEMOGRAPHICS & DATA The goal is to transform data into information, and information into insight. Carly Fiorina 11 MILWAUKEE CITYWIDE POLICY PLAN This chapter presents data and trends in the city s population
DIVERSITY OF PROFESSIONAL SCHOOL APPLICANTS OVER A TEN YEAR PERIOD IN THE UNITED STATES (2003-2013)
") DIVERSITY OF PROFESSIONAL SCHOOL APPLICANTS OVER A TEN YEAR PERIOD IN THE UNITED STATES (2003-2013) Ellen Lee, D.D.S. 1, Brian Chin 2, Kevin Lin 3, David Hershkowitz, D.D.S. 4, Arthur D. Goren, D.M.D.
DIVERSITY OF PROFESSIONAL SCHOOL APPLICANTS OVER A TEN YEAR PERIOD IN THE UNITED STATES (2003-2013) Ellen Lee, D.D.S. 1, Brian Chin 2, Kevin Lin 3, David Hershkowitz, D.D.S. 4, Arthur D. Goren, D.M.D.
Fall 2014 OSSE Educator Preparation Program Profiles The George Washington University (Alternative, IHE-based)
") Section 1: Program Summary Graduate School of Education and Human Telephone: (202) 994-6166 Development 2134 G Street W, Suite 416 Website: http://gsehd.gwu.edu/ Washington, DC 20052 Mission: Our Mission:
Section 1: Program Summary Graduate School of Education and Human Telephone: (202) 994-6166 Development 2134 G Street W, Suite 416 Website: http://gsehd.gwu.edu/ Washington, DC 20052 Mission: Our Mission:
Projections of Education Statistics to 2022
 Projections of Education Statistics to 2022 Forty-first Edition 18 018 2019 2019 2020 2020 2021 2021 2022 2022 NCES 2014-051 U.S. DEPARTMENT OF EDUCATION Projections of Education Statistics to 2022 Forty-first
THE EDUCATIONAL PROGRESS OF WOMEN
 NATIONAL CENTER FOR EDUCATION STATISTICS Findings from THE CONDITION OF EDUCATION 1995 NO. 5 THE EDUCATIONAL PROGRESS OF WOMEN U.S. Department of Education Office of Educational Research and Improvement
What It s Worth: Field of Training and Economic Status in 2009
 What It s Worth: Field of Training and Economic Status in 2009 Household Economic Studies Issued February 2012 P70-129 INTRODUCTION The relationship between educational attainment and economic outcomes
SECTION 1. Participation in Education
 The indicators in this section of The Condition of Education report trends in enrollments across all levels of education. Enrollment is a key indicator of the scope of and access to educational opportunities
A 33-year Trend in Tuition and Fees:
 A 33-year Trend in Tuition and Fees: The Cost of Attending the University of Texas at Austin 2002 UT Watch Tuition and Fees Since 1970 Tuition and fees at the University of Texas at Austin have risen dramatically
Certificate Production and the Race toward Higher Degree Attainment December 2010
 State Higher Education Executive Officers Certificate Production and the Race toward Higher Degree Attainment December 2010 ----- A report from the State Higher Education Executive Officers utilizing the
Administrative Council July 28, 2010 Presented by Nancy McNerney Institutional Effectiveness Planning and Research
 Administrative Council July 28, 2010 Presented by Nancy McNerney Institutional Effectiveness Planning and Research Developmental Students Today I will talk about 1. Who are they? 2. What are some facts
APPENDIX A. Tables. Appendix A Tables 119
 118 The Condition of Education 2012 APPENDIX A Tables Appendix A Tables 119 Indicator 1 Enrollment Trends by Age Table A-1-1. Percentage of the population ages 3 34 enrolled in school, by age group: October
Higher Education Policy Brief
 Higher Education Policy Brief Indiana s Twenty-first Century Scholars Program: A Look at Impact Contents High School Completion 2 History and Overview In 199, Indiana policymakers created a program to
High School Dropouts in Chicago and Illinois: The Growing Labor Market, Income, Civic, Social and Fiscal Costs of Dropping Out of High School
 High School Dropouts in Chicago and Illinois: The Growing Labor Market, Income, Civic, Social and Fiscal Costs of Dropping Out of High School Prepared by: Andrew Sum Ishwar Khatiwada Joseph McLaughlin
INSIGHT on the Issues
 INSIGHT on the Issues Housing for Older Adults: The Impacts of the Recession Rodney Harrell, PhD AARP Public Policy Institute This paper summarizes findings from State Housing Profiles 2011 (www.aarp.org/statehousingprofiles),
Many students attend more than one institution of higher education before they earn a
 Hot Topics in Higher Education State Policies to Improve Student Transfer By Brenda Bautsch January 2013 Many students attend more than one institution of higher education before they earn a degree. According
Over academic years (AY) 2001 to
 2001 to") Community Colleges: Playing an Important Role in the Education of Science, Engineering, and Health Graduates by Geraldine M. Mooney and Daniel J. Foley 1 July 2011 (revised) NSF 11-317 Over academic years
Community Colleges: Playing an Important Role in the Education of Science, Engineering, and Health Graduates by Geraldine M. Mooney and Daniel J. Foley 1 July 2011 (revised) NSF 11-317 Over academic years
Low rates of college completion have long
 June 2011 College Affordability H Many students are not able to keep pace with rising tuition, because family earnings have lost ground over the past decade. H Tuition at two-year and four-year has outpaced
Disabilities and Employment: Removing Barriers to Encourage Productive Community Living
 Disabilities and Employment: Removing Barriers to Encourage Productive Community Living Peter S. Arno, PhD Deborah Viola, PhD Alexandra Rubino, BA Prevalence of Disabilities in US and UK US 54 million:
The Youth Vote in 2012 CIRCLE Staff May 10, 2013
 The Youth Vote in 2012 CIRCLE Staff May 10, 2013 In the 2012 elections, young voters (under age 30) chose Barack Obama over Mitt Romney by 60%- 37%, a 23-point margin, according to the National Exit Polls.
Lloyd Potter is the Texas State Demographer and the Director of the Texas State Data Center based at the University of Texas at San Antonio.
 Lloyd Potter is the Texas State Demographer and the Director of the Texas State Data Center based at the University of Texas at San Antonio. 1 2 Texas population in 2014 was just under 27 million and was
Demographic, Socio-Economic, Schooling, and Labor Market Indicators for 16-24 Year Olds in the City of Hartford
 Demographic, Socio-Economic, Schooling, and Labor Market Indicators for 16-24 Year Olds in the City of Hartford Prepared by: Center for Labor Market Studies Northeastern University Prepared for: National
Marriage and divorce: patterns by gender, race, and educational attainment
 ARTICLE OCTOBER 2013 Marriage and divorce: patterns by gender, race, and educational attainment Using data from the National Longitudinal Survey of Youth 1979 (NLSY79), this article examines s and divorces
May 2014 U.S. Teenage Pregnancies, Births and Abortions, 2010: National and State Trends by Age, Race and Ethnicity
 May 2014 U.S. Teenage Pregnancies, Births and Abortions, 2010: National and State Trends by Age, Race and Ethnicity Kathryn Kost and Stanley Henshaw Table of Contents Introduction 2 Key Findings 2 Discussion
School to College. Alaska DIPLOMAS COUNT. Can State P-16 Councils Ease the Transition? 2008 With Support from the Bill & Melinda Gates Foundation
 Alaska School to College Can State P-16 Councils Ease the Transition? A Special Supplement to Education Week s DIPLOMAS COUNT 2008 With Support from the Bill & Melinda Gates Foundation About Diplomas Count
Career & College Clubs SM
 Career & College Clubs SM EXPLORE + ENGAGE = ELEVATE Promising Results: Evaluating Effectiveness of Career & College Clubs SM June 2013 Contact: Career & College Clubs c/o ALL Management Corporation 6601
THE CHARACTERISTICS OF PERSONS REPORTING STATE CHILDREN S HEALTH INSURANCE PROGRAM COVERAGE IN THE MARCH 2001 CURRENT POPULATION SURVEY 1
 THE CHARACTERISTICS OF PERSONS REPORTING STATE CHILDREN S HEALTH INSURANCE PROGRAM COVERAGE IN THE MARCH 2001 CURRENT POPULATION SURVEY 1 Charles Nelson and Robert Mills HHES Division, U.S. Bureau of the
INDIANA S TWENTY-FIRST CENTURY SCHOLARS PROGRAM. Stan Jones, Indiana Commission for Higher Education
 1 INDIANA S TWENTY-FIRST CENTURY SCHOLARS PROGRAM 3/7/2008 Stan Jones, Indiana Commission for Higher Education The Goals Help more students continue their education. Reduce the high school dropout rate.
THE PROFESSIONAL AND TECHNICAL WORKFORCE
 Fact Sheet 2013 THE PROFESSIONAL AND TECHNICAL WORKFORCE Introduction The professional and technical workforce is defined to include all workers in the U.S. Bureau of Labor Statistics (BLS) category management,
Steve and Clint Marchant Data Based Insights, Inc. on behalf of the ACS Department of Research & Market Insights. March 5, 2015
 Starting Salaries of Chemists And Chemical Engineers: 2014 Analysis of the American Chemical Society's Survey Of New Graduates in Chemistry and Chemical Engineering Steve and Clint Marchant Data Based
bachelor s degree-granting institutions were located.
 WEB Profile of 2007 08 2007-08 First-Time Bachelor s TABLES Degree Recipients U.S. DEPARTMENT OF EDUCATION in 2009 OCTOBER 2012 NCES 2013-150 These Web Tables provide wideranging information on the demographic
REPORT SPECIAL. States Act to Help People Laid Off from Small Firms: More Needs to Be Done. Highlights as of April 14, 2009
 REPORT April 2009 States Act to Help People Laid Off from Small Firms: More Needs to Be Done In the past two months, several states have taken action to make sure state residents who lose their jobs in
Enrollment Data Undergraduate Programs by Race/ethnicity and Gender (Fall 2008) Summary Data Undergraduate Programs by Race/ethnicity
 Summary Data Undergraduate Programs by Race/ethnicity") Enrollment Data Undergraduate Programs by Race/ethnicity and Gender (Fall 8) Summary Data Undergraduate Programs by Race/ethnicity The following tables and figures depict 8, 7, and 6 enrollment data for
Enrollment Data Undergraduate Programs by Race/ethnicity and Gender (Fall 8) Summary Data Undergraduate Programs by Race/ethnicity The following tables and figures depict 8, 7, and 6 enrollment data for
College Students with Children are Common and Face Many Challenges in Completing Higher Education
 IWPR# C404 March 2013 College Students with Children are Common and Face Many Challenges in Completing Higher Education Summary Nearly 25 percent of college students in the U.S., or four million students,
Home Computers and Internet Use in the United States: August 2000
 Home Computers and Internet Use in the United States: August 2000 Special Studies Issued September 2001 P23-207 Defining computer and Internet access All individuals living in a household in which the
Education and Public Safety August 30, 2007
 August 30, 2007 The Justice Policy Institute is a Washington, D.C.- based think tank dedicated to ending society s reliance on incarceration and promoting effective and just solutions to social problems.
The Outcomes For CTE Students in Wisconsin
 Promoting Rigorous Career and Technical Education Programs of Study Quantitative Outcomes Study: Baseline Data Collection Report Prepared under contract to Division of Academic and Technical Education
April 2014. For Kids Sake: State-Level Trends in Children s Health Insurance. A State-by-State Analysis
 April 2014 For Kids Sake: State-Level Trends in Children s Health Insurance A State-by-State Analysis 2 STATE HEALTH ACCESS DATA ASSISTANCE CENTER Contents Executive Summary... 4 Introduction... 5 National
College Affordability for Students from Low and Lower-Middle Income Families. Scholarship America Minneapolis, Minnesota October 19, 2006
 Intro College Affordability for Students from Low and Lower-Middle Income Families Scholarship America Minneapolis, Minnesota October 19, 2006 Tom Mortenson Senior Scholar, The Pell Institute for the Study
2012 Demographics PROFILE OF THE MILITARY COMMUNITY
 2012 Demographics PROFILE OF THE MILITARY COMMUNITY Acknowledgements ACKNOWLEDGEMENTS This report is published by the Office of the Deputy Assistant Secretary of Defense (Military Community and Family
WEB TABLES. Characteristics of Associate s Degree Attainers and Time to Associate s Degree U.S. DEPARTMENT OF EDUCATION MARCH 2012 NCES 2012-271
 WEB TABLES U.S. DEPARTMENT OF EDUCATION MARCH 2012 NCES 2012-271 Characteristics of Associate s Degree Attainers and Time to Associate s Degree The number of associate s degrees conferred by U.S. postsecondary
February 2015 STATE SUPPLEMENT. Completing College: A State-Level View of Student Attainment Rates
 8 February 2015 STATE SUPPLEMENT Completing College: A State-Level View of Student Attainment Rates Completing College: A State-Level View of Student Attainment Rates In the state supplement to our eighth
An Examination of the Graduation Rates and Enrollment Trends in Industrial Technology Baccalaureate Programs from 1988-1998
 Volume 17, Number 3 - May 21 to July 21 An Examination of the Graduation Rates and Enrollment Trends in Industrial Technology Baccalaureate Programs from 1988-1998 By Dr. Tao C. Chang & Dr. John C. Dugger
NATIONAL CENTER FOR EDUCATION STATISTICS. Statistical Analysis Report February 2001. Postsecondary Education Descriptive Analysis Reports
 NATIONAL CENTER FOR EDUCATION STATISTICS Statistical Analysis Report February 2001 Postsecondary Education Descriptive Analysis Reports From Bachelor s Degree to Work Major Field of Study and Employment
HBCU 101: AMERICAN HIGHER EDUCATION WITHOUT PUBLIC HISTORICALLY BLACK COLLEGES AND UNIVERSITIES
 HBCU 101: AMERICAN HIGHER EDUCATION WITHOUT PUBLIC HISTORICALLY BLACK COLLEGES AND UNIVERSITIES John Michael Lee, Jr., PhD Policy Director The College Board THE COLLEGE BOARD The College Board is a mission-driven
Health Insurance Coverage: Early Release of Estimates From the National Health Interview Survey, 2012
 Health Insurance Coverage: Early Release of Estimates From the National Health Interview Survey, 2012 by Robin A. Cohen, Ph.D., and Michael E. Martinez, M.P.H., M.H.S.A. Division of Health Interview Statistics,
Higher Education in Florida: Trends and Key Issues. 1990-2014 The LeRoy Collins Institute Dr. Carol Weissert, Director
 Higher Education in Florida: Trends and Key Issues 1990-2014 The LeRoy Collins Institute Dr. Carol Weissert, Director Key Observations Florida universities are more accessible than those in many other
Impacts of Sequestration on the States
 Impacts of Sequestration on the States Alabama Alabama will lose about $230,000 in Justice Assistance Grants that support law STOP Violence Against Women Program: Alabama could lose up to $102,000 in funds
Figure 5-1 Master's degrees awarded in S&E and non-s&e fields, by sex: 1990 98
 Chapter 5 Graduate Degrees Trends for women and minorities in attainment of master s and doctoral degrees are similar to those for their bachelor s degree attainment and their graduate enrollment: both
Readiness Matters The Impact of College Readiness on College Persistence and Degree Completion
 Readiness Matters The Impact of College Readiness on College Persistence and Degree Completion Steve Kappler AVP Career & College Readiness ACT, Inc. steve.kappler@act.org NACAC Webinar Series February
Data show key role for community colleges in 4-year
 Page 1 of 7 (https://www.insidehighered.com) Data show key role for community colleges in 4-year degree production Submitted by Doug Lederman on September 10, 2012-3:00am The notion that community colleges
The NAIS Demographic Center 2013 Local Area Reports
 Page 1 of 9 The NAIS Demographic Center 2013 Local Area Reports CBSA : Los Angeles-Long Beach-Anaheim, CA Local Area Reports summarize key demographic changes for a specific geographic region, suggest
UW Madison Massive Open Online Courses (MOOCs): Preliminary Participant Demographics
: Preliminary Participant Demographics") UW Madison Massive Open Online Courses (MOOCs): Preliminary Participant Demographics Clare Huhn, UW Madison MOOC Data Coordinator Starting in Fall 2013, UW Madison will offer four MOOCs using the Coursera
UW Madison Massive Open Online Courses (MOOCs): Preliminary Participant Demographics Clare Huhn, UW Madison MOOC Data Coordinator Starting in Fall 2013, UW Madison will offer four MOOCs using the Coursera
The Performance and State Policies Of Higher Education in Illinois: Insights from a Five- State Policy Review Project
 The Performance and State Policies Of Higher Education in Illinois: Insights from a Five- State Policy Review Project Laura W. Perna Joni Finney Patrick Callan With Assistance from: Michael Armijo, Jamey
WAGE REPORTS FOR WORKERS COVERED BY FEDERAL OLD-AGE INSURANCE IN 1937
 WAGE REPORTS FOR WORKERS COVERED BY FEDERAL OLD-AGE INSURANCE IN 937 JOHN J. CORSON* 3 DURING 937 approximately 3 million men and women worked in employment covered by Federal old-age insurance. They received
New Mexico State Profile
 As America Becomes More Diverse: The Impact of State Higher Education Inequality State Profile Questions You Should Ask How educated is s adult population and workforce? How does compare to the national
A Review on Postsecondary Education and Low-Income Young Adults
 Portraits WHAT IS THE PORTRAITS SERIES? With the support from the Bill & Melinda Gates Foundation, the INSTITUTE FOR HIGHER EDUCATION POLICY plans to regularly release short research briefs that describe
Policy Brief College Access and Retention of Career and Technical Education Graduates
 Prepared by Paul E. Harrington and Neeta P. Fogg, Center for Labor Market Studies, Northeastern University, and Christine Shaw, Shawsheen Valley Regional Technical High School, in collaboration with the
MCPS Graduates Earning College Degrees in STEM-Related Fields
 Graduates Earning College Degrees in -Related Fields September 2012 Natalie Wolanin & Julie Wade OFFICE OF SHARED ACCOUNTABILITY Adrian B. Talley, Associate Superintendent 850 Hungerford Drive Rockville,
Record Shares of Young Adults Have Finished Both High School and College
 Social & Demographic Trends Monday, Nov. 5, 2012 Record Shares of Young Adults Have Finished Both High School and College Richard Fry, Senior Economist Kim Parker, Associate Director FOR FURTHER INFORMATION
2013 Demographics PROFILE OF THE MILITARY COMMUNITY
 2013 Demographics PROFILE OF THE MILITARY COMMUNITY Acknowledgements ACKNOWLEDGEMENTS This report is published by the Office of the Deputy Assistant Secretary of Defense (Military Community and Family
Nuclear Engineering Enrollments and Degrees Survey, 2014 Data
 Nuclear Engineering Enrollments and Degrees Survey, 2014 Data Number 74 Oak Ridge Institute for Science and Education 2015 SURVEY UNIVERSE The 2014 survey includes degrees granted between September 1,