Performance-Based Planning and Programming
|
|
|
- Penelope Abigayle Alexander
- 10 years ago
- Views:
Transcription
1 Performance-Based Planning and Programming Matthew Hardy, Ph.D. Program Direction for Planning and Policy AASHTO September 17, WVDOT/MPO/FHWA PLANNING CONFERENCE 1

2 Overview MAP-21 Requirements Planning Performance Measures Asset Management Next steps SHRP2 Questions 2

3 MAP-21 Requirements 3

4 MAP-21 and PBPP PBPP principles are part of LRP and S/TIP LRP describes performance measures and targets, achievement in reaching target S/TIP must show progress toward established performance targets U.S. DOT establishes criteria for the evaluation of performancebased planning processes U.S. DOT establishes national-level performance measures 4

5 U.S. DOT Resources 5
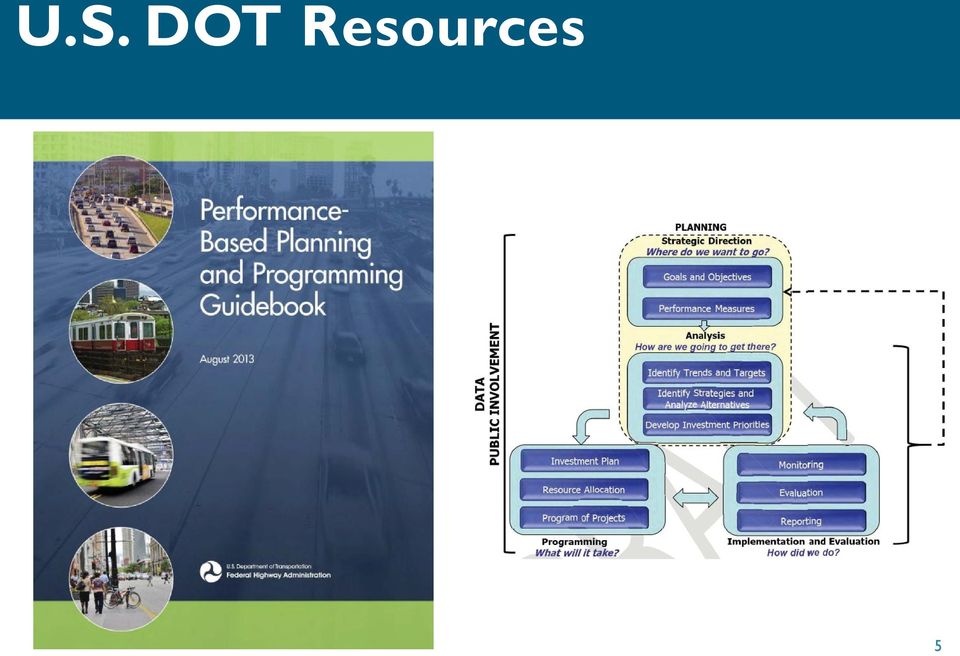
6 PBPP in Context National Goals State Goals Metro Goals National Measures State Measures Metro Measures Performance-based Planning Process Target Setting Asset Management Plan Long Range Plan: State Long Range Plan: Metro Safety Plan STIP TIP Freight Plan 6

7 National-level Measures Overarching Principles 1. There is a Difference National-level performance measures are not necessarily the same performance measures State DOTs will use for planning and programming of transportation projects and funding. 2. Specificity and Simplicity National-level performance measures should follow the SMART and KISS principles: SMART: Specific, Measurable, Attainable, Realistic, Timely KISS: Keep it Short and Simple 3. Possession is 9/10ths of the Law National-level performance measures should focus on areas and assets that States DOTs have control over. 7

8 Overarching Principles (cont.) 4. Reduce and Re-use The initial set of national-level performance measures should build upon existing performance measures, management practices, data sets and reporting processes. 5. Ever Forward National-level measures should be forward thinking to allow continued improvement over time. 6. Communicate, Communicate, Communicate Messaging the impact and meaning of the national-level measures to the public and other audiences is vital to the success of this initiative. 8

9 Safety Recommended Measures Number of Fatalities Five-year moving average of the count of the number of fatalities on all public roads for a calendar year. Fatality Rate Five-year moving average of the Number of Fatalities divided by the Vehicle Miles Traveled (VMT) for a calendar year. Number of Serious Injuries Five-year moving average of the count of the number of serious injuries on all public roads for a calendar year. Serious Injury Rate Five-year moving average of the Number of Serious Injuries divided by the Vehicle Miles Traveled (VMT) for a calendar year. 9

10 Pavement Recommended Measures Interstate Pavement in Good, Fair and Poor Condition based on the International Roughness Index (IRI) Percentage of 0.1 mile segments of Interstate pavement mileage in good, fair and poor condition based on the following criteria: good if IRI<95, fair if IRI is between 95 and 170, and poor if IRI is greater than 170. Non-Interstate NHS Pavement in Good, Fair and Poor Condition based on the International Roughness Index (IRI) Percentage of.1 mile segments of non- Interstate NHS pavement mileage in good, fair and poor condition based on the following criteria: good if IRI<95, fair if IRI is between 95 and 170, and poor if IRI is greater than 170. Pavement Structural Heath Index Percentage of pavement which meet minimum criteria for pavement faulting, rutting and cracking. 10

11 Bridge Recommended Measures Percent of Deck Area on Structurally Deficient Bridges NHS bridge deck area on structurally deficient bridges as a percentage of total NHS bridge deck area. NHS Bridges in Good, Fair and Poor Condition based on Deck Area Percentage of National Highway System bridges in good, fair and poor condition, weighted by deck area. The first measure is required in MAP-21 and AASHTO supports this as an initial measure. However, this measure could steer a State DOT to implement a worst-first approach for maintaining bridge condition. Therefore, AASHTO is exploring the second measure. 11


12 System Performance Interstate and NHS Where must measures be established? 1. Performance of the Interstate System <double blue line> 2. Performance of the National Highway System (excluding the Interstate System) <red line> 12

13 System Performance Virginia: Interstates (I-66) 13

14 System Performance Virginia: NHS (Route 50) 14

15 System Performance Virginia: Arterials Columbia Pike: Fairfax, VA Posted Speed Limit: 40 MPH Design Speed: 50 MPH Land Use: Low Density Columbia Pike: Arlington, VA Posted Speed Limit: 25 MPH Design Speed: 35 MPH Land Use: Medium Density 15

16 System Performance Recommended Measures Annual Hours of Delay (AHD) Travel time above a congestion threshold (defined by State DOTs and MPOs) in units of vehicle -hours of delay on Interstate and NHS corridors. Reliability Index (RI 80 ) The Reliability Index is defined as the ratio of the 80th percentile travel time to the agency-determined threshold travel time. 16
 The Reliability Index is defined as the ratio of the 80th")
17 Freight Recommended Measures Annual Hours of Truck Delay (AHTD) Travel time above the congestion threshold in units of vehicle-hours for trucks on the Interstate Highway System. Truck Reliability Index (RI 80 ) The RI is defined as the ratio of the 80 th percentile total truck travel time needed to ensure on-time arrival to the agency-determined threshold travel time (e.g., observed travel time or preferred travel time). 17
.")

18 CMAQ For purposes of carrying out section 149, the Secretary shall establish measures for States to use to assess: 1. Traffic Congestion 2. On-Road Mobile Source Emissions CMAQ Programs & Projects Transportation Model Criteria Pollutant Emissions VOC Nox PM CO Traffic Congestion Annual Hours of Delay Performance Measures 18

19 CMAQ On-road Mobile Source Emissions Criteria Pollutant Emissions Daily kilograms of on-road, mobile source criteria air pollutants (VOC, NOx, PM, CO) reduced by the latest annual program of CMAQ projects. Traffic Congestion Annual Hours of Delay (AHD) Travel time above a congestion threshold (defined by State DOTs and MPOs) in units of vehicle -hours of delay reduced by the latest annual program of CMAQ projects. These measures apply only to MPOs that serve Transportation Management Areas (TMAs) with populations of over 1,000,000 and that are nonattainment or maintenance areas. 19

20 TAM and Kentucky 20 20

21 Transportation Asset Management MAP-21 Definition A strategic and systematic process of operating, maintaining, upgrading, and expanding physical assets effectively throughout their lifecycle. It focuses on business and engineering practices for resource allocation and utilization, with the objective of better decision making based upon quality information and well-defined objectives Risk-based Asset Management Plans Bridge and Roadway Condition Financial Plan Etc
22 Why is TAM Important? Focus on accountability and transparency, as evidenced by MAP- 21 Funding competition Needs Demand Complex trade-offs 22 22

23 MAP-21 Rulemaking Process 23
24 What did AASHTO Ask For? AASHTO Strengthen recognition that the federal-aid highway program is a federally assisted, state-administered program Maintain existing balance of authority Continue broad flexibility in planning procedures Avoid new administrative burdens Incorporate performance-based planning and programming aspects Maintain separation between planning requirements and discretionary grant programs Streamline fiscal constraint MAP-21 YES YES YES YES YES YES NO 24
25 Planning Give State DOTs time to implement planning policies Avoid imposing new administrative burdens Maintain existing balance of authority Ensure minimum conditions do not force worst-first Provide more flexibility to determine NHS routes State DOTs should be eligible to receive TAP funds Remove operations eligibility restriction from CMAQ Use a collaborative approach to data practices 25
26 Performance Measures Give State DOTs time to implement performance management policies Resolution Do not link performance measures to apportionment Do not establish any additional national-level measures 26
27 SHRP2 27
28 Implementing SHRP2 Solutions Moving Forward Collaboration of AASHTO, FHWA, and SHRP2/TRB staff Over 65+ high-priority products introduced over the next several years Users run the gamut of the transportation industry Selected products integrated into current transportation practices 28
29 Capacity Focus Area Objective Congressional charge: Develop tools for systematically integrating environmental, economic, and community requirements into the analysis, planning, and design of new highway capacity projects. Focus on a collaborative approach: Leads to better projects delivered faster 29
30 Focus Area Products Two products are being implemented now: Implementing Ecological (C06) Expedited Planning and Environmental Review (C19) One product slated for next round of implementation funding (2014) Freight Demand Modeling and Data Improvement Strategic Plan (C20) Remaining products will be considered for future implementation funding 30

31 Capacity Product Highlights: TCAPP 31 31

32 Capacity Product Highlights: T-PICS 32 32
33 Capacity Product Highlights: Freight Strategic Plan Recommends establishing a Global Freight Research Consortium: Peer-based consortium would enable, fund, and promote research and enhanced analytical approaches Includes public organizations national and international together with private organizations Global Freight Research Consortium focus areas: Define issues ripe for research innovation Provide recognition and incentives to spur breakthroughs Conduct regular innovation forums Promote technology transfer from other disciplines Promote an international focus Recognize the application of completed research 33 33
34 Prioritizing States Needs AASHTO s role is focused on identifying which products meet the states practical needs We are relying on members and committees to define how implementation can be successful 34 34
35 Why a Strategic Plan? Group similar projects and plan for implementation together Make better use of implementation planning workshop participants time Identify linkages for the implementation process to use resources efficiently Create consistency across capacity focus area Implementation goals that can be applied to each product 35
36 Strategic Plan Process Strawman bundles and schedule Workshop with DOT and MPOs Recommended strategic plan FHWA and AASHTO review of plan 36 36
37 Process Bundle Performance Measures for Highway Capacity Decision Making (C02) Transportation Visioning in Communities (T-VIZ) (C08) Freight Planning Guide (C15) Funding Year: 2014 Incorporating Greenhouse Gas Emissions into the Collaborative Decision-Making Process (C09) The Effect of PPPs on Planning, Environmental Review and Collaborative Decision Making (C12) $1.00 Resource for selecting performance measures Includes 17 performance factors organized around five broad topics $1.00 Guide and website with approaches to developing a shared vision $1.60 Blueprint for effectively considering freight in planning and decision making Provides a decision making framework to effectively integrate market-driven freight considerations into planning $0.05 Guide to how greenhouse gas (GHG) emissions calculations can be incorporated into transportation planning and decisionmaking $0.05 Documents a business process to help determine when and how to consider private sector participation in the project planning process 37 37
38 Analytical Tools Bundle Integrated Advanced Travel Demand Model with Mode Choice Capacity and Finely-Grained Time-Sensitive Networks (C10A/B) $4 (includes funding for C46) Open source software that links travel behavior choices to better reflect real-world dynamics. Improving Our Understanding of How Highway Congestion and Pricing Affect Travel Demand (C04) Understanding the Contribution of Operations, Technology, and Design to Meeting Highway Capacity Needs (C05) $0.05 Mathematical descriptions of highway user behavioral responses to congestion, travel time reliability, and pricing $0.05 Guide that will allow agencies to use enhanced simulation models to test the effectiveness of operations strategies. The Effect of Smart Growth on Daily Travel (SmartGAP) (C16) $0.05 Provides planners with scenario forecasting tools to estimate smart growth s effects 38 38
39 Economic Impact Analysis Tools Economic Impact Analysis Tools and Case Studies (T-PICS) (C03/C11) $1.50 Sketch tool for more accurate estimates of the economic impacts of highway capacity projects 39 39
40 Freight Modeling Freight Demand Modeling and Data Improvement Strategic Plan (C20) $3.20 Strategic plan that provides organizational approach to identifying freight modeling and data priority needs Recommends the creation of the Global Freight Research Consortium 40 40
41 TCAPP TCAPP: A Framework for Collaborative, Highway Capacity Decision Making (C01) $3.5 (includes funding for C22) Include embedded products, particularly C09 (GHGs) and C12 (P3s). Web resource to support collaborative decision making Website will host other SHPR2 web tools 41 41

42 Recommendation: 5 IPWs 42 42
43 Questions 43
AASHTO SCOPM MAP-21 Checklist
 AASHTO SCOPM MAP-21 Notice of Proposed Rule-Making Checklist (CMAQ) AASHTO SCOPM MAP-21 Checklist Performance Area CMAQ Document Overview MAP-21 legislation requires States and MPOs to: Establish performance
Summary of MAP-21 Matrix
 Summary of MAP-21 Matrix Overview On July 6, 2012, President Obama signed into law P.L. 112-141, the Moving Ahead for Progress in the 21st Century Act (MAP-21). Funding surface transportation programs
Moving Ahead for Progress in the 21st Century. 2014 Performance Report
 MAP 21 Moving Ahead for Progress in the 21st Century 2014 Performance Report A report to Florida s Congressional Delegation March 2014 Overview: Because life is precious, FDOT has set the highway safety
Butch Wlaschin P.E. Director, Office of Asset Management, Pavements, and Construction FHWA
 Butch Wlaschin P.E. Director, Office of Asset Management, Pavements, and Construction FHWA National Goals Focus the Federal-aid program on the following national goals: 1) SAFETY 2) INFRASTRUCTURE CONDITION
Texas Freight Advisory Committee A PRIMER ON PUBLIC SECTOR FREIGHT PERFORMANCE MEASURES
 Texas Freight Advisory Committee A PRIMER ON PUBLIC SECTOR FREIGHT PERFORMANCE MEASURES October 1, 2013 A PRIMER ON PUBLIC SECTOR FREIGHT PERFORMANCE MEASURES How Do Performance Measures Assist the Public
Performance Elements
 Performance Elements National Goals Performance Measures Performance Targets Performance Plans Target Achievement Special Performance Rules Performance Reporting National Goals Focus the Federal aid program
Where Do We Want to Go? How Can We Get There?
 Where Do We Want to Go? How Can We Get There? The BRTB has adopted nine goals, with supporting strategies, performance measures, and performance targets. Together, these goals, strategies, measures, and
The Relationship Between Asset Management and Performance Management
 The Relationship Between Asset Management and Performance Management NCHRP 20-24, Task 58 Requested by: American Association of State Highway and Transportation Officials (AASHTO) Prepared by: Cambridge
South Carolina Multimodal Transportation Plan Vision, Goals, Objectives, and Performance Measures
 South Carolina Multimodal Transportation Plan Vision, Goals, Objectives, and Performance Measures Prepared for: Prepared by: June 2013 TABLE OF CONTENTS 1. Introduction... 1 1.1 Baseline Understanding...
The Relationship Between Asset Management and Performance Management
 The Relationship Between Asset Management and Performance Management NCHRP 20-24(58) Requested by: American Association of State Highway and Transportation Officials (AASHTO) Prepared by: Cambridge Systematics,
Update on the Development of MAP 21 Performance Measures
 Update on the Development of MAP 21 Performance Measures TPB Technical Committee February 6, 2015 Eric Randall Department of Transportation Planning Item 9 MAP 21 Rulemaking National Goals Rulemaking Overview
Technical Memorandum PERFORMANCE MEASURES. Prepared by:
 Technical Memorandum PERFORMANCE MEASURES Prepared by: March 2014 TABLE OF CONTENTS Executive Summary... 1 1. Introduction... 2 1.1 Performance Measures and the Public Sector... 2 1.2 National Focus: MAP
New Mexico DOT Transportation Asset Management Implementation Plan. final plan
 New Mexico DOT Transportation Asset Management Implementation Plan final plan February 23, 2015 report New Mexico DOT Transportation Asset Management Implementation Plan date February 23, 2015 Table
Virginia's Transportation Performance Management System
 Virginia's Transportation Performance Management System Office of Intermodal Planning and Investment Commonwealth Transportation Board Presented by: David Tyeryar, Deputy Secretary of Transportation September
Louisiana Department of Transportation and Development. Initial Transportation Asset Management Plan (Pilot Version February 2015)
") Louisiana Department of Transportation and Development Initial Transportation Asset Management Plan (Pilot Version February 2015) February 2015 Louisiana Department of Transportation and Development Initial
Louisiana Department of Transportation and Development Initial Transportation Asset Management Plan (Pilot Version February 2015) February 2015 Louisiana Department of Transportation and Development Initial
American Public Works Association Asset Management Task Force, 1998
 a comprehensive and structured approach to the long term management of assets as tools for the efficient and effective delivery of community benefits. Strategy for Improving Asset Management Practice,
Moving Ahead for Progress in the 21 st Century:
 Moving Ahead for Progress in the 21 st Century: IMPLICATIONS FOR OREGON OREGON DEPARTMENT OF TRANSPORTATION Moving Ahead for Progress in the 21 st Century Implications for Oregon December 2012 Oregon Department
INDOT 2000-2025 Long Range Plan
 Chapter 9 INDOT 2000-2025 Long Range Plan Highway Needs Analysis Overview The statewide transportation planning process provides for the identification of highway needs through a comprehensive process
Asset Management Plan
 Example Transportation Asset Management Plan Outline This outline was created using the Transportation Asset Management Plan (TAMP) Builder ( www.tamptemplate.org ), a product of NCHRP Project 8-36/116.
5 Performance Measures
 5 Performance Measures This page left blank intentionally. 5 2 Moving Forward Monterey Bay 2035 Introduction The investments identified in the 2035 MTP/SCS are expected to result in significant benefits
Scenario Planning Trends April 16, 2013
 Scenario Planning Trends April 16, 2013 Kate Ange, AICP Principal Renaissance Planning Group www.citiesthatwork.com Planning Context of Scenario Planning Alternative to predict and plan methods Provides
DRAFT Freight Performance Measures
 DRAFT Freight Performance Measures The purpose of the Industrial Areas Freight Access Project is to conduct a focused and pragmatic technical evaluation to identify and assess current and future freight
New York State DOT Transportation Asset Management Plan Draft v 05-02-14 (External Review)
") New York State DOT Transportation Asset Management Plan Draft v 05-02-14 (External Review) May 2014 Joan McDonald, Commissioner New York State DOT Transportation Asset Management Plan date May 2014 Joan
New York State DOT Transportation Asset Management Plan Draft v 05-02-14 (External Review) May 2014 Joan McDonald, Commissioner New York State DOT Transportation Asset Management Plan date May 2014 Joan
Rail Asset Management Business Plan
 TECHNICAL MEMORANDUM #4 Rail Asset Management Business Plan April 2012 Missouri State Rail Plan Rail Asset Management Business Plan Page 1 Rail Asset Management Business Plan 1. Purpose of This Business
William M. Lyons Volpe Center/Office of the Secretary/USDOT
 Metropolitan Area Transportation Planning for Healthy Communities TRB Transportation Planning, Land Use, and Air Quality Conference Developing Healthy and Livable Communities William M. Lyons Volpe Center/Office
HERS_IN. HIGHWAY ECONOMIC REQUIREMENTS SYSTEM (for) INDIANA. AASHTO Transportation Estimator Association Conference October 16, 2001
 INDIANA. AASHTO Transportation Estimator Association Conference October 16, 2001") AASHTO Transportation Estimator Association Conference October 16, 2001 HERS_IN HIGHWAY ECONOMIC REQUIREMENTS SYSTEM (for) INDIANA OVERVIEW HERS Background System Planning Tool Development HERS_IN Structure
AASHTO Transportation Estimator Association Conference October 16, 2001 HERS_IN HIGHWAY ECONOMIC REQUIREMENTS SYSTEM (for) INDIANA OVERVIEW HERS Background System Planning Tool Development HERS_IN Structure
Chapter 5 RISK MANAGEMENT ANALYSIS CHAPTER 5 RISK MANAGEMENT ANALYSIS PAGE 49
 Chapter 5 RISK MANAGEMENT ANALYSIS CHAPTER 5 RISK MANAGEMENT ANALYSIS PAGE 49 This page intentionally left blank. PAGE 50 MINNESOTA GO MNDOT TRANSPORTATION ASSET MANAGEMENT PLAN RISK MANAGEMENT ANALYSIS
How does CDOT rank among state DOTs?
 1 Colorado Department of Spring 2014 How does CDOT rank among state DOTs? State transportation departments, the federal government and third-party groups use a variety of metrics to judge the performance
Transportation Asset Management
 Transportation Asset Management The Role of Engineering Economic Analysis Presented by: Eric Gabler Economist, Office of Asset Management Federal Highway Administration Introduction The mission of the
Asset Management for MAP-21. Gary Lasham, P.E. Jonathan Pollack
 Asset Management for MAP-21 Gary Lasham, P.E. Jonathan Pollack Replaced Intermodal Surface Transportation Efficiency Act (ISTEA) MAP-21 is transforming the policy and programmatic framework for investments
2012-2013 Transition from SAFETEA-LU to the new MAP-21 Federal Transportation Act
 C h a p t e r 9 - F i n a n c i a l P l a n a n d R e c o m m e n d a t i o n s f o r T r a n s p o r t a t i o n S y s t e m I m p r o v e m e n t P r o j e c t s A major component of the Plan (T2040)
Surface Transportation Program (STP) Projects
 Projects") Toledo Metropolitan Area Council of Governments American Reinvestment and Recovery Act (Economic Stimulus Program) Application Packet for: Surface Transportation Program (STP) Projects APPLICATIONS DUE
Toledo Metropolitan Area Council of Governments American Reinvestment and Recovery Act (Economic Stimulus Program) Application Packet for: Surface Transportation Program (STP) Projects APPLICATIONS DUE
PRIORITIZATION PROCESSES
 PROJECT SELECTION & PRIORITIZATION PROCESSES STIP Workshop Presented by: Bill Lawrence April 2011 Purpose and Review Overview of Project Selection Process Review Various Prioritization Processes Tk Take
2013 Benefit-Cost Analyses Guidance for TIGER Grant Applicants
 2013 Benefit-Cost Analyses Guidance for TIGER Grant Applicants Each applicant should provide evidence that the expected benefits of the project justify the costs (recognizing that some costs and benefits
Stephen Gaj. Martin Kidner State Planning Engineer Wyoming DOT
 Stephen Gaj Leader, Asset Management Team, FHWA Martin Kidner State Planning Engineer Wyoming DOT What is asset management? Asset management is a strategic and systematic process of operating, maintaining,
Traffic Signal Asset Management. Edward Fok USDOT/FHWA Resource Center
 Traffic Signal Asset Management Edward Fok USDOT/FHWA Resource Center Fundamental Objectives 1. Preserve our assets and minimize their whole life costs. 2. Operate in a financially sustainable manner.
Caltrans - Asset Management Implementation. March 2015
 Caltrans - Asset Management Implementation March 2015 Asset Management Plan Definition An asset management plan is a strategic plan for managing an organization's infrastructure and other assets to deliver
CALIFORNIA TRANSPORTATION BY THE NUMBERS:
 CALIFORNIA TRANSPORTATION BY THE NUMBERS: Meeting the State s Need for Safe and Efficient Mobility SEPTEMBER 2014 202-466-6706 tripnet.org Founded in 1971, TRIP of Washington, DC, is a nonprofit organization
MAP 21 themes. Strengthens America s highway and public transportation systems. Supports the Department s aggressive safety agenda
 MAP 21 themes Strengthens America s highway and public transportation systems Creates jobs and supports economic growth Supports the Department s aggressive safety agenda Simplifies and focuses the Federal
FINANCIAL PLAN. Any future earmarks are assumed to carry their own limitation and not reduce the regular limitation identified in these calculations.
 VII. FINANCIAL PLAN FHWA Funds The Federal Highway Administration (FHWA) funds are appropriated by Congress. FHWA funding levels are identified in the six-year Transportation Act. Each year, a federal
GUIDE TO SUSTAINABLE TRANSPORTATION PERFORMANCE MEASURES
 GUIDE TO SUSTAINABLE TRANSPORTATION PERFORMANCE MEASURES EPA 231-K-10-004 August 2011 www.epa.gov/smartgrowth Acknowledgements This document was prepared for the U.S. Environmental Protection Agency by
HOW WILL PROGRESS BE MONITORED? POLICY AREA. 1. Implement the 2040 Growth Concept and local adopted land use and transportation plans
 PERFORMANCE MONITORING APPROACH OAR 660-044-0040(3)(e) directs Metro to identify performance measures and targets to monitor and guide implementation of the Climate Smart Strategy. The purpose of performance
ACCESS OHIO 2040. Ohio Department of Transportation
 ACCESS OHIO 2040 ACCESS OHIO 2040 Ohio Department of Transportation May 2014 Table of Contents Introducing Access Ohio 2040...1 How AO40 was Developed...1 Public Outreach and Stakeholder Participation...2
Implementation Strategy
 Implementation Strategy 6 The following implementation strategy defines strategic points of intervention for complete streets programming, including visioning, goal-setting, local agency plans, coordination
Integrating the I-95 Vehicle Probe Project Data and Analysis Tools into the FAMPO Planning Program
 Integrating the I-95 Vehicle Probe Project Data and Analysis Tools into the FAMPO Planning Program I-95 Corridor Coalition Background The I-95 Corridor Coalition is an alliance of transportation agencies,
Alternatives to the Circ Project Prioritization Methodology Prepared for Circ Task Force July 28, 2011
 Alternatives to the Circ Project Prioritization Methodology Prepared for Circ Task Force July 28, 2011 CCRPC staff has developed a draft methodology described below and detailed in the attached pages for
Mercer County Multi-Modal Transportation Plan Year 2025 Travel Demand Model
 Mercer County Multi-Modal Transportation Plan Year 2025 Travel Demand Model Prepared For West Virginia Department of Transportation Transportation Planning Division Building 5, Room 824 1900 Kanawha Blvd.
How To Manage Transportation Asset Management
 1 TRANSPORTATION ASSET MANAGEMENT THE NEW BUSINESS MODEL FOR TRANSPORTATION AGENCIES Presented at the AASHTO Subcommittee on Transportation Finance Policy Business Meeting Irvine, California June 26, 2012
Examples of Transportation Plan Goals, Objectives and Performance Measures
 Examples of Transportation Plan Goals, Objectives and Performance Measures The next step in the Long Range Transportation Plan (LRTP) process is to develop goals, objectives, and performance measures.
Presented via Video Recording at IHEEP Conference June 2014
 Presented via Video Recording at IHEEP Conference June 2014 Scott D. Zainhofsky, PE (ND) Planning/Asset Management Engineer North Dakota Department of Transportation Planning/Asset Management Division
Chapter 5 Financial Plan
 The Safe, Accountable, Flexible, Efficient Transportation Equity Act: A Legacy for Users (SAFETEA_LU) requires that the MTP incorporate a financial plan for the planning period. The MTP is required to