Colorado Water Supply Outlook Report February 1, 2016
|
|
|
- Dustin Gallagher
- 8 years ago
- Views:
Transcription
1 Colorado Water Supply Outlook Report February 1, 216 Snow surveyors Jerry Archuleta and Sterling Moss explain the workings of the Upper San Juan SNOTEL site to a group of high school students from Pagosa Springs. The students, as a part of a Global Science Class, are studying how the strength of El Nino events may affect snowpack in the area. Date: 1/28/216 Photo By: JD Kurz REMINDER: We are soliciting field work photos from our snow surveyors again this year. Each month we will pick one to grace the cover of this report! Please include information on where, when and of who/what the photo was taken.

2 Contents Statewide Water Supply Conditions... 3 Summary... 3 Snowpack... 4 Precipitation... 5 Reservoir Storage... 5 Streamflow... 7 GUNNISON RIVER BASIN... 9 UPPER COLORADO RIVER BASIN SOUTH PLATTE RIVER BASIN YAMPA, WHITE, NORTH PLATTE AND LARAMIE RIVER BASINS ARKANSAS RIVER BASIN UPPER RIO GRANDE RIVER BASIN SAN MIGUEL, DOLORES, ANIMAS, AND SAN JUAN RIVER BASINS How to Read Non-Exceedance Projections Graphs Explanation of Flow Comparison Charts How Forecasts Are Made The U.S. Department of Agriculture (USDA) prohibits discrimination against its customers. If you believe you experienced discrimination when obtaining services from USDA, participating in a USDA program, or participating in a program that receives financial assistance from USDA, you may file a complaint with USDA. Information about how to file a discrimination complaint is available from the Office of theassistant Secretary for Civil Rights. USDA prohibits discrimination in all its programs and activities on the basis of race, color, national origin, age, disability, and where applicable, sex (including genderidentity and expression), marital status, familial status, parental status, religion, sexual orientation, political beliefs, genetic information, reprisal, or because all or part of an individual s income is derived from any public assistance program. (Not all prohibited bases apply to all programs.) To file a complaint of discrimination, complete, sign, and mail a program discrimination complaint form,available at any USDA office location or online at or write to: USDA Office of the Assistant Secretary for Civil Rights 14 Independence Avenue, SW. Washington, DC Or call toll free at (866) (voice) to obtain additional information, the appropriate office or to request documents. Individuals who are deaf, hard of hearing, or have speech disabilities may contact USDA through the Federal Relay service at (8) or (8) (in Spanish). USDA is an equal opportunity provider, employer, and lender. Persons with disabilities who require alternative means for communication of program information (e.g., Braille, large print, audiotape, etc.) should contact USDA's TARGET Center at (22) (voice and TDD).

3 Snow Water Equivalent (inches) Summary Statewide Water Supply Conditions Two late January storms helped bridge the monthly precipitation gap that existed across the state at the end of last month, and January finished at 98 percent of average. Had the aforementioned storms not occurred, January precipitation may have been near 7 percent of average. While statewide numbers ended the month close to normal, basin-wide totals were more diverse ranging from as low as 73 percent of average January precipitation in the Upper Rio Grande watershed to as high as 114 percent of average in the combined Yampa, White and North Platte River basins. Statewide year-to-date precipitation as well remains close to average at 19 percent, down only slightly from January 1 st at 113 percent of normal. Snowpack followed that same trend with a statewide total of 112 percent of median on February 1 st down slightly from 118 percent of median on January 1 st. Current reservoir levels in every basin are nearly unchanged from last month to this month. Statewide storage is 11 percent of average on February 1 st, just as it was on January 1 st. All in all, statewide snowpack, precipitation and reservoirs are all in good standing slightly at above normal. With about one-third of the winter remaining in the mountains of Colorado, uncertainty remains regarding future weather. However, accounting for all four factors - snowpack, precipitation, reservoirs and future weather uncertainty - streamflow forecasts are still favorable in most locations of Colorado Colorado Statewide Time Series Snowpack Summary Based on Provisional SNOTEL data as of Feb 4, 216 Current as Pct of Normal: 11% Current as Pct of Avg: 14% Current as Pct of Last Year: 114% Current as Pct of Peak: 49% Normal as Pct of Peak: 45% Pct of Normal Needed to Reach Peak: 92% Normal Peak Date: Apr Oct 1 Nov 1 Dec 1 Jan 1 Feb 1 Mar 1 Apr 1 May 1 Jun 1 Jul 1 Aug 1 Sep 1 Median WY213 WY214 WY215 WY216 Average

4 Snowpack Colorado s snowpack remains at above normal levels heading into February. A stream of moisture brought heavy snow to much of the state over the last few days of January, favorably amplifying the snowpack in all major river basins. Preceding this storm, many SNOTEL stations in the southwest basins and along the Continental Divide had received less than normal snowpack accumulations. However, the latest storm produced between 1 and 4 inches of SWE for the majority of Colorado s SNOTEL sites. Although there are a few individual mountain locations that maintain a snowpack that is below the median, all of Colorado s major river basins are at above normal levels. The combined San Juan, Dolores, Animas, and San Juan River basin holds the greatest snowpack, with respect to normal, at 122 percent of median, in part due to the bountiful snowpack in the San Miguel River basin, which is the highest in the state at 15 percent of median. This is in stark contrast to last year at this time when the combined southwest basins snowpack only amounted to 66 percent of the median. The combined Yampa, White, and North Platte basin ranks lowest among the major river basins, but is still above normal with a snowpack at 13 percent of median. Although there is a substantial portion of the winter still ahead, most of Colorado s basins are currently on track to have a healthy snow accumulation season.

5 Percent of Average Precipitation 2 Colorado Monthly Precipitation Summary for WY216 USDA Natural Resources Conservation Service Oct Nov Dec Jan Feb Mar Apr Gunnison Colorado South Platte Yampa & White Arkansas Rio Grande San Juan* State *Includes Animas, Dolores, San Miguel Basins Thanks to a storm that impacted Colorado over the last few days of January, statewide mountain precipitation for the water year remains above normal. As of February 1 st, water year-to-date precipitation (WYTD) for Colorado is at 19 percent of average. January precipitation was divided among the major river basins in Colorado; basins east of the Continental Divide generally received less than average precipitation while basins west of the divide received near or above average accumulations. The Rio Grande River basin had the lowest January precipitation relative to average at 73 percent. The Arkansas and South Platte basins were also below average at 78 and 87 percent respectively. However, this lack of precipitation was not enough to diminish the benefits from the wet December that these basins experienced, and all still have above average WYTD precipitation. The combined Yampa, White, North Platte River basin experienced the greatest January precipitation with respect to normal and received 114 percent of its average monthly levels. This boosted the basin s WYTD precipitation to 99 percent of average. The Gunnison and Colorado River basins also saw above average January precipitation each at 17 percent and the combined San Miguel, Dolores, Animas, San Juan River basin was slightly below normal at 94 percent of average. Each of these river basins also have WYTD precipitation that is well above average, continuing the positive precipitation trends for Colorado.

6 Percent of Average Useable Storage Reservoir Storage Colorado Reservoir Storage 16% Oct-15 Nov-15 Dec-15 Jan-16 Feb-16 Mar-16 Apr-16 May-16 Jun-16 Jul-16 Aug-16 Sep-16 14% 12% 1% 8% 6% 4% 2% % Gunnison Colorado South Platte Yampa, White & North Platte Arkansas Upper Rio Grande San Miguel, Dolores, Animas & San Juan Statewide Continuing the trend from last, month reservoir storage across the state remains at well above average volumes. As of February 1 st statewide reservoir storage was 11 percent of average. Storage in the Arkansas basin has dropped some compared to last month but is still holding 124 percent of average, the largest amount in the state, relative to normal. This is followed closely by the combined Yampa, White, and North Platte basins which have 121 percent of average storage. On the opposite end of the spectrum the Upper Rio Grande is currently the only basin in Colorado holding below normal reservoir volumes at 9 percent of average. Both the combined basins of southwest Colorado and the South Platte are currently storing volumes just above their normal values at 13 and 15 percent of average, respectively. In the central and west central part the of the state the Gunnison and Colorado River basins are storing 18 and 19 percent of average reservoir volumes. With only one major basin with below average reservoir storage Colorado water managers should have ample flexibility to operate their reservoirs in a very efficient manner, depending on what the rest of winter and spring hold in store.

7 Streamflow February 1 st seasonal streamflow forecasts for most major basins in Colorado are predicting near to above normal volumes. Forecasts for rivers flowing from the San Juan Mountains of southwest Colorado are consistently the highest forecasts in the state. Vallecito Reservoir inflow has the smallest forecast in the region at 18 percent of normal and Gurley Reservoir inflow has the highest, at 122 percent. The Upper Rio Grande, also in southwest Colorado, follows close behind and has no points forecast to have below normal streamflow volumes with the highest being Saguache Creek near Saguache at 116 percent. The rest of the major basins in the state have forecasts surrounding, but generally near, normal values with a slightly decreasing trend from south to north throughout the state. The lowest percent of normal streamflow forecasts are currently on the Little Snake River, a major tributary to the Yampa that flows in northwest Colorado, but has much of its snow accumulating headwaters in Wyoming. Forecasts on the Little Snake range from 8 to 87 percent of normal. This general south to north decreasing trend also follows the snowpack accumulation trend, which is commonly observed during strong El Nino cycles, such as the one which has been experienced so far this winter.

8 PAGE INTENTIONALLY LEFT BLANK

9 Water Equivalent (in) Percent of Average GUNNISON RIVER BASIN February 1, 216 Snowpack in the Gunnison River basin is above normal at 114% of the median. Precipitation for January was 17% of average which brings water year-to-date precipitation to 114% of average. Reservoir storage at the end of January was 18% of average compared to 16% last year. Current streamflow forecasts range from 117% of average for Tomichi Creek at Sargents to 95% for the North Fork of the Gunnison River at Somerset. Mountain Snowpack* Mountain Precipitation 3 Median Current Maximum Minimum 16 Monthly Year-to-date Jan Feb Mar Apr May Jun Oct Nov Dec Jan Feb Mar Apr May 14% Reservoir Storage Percent Average Percent Capacity 12% 1% 8% 6% 4% 2% % 1

10

11

12 Adjusted Cumulative Monthly Discharge (KAF) Average Daily Flow (cfs) 1-Oct 1-Nov 1-Dec 1-Jan 1-Feb 1-Mar 1-Apr 1-May 1-Jun 1-Jul 1-Aug 1-Sep Snow Water Equivalent (Inches) 3 Gunnison River Basin with Non-Exceedence Projections Based on Provisional SNOTEL Data as of Feb 3, Averages Median WY216 Minimum 1% 3% 5% 7% 9% Maximum Gunnison River near Grand Junction, CO Daily and Cumulative Discharge Compared to Current Streamflow Forecasts (Apr - Jul) % Exceedance Forecast 7% Exceedance Forecast 5% Exceedance Forecast 3% Exceedance Forecast 1% Exceedance Forecast 215 Cumulative Discharge 215 Hydrograph 1-Mar 1-Apr 1-May 1-Jun 1-Jul 1-Aug Please refer to the sections at the end of this report for further explanation concerning these graphs.


13 Water Equivalent (in) Percent of Average UPPER COLORADO RIVER BASIN February 1, 216 Snowpack in the Colorado River basin is above normal at 113% of the median. Precipitation for January was 17% of average which brings water year-to-date precipitation to 15% of average. Reservoir storage at the end of January was 19% of average compared to 117% last year. Current streamflow forecasts range from 16% of average for the inflow to Willow Creek Reservoir to 9% for the inflow to Lake Granby. Mountain Snowpack* Mountain Precipitation Median Current Maximum Minimum Monthly Year-to-date Jan Feb Mar Apr May Jun Oct Nov Dec Jan Feb Mar April May 14% Reservoir Storage Percent Average Percent Capacity 12% 1% 8% 6% 4% 2% % DILLON LAKE GRANBY GREEN HOMESTAKE MOUNTAIN RUEDI VEGA WILLIAMS FORK WILLOW CREEK WOLFORD MOUNTAIN SHADOW BASINWIDE MOUNTAIN 1

14

15

16 Adjusted Cumulative Discharge (KAF) Daily Average Discharge (CFS) 1-Oct 1-Nov 1-Dec 1-Jan 1-Feb 1-Mar 1-Apr 1-May 1-Jun 1-Jul 1-Aug 1-Sep Snow Water Equivalent (Inches) 3 Upper Colorado River Basin with Non-Exceedence Projections Based on Provisional SNOTEL Data as of Feb 3, Averages Median WY216 Minimum 1% 3% 5% 7% 9% Maximum Colorado River near Cameo, CO Daily and Cumulative Discharge Compared to Current Streamflow Forecasts (Apr - Jul) % Exceedance Forecast 7% Exceedance Forecast 5% Exceedance Forecast 3% Exceedance Forecast % Exceedance Forecast 215 Cumulative Discharge 215 Hydrograph 1-Mar 1-Apr 1-May 1-Jun 1-Jul 1-Aug Please refer to the sections at the end of this report for further explanation concerning these graphs.

17 Water Equivalent (in) Percent of Average SOUTH PLATTE RIVER BASIN February 1, 216 Snowpack in the South Platte River basin is above normal at 16% of the median. Precipitation for January was 87% of average which brings water year-to-date precipitation to 11%. Reservoir storage at the end of January was 15% of average compared to 119% last year. Streamflow forecasts range from 12% of average for Boulder Creek near Orodell at Golden to 89% for the South Platte River at South Platte. Mountain Snowpack* Mountain Precipitation Median Current Maximum Minimum Monthly Year-to-date Jan Feb Mar Apr May Jun Oct Nov Dec Jan Feb Mar April May 18% Reservoir Storage Percent Average Percent Capacity 16% 14% 12% 1% 8% 6% 4% 2% % 1

18

19

20 Adjusted Cumulative Monthly Discharge (KAF) Average Daily Flow (cfs) 1-Oct 1-Nov 1-Dec 1-Jan 1-Feb 1-Mar 1-Apr 1-May 1-Jun 1-Jul 1-Aug 1-Sep Snow Water Equivalent (Inches) 3 South Platte River Basin with Non-Exceedence Projections Based on Provisional SNOTEL Data as of Feb 3, Averages Median WY216 Minimum 1% 3% 5% 7% 9% Maximum Cache La Poudre River at Canyon Mouth Daily and Cumulative Discharge Compared to Current Streamflow Forecasts (Apr - Jul) % Exceedance Forecast 7% Exceedance Forecast 5% Exceedance Forecast 3% Exceedance Forecast 1% Exceedance Forecast 215 Cumulative Discharge 215 Hydrograph 1-Mar 1-Apr 1-May 1-Jun 1-Jul 1-Aug Please refer to the sections at the end of this report for further explanation concerning these graphs.

21 Water Equivalent (in) Percent of Average YAMPA, WHITE, NORTH PLATTE AND LARAMIE RIVER BASINS February 1, 216 Snowpack in the Yampa, White & North Platte basins is above normal at 16% of the median. Precipitation for January was 114% of average and water year-to-date precipitation is at 99% of average. Reservoir storage at the end of January was 121% of average compared to 117% last year. Streamflow forecasts range from 19% of average for the Yampa River above Stagecoach Reservoir to 8% for the Little Snake River near Dixon. Mountain Snowpack* Mountain Precipitation Median Current Maximum Minimum Monthly Year-to-date Jan Feb Mar Apr May Jun Oct Nov Dec Jan Feb Mar April May 14% Reservoir Storage Percent Average Percent Capacity 12% 1% 8% 6% 4% 2% % STAGECOACH NR OAK CREEK YAMCOLO BASINWIDE 1
22
23
24 1-Mar 1-Mar 19-Mar 28-Mar 6-Apr 15-Apr 24-Apr 3-May 12-May 21-May 3-May 8-Jun 17-Jun 26-Jun 5-Jul 14-Jul 23-Jul 1-Aug 1-Aug 19-Aug 28-Aug Adjusted Cumulative Monthly Discharge (KAF) Average Daily Flow (cfs) 1-Oct 1-Nov 1-Dec 1-Jan 1-Feb 1-Mar 1-Apr 1-May 1-Jun 1-Jul 1-Aug 1-Sep Snow Water Equivalent (Inches) 4 Yampa, White & North Platte River Basins with Non-Exceedence Projections Based on Provisional SNOTEL Data as of Feb 3, Averages Median WY216 Minimum 1% 3% 5% 7% 9% Maximum Yampa River near Maybell Daily and Cumulative Discharge Compared to Current Streamflow Forecasts (Apr - Jul) % Exceedance Forecast 7% Exceedance Forecast 5% Exceedance Forecast 3% Exceedance Forecast 1% Exceedance Forecast 215 Cumulative Discharge 215 Hydrograph Please refer to the sections at the end of this report for further explanation concerning these graphs.
25 Water Equivalent (in) Percent of Average ARKANSAS RIVER BASIN February 1, 216 Snowpack in the Arkansas River basin is above normal at 111% of the median. Precipitation for January was 78% of average which brings water year-to-date precipitation to 14% of average. Reservoir storage at the end of January was 124% of average compared to 79% last year. Current streamflow forecasts range from 19% of average for Grape Creek near Westcliffe to 92% of average for the inflow to Trinidad Lake. Mountain Snowpack* Mountain Precipitation Median Current Maximum Minimum Monthly Year-to-date Jan Feb Mar Apr May Jun Oct Nov Dec Jan Feb Mar April May 18% Reservoir Storage Percent Average Percent Capacity 16% 14% 12% 1% 8% 6% 4% 2% % 1
26
27
28 Adjusted Cumulative Monthly Discharge (KAF) Average Daily Flow (cfs) 1-Oct 1-Nov 1-Dec 1-Jan 1-Feb 1-Mar 1-Apr 1-May 1-Jun 1-Jul 1-Aug 1-Sep Snow Water Equivalent (Inches) 25 Arkansas River Basin with Non-Exceedence Projections Based on Provisional SNOTEL Data as of Feb 3, Averages Median WY216 Minimum 1% 3% 5% 7% 9% Maximum Arkansas River at Salida, CO Daily and Cumulative Discharge Compared to Current Streamflow Forecasts (Apr - Jul) % Exceedance Forecast 7% Exceedance Forecast 5% Exceedance Forecast 3% Exceedance Forecast 1% Exceedance Forecast 215 Cumulative Discharge 215 Hydrograph Mar 1-Apr 1-May 1-Jun 1-Jul 1-Aug Please refer to the sections at the end of this report for further explanation concerning these graphs.
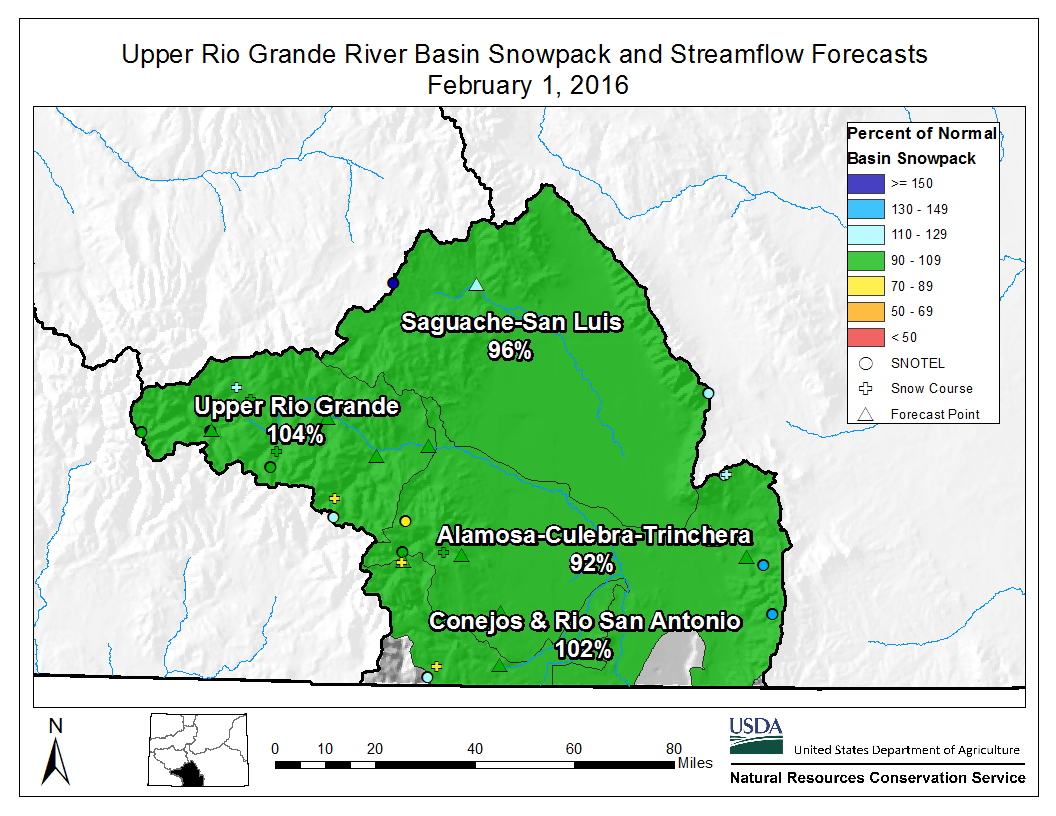
29 Water Equivalent (in) Percent of Average UPPER RIO GRANDE RIVER BASIN February 1, 216 Snowpack in the Upper Rio Grande River basin is above normal at 17% of median. Precipitation for January was 73% of average which brings water year-to-date precipitation to 15% of average. Reservoir storage at the end of January was 9% of average compared to 69% last year. Streamflow forecasts range from 116% of average for Saguache Creek near Saguache to 13% of average for the San Antonio River at Ortiz. Mountain Snowpack* Mountain Precipitation Median Current Maximum Minimum Monthly Year-to-date Jan Feb Mar Apr May Jun Oct Nov Dec Jan Feb Mar April May 2% Reservoir Storage Percent Average Percent Capacity 18% 16% 14% 12% 1% 8% 6% 4% 2% % CONTINENTAL PLATORO RIO GRANDE SANCHEZ SANTA MARIA TERRACE BEAVER BASINWIDE 1
30
31
32 Adjusted Cumulative Monthly Discharge (KAF) Average Daily Flow (cfs) 1-Oct 1-Nov 1-Dec 1-Jan 1-Feb 1-Mar 1-Apr 1-May 1-Jun 1-Jul 1-Aug 1-Sep Snow Water Equivalent (Inches) 25 Upper Rio Grande River Basin with Non-Exceedence Projections Based on Provisional SNOTEL Data as of Feb 3, Averages Median WY216 Minimum 1% 3% 5% 7% 9% Maximum Rio Grande at Wagon Wheel Gap Daily and Cumulative Discharge Compared to Current Streamflow Forecasts (Apr-Sep) % Exceedance Forecast 7% Exceedance Forecast 5% Exceedance Forecast 3% Exceedance Forecast 1% Exceedance Forecast 215 Cumulative Discharge 215 Hydrograph 1-Mar 1-Apr 1-May 1-Jun 1-Jul 1-Aug Please refer to the sections at the end of this report for further explanation concerning these graphs.
33 Water Equivalent (in) Percent of Average SAN MIGUEL, DOLORES, ANIMAS, AND SAN JUAN RIVER BASINS February 1, 216 Snowpack in the combined southwest river basins is above normal at 122% of median. Precipitation for January was 94% of average which brings water year-to-date precipitation to 123% of average. Reservoir storage at the end of January was 13% of average compared to 88% last year. Current streamflow forecasts range from 122% of average for the inflow to Gurley Reservoir to 18% for the inflow to Vallecito Reservoir. Mountain Snowpack* Mountain Precipitation Median Current Maximum Minimum Monthly Year-to-date Jan Feb Mar Apr May Jun Oct Nov Dec Jan Feb Mar April May 18% Reservoir Storage Percent Average Percent Capacity 16% 14% 12% 1% 8% 6% 4% 2% % GROUNDHOG JACKSON GULCH LEMON MCPHEE NARRAGUINNEP VALLECITO TROUT LAKE BASINWIDE 1
34
35
36 Adjusted Cumulative Monthly Discharge (KAF) Average Daily Flow (cfs) 1-Oct 1-Nov 1-Dec 1-Jan 1-Feb 1-Mar 1-Apr 1-May 1-Jun 1-Jul 1-Aug 1-Sep Snow Water Equivalent (Inches) San Miguel, Dolores, Animas and San Juan River Basin with Non-Exceedence Projections 35 Based on Provisional SNOTEL Data as of Feb 3, Averages Median WY216 Minimum 1% 3% 5% 7% 9% Maximum 7 Animas River at Durango, CO Daily and Cumulative Discharge Compared to Current Streamflow Forecasts (Apr - Jul) % Exceedance Forecast 7% Exceedance Forecast % Exceedance Forecast 3% Exceedance Forecast 1% Exceedance Forecast 215 Cumulative Discharge 215 Hydrograph 1-Mar 1-Apr 1-May 1-Jun 1-Jul 1-Aug 1-Sep Please refer to the sections at the end of this report for further explanation concerning these graphs.
37 How to Read Non-Exceedance Projections Graphs The graphs show snow water equivalent (SWE) projections (in inches) for the October 1 through September 3 water year. Basin observed SWE values are computed using SNOTEL sites which are characteristic of the snowpack of the particular basin. The SWE observations at these sites are averaged and normalized to produce these basin snowpack graphs. This new graph format uses non-exceedance projections. Current water year is represented by the heavy red line terminating on the last day the graphic was updated. Historical observed percentile range is shown as a gray background area on the graph. Shades of gray indicate maximum, 9 percentile, 7 percentile, 5 percentile (solid black line), 3 percentile, 1 percentile, and minimum for the period of record. Projections for maximum, 9 percent, 7 percent, 5 percent (most probabilistic snowpack projection, based on median), 3 percent, 1 percent, and minimum exceedances are projected forward from the end of the current line as different colored lines. For more detailed information on these graphs visit: Projections
38 Explanation of Flow Comparison Charts The flow comparison charts were developed to provide a quick comparison between the previous years observed hydrograph, cumulative seasonal discharge, the current streamflow forecasts, and the current years observed discharge (both hydrograph and cumulative discharge, as the season progresses). Forecast points for these products were generally chosen to be lower in the basin to best represent the basin-wide streamflow response for the season; the true degree of representativeness will vary between basins. When making comparisons of how the shape of the hydrograph relates to the monthly (and seasonal) cumulative discharges it is important to note that the hydrograph represents observed daily flows at the forecast point while the cumulative values may be adjusted for changes in reservoir storage and diversions to best represent what would be natural flows if these impoundments and diversions did not exist. This product can provide additional guidance regarding how to most wisely utilize the five exceedance forecasts based on past observations, current trends, and future uncertainty for a wide variety of purposes and water users. The left y-axis represents values of adjusted cumulative discharge (KAF). This axis is to be used for comparing the current and previous years to the current five volumetric seasonal exceedance forecasts. This graphic only displays the previous years data but data for the current water year will be added as the season progresses. The legend displays the symbology and color schemes for the various parameters represented. Exceedance forecasts represent total cumulative discharge for the April through July time period with the exception of the Rio Grande at Wagon Wheel Gap (Apr-Sep). The right y-axis represents observed daily average discharge at the forecast point of interest. This graphic only displays the previous years data but data for the current water year will be added as the Season progresses.
39 How Forecasts Are Made For more water supply and resource management information, contact: Brian Domonkos Snow Survey Supervisor USDA, Natural Resources Conservation Service Denver Federal Center, Bldg 56, Rm 264 PO Box Denver, CO Phone (72) Website: Most of the annual streamflow in the western United States originates as snowfall that has accumulated in the mountains during the winter and early spring. As the snowpack accumulates, hydrologists estimate the runoff that will occur when it melts. Measurements of snow water equivalent at selected manual snow courses and automated SNOTEL sites, along with precipitation, antecedent streamflow, and indices of the El Niño / Southern Oscillation are used in computerized statistical and simulation models to prepare runoff forecasts. Unless otherwise specified, all forecasts are for flows that would occur naturally without any upstream influences. Forecasts of any kind, of course, are not perfect. Streamflow forecast uncertainty arises from three primary sources: (1) uncertain knowledge of future weather conditions, (2) uncertainty in the forecasting procedure, and (3) errors in the data. The forecast, therefore, must be interpreted not as a single value but rather as a range of values with specific probabilities of occurrence. The middle of the range is expressed by the 5% exceedance probability forecast, for which there is a 5% chance that the actual flow will be above, and a 5% chance that the actual flow will be below, this value. To describe the expected range around this 5% value, four other forecasts are provided, two smaller values (9% and 7% exceedance probability) and two larger values (3%, and 1% exceedance probability). For example, there is a 9% chance that the actual flow will be more than the 9% exceedance probability forecast. The others can be interpreted similarly. The wider the spread among these values, the more uncertain the forecast. As the season progresses, forecasts become more accurate, primarily because a greater portion of the future weather conditions become known; this is reflected by a narrowing of the range around the 5% exceedance probability forecast. Users should take this uncertainty into consideration when making operational decisions by selecting forecasts corresponding to the level of risk they are willing to assume about the amount of water to be expected. If users anticipate receiving a lesser supply of water, or if they wish to increase their chances of having an adequate supply of water for their operations, they may want to base their decisions on the 9% or 7% exceedance probability forecasts, or something in between. On the other hand, if users are concerned about receiving too much water (for example, threat of flooding), they may want to base their decisions on the 3% or 1% exceedance probability forecasts, or something in between. Regardless of the forecast value users choose for operations, they should be prepared to deal with either more or less water. (Users should remember that even if the 9% exceedance probability forecast is used, there is still a 1% chance of receiving less than this amount.) By using the exceedance probability information, users can easily determine the chances of receiving more or less water.
40
Announcement of Class and Component Prices United States Department of Agriculture
 Announcement of Class and Component s United States Department of Agriculture Dairy Programs Market Information Branch CLS-0116 January 2016 Highlights Class II was $14.19 per hundredweight for the month
Potato Stocks. Potato Stocks Down 9 Percent From January 2008
 Washington, D.C. Potato Released uary, 00, by the National Agricultural Statistics Service (NASS),, U.S. Department of Agriculture. For information on Potato call Faye Propsom at (0) 0-, office hours :00
Water Year 2001 in Northern California: Have the Good Years Ended?
 Water Year 21 in Northern California: Have the Good Years Ended? Maurice Roos Abstract For the second water season in a row, precipitation and snowpack accumulation from October through December were far
USING PROBABILISTIC FORECASTS TO IMPROVE PLANNING AND OPERATIONS FOR WATER RESOURCES SYSTEMS
 USING PROBABILISTIC FORECASTS TO IMPROVE PLANNING AND OPERATIONS FOR WATER RESOURCES SYSTEMS W. JOSH WEISS, PH.D., P.E. jweiss@hazenandsawyer.com 2013 Susquehanna Water Science Forum October 7, 2013 OUTLINE
COMPARISON OF FIXED & VARIABLE RATES (25 YEARS) CHARTERED BANK ADMINISTERED INTEREST RATES - PRIME BUSINESS*
 CHARTERED BANK ADMINISTERED INTEREST RATES - PRIME BUSINESS*") COMPARISON OF FIXED & VARIABLE RATES (25 YEARS) 2 Fixed Rates Variable Rates FIXED RATES OF THE PAST 25 YEARS AVERAGE RESIDENTIAL MORTGAGE LENDING RATE - 5 YEAR* (Per cent) Year Jan Feb Mar Apr May Jun
COMPARISON OF FIXED & VARIABLE RATES (25 YEARS) 2 Fixed Rates Variable Rates FIXED RATES OF THE PAST 25 YEARS AVERAGE RESIDENTIAL MORTGAGE LENDING RATE - 5 YEAR* (Per cent) Year Jan Feb Mar Apr May Jun
Watershed Rehabilitation Program in Texas
 Watershed Rehabilitation Program in Texas 1 Dams Constructed by Year (nationwide) 700 600 500 PL-566 Pilot/RC&D PL-534 400 300 200 100 0 48 51 54 57 60 63 66 69 72 75 78 81 84 87 90 93 96 99 Year 2 Number
AT&T Global Network Client for Windows Product Support Matrix January 29, 2015
 AT&T Global Network Client for Windows Product Support Matrix January 29, 2015 Product Support Matrix Following is the Product Support Matrix for the AT&T Global Network Client. See the AT&T Global Network
Great Plains and Midwest Climate Outlook 19 March 2015
 Great Plains and Midwest Climate Outlook 19 March 2015 Wendy Ryan Assistant State Climatologist Colorado State University wendy.ryan@colostate.edu Grass fire in SE Nebraska 13 March 2015 General Information
AZ EGER-PATAK HIDROLÓGIAI VIZSGÁLATA, A FELSZÍNI VÍZKÉSZLETEK VÁRHATÓ VÁLTOZÁSÁBÓL ADÓDÓ MÓDOSULÁSOK AZ ÉGHAJLATVÁLTOZÁS HATÁSÁRA
 AZ EGER-PATAK HIDROLÓGIAI VIZSGÁLATA, A FELSZÍNI VÍZKÉSZLETEK VÁRHATÓ VÁLTOZÁSÁBÓL ADÓDÓ MÓDOSULÁSOK AZ ÉGHAJLATVÁLTOZÁS HATÁSÁRA GÁBOR KEVE 1, GÉZA HAJNAL 2, KATALIN BENE 3, PÉTER TORMA 4 EXTRAPOLATING
DISTRICT VALUES STATEMENTS, GOALS, ACTION ITEMS, AND ONGOING TASKS FOR 2015 Adopted by the Board of Directors December 10, 2014. Values Statements.
 DISTRICT VALUES STATEMENTS, GOALS, ACTION ITEMS, AND ONGOING TASKS FOR 2015 Adopted by the Board of Directors December 10, 2014 Values Statements. The Board opposes any new transfers of water from the
A Guide for the Development of Purchasing Cooperatives
 A Guide for the Development of Purchasing Cooperatives Abstract This report gives an overview on the variety of purchasing cooperatives that are organized for the purpose of reducing costs and improving
Climate, Drought, and Change Michael Anderson State Climatologist. Managing Drought Public Policy Institute of California January 12, 2015
 Climate, Drought, and Change Michael Anderson State Climatologist Managing Drought Public Policy Institute of California January 12, 2015 Oroville Reservoir January 2009 Presentation Overview The Rules
Climatography of the United States No. 20 1971-2000
 Climate Division: CA 6 NWS Call Sign: SAN Month (1) Min (2) Month(1) Extremes Lowest (2) Temperature ( F) Lowest Month(1) Degree s (1) Base Temp 65 Heating Cooling 100 Number of s (3) Jan 65.8 49.7 57.8
CE394K GIS IN WATER RESOURCES TERM PROJECT REPORT
 CE394K GIS IN WATER RESOURCES TERM PROJECT REPORT Soil Water Balance in Southern California Cheng-Wei Yu Environmental and Water Resources Engineering Program Introduction Historical Drought Condition
Economic Update as of June 30, 2016
 MACRO Report: Review of Wyoming s Economy Economic Update as of June 30, The MACRO Report is a quarterly publication comprised of charts focusing on energy, employment, state revenues, and other indicators
File Code: 2430 Date: September 25, 2015
 Logo Department Name Agency Organization Organization Address Information United States Forest Chequamegon-Nicolet National Forest 500 Hanson Lake Road Department of Service Supervisor's Office Rhinelander,
Climatography of the United States No. 20 1971-2000
 Climate Division: CA 4 NWS Call Sign: Month (1) Min (2) Month(1) Extremes Lowest (2) Temperature ( F) Lowest Month(1) Degree s (1) Base Temp 65 Heating Cooling 1 Number of s (3) Jan 59.3 41.7 5.5 79 1962
JULY 15-16, 2015 Board Meeting Agenda
 John W. Hickenlooper Governor Mike King DNR Executive Director James Eklund CWCB Director JULY 15-16, 2015 Board Meeting Agenda A meeting of the CWCB will be held on Wednesday, July 15, 2015 commencing
WHAT THE CURRENT DROUGHT MEANS FOR THE FUTURE OF WATER MANAGEMENT IN COLORADO
 WHAT THE CURRENT DROUGHT MEANS FOR THE FUTURE OF WATER MANAGEMENT IN COLORADO Horsetooth Reservoir and Dam S Fk S Platte at Arena Daniel F. Luecke John Morris Lee Rozaklis, Hydrosphere Resource Consultants,
Business. Program Opportunities. Rural Lender s Roundtable December 4, 2013 Washington, DC
 Business Program Opportunities Rural Lender s Roundtable December 4, 2013 Washington, DC Today s Presenters PANDOR H. HADJY, DEPUTY ADMINISTRATOR BUSINESS PROGRAMS JOHN H. BROUSSARD, DIRECTOR BUSINESS
FSA can guarantee OLs or FO loans up to $1,392,000 (amount adjusted annually based on inflation).
.") Guaranteed Loan Program Loan Purposes Guaranteed Ownership Loans Guaranteed Farm Ownership (FO) Loans may be made to purchase farmland, construct or repair buildings and other fixtures, develop farmland
Guaranteed Loan Program Loan Purposes Guaranteed Ownership Loans Guaranteed Farm Ownership (FO) Loans may be made to purchase farmland, construct or repair buildings and other fixtures, develop farmland
Illinois Child Care Wellness Team Nutrition Training Subgrants
 Illinois Child Care Wellness Team Nutrition Training Subgrants Illinois Child Care Wellness TNT Subgrants Informational Webinar February 20, 2014 Illinois State Board of Education Nutrition and Wellness
Analysis One Code Desc. Transaction Amount. Fiscal Period
 Analysis One Code Desc Transaction Amount Fiscal Period 57.63 Oct-12 12.13 Oct-12-38.90 Oct-12-773.00 Oct-12-800.00 Oct-12-187.00 Oct-12-82.00 Oct-12-82.00 Oct-12-110.00 Oct-12-1115.25 Oct-12-71.00 Oct-12-41.00
Case 2:08-cv-02463-ABC-E Document 1-4 Filed 04/15/2008 Page 1 of 138. Exhibit 8
 Case 2:08-cv-02463-ABC-E Document 1-4 Filed 04/15/2008 Page 1 of 138 Exhibit 8 Case 2:08-cv-02463-ABC-E Document 1-4 Filed 04/15/2008 Page 2 of 138 Domain Name: CELLULARVERISON.COM Updated Date: 12-dec-2007
Information Description: AG-LHAM-S-13-0100 Bid invitation number: 2000001928 Purchasing Group: AMS-Livestock
 United States Department of Agriculture 1400 Independence Avenue, S.W. # Room 3522 Mailstop Code 0256 Washington, DC 20036 Purchasing Group: AMS-Livestock Bid invitation Overview Bid Timezone: Central
Climate Change. Lauma M. Jurkevics - DWR, Southern Region Senior Environmental Scientist
 Climate Change A n o t h e r F a c t o r i n M a n a g i n g S o u t h e r n C a l i f o r n i a s W a t e r R e s o u r c e s Lauma M. Jurkevics - DWR, Southern Region Senior Environmental Scientist USEPA-Region
Domestic Violence Assistance Programs by County in Colorado
 Domestic Violence Assistance Programs by County in Colorado To update this list, please call the Northwest Colorado Legal Services Project at 1-800-521-6968. County Program/Location Hotline Adams Alamosa
Consumer ID Theft Total Costs
 Billions Consumer and Business Identity Theft Statistics Business identity (ID) theft is a growing crime and is a growing concern for state filing offices. Similar to consumer ID theft, after initially
Purpose of the water security outlook
 Water Security Outlook December 2015 Purpose of the water security outlook The Water Security Outlook (WSO) is an annual update to Barwon Water s Water Supply Demand Strategy (WSDS), published in 2012.
An Investigation of Potential Hydrologic and Management Impacts on the Bull Run System
 The Impacts of Climate Change on Portland's Water Supply: An Investigation of Potential Hydrologic and Management Impacts on the Bull Run System Dr. Richard N. Palmer and Margaret Hahn Department of Civil
Introduction to Raster Graphics and Applications
 Data Visualization Workshop May 7, 2015 Introduction to Raster Graphics and Applications Richard Koehler, PhD, PH NOAA, Boulder, CO richard.koehler@noaa.gov Source: usgs.gov Source: nrcs.gov Source: noaa.gov
Climatography of the United States No. 20 1971-2000
 Climate Division: CA 2 NWS Call Sign: SAC Month (1) Min (2) Month(1) Extremes Lowest (2) Temperature ( F) Lowest Month(1) Degree s (1) Base Temp 65 Heating Cooling 100 Number of s (3) Jan 53.8 38.8 46.3
Arizona Climate Summary February 2015 Summary of conditions for January 2015
 Arizona Climate Summary February 2015 Summary of conditions for January 2015 January 2015 Temperature and Precipitation Summary January 1 st 14 th : January started off with a very strong low pressure
Biotechnology Quality Management System Program
 United States Department of Agriculture Animal and Plant Health Inspection Service Program Aid No. 2056 Biotechnology Quality Management System Program Improving the Management of Regulated Genetically
ORGANIZATION NAME HUB/SITE/SHOP REGIONS. Advanced Patient Advocacy Assistance Site Denver Metro Area
 Advanced Patient Advocacy Assistance Site Denver Metro Area Colorado AIDS Drug Assistance Program Assistance Site Statewide Aurora Comprehensive Community Mental Health Assistance Site Denver Metro Center:
FLOOD FORECASTING PRACTICE IN NORTHERN CALIFORNIA
 FLOOD FORECASTING PRACTICE IN NORTHERN CALIFORNIA California Department of Water Resources Post Office Box 219000, Sacramento, California 95821 9000 USA By Maurice Roos, Chief Hydrologist ABSTRACT Although
Enhanced Vessel Traffic Management System Booking Slots Available and Vessels Booked per Day From 12-JAN-2016 To 30-JUN-2017
 From -JAN- To -JUN- -JAN- VIRP Page Period Period Period -JAN- 8 -JAN- 8 9 -JAN- 8 8 -JAN- -JAN- -JAN- 8-JAN- 9-JAN- -JAN- -JAN- -JAN- -JAN- -JAN- -JAN- -JAN- -JAN- 8-JAN- 9-JAN- -JAN- -JAN- -FEB- : days
Based on Chapter 11, Excel 2007 Dashboards & Reports (Alexander) and Create Dynamic Charts in Microsoft Office Excel 2007 and Beyond (Scheck)
 and Create Dynamic Charts in Microsoft Office Excel 2007 and Beyond (Scheck)") Reporting Results: Part 2 Based on Chapter 11, Excel 2007 Dashboards & Reports (Alexander) and Create Dynamic Charts in Microsoft Office Excel 2007 and Beyond (Scheck) Bullet Graph (pp. 200 205, Alexander,
Reporting Results: Part 2 Based on Chapter 11, Excel 2007 Dashboards & Reports (Alexander) and Create Dynamic Charts in Microsoft Office Excel 2007 and Beyond (Scheck) Bullet Graph (pp. 200 205, Alexander,
Burnt River Black River and Gull River Flood Contingency Plan
 Burnt River Black River and Gull River Flood Contingency Plan Objective: The objective of this plan is to preplan and prepare for flooding events in the Burnt River, Black River and Gull River area of
Information Description: AG-LHAM-S-14-0005 Bid invitation number: 2000002177 Purchasing Group: AMS-Livestock
 United States Department of Agriculture 1400 Independence Avenue, S.W. # Room 3522 Mailstop Code 0256 Washington, DC 20036 Purchasing Group: AMS-Livestock Bid invitation Overview Bid Timezone: Central
The Conservation Reserve Program: 45th Signup Results
 Farm Service Agency The Conservation Reserve Program: 45th Signup Results U.S Department of Agriculture Farm Service Agency Conservation and Environmental Program Division 1400 Independence Ave., SW, Room
PIPELINE EMERGENCY CONTACT DIRECTORY
 Adams Kinder Morgan CIG - Eastern CO and WY (877) 712-2288 (303) 261-4296 Suncor Energy (U.S.A.) Pipeline Company (866) 978-6267 (307) 775-8101 Sinclair Pipeline Company (800) 321-3994 (307) 328-3643 Hazardous
Addressing Declining Elevations in Lake Mead
 Integrated Resource Planning Advisory Committee July 23, 2014 Addressing Declining Elevations in Lake Mead 1 Meeting Topics Drought update Attribute finalization Interbasin Cooperation Intake Pumping Station
1. Introduction. 2. User Instructions. 2.1 Set-up
 1. Introduction The Lead Generation Plan & Budget Template allows the user to quickly generate a Lead Generation Plan and Budget. Up to 10 Lead Generation Categories, typically email, telemarketing, advertising,
AUTHORIZED DEALER LIST BY COUNTY
 ADAMS BOULDER 5350 Manhattan Circle, Ste. 104 Boudler, CO 80303 Phone: 303-444-5582 ALAMOSA ARAPAHOE ARCHULETA BACA BENT BROOMFIELD CHAFFEE CLEAR CREEK CONEJOS COSTILLA 43 Contract Number: 98526YYY08M
Colorado Travel Impacts 1996-2014p
 Colorado Travel Impacts 1996-2014p Image Credit: Matt Inden/Miles June 2015 Prepared for the Colorado Tourism Office Denver, Colorado THE ECONOMIC IMPACT OF TRAVEL ON COLORADO 1996-2014P June 2015 prepared
FOOD SERVICE ADMINISTRATIVE POLICY NO. 5 SCHOOL YEAR 2014-2015
 RICK SNYDER GOVERNOR STATE OF MICHIGAN DEPARTMENT OF EDUCATION LANSING FOOD SERVICE ADMINISTRATIVE POLICY NO. 5 SCHOOL YEAR 2014-2015 MICHAEL P. FLANAGAN STATE SUPERINTENDENT SUBJECT: Civil Rights Compliance
Rural America At A Glance
 United States Department of Agriculture Rural America At A Glance 2014 Edition Overview While the U.S. economy is now in its sixth year of recovery from the Great Recession of 2007-09, its performance
Procurement. TASN June 23, 2015. Presented by: Jackie Cantu, Compliance Coordinator Elizabeth Gonzales, Commodity Operations Director
 Procurement TASN June 23, 2015 Presented by: Jackie Cantu, Compliance Coordinator Elizabeth Gonzales, Commodity Operations Director Acknowledgment Statement 2 You understand and acknowledge that: the training
Member. programs and services
 Member programs and services La Plata Electric Association provides its members safe, reliable electricity at the lowest reasonable cost while being environmentally responsible. Save this for reference.
CORN IS GROWN ON MORE ACRES OF IOWA LAND THAN ANY OTHER CROP.
 CORN IS GROWN ON MORE ACRES OF IOWA LAND THAN ANY OTHER CROP. Planted acreage reached a high in 1981 with 14.4 million acres planted for all purposes and has hovered near 12.5 million acres since the early
Section 5 CLIMATE TABLES
 Section Section CLIMATE SOURCES OF DATA... -1 HISTORICAL CONTEXT... -1 PRECIPITATION... -2 TEMPERATURES... -3 EVAPOTRANSPIRATION... -3 WIND SPEED AND DIRECTION... -4 DEGREE DAYS...-4 CONCLUSIONS AND RECOMMENDATIONS...
CITY OF TULLAHOMA SMALL BUSINESS REVOLVING LOAN FUND
 CITY OF TULLAHOMA SMALL BUSINESS REVOLVING LOAN FUND The Small Business Revolving Loan Program is an economic development tool administered by the City of Tullahoma. The program can provide loans for small
MODIFICATION OF GRANT OR AGREEMENT
 ~. ~ USDA Forest Servtce MODIFICATION OF GRANT OR AGREEMENT PAGE OF PAGES 1 I 4 I. U.S. FOREST SERVICE GRANT/AGREEMENT 2. RECIPIENT/COOPERATOR GRANT or 3. MODIFICATION NUMBER: NUMBER: AGREEMENT NUMBER,
Grain Transportation Quarterly Updates
 Grain Transportation Quarterly Updates Truck Advisory Transportation and Marketing Programs Transportation Services Division www.ams.usda.gov/agtransportation Table 1: U.S. Grain Truck Market, 3 rd Quarter
Information Description: AG-PEGG-S-14-0012 Bid invitation number: 2000002173
 United States Department of Agriculture 1400 Independence Avenue, S.W. # Room 3522 Mailstop Code 0256 Washington, DC 20036 Purchasing Group: AMS Poultry Bid invitation Overview Bid Timezone: Central Time
Accident & Emergency Department Clinical Quality Indicators
 Overview This dashboard presents our performance in the new A&E clinical quality indicators. These 8 indicators will allow you to see the quality of care being delivered by our A&E department, and reflect
Information Description: AG-PCHX-S-14-0025 Bid invitation number: 2000002241 Purchasing Group: AMS Poultry
 United States Department of Agriculture 1400 Independence Avenue, S.W. # Room 3522 Mailstop Code 0256 Washington, DC 20036 Purchasing Group: AMS Poultry Bid invitation Overview Bid Timezone: Central Time
Housing Highlights. A Snapshot of the Market in Summit County, CO. Key Findings. Key Indicators. May 2010. Rees Consulting, Inc.
 May 2010 Housing Highlights A Snapshot of the Market in Summit County, CO Key Indicators 2010 Median Income (4 persons) $87,200 Affordable Price $343,384 Affordable Rent $2,180 Median Price -- Single Family
CONSTRUCTION GENERAL PERMIT RISK ASSESSMENT R-FACTOR CALCULATION NOTIFICATION
 CONSTRUCTION GENERAL PERMIT RISK ASSESSMENT R-FACTOR CALCULATION NOTIFICATION NATIONAL POLLUTANT DISCHARGE ELIMINATION SYSTEM (NPDES) GENERAL PERMIT FOR STORM WATER DISCHARGES ASSOCIATED WITH CONSTRUCTION
How To Forecast Solar Power
 Forecasting Solar Power with Adaptive Models A Pilot Study Dr. James W. Hall 1. Introduction Expanding the use of renewable energy sources, primarily wind and solar, has become a US national priority.
Using Futures Markets to Manage Price Risk for Feeder Cattle (AEC 2013-01) February 2013
 February 2013") Using Futures Markets to Manage Price Risk for Feeder Cattle (AEC 2013-01) February 2013 Kenny Burdine 1 Introduction: Price volatility in feeder cattle markets has greatly increased since 2007. While
Using Futures Markets to Manage Price Risk for Feeder Cattle (AEC 2013-01) February 2013 Kenny Burdine 1 Introduction: Price volatility in feeder cattle markets has greatly increased since 2007. While
Climate of Illinois Narrative Jim Angel, state climatologist. Introduction. Climatic controls
 Climate of Illinois Narrative Jim Angel, state climatologist Introduction Illinois lies midway between the Continental Divide and the Atlantic Ocean, and the state's southern tip is 500 miles north of
Information Description: AG-PTKY-S-14-0026 Bid invitation number: 2000002245 Purchasing Group: AMS Poultry
 United States Department of Agriculture 1400 Independence Avenue, S.W. # Room 3522 Mailstop Code 0256 Washington, DC 20036 Purchasing Group: AMS Poultry Bid invitation Overview Bid Timezone: Central Time
STATE SUPPLEMENTAL NUTRITION ASSISTANCE PROGRAM PARTICIPATION RATES IN 2009 FOOD AND NUTRITION SERVICE
 Responsibility and Work Opportunity Reconciliation Act.... STATE SUPPLEMENTAL NUTRITION ASSISTANCE PROGRAM PARTICIPATION RATES IN 2009 FOOD AND NUTRITION SERVICE Recent studies have examined national participation
Trumbull Career and Technical Center 528 Educational Highway Warren, Ohio 44483 Toll Free 1-866-737-6925
 Trumbull Career and Technical Center 528 Educational Highway Warren, Ohio 44483 Toll Free 1-866-737-6925 Dear Parent/Guardian: Children need healthy meals to learn. TCTC offers healthy meals every school
2015 Climate Review for Puerto Rico and the U.S. Virgin Islands. Odalys Martínez-Sánchez
 2015 Climate Review for Puerto Rico and the U.S. Virgin Islands. Odalys Martínez-Sánchez 2015 can be described as a dry and hot year across Puerto Rico (PR) and the U.S. Virgin Islands (USVI). Below normal
THE WATER AGENCY, INC. Water Supply Update
 State Water Resources Control Board Suspends the Sacramento River Temperature Plan We all need to be aware that the SWRCB is causing real turmoil with its recent May 29th letter. The temporary grab of
MEAT GRADING AND CERTIFICATION BRANCH QUALITY MANUAL
 United States Department of Agriculture Marketing and Regulatory Programs Agricultural Marketing Service Livestock and Seed Program Meat Grading & Certification Branch MGC Instruction 800 May 9, 2005 Page
Integrated Pest Management (IPM)
") Integrated Pest Management (IPM) Georgia Conservation Practice Job Sheet 595 (5/12) Producer County Date Farm # Tract # Assisted By Prevent or mitigate on-site pesticide risks to pollinators and other
Integrated Pest Management (IPM) Georgia Conservation Practice Job Sheet 595 (5/12) Producer County Date Farm # Tract # Assisted By Prevent or mitigate on-site pesticide risks to pollinators and other
Come Join Us! Pacific Northwest Research Station USDA Forest Service. United States Department of Agriculture. Forest Service
 Come Join Us! Pacific Northwest Research Station USDA Forest Service United States Department of Agriculture Forest Service Pacific Northwest Research Station PNW-SM-005 April 2002 Come Join Us! DO YOU
Managing Cattle Price Risk With Futures and Options Contracts
 Managing Cattle Price Risk with Futures and Options Contracts Dr. John Lawrence, Extension Livestock Economist and Associate Professor, Iowa State University Department of Economics Alexander H. Smith,
BUDGET BASICS TRAINING TOPIC: CACFP BUDGET. Child and Adult Care Food Program (CACFP)
") BUDGET BASICS TRAINING TOPIC: CACFP BUDGET Child and Adult Care Food Program (CACFP) Acknowledgment Statement 2 You understand and acknowledge that: the training you are about to take does not cover the
BUDGET BASICS TRAINING TOPIC: CACFP BUDGET Child and Adult Care Food Program (CACFP) Acknowledgment Statement 2 You understand and acknowledge that: the training you are about to take does not cover the
FY 2015 Schedule at a Glance
 Coaching and Mentoring for Excellence Oct 21 23, 2014 $2,950 Residential Coaching and Mentoring for Excellence Apr 7 9, 2015 $2,400 Non-residential Coaching and Mentoring for Excellence May 27 29, 2015
Real Time Flood Alert System (RTFAS) for Puerto Rico
 for Puerto Rico") Prepared in cooperation with the Puerto Rico Emergency Management Agency (PREMA) Real Time Flood Alert System (RTFAS) for Puerto Rico Overview The Real Time Flood Alert System is a web-based computer program,
Prepared in cooperation with the Puerto Rico Emergency Management Agency (PREMA) Real Time Flood Alert System (RTFAS) for Puerto Rico Overview The Real Time Flood Alert System is a web-based computer program,
Nechako Fisheries Compensation Program. Annual Report. Executive Summary of Activities in 2014-2015 and Proposed Work Program for 2015-2016
 Nechako Fisheries Compensation Program Annual Report Executive Summary of Activities in 2014-2015 and Proposed Work Program for 2015-2016 March, 2015 Contents Page Administration... 1 Technical Committee
Proposal to Reduce Opening Hours at the Revenues & Benefits Coventry Call Centre
 Proposal to Reduce Opening Hours at the Revenues & Benefits Coventry Call Centre Proposal To change the opening hours of the Revenues & Benefits Call Centre to 9am until 5pm Monday to Friday with effect
USDA is an equal opportunity provider and employer.
 This project has been funded at least in part with Federal funds from the U.S. Department of Agriculture. The contents of this publication do not necessarily reflect the view or policies of the U.S. Department
SEAMLESS SUMMER OPTION (SSO) KDE DIVISION OF SCHOOL AND COMMUNITY NUTRITION 2015
 KDE DIVISION OF SCHOOL AND COMMUNITY NUTRITION 2015") SEAMLESS SUMMER OPTION (SSO) KDE DIVISION OF SCHOOL AND COMMUNITY NUTRITION 2015 SEAMLESS SUMMER OPTION (SSO) Purpose: To encourage more School Food Authorities to provide meals during the summer. SEAMLESS
SEAMLESS SUMMER OPTION (SSO) KDE DIVISION OF SCHOOL AND COMMUNITY NUTRITION 2015 SEAMLESS SUMMER OPTION (SSO) Purpose: To encourage more School Food Authorities to provide meals during the summer. SEAMLESS
Estuary Time Series Evaluations, Part 1
 Meeting of the Guadalupe, San Antonio, Mission, and Aransas Rivers and Mission, Copano, Aransas, and San Antonio Bays Basin and Bay Area Stakeholder Committee (BBASC) April 19, 211 Estuary Time Series
SERVICE AREAS OF COLORADO PUBLIC INSTITUTIONS OF HIGHER EDUCATION
 SECTION I PART N SERVICE AREAS OF COLORADO PUBLIC INSTITUTIONS OF HIGHER EDUCATION 1.00 Introduction The Colorado Commission on Higher Education is charged by statute to define geographic and programmatic
Wheat Transportation Profile
 Wheat Transportation Profile Agricultural Marketing Service / Transportation and Marketing Programs November 2014 Marina R. Denicoff Marvin E. Prater Pierre Bahizi Executive Summary America s farmers depend
Administrative Policy Reminders. Changing Bank Accounts. Civil Rights/Discrimination Complaint Process. Nondiscrimination Statement
 Farm Service Agency Annual Policy Reminders Farm Service Agency works hard to get information to you in a timely manner regarding our programs and policies. This document provides a list of important FSA
Managing Cattle Price Risk with Futures and Options Contracts
 Managing Cattle Price Risk with Futures and Options Contracts Dr. John Lawrence, Extension Livestock Economist and Professor, Laura A. Bortz, Undergraduate Research Assistant, Iowa State University Department
Subsidy Enrollments among Accredited Child Care Providers in Maryland
 Subsidy Enrollments among Accredited Child Care Providers in Maryland November 18, 20 Prepared for the Division of Early Childhood Development Maryland State Department of Education John Spears and Merve
Southern AER Atmospheric Education Resource
 Southern AER Atmospheric Education Resource Vol. 9 No. 5 Spring 2003 Editor: Lauren Bell In this issue: g Climate Creations exploring mother nature s remote control for weather and Climate. g Crazy Climate
Estimating Potential Reduction Flood Benefits of Restored Wetlands
 Estimating Potential Reduction Flood Benefits of Restored Wetlands Kenneth W. Potter University of Wisconsin Introduction Throughout the summer of 1993 a recurring question was the impact of wetland drainage
Hydrologic Modeling using HEC-HMS
 Hydrologic Modeling using HEC-HMS Prepared by Venkatesh Merwade School of Civil Engineering, Purdue University vmerwade@purdue.edu April 2012 Introduction The intent of this exercise is to introduce you
Lecture 4: Streamflow and Stream Gauging
 Lecture 4: Streamflow and Stream Gauging Key Questions 1. What is stream discharge and what controls its magnitude? 2. What is a hydrograph? 3. Where is the velocity highest in a stream? 4. Where is the
Image source: www.rivers.gov. Visual Data Analytics, LLC
 AWRA Spring Specialty AWRA Conference Spring Specialty on GIS Conference and Water on Resources GIS and Water VIII Resources May 13, 2014 Using a Temporal Information System for Visualization and Analysis
BY THE NUMBERS: THE FIRST OPEN ENROLLMENT OF CONNECT FOR HEALTH COLORADO October 2013 through March 2014*
 BY THE NUMBERS: THE FIRST OPEN ENROLLMENT OF CONNECT FOR HEALTH COLORADO October 2013 through March 2014* More than 305,000 Coloradans enrolled in health insurance. More than 127,000 are covered through
International Baccalaureate World Schools
 California Department of Education School Nutrition Programs Nutrition Services Division Pricing Letter to Household (REV. 6/2015) International Baccalaureate World Schools Primary Years, Middle Years,
Water Resources Collections and Archives University of California
 Water Resources Collections and Archives University of California Title: Effects of climate change on the hydrology of upper Alameda Creek Author: Klausmeyer, Kirk, University of California, Berkeley Publication
CARBON THROUGH THE SEASONS
 DESCRIPTION In this lesson plan, students learn about the carbon cycle and understand how concentrations of carbon dioxide (CO 2 ) in the Earth s atmosphere vary as the seasons change. Students also learn
LeSueur, Jeff. Marketing Automation: Practical Steps to More Effective Direct Marketing. Copyright 2007, SAS Institute Inc., Cary, North Carolina,
 Preface. Overview. PART 1: Marketing Financials. Chapter 1 Profit and Loss Fundamentals. Chapter 2 Profit and Loss Component Details. Chapter 3 Managing the P&L. Chapter 4 Measuring Marketing Effectiveness.
Women in Wildland Fire Boot Camp 2015
 OUTREACH NOTICE Women in Wildland Fire Boot Camp 2015 Application Deadline: Friday, February 13, 2015 Selected applicants will be notified by February 20, 2015 Have you ever wanted to start a career where
Windsor School Food Service
 Windsor School Food Service Date: 08/01/14 To: Parents/Guardians: From: Dana Plant, Director of Food Service RE: School Breakfast/Lunch Program Updates Dear Parents/Guardians of Children attending the
The Colorado College 2012-13 State of the Rockies Project:
 The Colorado College 2012-13 State of the Rockies Project: Water Friendly Futures for the Colorado River Basin Summer Field Work 2012 David Spiegel Oregon Idaho Rockies Field Work 2012 The State of the
i h & 8 th grade Parent/Student Back-to School Night August 20 5:30 p.m.
 SCHOOL REGISTRATION 2015-2016 Beech Street Pre-School New Student RegistrationlEnrollment - Starting August 19 you can pick up an application from 8:00-3:30 First Day of School August 31 8:00-11:00 a.m.l12:00-3:00