Online simulations of models for backward masking
|
|
|
- Emmeline Small
- 8 years ago
- Views:
Transcription
1 Online simulations of models for backward masking Gregory Francis 1 Purdue University Department of Psychological Sciences 703 Third Street West Lafayette, IN July 2002 Revised: 30 January 2003 Final revision: 03 April 2003 Key words: masking, metacontrast, models, simulation, vision Running head: Online simulations for masking 1 gfrancis@psych.purdue.edu; phone: This material is based upon work supported by the National Science Foundation under Grant No

2 Online simulations of masking 2 Abstract Five simulations of quantitative models of visual backward masking are available on the Internet at gfrancis/publications/backwardmasking/. The simulations can be run in a web browser that supports the Java programming language. This paper describes the motivation for making the simulations available and gives a brief introduction to how the simulations are used. The source code is available on the web page, and the paper describes how the code is organized.

3 Online simulations of masking 3 Introduction Backward masking occurs when a briefly presented visual target stimulus becomes difficult to see because of the appearance of a mask stimulus that follows the target. Backward masking has been investigated in thousands of studies with a variety of experimental manipulations (see Breitmeyer & Öğmen (2000) and Enns & Di Lollo (2000) for recent reviews). There are three reasons that interest in the properties of masking has been strong for decades. First, vision scientists use masking to explore the interaction of the target and mask signals and identify key properties of the mechanisms involved in visual perception. Second, cognitive psychologists use backward masking as a means of interrupting the processing of target information. It is known that processing of a target does not stop with the physical disappearance of the target stimulus, but that processing can continue for at least a second after the stimulus has turned off (Sperling, 1960). The presentation of a strong mask seems to halt further processing of the target stimulus as soon as the mask appears. Thus, by varying the timing between the offset of the target and the onset of the mask, the duration of processing can be controlled and the details of cognitive mechanisms analyzed. Third, the properties of masking have been used to investigate aspects of various types of mental diseases (e.g., Braff & Saccuzzo, 1981; Green, Nuechterlein & Mintz, 1994; Slaghuis & Curran, 1999). Patients sometimes respond quite differently than normals under masking conditions. Given the strong interest in masking and the frequency of its use as a tool for investigating perceptual, cognitive, and behavioral systems, it is perhaps surprising to note that there is currently no generally agreed upon theory of the mechanisms that are involved in producing masking effects. There is no shortage of theories, but none are generally believed to properly account for the key data in the field. Researchers who use masking as a tool to explore other issues generally have an implicit theory that the mask interrupts processing or interferes with detection of the target properties. However, these ideas are generally not rigorously investigated (usually because the researcher is actually interested in something other than masking per se). Even within the field of masking, theories are often only described verbally, and sometimes without a description of the underlying mechanisms that would need to exist

4 Online simulations of masking 4 to instantiate a theory. The field of masking would be enhanced if researchers understood and developed quantitative models of masking. A quantitative model is precisely defined and its properties can be demonstrated conclusively. This specificity allows a model to make predictions and for those predictions to be tested experimentally. These tests can, in turn, be used to further the development of the model and so initiate an upward spiral toward the creation of models that account for large amounts of data. In addition, quantitative models can be analyzed mathematically to further our understanding of the basic properties of the models. This latter analysis can help researchers who use masking as a tool to better understand how masking contributes to the primary effect they are studying. There are several quantitative models of backward masking. In the 1970s, two neural network models were investigated and shown to account for several properties of backward masking. Weisstein (1968, 1972) investigated a dual-channel neural network, while Bridgeman (1971, 1978) studied properties of a neural network with recurrent lateral inhibition. Anbar and Anbar (1982) elaborated a model of brightness perception to show that it accounted for some properties of backward masking. Francis (1997) showed that a neural model of cortical visual processing accounted for many properties of backward masking. Purushothaman, Öğmen and Bedell (2000) showed that a recurrent neural network could produce oscillations that accounted for new data in backward masking. Finally, Di Lollo, Enns and Rensink (2000) showed that a system with reentrant processing could account for their newly discovered object substitution masking effects. A recent analysis by Francis (2000) showed that, despite their differences, many of these models work by the same underlying principles. Although none of these models account for all of the data on backward masking, many of them use fairly simple principles to account for much of the experimental data. However, the contribution of the quantitative models appears to have not been recognized by many of the researchers that study or use backward masking. For example, Di Lollo et al. (2000) reported a new masking effect that they call object substitution. Di Lollo et al. suggested that a key property of this new masking effect ruled out existing theories of masking. The

5 Online simulations of masking 5 key effect was that strong masking could occur for a spatially impoverished mask (four dots around a target) when the target and mask had common onsets but the mask stayed on after the target disappeared. The new effect is quite interesting, and is a new experimental finding; however, Francis and Hermens (2002) showed through computer simulation that some of the quantitative models of masking can account for the effect without a change in parameters. Thus, even mathematically sophisticated researchers (Di Lollo and colleagues have developed their own quantitative models in other contexts) may not recognize the properties of existing quantitative models of backward masking. The problem is even more severe in fields that use masking as a tool to study other processes. Experimental studies that use masking to investigate some aspect of cognition rarely make reference to any of the models of backward masking. Likewise, clinical psychologists who study the effects of masking in mental disorders never use the quantitative models to explain their findings. This lack of reference to models is, perhaps, not surprising because the quantitative models are difficult to understand for individuals without a solid background in mathematics. Moreover, in many cases the researcher would need to build a simulation of a model in order to use it to interpret experimental data. Building a simulation is a nontrivial task that can be a source of frustration even for researchers who have received formal training in model simulation. When someone is using masking as an experimental tool to investigate something else, it is perhaps unreasonable to expect them to assign resources toward development of a computer simulation of quantitative models of backward masking. A recent study by Francis (2000) developed computer simulations of several quantitative models of backward masking. Most of these simulations were written in the Java programming language, so they can run on a variety of computers and they can be easily distributed in web browsers on the Internet. In an effort to promote understanding of the quantitative models of backward masking, I have created a graphical user interface that allows anyone to use these models. The model simulations are available on the web at gfrancis/publications/backwardmasking/. Use of the models requires a Java-enabled web browser (this includes most web browsers) and ac-

6 Online simulations of masking 6 cess to the Internet. Full source code for the programs is also available as a download from the web page. The desired effect of making the model simulations widely available is two-fold. First, it is hoped that researchers who want to learn more about quantitative models will use the simulations to help them better understand the properties of the models. There is sometimes a bootstrapping problem with model comprehension, where it is difficult to understand a model without a simulation, but it is nearly impossible to build a simulation without understanding the model. Having an example of a model simulation available might make it easier to understand the model properties. Second, it is hoped that having the simulations readily available will pique the interest of experimentalists to see if the models can account for properties of their data. Such interest may motivate an experimentalist to further explore the characteristics of the models and lead to more interpretations of experimental results with quantitative modeling. Models available The models available on the web site include only those models that do not require excessive amounts of computation. In general, a few minutes was considered an upper limit on how long people would wait before getting results from a simulation run. Models that meet this requirement includes those discussed in Weisstein (1972), Bridgeman (1978), Anbar and Anbar (1982), Francis (2000), and Di Lollo et al. (2000). Not included are models by Francis (1997) and Purushothaman et al. (2000) because these models often must run for hours or days to generate results of interest. A Java applet resides on the web page to display buttons with names for the different models. Clicking on one of the buttons will cause a new window to appear with a graphical user interface that allows the user to modify stimulus parameters and model parameters. For example, Figure 1 shows the window that appears after clicking on the Reentrant processing button. (All screen shots were created while running the simulations on a computer running Mac OS X, but the programs also work on MS Windows and Unix systems with web browsers

7 Online simulations of masking 7 that support Java.) - Figure 1 - Each simulation has the same type of GUI. The window is given a title that indicates which model is being simulated. The left side of the window contains information about an independent variable. This is the variable that is systematically varied during a simulation run. After every run of a simulation, a graph is shown that plots the model s measure of the target percept strength as a function of the individual variable. Target percept strength is a model measure that corresponds to the visibility of the target. In different experiments it would correspond to target brightness, percent correct detections, percent correct discriminations, and so on. The right side of the window lists each model parameter and stimulus parameter that can be set by the user. The bottom of the window lets the user set details of the simulation run. The checkbox labeled Clear plot determines whether the next simulation run should be displayed with previous simulation runs or if it should generate an entirely new data plot. The text field labeled Simulation name allows the user to enter a name for the next simulation run. This name appears as a label in the legend of the data plot. Finally, clicking on the Start simulation button starts the simulation for the given set of parameters. As the simulation proceeds, this button s label is updated to roughly indicate the simulation s progress. For every parameter, there is a button labeled Description. When this button is pressed, a window appears that provides a textual description of what the parameter corresponds to in the model and/or simulation. This information is provided to make it easier for the user to link the parameters in the simulation with the details of the models given in their original publications. The worth of the simulations can be described by example. The first example will focus on the reentrant processing model of Di Lollo et al. (2000) because it is a new model and there is currently substantial interest in the issues raised by Di Lollo et al. A key property of the model of Di Lollo et al. (2000) concerns the effect of varying the number of distracter items when the target is presented. In the model this is coded by the parameter n. Figure 2a

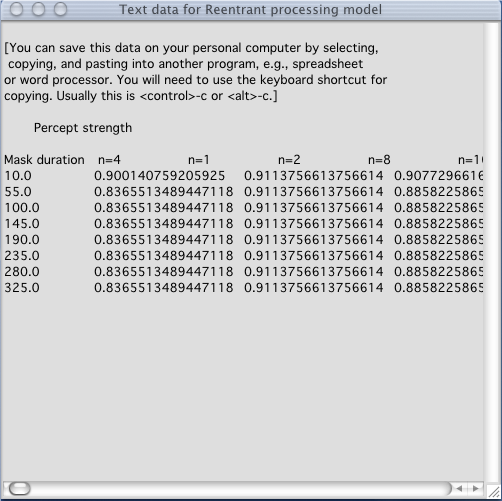
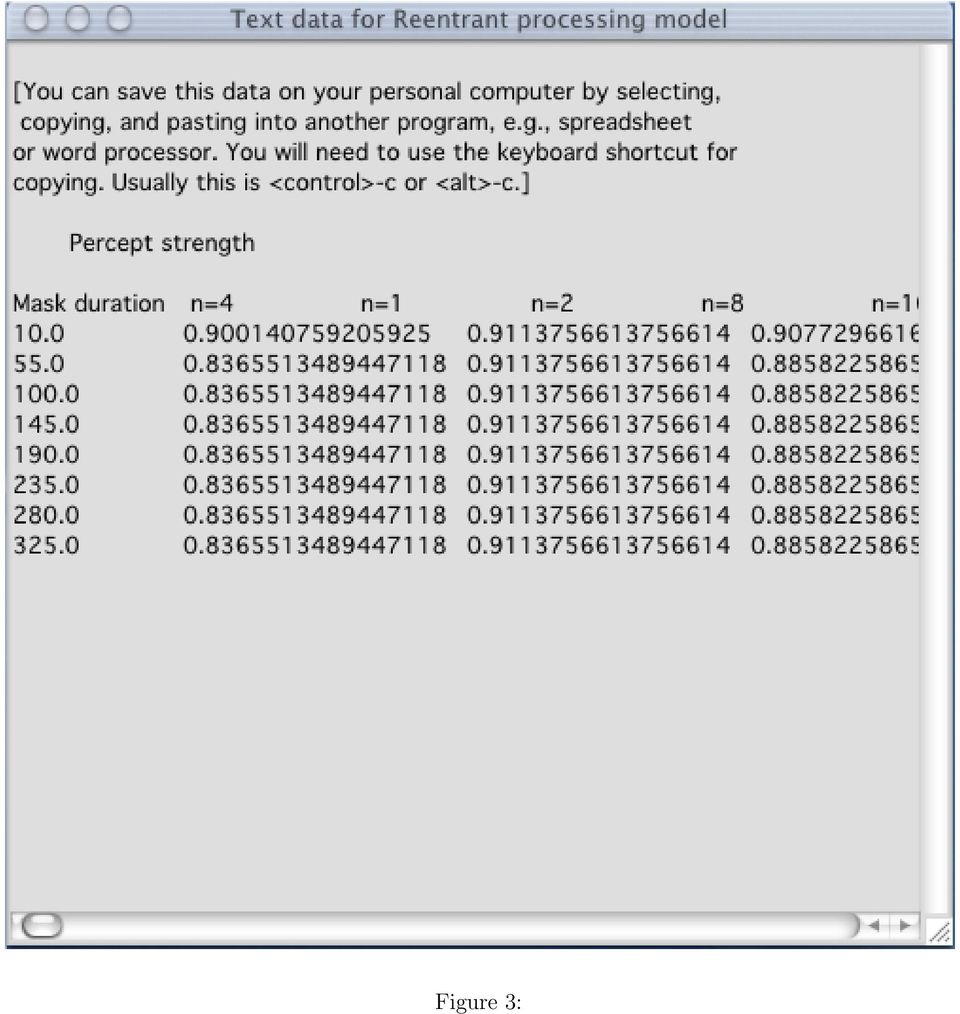
8 Online simulations of masking 8 shows the data plot that appears after giving the simulation run the name n=4 and clicking on the Start simulation button. Additional simulation results are added to the graph by changing the parameter n, changing the simulation name, and unchecking the Clear plot checkbox. Figures 2b-d show the model output as simulations for other values of n are added to the graph. - Figure 2 - Figure 2d is a replication of the results reported by Di Lollo et al. (2000) in their Figure 15A. It shows the effect of varying mask duration for different numbers of distracters in the target field. The main result is that there is an interaction of set size and mask duration. The curves in Figure 2 look slightly different than the curves in Figure 15A of Di Lollo et al., but this is because the values of mask durations are slightly different in the two sets of simulations. Because the graph generated by the program is not of publication quality, the program also provides the simulated data in a plain text format. A menu option called Show Data is available on each plot window. Selecting the Show data points menu item displays a new window that lists the data in a textual format, as in Figure 3. These data can be selected, copied, and pasted into other programs (e.g., word processor, spreadsheet, text editor). Because columns are tab-delimited, pasting the selected data into a spreadsheet should cause each number to be placed in its own cell. The data can thus be ported into the user s favorite plotting program to create higher quality graphs. The data an also be ported into a statistical analysis program for comparison to experimental data. - Figure 3 - The default parameters when a simulation is started always correspond to the parameters used in the original description of the model. However, a user can change these parameters to explore the abilities of the model in other situations. For example, although the reentrant model of Di Lollo et al. (2000) was originally designed to account for effects of mask duration with common onset masking and variability in the number of distracters with the target, a
 in their Figure 15A. It shows the effect of varying mask duration for different numbers of distracters in the target field.")
9 Online simulations of masking 9 researcher might be interested in seeing how it responds to variations in the SOA between the target and mask. A common experimental finding is that if the mask stimulus is weak relative to the target stimulus, the mask has its biggest effect at an intermediate SOA value. When target percept strength is plotted against SOA, the curve takes a u-shape. Accounting for the u-shaped masking function is considered a primary issue in the field of backward masking (Breitmeyer & Öğmen, 2000; Francis, 2000). Figure 4a shows the behavior of the model when the independent variable is SOA instead of mask duration. All the other parameters were the default values when the simulation started. The model predicts modest masking for common onset of the target and mask and no masking for other SOAs. This finding does not provide evidence against the model of Di Lollo et al. (2000) because it was designed to explain other data sets. Interestingly, with a change of parameters the model does seem to be able to produce u-shaped masking functions. By setting the target intensity to be 2.0 and λ = 0.95, the model produces the curve in Figure 4b, which shows the strongest masking occurs at intermediate SOA values. - Figure 4 - This simulation finding is interesting because it suggests that the Di Lollo et al. (2000) model, which was designed to account for common onset masking, might also be able to explain effects when the mask onset comes after the target offset. Of course, further research is needed to explore this possibility, and a simulation model is now available to support that research. Similar investigations can be made with the other model simulations. For example, Bridgeman s (1978) model uses recurrent lateral inhibition across a set of cells. The model includes longer time delays for inhibitory signals that must travel longer pixel distances. A researcher might wonder if the time delays are necessary to produce the model s main effect (the existence of a u-shaped masking function). This can be explored in the model by setting the weights for distances greater than one pixel equal to zero. With zero signal being sent for the longer distances, such a system will have no time delays. Figure 5 shows the masking functions produced for the default parameters and for the simulation without time delays.
.")
10 Online simulations of masking 10 Both produce a u-shaped masking function, which indicates that the time delays are not critical to producing the u-shaped masking function. - Figure 5 - As a final example, Francis (2000) identified a novel method, called efficient masking, for producing a u-shaped masking function. The default parameter values are those used in Francis (2003) to relate the model to experimental data. Figure 6a shows the kind of masking function produced by the model. - Figure 6 - A researcher might wonder if the efficient masking model could also account for the properties of common onset masking studied by Di Lollo et al. (2000). The answer is yes if one is willing to hypothesize that increases in set size lead to distributed attention which makes the mask signal have a larger impact on the target signal (see Francis & Hermens, 2002). Figure 6b shows simulation results that demonstrate this property. Source code Although one can use the simulation graphical user interface to vary all of the model parameters and to vary the stimulus, there are some situations where modification of the source code will be required. For example, one of the parameters in the model of Di Lollo et al. (2000) is interpreted as reflecting the rate at which items are searched in a visual display. For some of their simulations this rate was changed within a run of the simulation to indicate pre-cue and post-cue rates. The simulations reported here cannot duplicate this effect because the search rate can only be one value during a run of the simulation. However, it should be relatively easy for a programmer to modify the source code and allow for this possibility. More generally, a researcher may want to modify one of the models, which will require changes to the programming of the simulation. Thus, a discussion of how the source code is designed may be worthwhile. The simulation programs are written in the Java programming language. They can be run
.")
11 Online simulations of masking 11 as stand alone programs or, as has been discussed so far, in a web browser over the Internet. Java is an object oriented language, with each object defined as a class that contains data and methods that manipulate the data. Many of the classes define fairly general objects, for example, CloseableFrame.java defines a class that provides a window that closes upon request. Other classes do fairly complex operations. For example, SimPlotImage.java takes results from a simulation, draws an image of a data plot, and displays the image in a window. The classes of interest for researchers who want to elaborate or modify the simulations are usually named after the researcher(s) who created the models (the one exception is for the Efficient Masking model, which is not named after Francis (2000) in order to avoid confusion with a different model described in Francis (1997)). Thus, the classes are: AnbarAnbar.java, Bridgeman.java, DiLolloEtAl.java, EfficientMasking.java, and Weisstein.java. Each of these classes defines the variables, parameters, and equations that make up the simulation of the model. Every simulation program has a common design. The Java programming language has a convenient method of organizing similar types of programs using abstract classes. An abstract simulation class was defined and called Simulation.java. The abstract class defines variables and methods that must be part of every simulation. The classes that define a particular model extend the abstract class and immediately acquire the data variables defined by the abstract class. Each particular model class must also provide a definition for each method defined in the abstract class. This insures that each particular model has the basic properties of the abstract class. The advantage to this arrangement is apparent in the design of the graphical user interface (SimulationGUI.java). The type of model being simulated need not be specified for the graphical user interface. Since every model is a version of the simulation class, certain variables always exist and certain methods can always be called. Thus, if a new model simulation is created and it is defined as an extension of the abstract simulation class, the graphical user interface will automatically work with the new model simulation. Thus, to make a new model simulation, it is only necessary to define a class along the lines

12 Online simulations of masking 12 of one of the existing models. This involves identifying the parameters for the model and identifying the model calculations. Of course, knowledge of the Java programming language is necessary to make these types of changes. Conclusions A set of programs that simulates five models of backward masking is available on the Internet. The programs can either be run through a web browser, or the source code can be downloaded, compiled, and run on a local computer. The programs provide a common interface for interacting with each simulation. The model simulations will assist researchers interested in backward masking to explore the properties of these models and to thereby gain a better understanding of the types of interactions that may be involved in masking. The goal is to allow the properties of the quantitative models of backward masking to be understood and used by more researchers in the field of masking, experimentalists who use masking as a tool to study other aspects of cognition, and psychiatrists who relate masking effects to various mental conditions. By removing the need for these researchers to create their own simulations of the models, perhaps the researchers will be motivated to use quantitative models to generate novel interpretations of experimental data.

13 Online simulations of masking 13 References Anbar, S. & Anbar, D. (1982). Visual masking: A unified approach. Perception, 11, Braff, D.L. & Saccuzzo, D.P. (1981). Information processing dysfunction in paranoid schizophrenia: A two-factor deficits. American Journal of Psychiatry 138, Breitmeyer, B. & Öğmen, H. (2000). Recent models and findings in visual backward masking: A comparison, review, and update. Perception & Psychophysics, 62, Bridgeman, B. (1971). Metacontrast and lateral inhibition. Psychological Review, 78, Bridgeman, B. (1978). Distributed sensory coding applied to simulations of iconic storage and metacontrast. Bulletin of Mathematical Biology, 40, Di Lollo, V., Enns, J. T., & Rensink, R. A. (2000). Competition for consciousness among visual events: The psychophysics of reentrant visual processes. Journal of Experimental Psychology: General, 129, Enns, J. T. & Di Lollo, V. (2000). What s new in visual masking? Trends in Cognitive Sciences, 4, Francis, G. (1997). Cortical dynamics of lateral inhibition: Metacontrast masking. Psychological Review, 104, Francis, G. (2000). Quantitative theories of metacontrast masking. Psychological Review, 107, Francis, G. (2003). Developing a new quantitative account of backward masking. Cognitive Psychology, 46, Francis, G. & Hermens, F. (2002). Comment on: Competition for consciousness among visual events: The psychophysics of reentrant visual processes, by Di Lollo, Enns and Rensink (2000). Journal of Experimental Psychology: General, 131,
. Distributed sensory coding applied to simulations of iconic storage and metacontrast. Bulletin of Mathematical Biology, 40, 605 623.")
14 Online simulations of masking 14 Green, M. F., Nuechterlein, K. H., & Mintz, J. (1994). Backward masking in schizophrenia and mania: I. Specifying a mechanism. Archives of General Psychiatry, 51, Purushothaman, G., Öğmen, H. & Bedell, H. E. (2000). Gamma-range oscillations in backward-masking functions and their putative neural correlates. Psychological Review, 107, Slaghuis, W.L. & Curran, C.E. (1999). Spatial frequency masking in positive- and negativesymptom schizophrenia. Journal of abnormal Psychology, 108, Sperling, G. (1960). The information available in brief visual presentations. Psychological Monographs, 74, (11, Whole No. 498). Weisstein, N. (1968). A Rashevsky-Landahl neural net: Simulation of metacontrast. Psychological Review, 75, Weisstein, N. (1972). Metacontrast. In D. Jameson & L. Hurvich (Eds.) Handbook of sensory physiology (Vol. 7, No. 4, Visual psychophysics). Berlin: Springer-Verlag.
. The information available in brief visual presentations. Psychological Monographs, 74, (11, Whole No. 498). Weisstein, N. (1968).")
15 Online simulations of masking 15 Figure Captions Figure 1. The graphical user interface for interacting with the reentrant processing model. The user interface is the same for every model. Figure 2. Simulation results for the reentrant processing model. After each run of the simulation, a data plot is produced. Figures (a)-(d) show the build up of plots as new data is added to previous simulation results. The final plot, (d), is a replication of simulation results reported by Di Lollo et al. (2000). Figure 3. To produce better plots or to further analyze the simulated data, selecting the menu option Show data from each plot opens a window with a textual listing of the data points. The data can be selected, copied, and pasted into other programs. Figure 4. Simulation results when the reentrant processing model is tested under new conditions, varying the stimulus onset asynchrony (SOA) between the target and mask stimuli. The results with the original model parameters are shown in (a) and the results with a different set of parameters are shown in (b). The model can produce u-shaped masking functions under some conditions. Figure 5. Simulation results for the recurrent inhibition model. The two curves differ depending on the weight given to spatial interactions beyond a cell s nearest neighbors. The curve with filled circles marking points is from a simulation with the weights set equal to zero. Setting these weights to zero also has the effect of removing time-delayed inhibition in the model. As the simulations show, u-shaped masking occurs regardless of this property of the model. Figure 6. Simulation results for the efficient masking model. (a) shows a u-shaped masking function produced by the default set of parameters. (b) shows that the efficient masking model can match the basic properties of object substitution masking (see Figure 2d for comparison).

16 Figure 1:

17 (a) (b) (c) (d) Figure 2:

18 Figure 3:
19 (a) (b) Figure 4:

20 Figure 5:

21 (a) (b) Figure 6:
Time Window from Visual Images to Visual Short-Term Memory: Consolidation or Integration?
 Time Window from Visual Images to Visual Short-Term Memory: Consolidation or Integration? Yuhong Jiang Massachusetts Institute of Technology, Cambridge, MA, USA Abstract. When two dot arrays are briefly
PRIMING OF POP-OUT AND CONSCIOUS PERCEPTION
 PRIMING OF POP-OUT AND CONSCIOUS PERCEPTION Peremen Ziv and Lamy Dominique Department of Psychology, Tel-Aviv University zivperem@post.tau.ac.il domi@freud.tau.ac.il Abstract Research has demonstrated
Quantitative Displays for Combining Time-Series and Part-to-Whole Relationships
 Quantitative Displays for Combining Time-Series and Part-to-Whole Relationships Stephen Few, Perceptual Edge Visual Business Intelligence Newsletter January, February, and March 211 Graphical displays
Handout 12: Understanding Randomness Evaluating a Claim of Hearing Loss STAT 100 Fall 2015
 Consider the case study presented in an article by Pankratz, Fausti, and Peed titled A Forced-Choice Technique to Evaluate Deafness in the Hysterical or Malingering Patient. Source: Journal of Consulting
Unleash the Power of e-learning
 Unleash the Power of e-learning Version 1.5 November 2011 Edition 2002-2011 Page2 Table of Contents ADMINISTRATOR MENU... 3 USER ACCOUNTS... 4 CREATING USER ACCOUNTS... 4 MODIFYING USER ACCOUNTS... 7 DELETING
Plotting Data with Microsoft Excel
 Plotting Data with Microsoft Excel Here is an example of an attempt to plot parametric data in a scientifically meaningful way, using Microsoft Excel. This example describes an experience using the Office
Optimism for Mental Health
 1.2.0 Optimism Apps Pty Ltd 2008-2010. All Rights Reserved. Table of Contents About Optimism... 1 Introduction... 1 Software Assumptions... 1 Overview of the Record Screen... 2 Choosing a Day... 3 Using
Vanderbilt University School of Nursing. Running Scopia Videoconferencing from Windows
 Vanderbilt University School of Nursing Running Scopia Videoconferencing from Windows gordonjs 3/4/2011 Table of Contents Contents Installing the Software... 3 Configuring your Audio and Video... 7 Entering
Chapter 6: The Information Function 129. CHAPTER 7 Test Calibration
 Chapter 6: The Information Function 129 CHAPTER 7 Test Calibration 130 Chapter 7: Test Calibration CHAPTER 7 Test Calibration For didactic purposes, all of the preceding chapters have assumed that the
Tutorial 2: Using Excel in Data Analysis
 Tutorial 2: Using Excel in Data Analysis This tutorial guide addresses several issues particularly relevant in the context of the level 1 Physics lab sessions at Durham: organising your work sheet neatly,
o Text-to-Speech and Text-to-Speech Tracking Enhanced Accessibility Mode) o Toolbar Buttons
 o Toolbar Buttons") Ohio s State Tests English Language Arts and Mathematics Sample Items Science and Social Studies Practice Tests and Released Items Guidance Document Updated Dec. 28, 2015 This document covers the following
Ohio s State Tests English Language Arts and Mathematics Sample Items Science and Social Studies Practice Tests and Released Items Guidance Document Updated Dec. 28, 2015 This document covers the following
Agent Simulation of Hull s Drive Theory
 Agent Simulation of Hull s Drive Theory Nick Schmansky Department of Cognitive and Neural Systems Boston University March 7, 4 Abstract A computer simulation was conducted of an agent attempting to survive
Chapter 4. Spreadsheets
 Chapter 4. Spreadsheets We ve discussed rather briefly the use of computer algebra in 3.5. The approach of relying on www.wolframalpha.com is a poor subsititute for a fullfeatured computer algebra program
A comparison of masking by visual and transcranial magnetic stimulation: implications for the study of conscious and unconscious visual processing
 Consciousness and Cognition 13 (2004) 829 843 Consciousness and Cognition www.elsevier.com/locate/concog A comparison of masking by visual and transcranial magnetic stimulation: implications for the study
emarketing Manual- Creating a New Email
 emarketing Manual- Creating a New Email Create a new email: You can create a new email by clicking the button labeled Create New Email located at the top of the main page. Once you click this button, a
FSA Infrastructure Trial Guide
 FSA Infrastructure Trial Guide 2015 2016 Published September 25, 2015 Prepared by the American Institutes for Research Table of Contents Infrastructure Trial Overview... 1 Infrastructure Trial Guide Overview...
What are we dealing with? Creating a New MS Access Database
 What are we dealing with? Databases are widely used in industry and in applications where large amounts of information need to be managed effectively. Databases help users search for key information in
Figure 1. An embedded chart on a worksheet.
 8. Excel Charts and Analysis ToolPak Charts, also known as graphs, have been an integral part of spreadsheets since the early days of Lotus 1-2-3. Charting features have improved significantly over the
0 Introduction to Data Analysis Using an Excel Spreadsheet
 Experiment 0 Introduction to Data Analysis Using an Excel Spreadsheet I. Purpose The purpose of this introductory lab is to teach you a few basic things about how to use an EXCEL 2010 spreadsheet to do
Interactive Excel Spreadsheets:
 Interactive Excel Spreadsheets: Constructing Visualization Tools to Enhance Your Learner-centered Math and Science Classroom Scott A. Sinex Department of Physical Sciences and Engineering Prince George
WHO STEPS Surveillance Support Materials. STEPS Epi Info Training Guide
 STEPS Epi Info Training Guide Department of Chronic Diseases and Health Promotion World Health Organization 20 Avenue Appia, 1211 Geneva 27, Switzerland For further information: www.who.int/chp/steps WHO
Why Use Blackboard Content System to Store Documents One Time
 Set Up Blackboard Drive to Store and Access Assessment Plans and Related Documents This document will walk you through installing the Blackboard Drive application and then configuring it to access the
Designing and Evaluating a Web-Based Collaboration Application: A Case Study
 Designing and Evaluating a Web-Based Collaboration Application: A Case Study Wenli Zhu Microsoft Corporation, One Microsoft Way, Redmond, WA 98052 USA ABSTRACT The Web has evolved from a simple browsing
SignalDraw: GUI Tool For Generating Pulse Sequences
 SignalDraw: GUI Tool For Generating Pulse Sequences Konstantin Berlin Department of Computer Science University of Maryland College Park, MD 20742 kberlin@cs.umd.edu December 9, 2005 Abstract Generating
1 Topic. 2 Scilab. 2.1 What is Scilab?
 1 Topic Data Mining with Scilab. I know the name "Scilab" for a long time (http://www.scilab.org/en). For me, it is a tool for numerical analysis. It seemed not interesting in the context of the statistical
This chapter reviews the general issues involving data analysis and introduces
 Research Skills for Psychology Majors: Everything You Need to Know to Get Started Data Preparation With SPSS This chapter reviews the general issues involving data analysis and introduces SPSS, the Statistical
Finance Reporting. Millennium FAST. User Guide Version 4.0. Memorial University of Newfoundland. September 2013
 Millennium FAST Finance Reporting Memorial University of Newfoundland September 2013 User Guide Version 4.0 FAST Finance User Guide Page i Contents Introducing FAST Finance Reporting 4.0... 2 What is FAST
Editor Manual for SharePoint Version 1. 21 December 2005
 Editor Manual for SharePoint Version 1 21 December 2005 ii Table of Contents PREFACE... 1 WORKFLOW... 2 USER ROLES... 3 MANAGING DOCUMENT... 4 UPLOADING DOCUMENTS... 4 NEW DOCUMENT... 6 EDIT IN DATASHEET...
Masters research projects. 1. Adapting Granger causality for use on EEG data.
 Masters research projects 1. Adapting Granger causality for use on EEG data. Background. Granger causality is a concept introduced in the field of economy to determine which variables influence, or cause,
Using Excel (Microsoft Office 2007 Version) for Graphical Analysis of Data
 for Graphical Analysis of Data") Using Excel (Microsoft Office 2007 Version) for Graphical Analysis of Data Introduction In several upcoming labs, a primary goal will be to determine the mathematical relationship between two variable
Using Excel (Microsoft Office 2007 Version) for Graphical Analysis of Data Introduction In several upcoming labs, a primary goal will be to determine the mathematical relationship between two variable
ILLUMINATE ASSESSMENT REPORTS REFERENCE GUIDE
 ILLUMINATE ASSESSMENT REPORTS REFERENCE GUIDE What are you trying to find? How to find the data in Illuminate How my class answered each question (Response Frequency) 3. Under Reports, click Response Frequency
Visualization of Phylogenetic Trees and Metadata
 Visualization of Phylogenetic Trees and Metadata November 27, 2015 Sample to Insight CLC bio, a QIAGEN Company Silkeborgvej 2 Prismet 8000 Aarhus C Denmark Telephone: +45 70 22 32 44 www.clcbio.com support-clcbio@qiagen.com
ThermochronWM22 Application for Windows Mobile Getting Started. Step 1: Install PC Applications... 2. Step 2: Install USB Adapter...
 ThermochronWM22 Application for Windows Mobile Getting Started Step 1: Install PC Applications... 2 Step 2: Install USB Adapter... 2 Step 3. Setup Microsoft ActiveSync On your PC... 2 Step 4: Copy the
Virtual Lab 1. Running Head: UTAH VIRTUAL LAB: TEACHING SCIENCE ONLINE. Thomas E. Malloy and Gary C. Jensen. University of Utah, Salt Lake City, Utah
 Virtual Lab 1 Running Head: UTAH VIRTUAL LAB: TEACHING SCIENCE ONLINE Utah Virtual Lab: JAVA Interactivity for teaching science and statistics on line Thomas E. Malloy and Gary C. Jensen University of
Formatting data files for repeated measures analyses in SPSS: Using the Aggregate and Restructure procedures
 Tutorials in Quantitative Methods for Psychology 2006, Vol. 2(1), p. 20 25. Formatting data files for repeated measures analyses in SPSS: Using the Aggregate and Restructure procedures Guy L. Lacroix Concordia
Psychology. Draft GCSE subject content
 Psychology Draft GCSE subject content July 2015 Contents The content for psychology GCSE 3 Introduction 3 Aims and objectives 3 Subject content 4 Knowledge, understanding and skills 4 Appendix A mathematical
Appendix 2.1 Tabular and Graphical Methods Using Excel
 Appendix 2.1 Tabular and Graphical Methods Using Excel 1 Appendix 2.1 Tabular and Graphical Methods Using Excel The instructions in this section begin by describing the entry of data into an Excel spreadsheet.
How To Run Statistical Tests in Excel
 How To Run Statistical Tests in Excel Microsoft Excel is your best tool for storing and manipulating data, calculating basic descriptive statistics such as means and standard deviations, and conducting
Choosing Colors for Data Visualization Maureen Stone January 17, 2006
 Choosing Colors for Data Visualization Maureen Stone January 17, 2006 The problem of choosing colors for data visualization is expressed by this quote from information visualization guru Edward Tufte:
A Guide to Getting Started with the AmeriCorps VISTA Applicant Tracking Tool
 A Guide to Getting Started with the AmeriCorps VISTA Applicant Tracking Tool The AmeriCorps VISTA Applicant Tracking Tool will help you stay organized, monitor all the necessary steps, and record applicant
http://school-maths.com Gerrit Stols
 For more info and downloads go to: http://school-maths.com Gerrit Stols Acknowledgements GeoGebra is dynamic mathematics open source (free) software for learning and teaching mathematics in schools. It
Business Objects Enterprise version 4.1. Report Viewing
 Business Objects Enterprise version 4.1 Note about Java: With earlier versions, the Java run-time was not needed for report viewing; but was needed for report writing. The default behavior in version 4.1
Mitigation Planning Portal MPP Reporting System
 Mitigation Planning Portal MPP Reporting System Updated: 7/13/2015 Introduction Access the MPP Reporting System by clicking on the Reports tab and clicking the Launch button. Within the system, you can
SPSS: Getting Started. For Windows
 For Windows Updated: August 2012 Table of Contents Section 1: Overview... 3 1.1 Introduction to SPSS Tutorials... 3 1.2 Introduction to SPSS... 3 1.3 Overview of SPSS for Windows... 3 Section 2: Entering
Spreadsheet software for linear regression analysis
 Spreadsheet software for linear regression analysis Robert Nau Fuqua School of Business, Duke University Copies of these slides together with individual Excel files that demonstrate each program are available
KaleidaGraph Quick Start Guide
 KaleidaGraph Quick Start Guide This document is a hands-on guide that walks you through the use of KaleidaGraph. You will probably want to print this guide and then start your exploration of the product.
Expert Color Choices for Presenting Data
 Expert Color Choices for Presenting Data Maureen Stone, StoneSoup Consulting The problem of choosing colors for data visualization is expressed by this quote from information visualization guru Edward
Discussion Board Guide For Instructors
 Discussion Board Guide For Instructors Developed by Crystal Nielsen, M.A. Northwest Nazarene University E-Learning Services Updated March 2008 Updated March 2009 for CSUStan Blackboard Learning System
Optimize with Shark: Big Payoff, Small Effort
 Search Advanced Search Log In Not a Member? Contact ADC ADC Home > Tools > Many developers don t realize how little time it may take to achieve significant performance improvements in a Mac OS X application.
The basics of storytelling through numbers
 Data Visualizations 101 The basics of storytelling through numbers C olleges and universities have a lot of stories to tell to a lot of different people. Prospective students and parents want to know if
The Time Course of Consolidation in Visual Working Memory
 Journal of Experimental Psychology: Human Perception and Performance 2006, Vol. 32, No. 6, 1436 1451 Copyright 2006 by the American Psychological Association 0096-1523/06/$12.00 DOI: 10.1037/0096-1523.32.6.1436
Obtaining Knowledge. Lecture 7 Methods of Scientific Observation and Analysis in Behavioral Psychology and Neuropsychology.
 Lecture 7 Methods of Scientific Observation and Analysis in Behavioral Psychology and Neuropsychology 1.Obtaining Knowledge 1. Correlation 2. Causation 2.Hypothesis Generation & Measures 3.Looking into
Xopero Centrally managed backup solution. User Manual
 Centrally managed backup solution User Manual Contents Desktop application...2 Requirements...2 The installation process...3 Logging in to the application...6 First logging in to the application...7 First
Installation Windows Next Linux Mac Navigator Navigator Help Show Navigator at Startup PR Wizard New PR Campaign PR Manager
 bluevizia PR Manager is a modern, easy-to-use software tool for the successful development and management of the internal and external communications of the company. Installation Windows Double-click with
AMA, an application for Monitoring, Analysis and Monitoring A tool to better understand autism
 AMA, an application for Monitoring, Analysis and Monitoring A tool to better understand autism MAS 771: Autism Theory & Technology Akane Sano (akanes@mit.edu) Javier Hernandez (javierhr@mit.edu) Introduction
Instructions for Creating a Poster for Arts and Humanities Research Day Using PowerPoint
 Instructions for Creating a Poster for Arts and Humanities Research Day Using PowerPoint While it is, of course, possible to create a Research Day poster using a graphics editing programme such as Adobe
How to use PGS: Basic Services Provision Map App
 How to use PGS: Basic Services Provision Map App The PGS: Basic Services Provision Map App The main features of the PGP Basic Services web application includes: Navigation Tools Map Tools Main Map Links
Configuration Manager
 After you have installed Unified Intelligent Contact Management (Unified ICM) and have it running, use the to view and update the configuration information in the Unified ICM database. The configuration
Intermediate PowerPoint
 Intermediate PowerPoint Charts and Templates By: Jim Waddell Last modified: January 2002 Topics to be covered: Creating Charts 2 Creating the chart. 2 Line Charts and Scatter Plots 4 Making a Line Chart.
Systems Dynamics Using Vensim Personal Learning Edition (PLE) Download Vensim PLE at http://vensim.com/freedownload.html
 Download Vensim PLE at http://vensim.com/freedownload.html") Systems Dynamics Using Personal Learning Edition (PLE) Download PLE at http://vensim.com/freedownload.html Quick Start Tutorial Preliminaries PLE is software designed for modeling one or more quantities
Systems Dynamics Using Personal Learning Edition (PLE) Download PLE at http://vensim.com/freedownload.html Quick Start Tutorial Preliminaries PLE is software designed for modeling one or more quantities
Using Excel for Handling, Graphing, and Analyzing Scientific Data:
 Using Excel for Handling, Graphing, and Analyzing Scientific Data: A Resource for Science and Mathematics Students Scott A. Sinex Barbara A. Gage Department of Physical Sciences and Engineering Prince
TYLER JUNIOR COLLEGE School of Continuing Studies 1530 SSW Loop 323 Tyler, TX 75701 1.800.298.5226 www.tjc.edu/continuingstudies/mycaa
 TYLER JUNIOR COLLEGE School of Continuing Studies 1530 SSW Loop 323 Tyler, TX 75701 1.800.298.5226 www.tjc.edu/continuingstudies/mycaa Education & Training Plan Psychology Program Student Full Name: Start
Principles of Data Visualization for Exploratory Data Analysis. Renee M. P. Teate. SYS 6023 Cognitive Systems Engineering April 28, 2015
 Principles of Data Visualization for Exploratory Data Analysis Renee M. P. Teate SYS 6023 Cognitive Systems Engineering April 28, 2015 Introduction Exploratory Data Analysis (EDA) is the phase of analysis
STATGRAPHICS Online. Statistical Analysis and Data Visualization System. Revised 6/21/2012. Copyright 2012 by StatPoint Technologies, Inc.
 STATGRAPHICS Online Statistical Analysis and Data Visualization System Revised 6/21/2012 Copyright 2012 by StatPoint Technologies, Inc. All rights reserved. Table of Contents Introduction... 1 Chapter
AIM Dashboard-User Documentation
 AIM Dashboard-User Documentation Accessing the Academic Insights Management (AIM) Dashboard Getting Started Navigating the AIM Dashboard Advanced Data Analysis Features Exporting Data Tables into Excel
isupplier PORTAL ACCESS SYSTEM REQUIREMENTS
 TABLE OF CONTENTS Recommended Browsers for isupplier Portal Recommended Microsoft Internet Explorer Browser Settings (MSIE) Recommended Firefox Browser Settings Recommended Safari Browser Settings SYSTEM
PLANNING FOR A SECURE RETIREMENT
 PLANNING FOR A SECURE RETIREMENT ADMINISTRATIVE VIEW User Guide: D2.6.39 Agriculture Information Technology Released: August, 2005 Revised: January, 2006 Version: 1.0 PLANNING FOR A SECURE RETIREMENT ADMINISTRATIVE
Licensed Functionality: Remote Monitoring
 Appendices 473 Chapter 24 Licensed Functionality: Remote Monitoring Remote Monitoring functionality is available through an optional license available with AcqKnowledge 4.2 or above. The license must be
Your Personal Trading Journal
 Your Personal Trading Journal This guide provides instructions for the setup and helps you getting started with your Edgewonk trading journal. It is recommended that you read it thoroughly to fully leverage
File Structure Best Practices / Troubleshooting
 ODYSSEY v 3.0 Software Note File Structure Best Practices / Troubleshooting The following document will cover several recommendations to help streamline image and analysis retrieval within Odyssey 3.0
TOPAS: a Web-based Tool for Visualization of Mapping Algorithms
 TOPAS: a Web-based Tool for Visualization of Mapping Algorithms 0. G. Monakhov, 0. J. Chunikhin, E. B. Grosbein Institute of Computational Mathematics and Mathematical Geophysics, Siberian Division of
Objectives. Chapter 2: Operating-System Structures. Operating System Services (Cont.) Operating System Services. Operating System Services (Cont.
 Operating System Services. Operating System Services (Cont.") Objectives To describe the services an operating system provides to users, processes, and other systems To discuss the various ways of structuring an operating system Chapter 2: Operating-System Structures
Objectives To describe the services an operating system provides to users, processes, and other systems To discuss the various ways of structuring an operating system Chapter 2: Operating-System Structures
The Kinetics of Enzyme Reactions
 The Kinetics of Enzyme Reactions This activity will introduce you to the chemical kinetics of enzyme-mediated biochemical reactions using an interactive Excel spreadsheet or Excelet. A summarized chemical
Frog VLE Update. Latest Features and Enhancements. September 2014
 1 Frog VLE Update Latest Features and Enhancements September 2014 2 Frog VLE Update: September 2014 Contents New Features Overview... 1 Enhancements Overview... 2 New Features... 3 Site Backgrounds...
RGK60 RGK50 RGAM10 RGAM20 RGAM4 Generator set control units
 I123 GB 1207 RGK60 RGK50 RGAM10 RGAM20 RGAM4 Generator set control units CUSTOMIZATION SOFTWARE MANUAL List of contents Introduction... 2 Main window... 3 Device model selection... 3 Transmission of data
Custom Reporting System User Guide
 Citibank Custom Reporting System User Guide April 2012 Version 8.1.1 Transaction Services Citibank Custom Reporting System User Guide Table of Contents Table of Contents User Guide Overview...2 Subscribe
imc FAMOS 6.3 visualization signal analysis data processing test reporting Comprehensive data analysis and documentation imc productive testing
 imc FAMOS 6.3 visualization signal analysis data processing test reporting Comprehensive data analysis and documentation imc productive testing imc FAMOS ensures fast results Comprehensive data processing
Excel Guide for Finite Mathematics and Applied Calculus
 Excel Guide for Finite Mathematics and Applied Calculus Revathi Narasimhan Kean University A technology guide to accompany Mathematical Applications, 6 th Edition Applied Calculus, 2 nd Edition Calculus:
Appendix C. Vernier Tutorial
 C-1. Vernier Tutorial Introduction: In this lab course, you will collect, analyze and interpret data. The purpose of this tutorial is to teach you how to use the Vernier System to collect and transfer
Using the Synchronization Client
 Using the Synchronization Client The owncloud Desktop Client remains in the background and is visible as an icon in the system tray (Windows, KDE), status bar (Mac OS X), or notification area (Linux).
MultiExperiment Viewer Quickstart Guide
 MultiExperiment Viewer Quickstart Guide Table of Contents: I. Preface - 2 II. Installing MeV - 2 III. Opening a Data Set - 2 IV. Filtering - 6 V. Clustering a. HCL - 8 b. K-means - 11 VI. Modules a. T-test
Programming in Access VBA
 PART I Programming in Access VBA In this part, you will learn all about how Visual Basic for Applications (VBA) works for Access 2010. A number of new VBA features have been incorporated into the 2010
BENEFIT OF DYNAMIC USE CASES TO EARLY DESIGN A DRIVING ASSISTANCE SYSTEM FOR PEDESTRIAN/TRUCK COLLISION AVOIDANCE
 BENEFIT OF DYNAMIC USE CASES TO EARLY DESIGN A DRIVING ASSISTANCE SYSTEM FOR PEDESTRIAN/TRUCK COLLISION AVOIDANCE Hélène Tattegrain, Arnaud Bonnard, Benoit Mathern, LESCOT, INRETS France Paper Number 09-0489
Using the Cisco OnPlus Scanner to Discover Your Network
 Using the Cisco OnPlus Scanner to Discover Your Network Last Revised: October 22, 2012 This Application Note explains how to use the Cisco OnPlus Scanner with the Cisco OnPlus Portal to discover and manage
Excel Charts & Graphs
 MAX 201 Spring 2008 Assignment #6: Charts & Graphs; Modifying Data Due at the beginning of class on March 18 th Introduction This assignment introduces the charting and graphing capabilities of SPSS and
Introduction to SPSS 16.0
 Introduction to SPSS 16.0 Edited by Emily Blumenthal Center for Social Science Computation and Research 110 Savery Hall University of Washington Seattle, WA 98195 USA (206) 543-8110 November 2010 http://julius.csscr.washington.edu/pdf/spss.pdf
Using Excel Forms. The Industrial-Organizational Psychologist 61
 Using Excel Forms R. Jason Weiss Development Dimensions International Have you ever come across a tool so obviously useful that it actually inspired you to find ways to use it? I did, when I came across
Data representation and analysis in Excel
 Page 1 Data representation and analysis in Excel Let s Get Started! This course will teach you how to analyze data and make charts in Excel so that the data may be represented in a visual way that reflects
MyMathLab / MyStatLab Advanced Interactive Training Guide
 MyMathLab / MyStatLab Advanced Interactive Training Guide MYMATHLAB/MYSTATLAB ADVANCED Lesson 1 Manage Multiple Courses... 129 Lesson 2 Export Grades... 135 Lesson 3 Transfer Students... 139 Lesson 4 Design
Introduction to Google Docs
 Introduction to Google Docs If you do not have a Google account please see the instructor about setting up an account before the class begins. If you do not want to set up an account you can follow along
Using Karel with Eclipse
 Mehran Sahami Handout #6 CS 106A September 23, 2015 Using Karel with Eclipse Based on a handout by Eric Roberts Once you have downloaded a copy of Eclipse as described in Handout #5, your next task is
Practice Test for Special Education EC-12
 Practice Test for Special Education EC-12 1. The Individualized Educational Program (IEP) includes: A. Written evaluation B. Assessment tests C. Interviews 2. Learning disabilities include: A. Cerebral
Ohio Online Science and Social Studies Practice Tests Guidance Document
 Ohio Online Science and Social Studies Practice Tests Guidance Document Published October 2, 2014 This document covers the following information: About the Practice Tests Signing Into the Practice Tests
Market Pricing Override
 Market Pricing Override MARKET PRICING OVERRIDE Market Pricing: Copy Override Market price overrides can be copied from one match year to another Market Price Override can be accessed from the Job Matches
Lab 3: Introduction to Data Acquisition Cards
 Lab 3: Introduction to Data Acquisition Cards INTRODUCTION: In this lab, you will be building a VI to display the input measured on a channel. However, within your own VI you will use LabVIEW supplied
Chapter 4 Creating Charts and Graphs
 Calc Guide Chapter 4 OpenOffice.org Copyright This document is Copyright 2006 by its contributors as listed in the section titled Authors. You can distribute it and/or modify it under the terms of either
imc FAMOS 6.3 visualization signal analysis data processing test reporting Comprehensive data analysis and documentation imc productive testing
 imc FAMOS 6.3 visualization signal analysis data processing test reporting Comprehensive data analysis and documentation imc productive testing www.imcfamos.com imc FAMOS at a glance Four editions to Optimize
Visual area MT responds to local motion. Visual area MST responds to optic flow. Visual area STS responds to biological motion. Macaque visual areas
 Visual area responds to local motion MST a Visual area MST responds to optic flow MST a Visual area STS responds to biological motion STS Macaque visual areas Flattening the brain What is a visual area?
Appointment Scheduler
 EZClaim Appointment Scheduler User Guide Last Update: 11/19/2008 Copyright 2008 EZClaim This page intentionally left blank Contents Contents... iii Getting Started... 5 System Requirements... 5 Installing
Using Microsoft Excel to Plot and Analyze Kinetic Data
 Entering and Formatting Data Using Microsoft Excel to Plot and Analyze Kinetic Data Open Excel. Set up the spreadsheet page (Sheet 1) so that anyone who reads it will understand the page (Figure 1). Type