Foreword. Iokwe, Kommol Tata, Carl S. Hacker Director, EPPSO Office of the President. Economic Policy, Planning and Statistics Office
|
|
|
- Clare Allison
- 8 years ago
- Views:
Transcription
1 Foreword Iokwe, The (EPPSO) is pleased to present its annual publication, the 22 Statistical Yearbook. For readers and users of previous additions it will be immediately apparent that this publication has more than twice the number of tables. There is much more information in the areas of health and education, as well as new information concerning the outer islands and NGO s. In addition, the quality of the publication has been significantly enhanced by the inclusion of more analysis of data. During the course of producing this publication we found that most ministries and agencies need to improve the collection and quality of their administrative statistics, which are the backbone of this publication and government budget planning. Attempting to ensure that the information produced and given to EPPSO was accurate was a very time consuming process that required an extensive amount of patience by everyone involved. Work on the 23 publication has already begun and will contain new sections with comprehensive information on the renegotiated Compact of Free Association with the United States, Government Finance and Budget Statistics, and information from the Banking Commission. I would like to take this opportunity to thank J.P. Yadav UNV Social Monitoring Analyst, John Henry - EPPSO staff, and the UNDP office in Suva, Fiji for their efforts and assistance in making this publication a reality. Many long hours were spent meeting with ministries/agencies, putting these tables together and organizing the document. We are also very thankful for the cooperation and assistance EPPSO received from all government ministries, private sector, statutory agencies and NGO s. Cooperation and sharing of information is essential if we are to improve the quality of life of our people and the services provided by government. For any questions or suggestions for improvements or requests for copies of this document please feel free to contact EPPSO at (692) /383 or fax (692) Our E mail address is planning@ntamar.net. Users can also visit the Secretariat of the Pacific Community website at or the Insular Areas Statistical Enhancement Program website at for additional Marshall Islands statistics. Kommol Tata, Carl S. Hacker Director, EPPSO Office of the President 1

2 Foreword Table of Contents Map Chapter 1. Marshall Islands and Its People Chapter 2. Health Services Chapter 3. Education Chapter 4. Labor and Employment Chapter 5. Justice and Crime Chapter 6.Consumer Prices Chapter 7. Water and Energy Chapter 8. Transport and Communications Chapter 9. Environmental Protection Chapter1. Tourism Chapter 11. Non Governmental Organizations Chapter 12. Agriculture, Fisheries and Rural Development

3 3
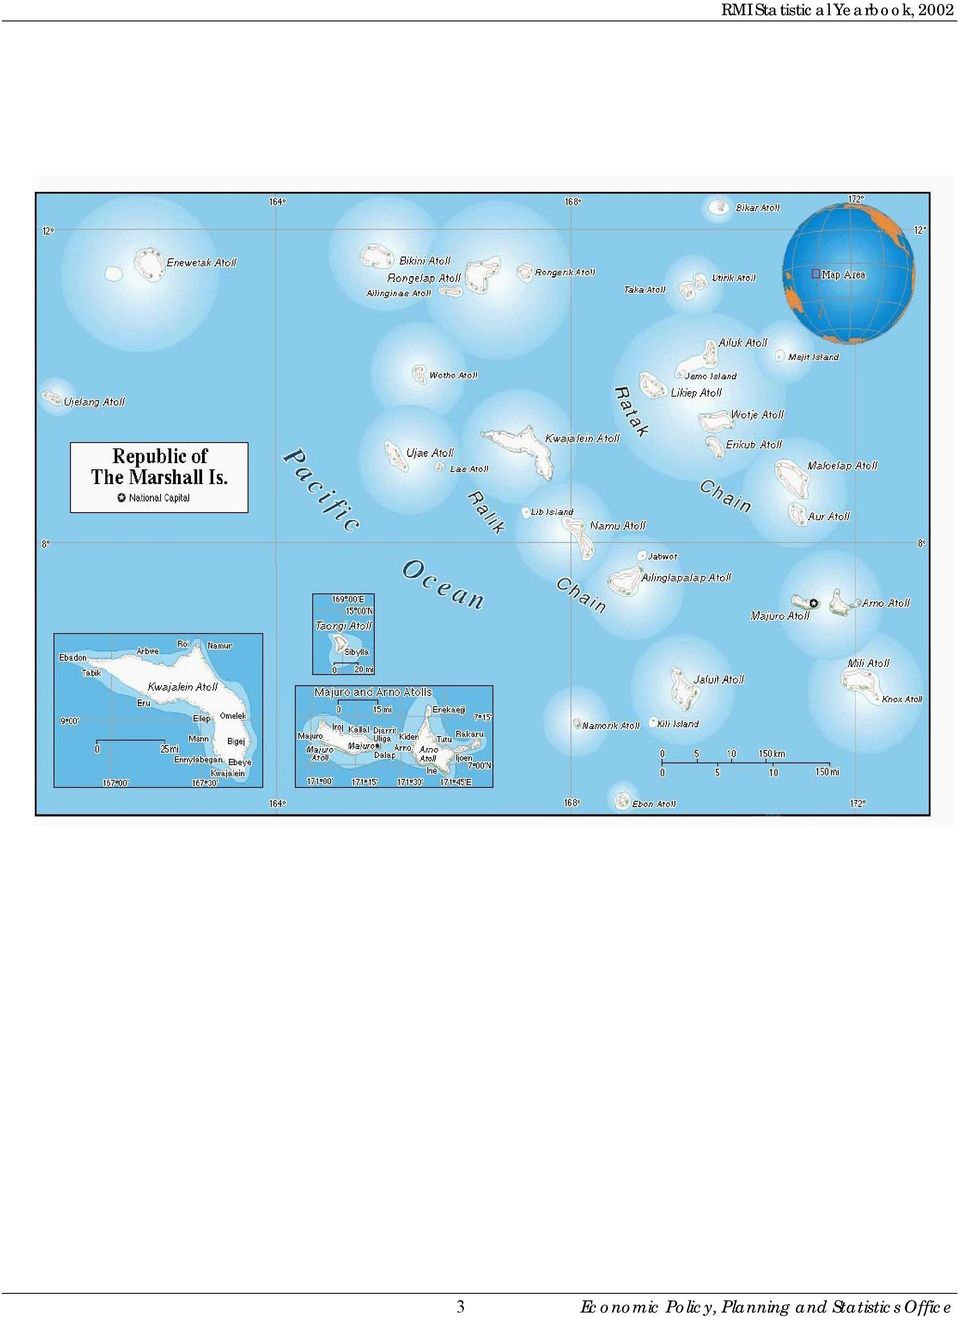
4 Chapter 1- Marshall Islands and Its People Location The Republic of Marshall Islands is situated in the Central Pacific Ocean between 4 degrees and 14 degrees North and 16 degrees and 173 degrees East in almost two parallel chains of 31 Atolls and Islands: the Eastern Ratak (Sunrise) with 15 Atolls and Islands and the Western Ralik (Sunset) having 16 Atolls and Islands. The total number of islands and islets is about 1,225. The total sea and land area of the country is approximately 1.94 million square kilometers and 181 square kilometers respectively. In other words, the land area is less than.1% of the total surface area. Both sea and land are of paramount importance to the people of this country for their livelihood. The climate is tropical - ocean. The temperature averages 8 degrees Fahrenheit and with little variation throughout the year. The Northern atolls receive about 8 inches of rainfall a year while the annual rainfall in Southern atolls is normally higher, about 16 inches. Brief History The Marshallese are thought to have come from Southeast Asia over 2 years ago. At that time it appears stronger groups pushed down people through southern China, the Malay Peninsula and the island archipelagos in the east. Over time, the settlers organized themselves into lineage groups and spread through the double chain of atolls. They developed their own life style and social structure befitting the sparse and isolated environment. The ownership rights to the land, however, vested with the Iroij, who was the hereditary chief of several clans. Being the matrilineal society, all persons born to a woman inherited the right to cultivate and use land occupied by the clan. The Iroij adjudicated land and lineage disputes as per the customary law and was responsible for the security of his subjects. The long period of isolation and harshness of the environment created a traditional system that is still strong and highly regarded. These islands were first sighted by Europeans in 1526 by the Spanish Captain Garcia de Loyasa but there were no further contacts until 1788 when the British Captain Marshall rediscovered them and they were given his name by the British Admiralty. Sea Voyagers from various parts of world passed across these islands but no nation claimed them as their colony. German trading companies started to build trading links around 186 with some of the islands and built a network of island stations for trade in copra and retail goods. Later, Germany formally annexed the Marshall Islands in 1885 ignoring verbal counter claims by Spain. During the First World War, Japan declared war on Germany and occupied German Micronesia in September The islands remained under Japanese rule until the defeat of Japan by American forces in the Second World War. After a brief period of occupation by the US Navy, the UN entrusted the administration of these islands to the US as the Trust Territory of the Pacific Islands (TTPI). The American Navy established a strategic naval base in Kwajalein to support the newly created nuclear weapons testing program. Sixty seven nuclear tests between 1946 and 1958 at Bikini and Enewetak atolls exposed thousands of Marshallese to significant radiation hazards. 4

5 After the ban on atmospheric nuclear testing under an international treaty in 1958, the US converted the Kwajalein military base into missile testing range which has continued to remain so under an arrangement called Compact of Free Association ratified in Under this agreement, the US agreed to recognize the independence of the RMI while the RMI agreed to grant the US exclusive military access to Marshall Islands. The defense of the RMI from attack from a third country is the responsibility of the US under that treaty. First 15-year Compact period ended in September 21. After 2 years of negotiations, a new 2 year compact agreement to be effective from 1 st October, 23 or when ratified by both the US Congress and the Nitijela of the RMI was signed in early 23. The US government, continued to provide financial assistance during this intervening transitional period of 2 years. The highlights of First Compact were the establishment of political sovereignty for the RMI, the deepening of democratic political processes and the exclusive military access to the islands enjoyed by the US. National government The government consists of a bi-cameral legislature, President of the Cabinet, the judiciary and the public service. The two legislative bodies are the Council of Iroij, the Upper House and the Nitijela, the Lower House. Nitijela The legislative power is vested in the Nitijela. This House consists of 33 members elected from 24 electoral districts, each district corresponds to a respective Atoll. Except the electoral districts/atolls of Majuro, Kwajalein, Ailinglaplap, Jaluit and Arno having 5,3,2,2 members respectively, remaining 19 electoral districts elect one member each to the Nitijela. Election to the Nitijela is based on universal suffrage for all citizens of Marshall Islands who have attained the age and 18 years. The term of the Nitijela is four years. A voter has to be minimum of 21 years of age for contesting election to the Nitijela. In the current house of the Nitijela, the representation of women is only by a solitary senator and the rest 32 senators are male. Women have always been under represented in this supreme house. Council of Iroij The Council of Iroij has a membership of 12. Its main responsibility is to refer back to the Nitijela any Bill affecting customary law, any traditional practice or land tenure or any related matter. The Council can also express its opinion to the Cabinet about matters of national interest. These members are nominated from 11 iroij clans and one from two land owner families of Likiep. Five members of Council of Iroij come from the electoral districts of Ralik (Sunset) Chain and 7 from electoral districts of Ratak (Sunrise) Chain of Islands. Out of seven seats of Ratak Chain, 4 have permanent term and rest three seats from this Chain namely one seat each from Mili, Likiep and Mejit, rotate on yearly basis. In case of Likiep rotation is between land owning families of Capelle and debrum. From Ralik Chain, the seat of Enewetak rotates between two Iroij families and the remaining 4 are permanent seats for the Iroijs of the area. The nomination/election process for the constitution of the Council of Iroij takes place every four years. The representation of women on this council has been proportional to the overall population. 5

6 Bill are placed before the Nitijela for consideration and if passed the bill is then sent to the Council of Iroij for their approval. The Council of Iroij is required to make a decision on the referred bill within 7 days failing which the bill earlier passed by the Nitijela stands approved and becomes an Act. In case the Council of Iroij returns the bill to the Nitijela for reconsideration and the Nitijela passes it again, and if second time, the Council of Iroij still does not approve it, then the bill is considered in a joint session of two houses. A majority decision of the members of the lower and upper house decides the final fate of the bill. The appropriation bills, however, fall under the purview/consideration of the Nitijela only. The Executive Executive authority is vested with the President, the Cabinet, the Attorney General and the Chief Secretary. Members of which are collectively responsible to the Nitijela. Local Government As embodied in the constitution, each atoll has a right to create a local government. Each local government consists of an elected council, a mayor, officials, and a local police force, with variations depending upon the constitution of each. People elect their counselors and Mayor directly. The term of the Council is of 4 years same as of the Nitijela. The Minister of Internal Affairs can constitutionally terminate a Council earlier if circumstances so necessitate. In the case of Ebon, instead of direct election, each family elects one member for the local council. As a result, there are 83 members on the Ebon council. Membership on Councils of other atolls ranges from 5 in Likiep to 25 in Ailinglaplap, depending upon the membership provisions in their local constitutions. Of a total membership of 393 in all of the Atoll Councils, the number of women totaled only 4. In the case of Mayors representation of women was even less. However, it is significant to observe that in four of the last five terms women have been mayors on both Majuro and Ebon. In Jaluit and Wotje women were mayors in 1995 and 1991 respectively. The Judiciary The judiciary is independent of the Nitijela and the executive, its power vests in the Supreme Court, the High Court, the Traditional Rights Courts, the Community Courts and other subordinate courts created by law. The Supreme Court, the High Court and the Traditional Rights Court function from Majuro and the District Courts are located at Majuro, Ebeye and Jaluit. The Community Courts function on respective atolls. There is an independent Judicial Service Commission responsible for the appointments to the judiciary. Candidates for positions are recommended by this commission for the Traditional Rights Courts, the District Courts, the High Court and the Supreme Court to the government. The Council of Ministers after considering the proposal, places it before the Nitijela for a final decision. The appointments of judicial officers to the Community Courts are finalized at the level of the Judicial Public Service Commission itself. The Community courts have jurisdiction to decide civil cases of value up to $1 and the jurisdiction of the District courts are all cases having pecuniary limit up to $2,. The jurisdiction of the High Court and the Supreme Court is with out any pecuniary limit. The Traditional Rights Court has no original jurisdiction and it provides advice on issues involving customary law and practices, referred to it by other courts. The jurisdictional court, however, makes the final decision in the case after taking into account the opinion of the Traditional Rights Court. 6

7 Public Service The Public Service assists the Cabinet in exercising its executive authority. The Service is headed by the Chief Secretary, and includes the Attorney General, Chairmen of the Public Service Commission, Permanent Secretaries and all other public servants. Culture and Social Structure The Marshallese culture is on the whole homogeneous but there are minor cultural and linguistic differences between Ratak and Ralik chains. Marshallese are matrilineal society where family ties and mutual reciprocity are very strong despite modern influences. Unlike western society, the extended system of family is prevalent and family ties are strong. Average family size is 7.8 persons, the highest among the central pacific countries. The Church and religion has played a significant role in shaping the attitude and behavior of the people since the missionaries first arrived in the islands during the 183 s. People are generally God fearing, peace loving, tolerant and secular. The life style throughout the islands is generally simple and easy going. Due to high wage earnings in non-traditional occupations, development of a cash based economy and the availability of imported western food, food habits have undergone a change for the worse. The traditional nutritious diet of primarily consisting of breadfruit, coconut, pandanus, taro, protein rich fish, chicken and pork has been overtaken by canned and processed food. Alcohol, smoking and substance abuse are on the rise particularly amongst the young and as is the crime rate. Combined, life style changes along with changes in the diet, have led to the increasing incidence of diabetes and diabetes related diseases. The health of the people is moving through a transition in morbidity and mortality. Now more people die from non-communicable life-style diseases than from communicable diseases. Population Structure According to the 1999 Census the population of Marshall Islands was 5,84 persons. This number has more than doubled in 26 years from 24,135 persons enumerated during the 1973 Census. 96.7% of the population was born in the RMI and the rest, less than 2.3%, are from other Pacific islands, the USA and other countries. The sex ratio is 14.9, meaning that there are more men than women. The annual population growth of 4.3% during the inter-censal period , this drastically decreased to 1.5% during the period The rate of natural increase, which is the difference between the crude birth rate and crude death rate, however, was as high as 3.7% in The wide difference in the two is because of migration of people mostly to the USA. The fertility rate is still high. About 68% of the total population resides in either Majuro and Kwajalein. During the inter-censal period , the average annual growth rate of these two communities has decreased considerably from 6.3% and 4.2% during inter-censal period to 1.8% and 1.5% per year during the inter-censal period The population in the outer islands of Jabat, Jaluit, Mejit, Namdrik, and Ujae registered a declined in 1999 from their populations in The average annual population growth rate during was below 1% in case of Ailuk, Lae, Maloelap, and Utrik Atolls. This population change is mainly the result of migration of people within the country or to other countries. 7

8 The infant mortality rate decreased from 56.9 in 1988 to 37. in 1999 but this and the child mortality rate are still quite high. Based on the results from the 1988 and 1999 censuses, the life expectancy of males has increased from 59.6 years to 65.7 years and for females life expectancy also increased from 62.6 years to 69.4 years. The population of the country is still quite young, 43% being under 14 years of age and 64.3% below 25 years of age, this still provides great potential for the population to grow fast. The average woman still bears about 6 children. Age Dependency Ratio The percentage children below 14 years of age has decreased from 51% in 1988 to 43% in 1999 but strangely enough, the percentage of elderly that is people older than 65, has also declined from 2.9 % in 1988 to 2.2% in This has resulted in the decline in both the child and old age dependency ratios for the RMI. The child dependency ratio and old age dependency ratio were 75.1 per 1 persons and 3.8 per 1 persons for the respective age groups in These ratios were, however, higher for those living in rural areas, being 89.6 for the children and 4.6 for the old in 1999 per 1 persons. By comparison, these ratios in the urban population were much lower, being 68.3 and 3.4 per 1 persons in respective the age groups. Obviously, the rural wage earners have a greater burden in order to support children and the elderly. The higher child dependency in rural areas is primarily due to the higher fertility rates of women in rural areas. Economy The economy of the country, like many other central pacific island countries has three basic financial and economic problems: budget deficits, balance of payments and a low level of domestic savings. Both public and private investment has been low. As a result of the liberal foreign investment policy of the government, small business investment has increased with more traders from Asian countries like China, Taiwan, Hong Kong and Korea providing stiff competition for established local stores such as Gibson s and RRE. The small size of the market, legal restrictions to land, distances and isolated places, high transportation costs in importing goods and high wages are the factors detracting foreign investment in this country. The economy is heavily dependant on funds from the US, Asian Development Bank and assistance from other countries. The size of the annual budget is largely dependent on the size of the financial aid from these sources. The imports are rising without corresponding increase in exports and thus the balance of trade is unfavorable. The economic and administrative reforms carried out a few years ago are of late, are showing some favorable results for the economy. There are few reliable estimates of the GDP available, but is estimated that the GDP in 22 grew by 3.8% based on current market prices. The RMI has no monetary system of its own and uses the US dollar. As a result, the economy has not had to face foreign exchange rate problems as experienced by other countries in the region who have their own monetary systems. The rate of inflation is minimal. The per capita income in 22 was estimated at 1,867 US dollars, among the highest in the region after the Federated States of Micronesia. 8

9 Employment Situation The country is facing a serious problem of providing jobs for its growing labor force. According to the 1999 census, the total number of job seekers was 14,677 but only 1,141 were working, 3,16 in the public sector and 7,35 in the private sector. In 1988 the number of people economically active was 11,488, out of which 1,56 were working, 3,392 being in government jobs and 6,664 in private employment. Unemployment rate at that time was 12.5% compared to 3.9% following the 1999 census. During the 11- year period from 1988 to 1999, the number of people who were economically active grew 27.76% while actual job creation grew only by.84%. Civil Registration System Under the Act of 1988, the registration of births, deaths and marriages is compulsory and the Secretary of Internal Affairs is the ex-officio the Registrar General of births, deaths and marriages. These events are to be registered by qualified informants who are appointed by the Registrar General. There is an element of under registration in both births and deaths, particularly in the outer islands where the registration system is not well known. If the total fertility rate of 5.7 and crude birth rate of 41.8 as estimated under the 1999 Census are taken into account, the annual number of births should be in the range of 2,1-2,2. Compared to the data collected from the Ministry of Health, the number of births registered in 22 was only 1,355. The completeness of the registration of births, deaths and infant deaths is vital for the planning and the implementation of public health programs in particular and development plans in general. It is, therefore, necessary to take appropriate steps to improve the civil registration system. One recommendation is to issue the registration certificates of births and deaths at the atoll level instead of present arrangement of issuing these certificates on Majuro. Teen Age Pregnancies Despite recent signs of declining fertility in the country, the incidence of teen - age pregnancy continues to be the highest among the pacific island countries. 17.6% of total live births registered in 22 were to mothers below 19 years of age and the highest percentage of live births, 36.5% were in the age group Poor standards of education, high dropout rates from school, a lack of guidance from the home and under utilization of family planning practices are contributing factors for these pregnancies. This phenomenon is also major reason why many young girls do not complete high school studies. High Lights In 1999, the sex ratio was 14.9 males for 1 females. This imbalance is even greater in rural areas where there were 17.6 males for 1 females. The sex ratio in urban areas was Of the total population, 42.9 % are children (-14), 27.2 % adolescent (1-19) and 21.4 % are youth (15-24) and 57.1 % are working age. Only 2.2 % are 65 and above. The overall dependency ratio in 1999 was 82.2 but it was as high as 99.7 for the rural population due to a proportionately higher number of dependents. The ratio of child dependency was 7.6 in urban areas but in rural areas it was higher at The old age dependency ratio was also larger in rural areas, 4.9 as compared to 3.5 in urban areas. The crude birth rate declined from 49.2 in 1988 to 41.8 in 1999 but the fall in crude death rate was even more pronounced as it fell from 8.9 in 1988 to 4.9 in

10 The annual rate of population growth of the RMI registered a dramatic decrease from 4.3 % in 1988 to 1.5 % in At a 1.5 percent annual rate of growth, the population of the country will double in 47 years from 5,84 in 1999 to over 1, in 246. If this trend in high birth rates continue and no other factors like out-migration and a decline in fertility, at the current natural increase rate of about 3.3 % (CBR-CDR), the population is likely to double in next 21 years. The explosive trend in urban population growth appears to have halted. The annual population growth rate of Majuro fell from 6.3 % in 1988 to 1.8 % in 1999 and similarly, there was a decline in the annual population growth rate of Ebeye from 4.2 % to 1.5 % over the same period. The average annual growth rates of atolls/islands varied widely from a negative rate of (-1.6 %) in Jabat to a positive rate of growth 4.5 % in Wotho. The population density of the country as a whole was 726 people per square mile. Majuro atoll has the highest population density, 6,314 persons per square mile. However, Ebeye was the most densely populated island with a density of 66,75 persons per square mile. The drop in total fertility from 7.2 in 1988 to 5.7 in 1999 is significant. Life Expectancy has increased for both males and females. It being 65.7 years for males and 69.4 for females, a difference of 3.7 years. On an average there were 7.8 persons per household in RMI in When compared to other pacific island countries this size of household is the largest in the region. The housing conditions in RMI are not adequate, there are too many persons living with inadequate space. In housing units with floor area of less than 21 square feet, there was an average of 7.1 occupants. About 18 % of total live births take place to the teen mothers and this trend is not showing any definite signs of decline. Child mortality (mortality below 5 years) is estimated at 48 in males and 37 in females which is still high when compared with the overall death rate of 4.9 and infant mortality rate of 37. Female child mortality is lower than mortality amongst male children in all the countries of central pacific. Only.3 % persons speak English at home in the Marshall Islands, which is perhaps the lowest in the countries of the central pacific region. The percentage of foreign nationals in the RMI was 2.3 % and the smallest of other Pacific Island Countries in the region. The per capita income in the RMI was estimated at 2,158 US dollars at current prices, the highest after the FSM amongst its neighboring countries. However, per capita income has been stagnant for the last several years. 1
, the population is likely to double in next 21 years. The explosive trend in urban population growth appears to have halted. The annual population growth rate of Majuro fell from 6.")
11 Table 1.1 Resident Population and Annual Population Growth Rate, Census Year Male Female Total Annual Natural Population Growth Rate Increase ,26 24,814 5, ,181 21,199 43, ,851 15,22 3, ,335 11,8 25, ,658 9,267 18, ,175 6,753 14, ,48 4,966 1, ,55 4,97 1, ,3 4,614 9, ,196 4,64 9,8.... *Unknown:91 and 235 in 1973 & 1958 Totals Natural Increase Rate=CBR minus CDR Source: Concerned Census Reports/EPPSO Rate Fig. 1.1 Population of Marshall Islands: Census Figures, Number of Persons 6, 5, 4, 3, 2, 1, Census Year Fig. 1.2 Population Growth Rates of RMI Percent Annual Growth Rate Rate of Natural Increase Census Year 11

12 Table 1.2 Land Area and Population Density by Atolls and Islands (persons per square mile), 1973 to 1999 Land area Atoll/Island (sq. mile) Population Density Population Density Total , Ailinglaplap , , Ailuk Arno , , Aur Bikini Ebon Enewetak Jabat Jaluit , , Kili Kwajalein , , Lae Lib Likiep Majuro ,415 1,48 5,249 1,61 Maloelap Mejit Mili Namorik Namu Rongelap Ujae Ujelang Utirik Wotho Wotje Not stated Table continues on next page 12

13 Continued Land area Atoll/Island (sq miles) Population Density Population Density Population Density Population Density Total , , , , Ailinglaplap 5.7 1, , , , Ailuk Arno 5 1, , , , Aur Bikini Ebon Enewetak Jabat Jaluit , , , Kili , 489 1, , ,15 Kwajalein 6.3 5, ,624 1,632* 9,311 1,471 1,92 1,722 Lae Lib Likiep Majuro 3.8 1,29 2,744 11,791 3,144 19,664 5,244 23,676 6,314 Maloelap Mejit Mili , Namorik Namu Rongelap Ujae Ujelang Utirik Wotho Wotje Not stated Note: United States Army Kwajalein Atoll (USAKA) area excluded from density calculation Sources: Census of the Trust Territory of the Pacific Islands (TTPI), 1958 (prepared by the High Commissioner, of the TTPI, June, 1959), 1973 Population of TTPI, 198 Census of Population, TTPI, US Bureau of Census, 1988 Census of Population and Housing, 1999 Census of Population and Housing 13

14 Table 1.3 Population Change: RATAK CHAIN and RALIK CHAINA Atolls/Islands Atoll/Island Marshall Islands 23,665 3,873 43,38 5,84 Ratak Chain Ailuk Arno 1,172 1,487 1,656 2,69 Aur Likiep Majuro 8,41 11,791 19,664 23,676 Maloelap Mejit Mili ,32 Utrik Wotje Total 12,53 17,189 25,878 3,925 Ralik Chain Ailinglaplap 1,136 1,385 1,715 1,959 Bikini Ebon Enewetak Jabat Jaluit 955 1,45 1,79 1,669 Kili Kwajalein 5,772 6,624 9,311 1,92 Lae Lib Namorik Namu Rongelap Ujae Ujelang 341 Wotho Total 11,135 13,684 17,52 19,915 Source: Census Reports Fig 1.3 Population Change: Ratak and Ralik Chain of Atolls/Islands Ratak Chain Ralik Chain No. of Pe rso ns 35, 3, 25, 2, 15, 1, 5, 12,53 11,135 17,189 13,684 3,925 25,878 17, ,98 1,988 1,999 19,915 Census Years 14

15 Table 1.4 Population of Majuro and Ebeye, Year Majuro Ebeye ,415 1, ,249 3, ,29 5, ,791 6, ,664 8, ,676 9,345 Source: Census Reports 25, Fig. 1.4 Population of Majuro and Ebeye, Majuro Ebe ye No. of Persons 2, 15, 1, 5, ,284 3,54 5,123 6,169 8,324 9, Census Years 15

16 Table 1.5 Population and Reproductive Health Indicators of RMI, 1999 Feature Country Urban Rural Total Male Female Total Male Female Total Male Female Total Population 5,84 26,26 24,814 33,125 16,846 16,279 17,715 9,18 8,535 Percent(%) Population 21,85 11,227 1,578 13,432 6,84 6,592 8,373 4,387 3,986 Percent(%) Population 18,374 9,345 9,29 11,854 5,994 5,86 6,52 3,351 3,169 Percent(%) Adolescent(1-19) 13,829 7,79 6,75 8,659 4,39 3,66 3,54 1,762 1,742 Percent(%) Youth(15-24) 1,861 5,459 5,42 7,357 3,697 3,66 3,54 1,762 1,742 Percent(%) Population 1, Percent(%) Population 27,85 14,227 13,623 19,15 9,674 9,341 8,835 4,553 4,282 Percent(%) Median Age Mean Age Total Dependency Ratio Child Dependency Ratio Old age Dependency Ratio Sex Ratio The percentages are to the same sex in the base population Source: Based on 1999 Census The decrease in the proportion of the population of children below 15 and those who were 65 and above resulted in the decline of both the child and old age dependency ratios of the RMI. These ratios declined from 11.6 in 1988 to 78.3 in 1999 and from 6.3 in 1988 to 3.9 in It is worth noting that both these ratios are much higher in rural populations than in the urban areas. 16
 36.1 35.9 36.4 35.8 33.2 36. 36.8 36.5 37.")
17 Table 1.6 Population, Annual Rate of Increase, Surface Area and Density of Population of Pacific Island Countries compared Country Total Population Annual Rate(%) of Surface Area Density of Population (2 Estimated) Increase(estimated) (square kms.) (Per Sq. Km.) Cook Islands 18, Fiji 814, 18, French Polynesia 233, 2.1 4, 58 Guam 155, Marshall Islands 51, FSM 12, Nauru 12, New Caledonia 211, , Niue 2, Northern M. Islands 73, Palau 19, Papua n. Guinea 4,89, ,84 1 Samoa 171, 1.2 2,831 6 Solomon Islands 447, Tonga 99, Tuvalu 1, Vanautu 197, Source: UN Demographic Year Book 2 Table 1.7 Percent Population Increase in Selected Pacific Countries, Country Population Increase (%) Guam 46.1 CNMI A.Samoa 77.4 Palau 57.9 FSM 46.3 RMI 64.7 Source: Ben Graham, IPC Statistical Enhancement Program, US Census Bureau Fig. 1.5 Percent Population Increase In Selected Pacific Countries, Percent Increase Guam CNMI A.Sam oa Palau FSM RMI Countries 17

18 Table 1.8 Percentage of Population Under 18 in Some Selected Pacific Countries, 2 Under 18 Country % of Total Population Guam 35.4 CNMI 25.6 A.Samoa 44.6 Palau 28.6 FSM 48. RMI 5.5 Source: Ben Graham, IPC Statistical Enhancement Program, US Census Bureau Fig. 1.6 Percent Population Under 18 in Selected Pacific Countries, Percentages Guam CNMI A.Samoa Palau FSM RMI Countries Table 1.9 Demographic Profile of RMI Item Total Fertility Rate Gross Reproduction Rate General Fertility Rate Crude Birth Rate Crude Death Rate Infant Mortality Rate Life Expectancy at Birth in Years Both Sexes Males Females Source: Census Reports There has been a appreciable decline in crude birth rate, crude death rate, infant mortality rate, general fertility rate, total and gross fertility rates from 1988 to The life expectancy at birth increased from 61. years in 1988 to 67.5 years in The life expectancy of females increased even more, as it went up from 62.7 years in 1988 to 69.4 years in The life expectancy of males was 65.7 years. 18

19 Table 1.1 Age Specific Fertility and Total Fertility Rates, and 1999, RMI Age Rate Per Thousand Women Group TFR Source: Census Reports and Statistical Abstracts Fig 1.7 Total Fertility Rates RMI Over Years No. Of Children Years Fig 1.8 Age Specific Rates in RMI Over Years Children Per Thousand ASFR1973 ASFR198 ASFR1988 ASFR Age Group of Women 19

20 Table 1.11 Age Specific Fertility Rates Of Marshall Islands 1999 Age No. of No. of Births Fertility Rates Women in 1999 Per Woman Per Thousand , , , , , , Total 12,257 2,125 General Fertility Rate: Total Fertility Rate: 5.7 Urban Rate: 5.5 Rural rate: 6.3 Source: RMI Census Fig 1.9 Age Specific Fertility Rates of RMI 1999 Per Thousand Age Group of Women The reproduction of children still starts at very early age in the Marshall Islands and remains high for many years resulting in a high total fertility rate. Fertility is higher in rural women. The contraception prevalence rate is very low and birth intervals are very close, this takes a toll on the health of the mother and child and is a serious constraint in improving health for the women. 2

21 Table 1.12 Mean Children Born to Marshallese Women by Age : 1988 and 1999 Age of Mean Children Born Mother Mean Source: Census Reports Fig 1.1 Mean Children Born:1988 and Me an No. of Ch ildr en Mean of All Age of Mother 21
22 Table 1.13 Child Mortality Rates in Selected Pacific Countries Country Male Female Marshall Islands Kiribati Solomon Islands Tuvalu Vanauatu Tonga Niue Fiji Palau Samoa Cook Islands Nauru FSM Philippines Child Mortality = Mortality of children before reaching the age of 5 Source: WHO website Fig 1.11 Child mortality in the Pacific countries 9 8 Male Female 7 6 Mortality rates Marshall Islands Kiribati Solomon Islands Tuvalu Vanauatu Tonga Niue Fiji Palau Country Samoa Cook Islands Nauru FSM Phillipines 22
23 Table 1.14 Percent Foreign Nationals in Selected Pacific Countries, 2 Country Percent Foreign Nationals Guam 18.1 CNMI 56.5 A.Samoa 35.3 Palau 3.9 FSM 2. RMI 2.3 Source: Ben Graham, IPC Statistical Enhancement Program, US Census Bureau Fig 1.12 Percent Foreign Nationals in Selected Pacific Countries, Percentages Guam CNMI A.Samoa Palau FSM RMI Countries After Federated States of Micronesia, among the Pacific Island Countries, the number of foreign nationals was the lowest in the Republic of Marshall Islands. 23
24 Table 1.15 Percent English Spoken at Home in Selected Pacific Countries, 2 Country Percent English Spoken Guam 38.3 CNMI 1.8 A.Samoa 2.9 Palau 9.4 FSM 1.4 RMI.3 Source: Ben Graham, IPC Statistical Enhancement Program, US Census Bureau Fig 1.13 Percent English Spoken at Home in Selected Pacific Countries, Percentages Guam CNMI A.Samoa Palau FSM RMI Countries 24
25 Table 1.16 Average Persons Per Household in Selected Pacific Countries, 2 Country Household Size Guam 3.9 CNMI 3.7 A.Samoa 6.1 Palau 4.6 FSM 6.7 RMI 7.8 Source: Ben Graham, IPC Statistical Enhancement Program, US Census Bureau Fig 1.14 Average Persons Per Household in Selected Pacific Countries, Percentages Guam CNMI A.Samoa Palau FSM RMI Countries The size of 7.8 persons per household in the Republic of Marshall Islands is the largest amongst the Pacific Island Countries. The Federated States of Micronesia has the second largest household size of 6.7 persons. 25
26 Table 1.17 Percent Occupants in Housing Units by Floor Area and Mean Number of Occupants in RMI in 1999 Description of Floor Area of Housing Unit (in Square Feet) Percent Housing Units < Occupants 1 Occupant Occupants Occupants Occupants Occupants Occupants Total Mean Number of occupants per house Source: RMI Census 1999 Fig 1.15 Mean Number of Occupants Per Housing Unit Numbers < Floor Area of the Housing Units in Square Feet Housing in Marshall Islands, is a serious problem. Housing units are small and household size is large, about 8 persons per household. Even in a small housing unit of size less than 18 square feet, in some cases, up to 2 people make up the household. Crowding in housing units is worse in Kwajalein and Lae Atolls where in 6 percent of the housing units have more than 2 persons per dwelling. 26
27 Table 1.18 Households by Annual Income and by Atolls/Islands: 1999 Census Atoll/Island Number of Households by Income Groups (Income in US Dollars) 1,- 5,- 1,- 19,- 5,- 7, Median Total <1, 4,999 9,999 18,999 49,999 69,999 & Over Income per Household RMI 6, ,663 1,54 1, ,84 Ailinglaplap Ailuk Arno ,845 Aur ,56 Ebon Enewetak ,75 Jabat Jaluit ,273 Kili ,114 Kwajalein 1, ,195 Lae ,714 Lib Likiep ,133 Majuro 3, ,3 Maloelap ,635 Mejit ,263 Mili ,51 Namdrik ,49 Namu Ujae Utirik ,25 Wotho ,8 Wotje ,875 Source: Census 1999 The median annual income per household in 1999 was 6,84 US dollars but it varied widely from 625 US dollars in Lib to 14,195 US dollars in Kwajalein. The median income of other three atolls was higher than the national average-enewetak with 1,75 US dollars, Majuro with 9,3 US dollars and Kili with 8,114 US dollars. If the figures at the national level are analysed, 13.7 percent households have income less than 1, US dollars per annum whereas 34 households,.5 percent of the total households, had income over 7, US dollars per annum. 27
28 Table 1.19 Trend in Per Capita Income (US Dollars) at Current Prices: Some Selected Pacific Countries Year RMI FSM PNG Kiribati Samoa Tonga Vanautu , ,487 1, ,192 1, ,221 2,2 1, ,219 1,64 1, ,922 1, ,339 1,491 1, ,93 1, ,383 1,486 1, ,852 2, ,33 1,48 1, ,863 2, ,358 1,296 1, ,867 2, ,544 1,337 1,58 Source: ADB, Key Indicators 23 Fig 1.16 Per Capita Income 22: Selected Pacific Countries 2,5 1,867 2,158 US Dollars 2, 1,5 1, ,544 1,337 1,58 5 RMI FSM PNG Kiribati Samoa Tonga Vanautu Countries 28
29 Table 1.2 Human Poverty Index for Pacific Island Countries, 1998 Country Percentage of Percentage Percentage of Percentage of Percentage of Combined Human people not of adults people without people without children P3 Value Poverty expected who are access to access to >5 who are Index to survive to age 4 illiterate safe water health services underweight (P1) (P2) (P3) (P3) (P3) Niue Tonga Cook Islands Tuvalu Tokelau Fiji Islands Samoa Palau Nauru Kiribati Marshall Islands FSM Vanuatu Solomon Islands Papua new Guinea Source: UNDP, Pacific Human Development Report 1999 The Marshall Islands ranked 11th among Pacific Island Countries in the Human Poverty Index. 29
30 Table 1.21 Human Development Index for Pacific Island Countries, 1998 Country Adult Combined Life GDP Global literacy(%) gross Expectancy per capita HDI enrolment at birth (US$) HDI Rank* (%) Palau Cook Islands Niue Fiji Islands Nauru Tonga Samoa Tuvalu FSM Marshall Islands Kiribati Vanuatu Solomon Islands Papua New Guinea Tokelau n.a n.a n.a Note: The per capita income figures do not match with the ADB estimates. Source: UNDP, Pacific Human Development Report 1999 The Marshall Islands ranked 1th among Pacific Island Countries in the Human Development Index. 3
31 Table 1.22 Mayors in various Atolls by Male and Female from 1983 onwards in RMI Atoll Council Male Female Male Female Male Female Male Female Male Ailinglaplap Ailuk Arno Aur Bikini Ebon Enewetak Jabat Jaluit Kwajalein Lae* Lib* Likiep Majuro Maloelap Mejit Mili Namdrik Namu Rongelap Ujae* Utirik Wotho Wotje Total * Councilors of Lae, Lib and Ujae, elected unanimously same person as Mayor for 1995 term. Councilors of Lae and Ujae elected unanimously same person as their Mayor for 1999 term. Source: Ministry of Internal Affairs The representation of women as Mayors in the elected bodies of the Local Councils has been very low with the exception of Majuro and Ebon where in 4 out of 5 terms women were elected as Mayors. 31
32 Table 1.23 Number of Senators Elected to Nitijela, by Sex, Year No. of Senators Male Female Total Source: Ministry of Internal Affairs Fig 1.17 Representation of Senators in Nitijela by Sex, 1999 Fem ale 3% Male 97% The representation of women has never more than one of 33 Senators in the Nitijela 32
33 Table 1.24 Number of Members on Council of Iroij by Sex, , RMI Year No. of Council Members Male Female Total Source: Ministry of Internal Affairs Fig 1.18 Representation of members in Council of Iroij by Sex, 1999 Fem ale 45% Male 55% Strangely enough, the representation of women in the Council of Iroij, has always been close to the number of men. 33
34 Table 1.25 Elected Council Members in Atoll Councils by Male and Female, 1983 to 1999 in RMI Number of Council Members by Sex Atoll Council Male Female Male Female Male Female Male Female Ailinglaplap Ailuk Arno Aur Bikini Ebon* Enewetak Jabat Jaluit Kwajalein Lae Lib Likiep Majuro Maloelap Mejit Mili Namdrik Namu Rongelap Ujae Utirik Wotho Wotje Total Note: Information for the year 1983 is not available. *All Clan Heads of Alaps are Councillors. Source: Ministry of Internal Affairs The representation of women in elected bodies of the Local Councils has been very low. In Arno, women have never been elected as member to the Council. In most of other Councils as well, not more than two women at a time have ever sat on atoll councils. 34
35 Chapter 2- Health Services Medical and Health Services Medical and health services in the Marshall Islands are delivered in two distinct settings, hospitals in the urban areas of Majuro and Ebeye and medical dispensaries on the outer islands. Hospitals offer both primary and secondary health care services, and outer island health centers provide very basic health care services to the scattered populations in the outer islands. The Majuro hospital is the main national hospital with a total of 97 beds. It has facilities that provide specialist services in the areas of general medicine, surgery, orthopedics, obstetrics and gynecology, pediatrics, ENT, ophthalmology, and dentistry. The hospital has a qualified radiologist, anesthetist and pathologist who are available to provide back up to the specialists and the diagnostic laboratories. Sometimes the number of beds is not sufficient and temporary beds are placed in hallways to cope up with the increased admissions. The hospital is being extended with financial assistance from the Japanese government. This will include buildings for public health, diagnostic laboratories and administration. Plans are being developed to begin reconstruction of the hospital in fiscal year 26. The primary health care wing of the Majuro hospital, handles the treatment for tuberculosis, leprosy, diabetes, STDs, immunization, reproductive health including family planning, pediatrics, adolescent health, school health, dental health, health education and oral health. The hospital at Ebeye serves the population of Ebeye, Kwajalein atoll and the surrounding outer islands. There are a total of 43 beds in the hospital. The hospital was newly constructed and opened in the Fall of 22 with assistance from the Asian Development Bank and the US Department of the Interior. This hospital also has specialist services for treatment in medical, surgical, obstetric/gynecology and pediatric areas. Facilities for orthopedics, ENT and ophthalmology are, however, not available. The diagnostic laboratory facilities are limited because of a lack of equipment and regents. The services of the radiologist and anesthetist are available. In Ebeye, there is an acute shortage of residential accommodation and for housing foreign specialists and nursing staff. This makes healthcare delivery even more difficult for the community. The primary health care wing is responsible for preventive health and curative services in tuberculosis, leprosy, diabetes, STDs, immunization, reproductive health, family planning, pediatrics, school health, health education and oral health. To provide the medical and health care on isolated, scattered and sparsely populated atolls is a challenging task. In the Health Centers, the Health Assistant, is usually a high school graduate with multipurpose training in basic primary health. The facilities available in the outer island health centers are very basic. Currently there are 49 health centers functioning in the outer islands. The government has a target of 6 functional health centers, which is likely to be achieved in October, 24 with the graduation of 16 health assistants currently undergoing training in Majuro hospital. Most of the health assistants are males whereas culturally women prefer services to be provided to them by women particularly in areas relating to prenatal, deliveries, postnatal care and family planning services. 35
Goal 2: Achieve Universal Primary Education
 92 Goal 2: Achieve Universal Primary Education In eight economies in the region including a number from the Pacific, total net enrollment ratios in primary education are below 80%. Eleven economies including
ASIA AND PACIFIC VEHICLE STANDARDS & FLEETS
 ASIA AND PACIFIC VEHICLE STANDARDS & FLEETS 14 vehicles per 1000 people (), up from 11 in 1990 Afghanistan Bangladesh Bhutan Brunei Darussalam Cambodia less than three years old. Importation of used vehicles
WORLD REGIONAL GEOGRAPHY. By Brett Lucas
 WORLD REGIONAL GEOGRAPHY By Brett Lucas PACIFIC REALM AND POLAR Defining the Realm & Regions Defining the Realm Sea Hemisphere: seas cover nearly an entire hemisphere: Fragmented, culturally complex
Chuuk State Census Report
 Chuuk State Census Report 2000 FSM Census of Population and Housing December 2002 Chuuk Branch Statistics Office Division of Statistics Department of Economic Affairs National Government Weno, Chuuk 96942
Demographic Analysis of the Salt River Pima-Maricopa Indian Community Using 2010 Census and 2010 American Community Survey Estimates
 Demographic Analysis of the Salt River Pima-Maricopa Indian Community Using 2010 Census and 2010 American Community Survey Estimates Completed for: Grants & Contract Office The Salt River Pima-Maricopa
Population, Health, and Human Well-Being-- Benin
 Population, Health, and Human Well-Being-- Benin Demographic and Health Indicators Benin Sub- Saharan Africa World Total Population (in thousands of people) 1950 2,046 176,775 2,519,495 2002 6,629 683,782
ECONOMIC ANALYSIS (Republic of the Marshall Islands: Public Sector Program)
") Public Sector Program (RRP RMI 43321-1) A. Summary ECONOMIC ANALYSIS (Republic of the Marshall Islands: Public Sector Program) 1. The Republic of the Marshall Islands (RMI) gross domestic product (GDP)
Public Sector Program (RRP RMI 43321-1) A. Summary ECONOMIC ANALYSIS (Republic of the Marshall Islands: Public Sector Program) 1. The Republic of the Marshall Islands (RMI) gross domestic product (GDP)
Comparisons of Health Expenditure in 3 Pacific Island Countries using National Health Accounts
 Comparisons of Health Expenditure in 3 Pacific Island Countries using National Health Accounts Hopkins Sandra* Irava Wayne. ** Kei Tin Yiu*** *Dr Sandra Hopkins PhD Director, Centre for International Health,
Child Survival and Equity: A Global Overview
 Child Survival and Equity: A Global Overview Abdelmajid Tibouti, Ph.D. Senior Adviser UNICEF New York Consultation on Equity in Access to Quality Health Care For Women and Children 7 11 April 2008 Halong
Goal 1: Eradicate extreme poverty and hunger. 1. Proportion of population below $1 (PPP) per day a
 per day a") Annex II Revised Millennium Development Goal monitoring framework, including new targets and indicators, as recommended by the Inter-Agency and Expert Group on Millennium Development Goal Indicators At
Annex II Revised Millennium Development Goal monitoring framework, including new targets and indicators, as recommended by the Inter-Agency and Expert Group on Millennium Development Goal Indicators At
Report to the Congress. on the. Compacts of Free Association. with. the Federated States of Micronesia and the Republic of the Marshall Islands
 Report to the Congress on the Compacts of Free Association with the Federated States of Micronesia and the Republic of the Marshall Islands For Fiscal Year 2005 Table of Contents Introduction.. 3 A) General
THE NEW DELHI DECLARATION ON SOUTH-SOUTH COOPERATION FOR CHILD RIGHTS IN ASIA AND THE PACIFIC
 THE NEW DELHI DECLARATION ON SOUTH-SOUTH COOPERATION FOR CHILD RIGHTS IN ASIA AND THE PACIFIC We, the delegations of the governments of Afghanistan, Bangladesh, Bhutan, Brunei Darussalam, Cambodia, China,
Demographic Profile For Seminole County 1
 Demographic Profile For County 1 AGRICULTURE... Farm Gate Value ($000), 2013 127,032 13,591,936 85,484 Farm Gate Value per Farm, Dollars, 2013 852,567 321,649 324,352 Farm Gate Value per Farm Acre, Dollars,
New Mexico. Comparison Profile prepared by the New Mexico Economic Development Department State Data Center. Page 1 of 5
 DEMOGRAPHICS Population estimates, July 1, 2014 2,085,572 Population, percent change - April 1, 2010 to July 1, 2014 1.4% Population estimates, July 1, 2013 2,085,287 Population, percent change - April
Comparative Report. Pacific Region Electricity Bills
 Comparative Report Pacific Region Electricity Bills July 2014 Letter from the CEO In September 2013, the URA Staff prepared and released its first Electricity Bills Comparison Report for the Pacific region.
Current challenges in delivering social security health insurance
 International Social Security Association Afric ISSA Meeting of Directors of Social Security Organizations in Asia and the Pacific Seoul, Republic of Korea, 9-11 November 2005 Current challenges in delivering
GLOSSARY ABTC APEC API ASEAN
 GLOSSARY ABTC APEC Business Travel Card Card used by business travellers from APEC member countries to enable visa-free travel between APEC countries and expedited processing at immigration checkpoints.
Comparison Profile prepared by the New Mexico Economic Development Department State Data Center. Page 1 of 5
 Comparing New Mexico to Colorado DEMOGRAPHICS Colorado New Mexico Population estimates, July 1, 2014 5,355,866 2,085,572 Population, percent change - April 1, 2010 to July 1, 2014 1.4% 1.4% Population
Briefing note for countries on the 2015 Human Development Report. Philippines
 Human Development Report 2015 Work for human development Briefing note for countries on the 2015 Human Development Report Philippines Introduction The 2015 Human Development Report (HDR) Work for Human
UTILITIES REGULATORY AUTHORITY. Pacific Region Electricity Bills. Comparison Report 2013 ELECTRICITY SECTOR. September 2013
 Pacific Region Electricity Bills Comparison Report 2013 ELECTRICITY SECTOR September 2013 UTILITIES REGULATORY AUTHORITY 2013 Utilities Regulatory Authority. This publication is copyright. No part may
Thailand. Country coverage and the methodology of the Statistical Annex of the 2015 HDR
 Human Development Report 2015 Work for human development Briefing note for countries on the 2015 Human Development Report Thailand Introduction The 2015 Human Development Report (HDR) Work for Human Development
Malawi Population Data Sheet
 Malawi Population Data Sheet 2012 Malawi s Population Is Growing Rapidly Malawi Population (Millions) 26.1 19.1 13.1 9.9 8.0 4.0 5.5 1966 1977 1987 1998 2008 2020 2030 Malawi s population is growing rapidly,
Portugal. Country coverage and the methodology of the Statistical Annex of the 2015 HDR
 Human Development Report 2015 Work for human development Briefing note for countries on the 2015 Human Development Report Portugal Introduction The 2015 Human Development Report (HDR) Work for Human Development
1965 Alabama Literacy Test
 1965 Alabama Literacy Test 1. Which of the following is a right guaranteed by the Bill of Rights? Public Education Employment Trial by Jury Voting 2. The federal census of population is taken every five
The Burden of Cancer in Asia
 P F I Z E R F A C T S The Burden of Cancer in Asia Medical Division PG283663 2008 Pfizer Inc. All rights reserved. Printed in USA/December 2008 In 2002, 4.2 million new cancer cases 39% of new cases worldwide
INDICATOR REGION WORLD
 SUB-SAHARAN AFRICA INDICATOR REGION WORLD Demographic indicators Total population (2005) 713,457,000 6,449,371,000 Population under 18 (2005) 361,301,000 2,183,143,000 Population under 5 (2005) 119,555,000
HEALTH TRANSITION AND ECONOMIC GROWTH IN SRI LANKA LESSONS OF THE PAST AND EMERGING ISSUES
 HEALTH TRANSITION AND ECONOMIC GROWTH IN SRI LANKA LESSONS OF THE PAST AND EMERGING ISSUES Dr. Godfrey Gunatilleke, Sri Lanka How the Presentation is Organized An Overview of the Health Transition in Sri
We Shall Travel On : Quality of Care, Economic Development, and the International Migration of Long-Term Care Workers
 We Shall Travel On : Quality of Care, Economic Development, and the International Migration of Long-Term Care Workers by Donald L. Redfoot Ari N. Houser AARP Public Policy Institute October 20, 2005 The
India. Country coverage and the methodology of the Statistical Annex of the 2015 HDR
 Human Development Report 2015 Work for human development Briefing note for countries on the 2015 Human Development Report India Introduction The 2015 Human Development Report (HDR) Work for Human Development
G20 EMPLOYMENT WORKING GROUP COUNTRY SELF-REPORTING TEMPLATE ON IMPLEMENTATION OF G20 EMPLOYMENT PLANS
 G20 EMPLOYMENT WORKING GROUP COUNTRY SELF-REPORTING TEMPLATE ON IMPLEMENTATION OF G20 EMPLOYMENT PLANS Contents 1. Key economic and labour market indicators 2. Key policy indicators 3. Checklist of commitments
This issue of Public Health Data Watch covers. Public Health Data Watch. Health of Native Hawaiians and Other Pacific Islanders in King County
 Public Health Seattle & King County Public Health Data Watch Volume 1 Number 1 August 28 Health of Native Hawaiians and Other Pacific Islanders in King County Key Points Over 15, Native Hawaiian and Other
Rights of and Procedures of Admission in South Pacific Countries
 Rights of and Procedures of Admission in South Pacific Countries By Pauline Mogish, presented by David Lambu, PNG Legal Training Institute Introduction The rights of persons to be admitted as lawyers (barristers
The shaded areas of the map represent ESCAP members and associate members.
 ESCAP is the regional development arm of the United Nations and serves as the main economic and social development centre for the United Nations in Asia and the Pacific. Its mandate is to foster cooperation
World Population Growth
 3 World Population Growth Why is world population growing faster than ever before? Population dynamics are one of the key factors to consider when thinking about development. In the past years the world
Income is the most common measure
 Income Goal A healthy standard of living for all Income is the most common measure of socioeconomic status, and a strong predictor of the health of an individual or community. When assessing the health
Three Branches of Government. Lesson 2
 Three Branches of Government The Executive Branch The President of the United States is the leader of the executive branch. The President s duties are to: Enforce federal laws and recommend new ones Serve
Global Demographic Trends and their Implications for Employment
 Global Demographic Trends and their Implications for Employment BACKGROUND RESEARCH PAPER David Lam and Murray Leibbrandt Submitted to the High Level Panel on the Post-2015 Development Agenda This paper
Statement by Dr. Sugiri Syarief, MPA
 Check against delivery_ Commission on Population and Development 45th Session Economic and Social Council Statement by Dr. Sugiri Syarief, MPA Chairperson of the National Population and Family Planning
Convention on the Elimination of All Forms of Discrimination against Women
 United Nations CEDAW/C/ETH/Q/6-7 Convention on the Elimination of All Forms of Discrimination against Women Distr.: General 4 November 2010 Original: English Committee on the Elimination of Discrimination
Policy Perspectives Paper
 Review of the Measurement of Ethnicity Policy Perspectives Paper Main Paper July 2001 Kate Lang Social Policy Division Statistics New Zealand Statistics New Zealand Review of the Measurement of Ethnicity
Health and Longevity. Global Trends. Which factors account for most of the health improvements in the 20th century?
 8 Health and Longevity The health of a country s population is often monitored using two statistical indicators: life expectancy at birth and the under-5 mortality rate. These indicators are also often
Pacific Technical Support
 Pacific Technical Support AFP The Division of Pacific Technical Support (DPS) was created in 2010 to serve 21 Pacific island countries and areas. Although these countries and areas all have relatively
Human Development Index (HDI)
") Human Development Report 2015 Work for human development Briefing note for countries on the 2015 Human Development Report Iraq Introduction The 2015 Human Development Report (HDR) Work for Human Development
Human Development Report 2015 Work for human development Briefing note for countries on the 2015 Human Development Report Iraq Introduction The 2015 Human Development Report (HDR) Work for Human Development
Lake County. Government Finance Study. Supplemental Material by Geography. Prepared by the Indiana Business Research Center
 County Government Finance Study Supplemental Material by Geography Prepared by the Indiana Business Research www.ibrc.indiana.edu for Sustainable Regional Vitality www.iun.edu/~csrv/index.shtml west Indiana
Appendix E. Methodology for Statistical Analyses. Comparing North Carolina s Local Public Health Agencies 1
 Appendix E Methodology for Statistical Analyses Comparing North Carolina s Local Public Health Agencies 1 Appendix E Methodology for Statistical Analyses Data Based on prior research and data availability,
Men in Nursing Occupations
 Men in Nursing Occupations American Community Survey Highlight Report Issued February 2013 Introduction Healthcare is one of the fastest growing industries. 1 The aging of our population fuels an increasing
Nukunonu atoll profile: 2011 Tokelau Census of Population and Dwellings
 Nukunonu atoll profile: 2011 Tokelau Census of Population and Dwellings Crown copyright This work is licensed under the Creative Commons Attribution 3.0 New Zealand licence. You are free to copy, distribute,
UGANDA HEALTH CARE SYSTEM
 UGANDA HEALTH CARE SYSTEM Community and Home based Rehabilitation Course Julius Kamwesiga KI May 2011 Objectives 1. Define a Health System 2. Describe how Ugandan Health care System is organized 3. Outline
Comparative Report. Pacific Region Electricity Bills
 Comparative Report Pacific Region Electricity Bills June 2015 Letter from the CEO This is the third report of the Utilities Regulatory Authority (URA) on electricity bills comparisons for the small pacific
United Kingdom. Country coverage and the methodology of the Statistical Annex of the 2015 HDR
 Human Development Report 2015 Work for human development Briefing note for countries on the 2015 Human Development Report United Kingdom Introduction The 2015 Human Development Report (HDR) Work for Human
Fees Guide. What do you pay? INZ 1028
 December 2015 INZ 1028 Fees Guide A guide to Immigration New Zealand s fees and immigration levy This guide provides information about the fees and immigration levy Immigration New Zealand (INZ) charges,
Population, Health, and Human Well-Being-- Nigeria
 Population, Health, and Human Well-Being-- EarthTrends Country Profiles Demographic and Health Indicators Total Population (in thousands of people) 195 29,79 176,775 2,519,495 22 12,47 683,782 6,211,82
Congo (Democratic Republic of the)
") Human Development Report 2015 Work for human development Briefing note for countries on the 2015 Human Development Report Congo (Democratic Republic of the) Introduction The 2015 Human Development Report
Human Development Report 2015 Work for human development Briefing note for countries on the 2015 Human Development Report Congo (Democratic Republic of the) Introduction The 2015 Human Development Report
Health sector reform and the Health Management Reform Project in Fiji
 PNG Med J 2006 Sep-Dec;49(3-4): 87-92 Health sector reform and the Health Management Reform Project in Fiji LUKE ROKOVADA 1 Ministry of Health, Suva, Fiji Introduction The Fiji Health Management Reform
MDG 4: Reduce Child Mortality
 143 MDG 4: Reduce Child Mortality The target for Millennium Development Goal (MDG) 4 is to reduce the mortality rate of children under 5 years old (under-5 mortality) by two-thirds between 1990 and 2015.
Annex 8: SDG Indicator Mapping
 Annex 8 SDG Indicator Mapping 1. Annex 8 responds to Executive Board decision below, regarding the refinement of indicators and targets of the Strategic Plan Integrated Results and Resources Framework
Briefing note for countries on the 2015 Human Development Report. Mozambique
 Human Development Report 2015 Work for human development Briefing note for countries on the 2015 Human Development Report Mozambique Introduction The 2015 Human Development Report (HDR) Work for Human
1.0 INTRODUCTION. 1.2: The 2008 Population and Housing Census
 1.0 INTRODUCTION 1.1: Background: Population and housing censuses have regularly been conducted in Malawi since the colonial era. However, the most comprehensive censuses have only been undertaken during
Population, Health, and Human Well-Being-- Kuwait
 Population, Health, and Human Well-Being-- EarthTrends Country Profiles Demographic and Health Indicators Total Population (in thousands of people) 195 152 111,647 2,519,495 22 2,23 423,296 6,211,82 225
Nepal. Country coverage and the methodology of the Statistical Annex of the 2015 HDR
 Human Development Report 2015 Work for human development Briefing note for countries on the 2015 Human Development Report Nepal Introduction The 2015 Human Development Report (HDR) Work for Human Development
Russian Federation. Country coverage and the methodology of the Statistical Annex of the 2015 HDR
 Human Development Report 2015 Work for human development Briefing note for countries on the 2015 Human Development Report Russian Federation Introduction The 2015 Human Development Report (HDR) Work for
SELECTED POPULATION PROFILE IN THE UNITED STATES. 2013 American Community Survey 1-Year Estimates
 S0201 SELECTED POPULATION PROFILE IN THE UNITED STATES 2013 American Community Survey 1-Year Estimates Supporting documentation on code lists, subject definitions, data accuracy, and statistical testing
Sierra Leone. Country coverage and the methodology of the Statistical Annex of the 2015 HDR
 Human Development Report 2015 Work for human development Briefing note for countries on the 2015 Human Development Report Sierra Leone Introduction The 2015 Human Development Report (HDR) Work for Human
QUOTAS IN PRACTICE: THE CHALLENGE OF IMPLEMENTATION AND ENFORCEMENT IN RWANDA
 QUOTAS IN PRACTICE: THE CHALLENGE OF IMPLEMENTATION AND ENFORCEMENT IN RWANDA Honourable Judith Kanakuze, Member of Parliament, Chamber of Deputies, Kigali, Rwanda A paper presented at the International
FREE MEDICINE PROGRAM CHECKLIST
 CHECKLIST Completed and Signed Registration Form Additional Dependants Form (if any). Evidence confirming annual salary less than $20,000 or Completed and Signed Statutory Declaration. One passport sized
The practice of medicine comprises prevention, diagnosis and treatment of disease.
 English for Medical Students aktualizované texty o systému zdravotnictví ve Velké Británii MUDr Sylva Dolenská Lesson 16 Hospital Care The practice of medicine comprises prevention, diagnosis and treatment
COMMITTEE ON THE RIGHTS OF THE CHILD. Twenty- Second Session CONSIDERATION OF REPORTS SUBMITTED BY STATES PARTIES UNDER ARTICLE 44 OF THE CONVENTION
 UNITED NATIONS CRC Convention on the Rights of the Child Distr. GENERAL CRC/C/15/Add.111 10 November 1999 Original: ENGLISH COMMITTEE ON THE RIGHTS OF THE CHILD Twenty- Second Session CONSIDERATION OF
Bolivia (Plurinational State of)
") Human Development Report 2015 Work for human development Briefing note for countries on the 2015 Human Development Report Bolivia (Plurinational Introduction The 2015 Human Development Report (HDR) Work
Human Development Report 2015 Work for human development Briefing note for countries on the 2015 Human Development Report Bolivia (Plurinational Introduction The 2015 Human Development Report (HDR) Work
Evolution of informal employment in the Dominican Republic
 NOTES O N FORMALIZATION Evolution of informal employment in the Dominican Republic According to official estimates, between 2005 and 2010, informal employment fell from 58,6% to 47,9% as a proportion of
INDICATOR REGION WORLD
 SUB-SAHARAN AFRICA INDICATOR REGION WORLD Demographic indicators Total population (2006) 748,886,000 6,577,236,000 Population under 18 (2006) 376,047,000 2,212,024,000 Population under 5 (2006) 125,254,000
KANKAKEE COUNTY ANALYSIS OF COMMUNITY HEALTH NEEDS
 ANALYSIS OF COMMUNITY HEALTH NEEDS March 2007 Prepared for Kankakee County Health Department Provena St. Mary s Hospital Riverside HealthCare Prepared by University of Illinois College of Medicine at Rockford
Measuring Women Status And Gender Statistics in Cambodia Through the Surveys and Census
 Global Forum on Gender Statistics 27 29 March 2012, Dead Sea, Jordan Measuring Women Status And Gender Statistics in Cambodia Through the Surveys and Census By Mrs. Hang Lina, Deputy Director General National
Ukraine: Trends and Regional Dynamics in Population, Health, and Migration
 : Trends and Regional Dynamics in Population, Health, and Migration PONARS Eurasia Policy Memo No. 344 September 2014 Judy Twigg Virginia Commonwealth University Today s conflict in hinges on perceptions
Central Statistics Office (CSO). Official Communication, 2 May 2007; and past communication.
. Official Communication, 2 May 2007; and past communication.") Key Indicators of Developing Asian and Pacific Countries 419 SOURCES AFGHANISTAN Mining and Index Coal Electricity Central Statistics Office (CSO). Official Communication, 2 May 2007; and past CSO. Official
Key Indicators of Developing Asian and Pacific Countries 419 SOURCES AFGHANISTAN Mining and Index Coal Electricity Central Statistics Office (CSO). Official Communication, 2 May 2007; and past CSO. Official
A case of Timor-Leste: From independence to instability or prosperity?
 MPRA Munich Personal RePEc Archive A case of Timor-Leste: From independence to instability or prosperity? Di Wang and Dong Wang and Weiren Wang 28. December 2012 Online at https://mpra.ub.uni-muenchen.de/43751/
The Role of International Law in Reducing Maternal Mortality
 The Role of International Law in Reducing Maternal Mortality K. Madison Burnett * Safe motherhood is a human rights issue The death of a woman during pregnancy or childbirth is not only a health issue
Briefing note for countries on the 2015 Human Development Report. Burkina Faso
 Human Development Report 2015 Work for human development Briefing note for countries on the 2015 Human Development Report Burkina Faso Introduction The 2015 Human Development Report (HDR) Work for Human
Tanzania: Population, Reproductive Health & Development. Photo credits: IFAD / Christine Nesbitt and Robert Grossman and USAID.
 Tanzania: Population, Reproductive Health & Development Photo credits: IFAD / Christine Nesbitt and Robert Grossman and USAID. Hosted by the Government Population Planning Section President s s Office,
Brazil. Country coverage and the methodology of the Statistical Annex of the 2015 HDR
 Human Development Report 2015 Work for human development Briefing note for countries on the 2015 Human Development Report Brazil Introduction The 2015 Human Development Report (HDR) Work for Human Development
Southern Grampians & Glenelg Shires COMMUNITY PROFILE
 Southern Grampians & Glenelg Shires COMMUNITY PROFILE Contents: 1. Health Status 2. Health Behaviours 3. Public Health Issues 4. References This information was last updated on 14 February 2007 1. Health
Nigeria: Population and Demographic trends
 Nigeria: Population and Demographic trends Bolatito Ogunbiyi Atlas Fellow, Population Action International Nigeria Beyond the Headlines: Population Health, Natural Resources, and Governance The Woodrow
Reached over 4.8 1,239. applicants 2011 RESULTS. countries. in requests. Fund for Gender Equality
 18 Million 55 47 countries 2011 RESULTS Programmes 4.8 Reached over Million people in 2011 1,239 applicants from 127 countries representing $3 BILLION in requests Fund for Gender Equality Gender equality
Barnstable County, MA: Populations of The Fifteen Towns of Cape Cod
 Cape Cod Bay Barnstable County, MA (Cape Cod) Barnstable County, MA: Populations of The Fifteen Towns of Cape Cod Town Census 2000 Population 1990 Census Population Recent Growth (1990 2000) Bourne 18,721
How To Become A Lawyer In Laos
 Information Sheet - Lao PDR I General Information 1 Number of stakeholders in the Country 1-1-1 Population Laos has approximately 6,400,000 people. 1-1-2 Number of lawyers/attorneys-at-law Laos has 144
How To Help The World
 The World We Want A North-East Asian Youth Vision This Declaration was handed to His Excellency Kim Sung-hwan, Minister of Foreign Affairs and Trade of the Republic of Korea, in Seoul on 9 th of January
Statistical appendix. A.1 Introduction
 A Statistical appendix A.1 Introduction This appendix contains contextual information to assist the interpretation of the performance indicators presented in the Report. The following four key factors
Summary. Abbas P. Grammy 1 Professor of Economics California State University, Bakersfield
 The State of the Economy: Kern County, California Summary Abbas P. Grammy 1 Professor of Economics California State University, Bakersfield Kern County households follow national trends. They turned less
El Salvador. Country coverage and the methodology of the Statistical Annex of the 2015 HDR
 Human Development Report 2015 Work for human development Briefing note for countries on the 2015 Human Development Report El Salvador Introduction The 2015 Human Development Report (HDR) Work for Human
Tanzania (United Republic of)
") Human Development Report 2015 Work for human development Briefing note for countries on the 2015 Human Development Report Tanzania (United Introduction The 2015 Human Development Report (HDR) Work for
Human Development Report 2015 Work for human development Briefing note for countries on the 2015 Human Development Report Tanzania (United Introduction The 2015 Human Development Report (HDR) Work for
Indicators of Sustainable Development Principles and Practices
 Indicators of Sustainable Development Principles and Practices Division for Sustainable Development United Nations Department of Economic and Social Affairs Policy demand for SD indicators (UNCED) Chapter
Global Urbanization: Trends, Patterns, Determinants, and Impacts. Abdullah Baqui, DrPH, MPH, MBBS Johns Hopkins University
 This work is licensed under a Creative Commons Attribution-NonCommercial-ShareAlike License. Your use of this material constitutes acceptance of that license and the conditions of use of materials on this
Contents. Page No. Foreword 06. Pakistan at a Glance 08. GALLUP Note 13. Public Encounter and Reputation of Corruption 17
 National Corruption Perception Survey 2011 28 th December2011 Sponsors: Contents Foreword 06 Page No Pakistan at a Glance 08 GALLUP Note 13 Public Encounter and Reputation of Corruption 17 Foreword Similar
Gender Country Profile
 Gender Country Profile Maldives By Erin MacDonald and Rosanne Wong Edited by Dania Sheldon Contents General... 1 Health... 2 Education... 2 Economic Activity... 3 Decision-Making... 3 Human Rights... 3
CORRELATIONAL ANALYSIS BETWEEN TEENAGE PREGNANCY AND MATERNAL MORTALITY IN MALAWI
 CORRELATIONAL ANALYSIS BETWEEN TEENAGE PREGNANCY AND MATERNAL MORTALITY IN MALAWI Abiba Longwe-Ngwira and Nissily Mushani African Institute for Development Policy (AFIDEP) P.O. Box 31024, Lilongwe 3 Malawi
Malawi. Country coverage and the methodology of the Statistical Annex of the 2015 HDR
 Human Development Report 2015 Work for human development Briefing note for countries on the 2015 Human Development Report Malawi Introduction The 2015 Human Development Report (HDR) Work for Human Development
UNITED STATES OF AMERICA
 UNITED STATES OF AMERICA Date of Elections: November 5, 1974 Purpose of Elections Elections were held for all the members of the House of Representatives and one-third (34) of the members of the Senate
Development of Social Statistics in Indonesia: a brief note
 Development of Social Statistics in Indonesia: a brief note Wynandin Imawan wynandin@bps.go.id BPS Statistics Indonesia 29 September 2011 1 Legal Setting Institutional: Statistics Law No 16 1997; BPS Statistics
National Report to the World Summit on Sustainable Development
 . National Report to the World Summit on Sustainable Development 1 TABLE OF CONTENTS Maps of the Marshall Islands 5 Introduction 6 a. Geography and Climate b. Population c. Government and Administration
Broome County Community Health Assessment 2013-2017 1 APPENDIX A
 Community Health Assessment 2013-2017 1 APPENDIX A 2 Community Health Assessment 2013-2017 Table of Contents: Appendix A A Community Report Card will be developed based on identified strengths and opportunities
Briefing note for countries on the 2015 Human Development Report. Niger
 Human Development Report 2015 Work for human development Briefing note for countries on the 2015 Human Development Report Niger Introduction The 2015 Human Development Report (HDR) Work for Human Development