Economic Security in an Aging Canadian Population
|
|
|
- Russell Franklin
- 8 years ago
- Views:
Transcription
1 WaterlooResearchInstituteinInsurance,SecuritiesandQuantitativeFinance(WatRISQ) UniversityofWaterloo,200UniversityAvenueWestWaterloo,Ontario,Canada,N2L3G ,ext Fax: UNIVERSITYOFWATERLOO WaterlooResearchInstituteinInsurance, SecuritiesandQuantitativeFinance(WatRISQ) WORKINGPAPERSERIES EconomicSecurityinan AgingCanadianPopulation RobertL.Brown, DepartmentofStatistics&ActuarialScience UniversityofWaterloo
")
2 Economic Security in an Aging Canadian Population Robert L. Brown Department or Statistics & Actuarial Science University of Waterloo ABSTRACT This paper has been written for the special issue of the Canadian Journal on Aging on the retrospective on the Butterworths series of monographs in social gerontology. The paper brings up-to-date materials published in 1991 in the volume entitled: Economic Security in an Aging Population. The topics covered are those of the individual chapters of the 1991 publication, namely: --Demographic Background --Income and Expenditure Patterns of the Elderly in Canada --Government-Sponsored Income Security --Employer-Sponsored Pension Plans --Individual Savings/Registered Retirement Savings Plans --Economic Security Aspects of Health Care --Future Funding of Social Security 1

3 I Introduction In 1991, Butterworths, as part of their Perspectives on Individual and Population Aging series published a volume entitled: Economic Security in an Aging Population. I was the sole author. Obviously, much has changed since 1991 including significant reform of the Canada/Quebec Pension Plans. This paper updates the issues discussed in Economic Security in an Aging Population and provides more current data support. This is done using the same Chapter headings as in the original publication. II Demographic Background First, we review Canada s shifting demographics since it is one of the important forces affecting (and effecting) the cost of our social support programs over the next half century. The analysis is based on the following two graphs: Figure 1: Number of births and deaths in Canada, 1926 to
 the cost of our social support programs over the next half")
4 Source: Statistics Canada (2008a), page 7 Figure 2: Total fertility rate in Canada, 1926 to 2005 Source: Statistics Canada (2008a), page 8 Most of the media use a definition of the Baby Boom that assumes that 1946 was the critical year for this demographic tidal wave. Thus, many articles today (2010) describe the Baby Boom as if its characteristics were those of a 64 year-old. These articles talk about how the Baby Boom is now rapidly moving into its retirement phase and all the implications that follow. But with a closer look at the graphs, and the underlying data, one must conclude that the birth cohort of 1946 does not represent a Baby Boom. Clearly the massive number of live births in the 1950 s and early 1960 s dwarf those immediately post-war. This paper uses a definition of the Baby Boom as the birth cohorts from 1951 to While this is admittedly subjective, it helps to explain many of the impacts in our economic security systems that will be seen over the next half century. Note that the largest number of live births ever in Canada occurred in 1959 (and 1957 in the United States) with live births of 479,000, a level not since achieved. Thus today (2010), under this definition, the Baby Boomers are aged If this is true, then it is also true that they are not pushing into the ranks of the retired just yet and the peak of the Boom (born in 1959) will not do so for several years to come. 3

5 This is both good news and bad news. The good news is that there is still some time to adjust our systems (if necessary) to accommodate the Baby Boom as they age. The bad news is that if we think we have a crisis today, how will we manage the realities of (say) 2030? There are actually two reasons for the current population aging. The first is the demographic tidal wave of the Baby Boom/Bust. The second is ever improving life expectancies as illustrated in Figure 3. Figure 3: Survivor Curves Canada Source: CPP Office of the Chief Actuary, Office of the Superintendent of Financial Institutions We can see the same improvement in survivorship by looking at the following Life Expectancy data. 4

6 Table 1 Life Expectancy in Canada Year At Birth At Age 65 At Age 75 Male Female Male Female Male Female Statistics Canada: Life Tables, Canada and the Provinces, several These two forces, in combination, result in the population aging illustrated in Table 2 and Figures 4-6. In particular, if we compare the projected Canadian population in 2036 to the population as it existed at the time of the 1996 census, Table 2 shows that the proportion of the population aged 65+ will double and the proportion of the population 85+ will triple. This is a combination of growth in those age groups and actual declines in the younger age groups (the Baby Bust). Even as the Baby Boom dies off, in the next half century, the age distribution given for 2036 below will continue. This is because of the impact of the anticipated continued improvement in life expectancy. Thus, it isn t so much that the Baby Boom caused Population Aging. Rather the Baby Boom advanced the timing of the impact of population aging. Table 2: Distribution of Canadian Population by Age-Group, 1956 to 2036 Age Under Source: Statistics Canada Population Projections This shift can also be seen in the following population pyramids. 5

7 Figure 4 6
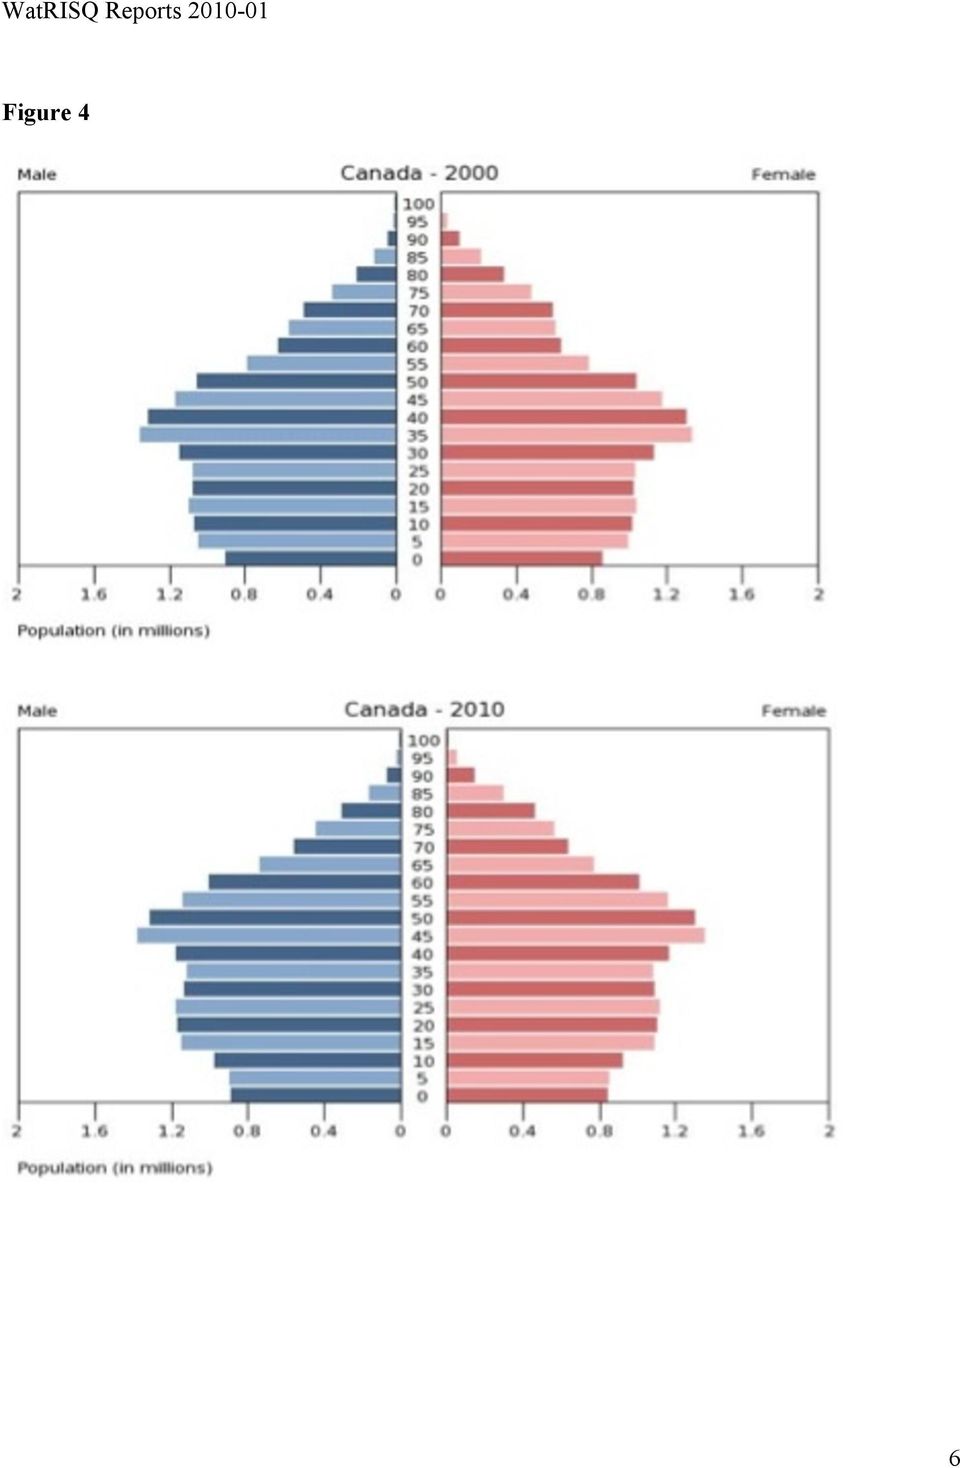
8 Dramatic changes are expected in the labour force. For the first time in our history, more workers will be leaving the labour force through retirement than will be entering. This will create some very important forces. First, there will be pressure to keep workers in the labour force longer (e.g., by changing retirement incentives) and second, to fill the labour force shortages through immigration. There are also some early indications that the fertility rate in Canada may rise which would mitigate some of these pressures (but not for another 20 years). Figure 5 7
 and second, to fill the labour force shortages through immigration.")
9 And population aging will continue even after the disappearance of the Baby Boom because of ever improving life expectancy (see Figure 6). Figure 6 8
.")
10 Below we present the increase in the Aged Dependency Ratio (defined as the number aged 65+ per unit of labour force) as we move from a base year of 2005 to From these data, we can see that on an international comparison, Canada faces a dramatic demographic shift. Table 3: Aged Dependency Ratios, And Growth Therein, 2050 versus 2005 Country ADR 2005 (%) ADR 2050 (%) Increase (%) Japan Canada Italy France US UK Sweden Source: U.N. data, Of the countries listed, Canada has the second most-dramatic aging increase (after only Japan). Canada has a much more rapid shift in our Dependency Ratio than the United States. This is because of the more dramatic shift in our fertility rates. Today, The U.S. has a fertility rate of 2.1 (which means that their population will replace itself without in-migration) while ours is 1.5 9

11 (which is well below the replacement rate). Similarly, Canada experiences much more of an age shift than more mature societies in Europe (e.g., Sweden). In fact, it is probably true that if Sweden can afford its support systems today, then it faces a very small increase in financing over the next half century. Later, the paper discusses the impact which these rapidly shifting demographics may have on the Canadian economic security programs, including social security and health care. III Income Patterns of the Elderly We are fortunate that the current debate on Pension Reform has created a number of excellent documents providing information about Income and Expenditure Patterns of the Elderly. These include the report of the Ontario Expert Commission on Pensions (2008) plus the followup supplement by Bob Baldwin (2009), the Jack Mintz (2009) report to the Ministers of Finance and a report comparing Canada s Economic Security systems to those of other OECD nations by Whitehouse (2009). In general, these reports state that the present Canadian system in total (i.e., Social Security plus Private Pension Plans plus RRSPs) is, in fact, doing a good job in providing Canadians with retirement income security. To begin with, it is worth noting that Canadians now receive larger benefits from our Social Security systems than in the past. This is because of the maturation of the Canada/Quebec Pension Plans and also increases in the Guaranteed Income Supplement (see Figure 7). Figure 7 10

12 Office of the Chief Actuary, Canada Pension Plan, 2010 We will now review the data provided as to the income security in Canada in these three reports. a. BaldwinReport(2009) Baldwin (2009) points out that while pension coverage rates are trending downward, more Canadian workers than ever have pension coverage. This anomaly is explained by the rapid increase in size of the Canadian labour force. The latter is explained largely by the continued rise in female labour force participation rates (in the period from the mid-1990 s to 2007, the percentage of women receiving C/QPP benefits has increased from 70 to 84 percent while the percentage with 3 rd pillar (RPPS + RRSPs) income has increased from 34 to 55 percent). So more Canadians than ever have pensions (in fact, 5,900,000), but because the labour force is growing faster than the number of workers with pensions, the pension coverage rate is down. It is also true that private sector Defined Benefit coverage is down. These data do not include Group RRSPs, which is a growing vehicle for employers to provide employees with pension benefits. Further, Baldwin points out that with the increased female labour force participation rates, no coverage families are not increasing in numbers. One should also take into consideration pension splitting on divorce and survivor benefits in retirement in determining pension coverage rates. Finally, Baldwin states that just because a worker does not have 3 rd pillar coverage at a particular time does not mean that s/he will acquire no pension benefits over the working lifetime. Workers move from job to job. Some jobs have pensions and some do not. So, it is quite likely that the coverage rate at a given moment provides an imperfect indication of how many Canadians retire with some pension benefits. The report indicates that the retirement income that Canadians receive today (including OAS and C/QPP) is up significantly from previous years. This is partially because of the maturation of the C/QPP and improvement in OAS/GIS benefits (see Figure 1) but Employer-sponsored pension benefits are also a part of this improvement. In the period from 1976 to 2007, for couples, real incomes increased by 55 percent. For singles, the real increase was 79 percent. For couples at the 5 th percentile their income was up 99 percent. For those at the 95 th percentile, it was up 28 percent. For singles, the comparable numbers were 140 percent and 79 percent. As to replacement rates, Baldwin quotes a longitudinal study by LaRochelle-Cote, Myles and Picot (Statistics Canada, 2008b) that indicates a median replacement rate that holds level by age at about 80%. This study does note that within different income quintiles there are significant differences in replacement rates, however. b. Mintz Report (2009) 11

13 The Mintz paper is actually a summary of research reports from six sources as solicited by the federal Ministry of Finance. Highlights of the summary include: Canadians are, by and large, doing relatively well in ensuring that they have adequate savings for their retirement. The OECD suggests the Canadian retirement income system performs exceedingly well by international standards, with the three pillars enabling Canadians to provide enough retirement income to sustain an adequate standard of living in retirement. Canada has one of the lower poverty rates among elders among OECD countries. These estimates suggest that one fifth of Canadians may not have sufficient RPPs and RRSP assets to replace at least 90 percent of their pre-retirement consumption. Some very recent evidence has shown that Canadians with RPPs have somewhat less retirement income than those without RPPs because non-rpp holders tend to have other assets to support their retirement as well as more likely work after the age of 65. The research suggests that active management does not provide returns on a persistent basis any better than passive management for both pension plans and mutual funds. Once taking into account active management costs, passive managed assets would provide superior returns. Individual investors do not seem to be advised sufficiently to invest in indexed and exchangetraded funds to improve fund performance. The theme of themintz paper was clearly: the sky is not falling. b. Whitehouse Report (2009) Edward Whitehouse leads the pensions team in the Social Policy division of the Organization for Economic Co operation and Development (OECD). This report was produced at the request of the Department of Finance and covers 12 countries that are membersoftheoecd. Resource testedschemes,suchasgis,payahigherbenefittopoorerpensionersandlower or zero benefits to richer retirees. Means tested benefits(gis) are received by around a thirdofoldercanadians. Ongoing OECD work suggests that the different parts of Canada s public retire income system,workingtogether,providestrongprotectionforinterruptedworkhistorieswithout undulyaffectingincentivesforpeopletoworkandsave. In Canada, coverage of private pensions increases strongly with earnings. Just 10% of people in the lowest two deciles of the earnings distribution have private pensions, comparedwithover85%ofpeopleinthehighesttwodeciles. 12

14 The analysis is based on a broad definition of adequacy: comparing average incomes of older people (aged over 65) with average incomes of the population as a whole. The measureusedis disposable income,i.e.netofpersonalincometaxesandsocialsecurity contributions. Total household income, divided among household member(s), is equivalized toadjustfordifferencesinhouseholdsize. Olderpeople,65+,had,onaverageoverallOECDcountries,82.4%ofpopulationincomesin themid 2000s.Canada sfigureof90.8%iswellabovetheoecdaverage,withonlyfrance andgermanyhavinghigherrelativeincomes. Thesecondempiricalresultsfocusonolderpeoplewithlowincomes,presentingdataon old agepovertyinoecdcountries.itcomparesolderpeople sincomeswithapovertyline dependentoncountry specificmedianhouseholdincomes.thisanalysissetsthethreshold forpovertyat50%ofmedian,equivalizedhouseholddisposableincome. In the mid 2000s, 13.3% of those 65+ were income poor on average in OECD countries. The old age poverty rate was just 4.4% in Canada, the fifth lowest among the 30 OECD countries. ThereplacementratefromthemandatoryschemesinCanada(GIS,OASandCPP/QPP,all ofwhicharepubliclyprovided)is45%.thisisratherlessthantheoecdaverageof59%, buthigherthansevenofthe12countriesstudied. Canadahasstronglyprogressivemandatoryretirement incomesystems.forlowearners, thereplacementrateexceedstheoecdaverage,butthenthegapbetweencanadaandthe OECDaveragegrowslargerasearningsincrease.Thus,thereisa pensiongap :ameasure ofthevoluntarypensionsavingsneededtofinanceretirement. Withafullcontributionhistory,theproportionofearningsthatwouldneedtobepaidinto retirementsavingsplanstofillthepensiongapisnotgenerallylarge.inaustralia,canada, GermanyandtheUnitedStates therequiredcontributionrateis %. Afullcareerofcontributionswoulddeliveratotalreplacementrate includingpublicand voluntary,privatepensions ofaround75%incanada,ireland,theunitedkingdomand theunitedstateshigherthantheoecdaverageofjustunder60%. Canada currently spends around 4.5% of national income on pensioners. This is significantlybelowtheaverageforthe30oecdcountriesof7.4%. Canada spublicpensionsystemappearstobeadministeredatlowcost.theworldbank has collected information on administrative expenses; based on eleven OECD countries. Relative to national income, Canada spends just one quarter of the average for these countries.onlynewzealand spublicpensionsystemischeapertorun. The main issue in Canada is the scale of administrative charges for personal pensions (RRSPs).InformationprovidedsuggeststhatmanyRRSPshavechargesof2%ofassetsper 13

15 year, or even more. These higher cost options tend to be actively managed, individual RRSPs.Nevertheless,therearelowercostoptions.Forexample,investingthroughindexed rather than actively managed funds involves typically only around half the costs and exchange tradedfundsarecheaperstill.also,manypeoplehavegrouprrspswhere,due toeconomiesofscale,costsalsotendtobelower. A levy of 1% of assets implies that 21.5% of the total retirement accumulation (or, equivalently,21.5%ofcontributions)ispaidinfees.withalevyof2%ofassets,thecharge ratio is 37.3%. Moving from a levy of 2% of assets per year to 0.5% would increase net benefitsbymorethan40%. The best approach for an individual faced with uncertainty and, by extension, for a government seeking to do the best thing for its citizens is to use a mixture of ways of providing retirement incomes. Each of the elements of the system has its own strengths andweaknessesandaflexiblebalanceamongthemnotonlydiversifiesriskbutalsooffers abetterbalanceofburden sharingbetweengenerations. Canadaalreadyhaswelldiversifiedretirement incomeprovision. To summarize, according to Whitehouse, Canada s retirement income system scores very wellonmeasuresofincomeadequacyfortoday sretirees. As to sources of income, the distribution has changed remarkably over the years. Table 3 Percentage of Income from Various Sources for those 65+ Source Male Female Male Female Male Female Male Female Private Pensions And RRSPs C/QPP OAS/GIS Investment Other* Source: Statistics Canada 1988 and Edward Tamagno, * Other includes work earnings. The increased importance of the C/QPP should not be surprising given it is now fully mature and given the increased labour force participation rates for females as seen in Table 4. Table 4 C/QPP Contributors by Sex 14
ispaidinfees.withalevyof2%ofassets,thecharge ratio is 37.3%. Moving from a levy of 2% of assets per year to 0.5% would increase net benefitsbymorethan40%.")
16 (As a % of those aged 20-64) Year Females Males Source: Office of the Chief Actuary, Canada Pension Plan (personal memo) One can also see the improved provision of retirement income from private pensions and RRSPs. Horner (2009) states that in 2006, among 19.8 million tax filers under age 65, those belonging to an RPP and/or an RRSP totaled 8.7 million, or 43 percent. However, if one considers only those tax filers who clearly do need private savings to maintain their living standards in retirement the 8 million C/QPP contributors with incomes over $30,000 one finds that 6.9 million, or 86.6 percent were RPP/RRSP savers. LaRochelle-Cote, Myles and Picot (Statistics Canada 2008b) report that workers with average income, post-retirement income stabilizes at approximately 80% of their income level at age 55 (see Figure 8). Low-income individuals (those in the bottom income quintile) experience little change in income largely because of the income maintenance effects of the public pension system. Individuals in the top quintile experience substantially larger income declines in retirement so that income inequality within a cohort declines with retirement. More recent groups of retirees are experiencing higher income levels than earlier cohorts, largely because of higher private pensions. Whether this trend will continue is questionable since pension coverage has been falling among younger workers. Replacement rates have changed little among cohorts, however. Figure8 15

17 IV Government Sponsored Income Security It is well documented that the primary drivers in the cost of an aging population supported by public systems are Social Security and Health Care (see for example, Fellegi (1988) or Denton, Feaver and Spencer (2005)). Here again, we must remind ourselves of the true incidence of the impacts of these costs. The real cost impact does not reach us until after 2016 because the Baby Boom was born in the years 1951 to 1966 (by our definition). Research has shown that the cost of these programs will grow with the size of Canada s aging population (Denton, Feaver and Spencer (2005)). Unfortunately, the proportion of working adults will concurrently shrink, and there will be fewer shoulders to support the growing expense as seen in Figure 4. We will look at two publicly sponsored (and, except for the C/QPP also publicly financed) in the order: Social Security and then Health Care. 16
).")
18 a. OAS and GIS Figure 4 showed that government-sponsored retirement income security benefits have improved over time, especially the targeted GIS benefit. For singles in 2010, the maximum average OAS benefit was $ , the maximum GIS was $ , and the total maximum GIS and OAS benefit was $14, In 2010, however, the maximum OAS and GIS benefit would not raise elderly Canadians above their needs as defined by LICO or LIM. Similarly, the combination of OAS and GIS alone would also not meet the needs of either the Typical or No Assets single (the deficiency ranging up to $6,744 for a typical single living in Toronto). The maximum C/QPP retirement benefit in 2010 was $11, per annum. All of these pension benefits are indexed to the Consumer Price Index. Under OAS, all persons in Canada aged 65 or over who are citizens or legal residents qualify for either a full or partial OAS pension. In general, those with 40 years of residence after age 18 are eligible for a full pension. Those with fewer than 40 years may receive a partial pension on a prorated basis (t/40) provided they have at least ten years residence. OAS benefits are paid out of general tax revenues and are taxable income. Prior to 1989, OAS was universal for those 65 years of age and over, subject only to residence requirements. No income or asset tests were applied. However, in 1989, the government introduced measures to clawback the OAS benefit from recipients with net income over $66,733 (2010) a year. Seniors have to pay back their OAS benefits at a rate of 15 cents for every dollar that net income exceeds $66,733. Seniors with net incomes of $108,000 or more get no OAS. The second segment is the Guaranteed-Income Supplement (GIS). It was introduced in 1966 at the time of the inception of the C/QPP (described later) as a temporary measure to cover the ten year transition period to full C/QPP benefits providing income-tested benefits for those with no or low C/QPP benefits. However this temporary add-on is still with us (in fact, expanded) and remains an essential element of the government income security system. For a single pensioner, the maximum GIS is reduced by $1 for each $2 of income (other than OAS). The GIS stops being paid when income reaches $15,672 for an individual and $20,699 for a couple. There is no asset test associated with the GIS. In the definition of income, there are some exemptions, such as the first $3500 of income from employment earnings and income from Tax- Free Savings Accounts. GIS payments are made out of general tax revenues; no contributions are required. GIS benefits are nontaxable, although those eligible for GIS would not pay much tax anyway. GIS benefit levels have been increased several times since its inception (see Figure 4), and it is now a significant part of the retirement income security system in Canada. However, as income 17
.")
19 from the C/QPP and private pensions has grown, the proportion of seniors receiving GIS has fallen. OAS/GIS currently provides $33 billion in benefits per year to 4.5 million Canadians (Department of Finance, 2010). b. The Canada/Quebec Pension Plans The second tier of retirement income benefits is the mandatory Canada/Quebec Pension Plans (C/QPP). These plans are virtually identical. There exists full mobility of pension credits between the two plans. The C/QPP are contributory Defined-Benefit plans introduced in Full benefits were first paid in While their main benefit is retirement income (70% of cash flow) the plan also pays benefits for Disability and Death, plus Children s, Orphans and Survivors Benefits. For full information on all benefits see Contributions to the C/QPP total 9.9% of earnings between the Year s Basic Exemption (YBE which equals $3500 constant)) and the Year s Maximum Pensionable Earnings (YMPE = $47,200 in 2010) meant to approximate the Average Wage (and indexed to the Average Wage). Contributions are shared equally between employers and employees (4.95% each). The selfemployed pay the full 9.9%. At this time, in the CPP, anyone who is retired (ie. receiving CPP retirement benefits) does not contribute even if they are earning income (this has not been the case for the QPP since 1998). The retirement benefit equals 25% of the worker s Career Average Earnings but with earnings credits indexed to the Average Wage. To get this benefit, a worker would need to have 40 years of contributions. There are special drop-out years allowed for years of disability and child rearing that qualify so long as the years of earnings are ultimately not less than ten. Benefits are taxable income. There is no income or asset test for the receipt of C/QPP benefits. The full benefit is payable at age 65. However, the plans allow flexible retirement between ages 60 and 70. For both early and late retirement, there is a permanent adjustment in benefits equal to 0.5% per month (at the time of writing). That is, someone retiring at age 60 would get 70% of a full benefit, while someone retiring at age 70 would get 130%. Amendments to increase these adjustments have been proposed. Recent actuarial valuations of the CPP show that the plan is viable for a 75-year time horizon. Because of less favorable demographics (lower fertility, immigration and wage growth) the QPP may require future adjustments. In total, these systems are highly progressive. This means that above-average wage earners need to supplement their government benefits with private savings (RPPs or RRSPs). 18

20 The public pension combination of OAS/GIS/CPP by itself achieves high earnings replacement rates for low-income Canadians. For example, a couple, both aged sixty-five, with maximum government pension benefits, receives an inflation-indexed annuity of $34,218 today. (Ambachtsheer, 2009). The C/QPP experienced significant reforms in The major reason for the reforms was the economic and political climate. In the early 1990 s, Canadian governments (both federal and provincial) were running deficits. The federal deficit peaked at $40 billion in By 1996/97, federal debt totaled $563 billion, up 50% since This was 69% of the GDP. Further, 35% of federal revenue was being spent on interest on the debt (Brown, 1999, p12). At the same time, because both Britain and the United States had lowered personal and corporate tax rates, there was pressure on the Canadian government to follow suit. At that time, Canada ranked first among the G-7 nations in terms of Direct Taxes on Individuals (Canadian Institute of Actuaries, 1995, p20). The government was also concerned about the expected rise in Social Security costs that population aging would create. In particular, the government presented the following expected costs for OAS/GIS in total. Table 2 Government of Canada, 1996b, p34 Projected Net (After Taxes) Costs of OAS/GIS ($B) The final reasons for the timing of the reforms were actuarial in nature. The C/QPP were created in For the early cohorts of workers, contributions to the plans totaled 3.6% of contributory wages. This contribution rate remained unchanged until the mid 1980 s. Even with this low rate, the C/QPP plans were able to build up reserve funds equal to two-year s expenditures. However, by the mid-1980 s the reserve funds were being depleted and were destined for exhaustion by Further, C/QPP actuarial reports indicated that contribution rates would have to rise to 14.2% if no changes were made (OSFI 15 th CPP Actuarial Report). At first, the government reacted solely by gradual ad hoc increases in the contribution rate. By 1997, the combined contribution rate was 6% (3% from the worker and 3% from the employer). In March, 1996, the government announced the most fundamental amendments to social security in Canada since First, it proposed that OAS and GIS would be replaced by a new Seniors Benefit. government said that this action was necessary to make OAS/GIS sustainable. The 19
 were running deficits. The federal deficit peaked at $40 billion in 1993.")
21 The new benefit would be nontaxable income and be fully indexed to inflation. The clawback of the Seniors Benefit would have been based on the combined income of spouses (as is the case for GIS; however the OAS clawback is currently based on individual income). Analysts of the proposed system criticized the high marginal tax rates that resulted. If the marginal clawback and marginal income taxes were added together then some seniors would lose 78% of every dollar of their private income. It was argued that these rates would create a significant disincentive to save for retirement. The other flaw in the Seniors Benefit was that the clawback was based on family income and not individual income (as under OAS). Thus, older women who never participated in the paid labor force would no longer have any retirement income in their own right. They would therefore lose that aspect of economic autonomy in their spousal relationship. This was a deciding factor in the death of the Seniors Benefit proposal and a flaw that the government appeared to have underestimated. Returning to the reforms of the C/QPP, in 1997, the Minister of Finance announced that the government had an agreement with the provinces to amend the CPP. This was not easy since any changes to the CPP needs the support of 2/3 of the provinces with 2/3 of the total Canadian population (including Quebec). This makes radical reform difficult. In introducing the reforms to the Canadian public, the government stressed arguments of affordability and sustainability. The changes will ensure that the CPP is affordable to future generations and can be sustained in the face of an aging population, increasing longevity, and the retirement of the baby boom generation (Canada 1997, p6) The 1997 reforms to the C/QPP should be categorized as tweaks to the existing system as opposed to major reforms. However, several amendments were announced that decreased the benefits to be paid in the future (by about 9.3% in total), increased the level of funding and increased the rate of return on any reserve funds. One example was a change in the value of the CPP Death Benefit. Prior to amendment, this benefit was equal to six months of retirement benefits, to a maximum of 10% of the YMPE. In 1997, the YMPE was $35,800 so the maximum death benefit then was $3580. The 1997 reforms set a new maximum death benefit of $2500 which does not adjust to inflation. A further feature of the 1997 reforms was the introduction of an automatic stabilizing principle. The CPP is supposed to be sustainable with a 9.9% contribution rate. If the CPP actuary shows that the present benefits are not sustainable at 9.9% and no political solution is found, then two things happen. First, the contribution rate moves half of the distance to the necessary long-term contribution rate as determined by the CPP actuary. At the same time, benefits are de-indexed to bring them slowly down in value until the new (slightly higher) contribution rate is in balance 20
22 with the new (slightly lower) benefit structure. Thus, sustainability is guaranteed and is achieved by adjustments to both benefits and contributions. The final amendment to the C/QPP was the rapid ramping up of contributions with a resultant rapid increase in the reserve funds. Contribution rates were increased from 6% in 1997 to 9.9% in These extra contributions will create reserve funds equal to five years of expenditures. Until 1997, the CPP reserve funds were lent to the provincial governments. The new reserve funds are invested by an independent Canada Pension Plan Investment Board (CPPIB). The CPPIB is subject to broadly the same investment rules as pension funds in the private sector. Based on the latest (23 st ) CPP Actuarial Report (OSFI, 2007), CPP contributions are expected to exceed benefits until 2020, providing a 13-year period before any portion of the investment income is needed to help pay CPP benefits. The reforms of 1997 have meant that the CPP now rests on a healthy foundation. In summary, the Canadian Social Security system provides Canadians with a high level of income security while still living ample room for individual savings and investments (see Brown and Prus, 2004). IV Employer-Sponsored Pension Plans As noted in the Baldwin (2009) report, the private pension coverage rate (through employersponsored pension plans) has been steadily falling. Why might have caused this to happen? The Ontario Expert Commission on Pensions (OECP, 2008) did extensive research on this question. They concluded that, at least for Ontario, there were three reasons for the decline in the coverage rate. First, union density is declining (see Figure 9). Figure 9 21
23 Source, Ontario Expert Commission on Pensions, 2008, p44. This is important. Whereas 76% of unionized workers are members of occupational pension plans, only 28% of non-union workers have this coverage. The OECP stated that declining union density alone seems to account for 40% of the decline in pension coverage for men and young women (ibid, p45) Another reason is the decline in larger workplaces as smaller employers become more important. In workplaces with more than 1,000 employees, pension coverage runs at about 60%, whereas for workers in small enterprises (with fewer than 20 employees) the coverage rate is 10% (ibid, p39). The final reason is the decline of the manufacturing sector, especially the auto sector. Manufacturers have historically been associated with both high rates of unionization and pension coverage. It is also the case that there is a strong difference in the existence of pensions depending on whether the worker is in the public or private sector. About 25% of private sector workers had pension coverage in 2005, while the comparable rate for the public sector was 78% (ibid). Another important statistic is that pension coverage rates for men and women are now virtually identical (ibid, p40). Population aging also puts increased pressure on pension plans in at least two ways. First, as the ratio of retirees to workers in any plan increases, the volatility of the cost of the plan increases (payment of benefits is more dependent on investment returns versus worker contributions). 22
24 Second, as retirement life expectancy improves, the cost of pension benefits rises proportionately. As noted previously by Whitehouse, relative to many OECD countries, Canada s public retirement income programs are quite modest. As a result, occupational pension plans and other forms of private savings play a more important role in providing retirement income security and in achieving a suitable replacement ratio. No jurisdiction that uses a voluntary private pension system has ever had coverage rates in excess of 50% (ibid, p30). In Canada, only 38.5% of the paid labour force is now covered by an employer-sponsored pension plan. As noted previously, average retirement incomes and replacement ratios have improved since the early 1970s. However, the experience of different groups of retirees varies widely. For example, longitudinal studies show that Ontario retirees in the most affluent quintile rely on occupational plans and private savings for 41% of their income and on public plans for only 16%. By contrast, retirees in the poorest quintile receive 57% of their income from the public system and only 21% from private pensions and RRSPs. Only about 25% of families in the poorest quintile had an occupational pension, and only 2% of families in this group had two, whereas 40% of top-quintile earners had two occupational pension plans (ibid, p31). These inequalities are increasing. But this may not be true for the next generation. Horner (2009) says that trends such as increasing life expectancy, declining investment returns and a continuing decline in private pension coverage threaten the retirement income security of modest and middle-income earners. The importance of occupational pension plans and private savings has been increasing. In 1984, Canadian seniors received 76.8% of their income from public plans and 23.2% from occupational pension plans and RRSPs; in 2004, they received 59.8% from plans and 40.2% from private sources (ibid). A recent paper from Statistics Canada (Ostrovsky and Schellenberg, 2009) indicates that retirees who do not have a RPP in their fifties were, on average, achieving the same income replacement levels in retirement as those with a RPP. This would be the result if Canadians were accumulating individual savings and RRSPs. V Individual Savings and RRSPs In a paper for the C. D. Howe Institute, Dodge, Laurin and Busby (2010) calculate that a worker aged thirty who earns an inflation-adjusted $60,000 per year over thirty-five years will have to save about fourteen percent of pay to achieve a seventy percent earnings replacement rate (including the public OAS/CPP pensions). The required savings rate drops to eleven percent for a sixty percent earnings replacement rate, and further to nine percent if the worker retires at age sixty-seven rather than sixty-five. There is a growing understanding that seventy percent is unnecessarily high for many people, and that sixty, or even fifty percent may be more appropriate in many cases. Their calculations suggest that Canadians (either individually or 23
25 through employer plans) are currently saving far less than they need to save to provide for pensions approaching 70 percent or even 60 percent of pre-retirement earnings. In 2006, approximately 9 million Canadians saved in an RPP and/or RRSP, and 3.6 million Canadians received income from a RPP and/or RRIF (Department of Finance, Canada, 2010). At the end of December 2009, Canadians had assets of $1.9 trillion in RPPs and RRSPs (ibid). A new Tax-Free Savings Account (TFSA) was introduced by the government in Under the TFSA, contributions can be made (up to $5000 a year) out of after tax income. Investment returns then accrue tax free. When funds are taken from the TFSA, no new taxes arise. There is also no impact on the ability of an individual to qualify for the OAS/GIS because of income from a TFSA. It has been reported that Canadians opened up 4.7 million TFSAs by the end of December The value of the TFSA assets amounted to about $15.8 billion (ibid). VI Economic Security Aspects of Health Care The second force driving up public system costs as the population ages is the potentially large increase in the cost of Canadian health care. Canada now spends 12 percent of GDP on health care. Health care represents 42 percent of the Ontario budget. The expectation of rising health care costs in an aging population is a logical occurrence given that older Canadians cost our health care system more than younger Canadians (see Figure 10) and, therefore, if the population ages and the percentage of older Canadians grows, then it follows that our health care costs will rise. Figure 10: Relative per capita costs of health care for males and females by age Relative cost per capita (arbitrary units) 24
26 Source: Denton, Feaver and Spencer, However, a variety of other opinions exist in the literature as to why health care costs are increasing and expected to continue to increase. For example, Brown and Suresh (2004) point out that it is more correct to say that health care costs are a function of the year of death rather than age. It is the high expenditures on health are just prior to death combined with the higher probability of death as we age, that drives health care spending, not the pure age of the population (old patients who continue to survive do not cost us all that much). Evidence of this is provided in Table 14. Table 14 Cost Ratio: Died*/Survived Costs of Medical and Social Care by Age Age Band Cost Ratio: Died*/Survived Last six months of life Source: McGrail et al. (2000) The impact of this is important. Health Care is funded on a pay-as-you-go basis. Thus, as life expectancy improves, increased health care costs (if they are a function of time-at-death) are delayed. But costs delayed decrease the funding needed in any year to support the system. Regardless of the arguments in the literature, hardly a week goes by without another article in the media about the pending health care cost crisis (see for example, The Globe and Mail, 2010). Normally, these commentaries are couched in a context of population aging. In particular, we know that population aging per se accounts for very little of the increase in health care costs in the recent past and it will not be the key driving force over the next three decades (Evans et al, 2001). This myth that population aging is the key factor in rising health care costs is used by those who seek more funding for their part of the system. It is a convenient factor since the system has no control over it ( it is not our fault ). McIntyre et al. (2003) projected real growth in health care costs of 2.6% per annum made up of 0.9% for increased per 25
27 capita consumption/service levels, 0.9% for general population growth, and 0.8% attributable to population aging. Figure 11 shows that what is driving increased health care costs is increased servicing (heavier, more intense treatment), for all age groups, but especially for the elderly, rather than population aging. And this is happening without any evidence of increased needs. These results strongly suggest that changes in utilization patterns are motivated by changing clinical standards of investigation and intervention. The problems and the outcomes themselves appear to be unchanged over the period of observation (ibid). These changes are common in most industrialized countries. Figure 11: The estimates of the impact of aging on per capita total health costs in Canada (in real terms, net of inflation), for the whole population, generally place it at about 1 per cent per capita per year (Barer et al, 1998). Barer et al. are famous for asking if the impending health care crisis is an avalanche or a glacier. It has been noted that even a sustained trend of low economic growth would enable us to support an expansion of health care services adequate to satisfy the needs 26
28 associated purely with the aging of the population (see also Marzouk (1991) and Sepehri and Chernomas (2004)). Finally, in international comparisons, Canada does relatively well. Table 15 Resources and Health Indicators, 2006 Country Health Expenditure Life Expectancy Infant Mortality As a % of GDP at birth per 100 live births Canada France Japan UK US Source: To close, more research needs to be done to identify procedures that truly improve health outcomes for the elderly. Just spending more dollars on health care does not necessarily result in improved health. VII Future Funding of Social Security A quick review of Figure 12 may lead the reader to assume that our shifting demographics cause no problems in total since increasing aged dependency ratios are balanced by decreasing youth dependency ratios. Figure 12 27
29 Source: Author s calculation using statistics from Brown and Bilodeau, 1997 Transfers of wealth to educate and provide health care to the young are not equal to the transfer of wealth required for health care and retirement income security for the elderly, however. Analysis (e.g., Foot 1982, p 137) has shown that government expenditures on the elderly are about 2.5 times those for the young (per capita) (see also CANSIM Tables (1971 to 2008) and (2009 to 2056)). Therefore, any analysis that attempts to derive a formula for future wealth transfers must include the lower demands by the youth sector and also the differing transfer factors for the young versus the elderly. Such an analysis, using Canadian data, is found in Brown and Bilodeau (1997). The authors developed a statistic called the Wealth-Transfer Index (WTI) defined as: WTI = [(1.866 x Y) + (1 x U) + (4.636 x A)] / LF Y = Youth, 0-19 U = those Unemployed A = Aged, 65 and over LF = the projected employed Labour Force 28
30 The weights of 1.866, 1 and were derived by McDonald and Carty (1980, pp ). No more recent analysis is available. Note that 4.636/1.866 = 2.48 (close to 2.50) which lends more credibility to the analysis. These weights do not have any meaning by themselves they are only weights relative to a weight of 1 for unemployed adults. These weights are based on payments for health care, education, unemployment transfers and retirement income security made by any level of government. While this does not represent the totality of dependencies, it does capture the key macro-indicators. The WTI statistic is a single indicator of the supply of (denominator) and demand for (numerator) wealth. As shown in Figure 13, the WTI actually trended downward from 1991 to After 2006, it increases rapidly as the population ages and, in particular, as the baby boom retires and the labour force turns to the baby bust generation for wealth creation (i.e., after 2016). Figure 13: Wealth Transfer Index, 1975 to
31 Source: Brown and Bilodeau, Brown, Damm and Sharara (2000) show that we can keep the wealth transfer index constant at its 2006 level by raising the age at which people retire. This would move Canadians out of the dependent numerator and into the productive denominator. Even with no productivity improvements the needed shift is small as can be seen in Figure 14. With productivity improvement, the shift is smaller still (ibid). 30
32 Figure 14: Median Retirement Age in Canada with no Productivity Improvements (1996 to 2047) Age Year Source: Brown, Damm and Sharara, According to Felligi (1988) and Denton, Feaver and Spencer (2005), Social Security appears to be our primary source of rising expenses as the population ages. Canada does not have, however, an overly generous Social Security system relative to most European countries. Figures 15, and 16 illustrate the focusing of benefits. In Figure 15, we can see that all Canadians receive very similar dollar benefits in total from the government-sponsored system. As you move through the wage sectors, one finds that new dollars of CPP are offset first by the GIS clawback and later by the OAS clawback. Figure 15 31
33 WatRISQ Reports Source: Chisholm and Brown, 2008 As stated, Canadian retirement income support is highly targeted on the poor. This is reinforced in Figure 16. Figure 16: 32
34 Source: Brown, 2007 While Social Security costs will rise over the next half century, they seem to be within affordable levels. OAS and GIS are indexed to prices (CPI) while taxes rise with earnings. In a normal economy, wages rise faster than prices so that the tax rate needed to fund OAS/GIS does not rise as quickly as the rate of growth of benefits. According to the 8 th Actuarial Report of the Old Age Security Program (OSFI, 2008), while OAS (including GIS) expenditures will rise from $33B in 2007 to $110B in 2030, the ratio of expenditures to the Gross Domestic Product (GDP) increases from 2.2% in 2007 to a high of 3.1% in The ratio then reduces to 2.7% by As already outlined, the C/QPP was significantly reformed in As a result of these amendments, there now exists a $109B fund within the CPP. While the fund lost $13.8B in 2008, it has still returned 5.1% per annum since its inception in Further, every actuarial report of the Canada Pension Plan, since its reform, has indicated that the CPP 9.9% contribution rate will sustain the projected benefits to a 75-year horizon (OSFI, 2007). (Unfortunately, as previously stated, the same is not true for the QPP.) VIII Conclusion This paper has reviewed many of the public policy issues associated with population aging in Canada. As a generalization, the literature appears to tell us that population aging, by itself, will not create overwhelming burdens on the Canadian taxpayer even as the Baby Boom generation starts to retire in 2016 and beyond. However, it is the case that the costs of Social Security and Health Care will both rise as the population ages. It is only because the Canadian financial security safety net is relatively meager that costs will remain sustainable. We sincerely hope that the information in this paper will spark a broader debate on this very important topic. Bibliography Ambachtsheer, K. (2009) Pension Reform: How Canada Can Lead the World. C.D. Howe Benefactors Lecture (November). Baldwin, R. (2009). Research Study on the Canadian Retirement Income System. Prepared for the Ministry of Finance, Ontario. Barer, M. L., R. G. Evans, C. Hertzman, M. Johri (1998). Lies, Damned Lies and Health Care Zombies: Discredited Ideas that will not Die. Health Policy Institute. Discussion Paper #10. 33
Economic Security in an. Aging Canadian Population. Robert L. Brown. Department or Statistics & Actuarial Science. University of Waterloo.
 Economic Security in an Aging Canadian Population Robert L. Brown Department or Statistics & Actuarial Science University of Waterloo (Retired) Abstract This paper has been written to bring up to date
Issues Related to Increasing the Retirement Age
 Report Issues Related to Increasing the Retirement Age CIA Task Force on Retirement Age May 2013 Document 213038 Ce document est disponible en français 2013 Canadian Institute of Actuaries CONTENTS I Executive
Province of Nova Scotia Department of Finance MECHANISMS FOR ENHANCING THE RETIREMENT INCOME SYSTEM IN CANADA
 Province of Nova Scotia Department of Finance MECHANISMS FOR ENHANCING THE RETIREMENT INCOME SYSTEM IN CANADA The Government of Nova Scotia is working with other provinces and territories, and the Government
Canada Pension Plan Overview Citizens for Public Justice April 2012
 Canada Pension Plan Overview Citizens for Public Justice April 2012 Chris Roberts Canadian Labour Congress Three Pillars of Canada s Retirement Income System Basic pension Old Age Security and Guaranteed
Negative Effects of the Canadian GIS Clawback and Possible Mitigating Alternatives
 Negative Effects of the Canadian GIS Clawback and Possible Mitigating Alternatives Diana Chisholm and Rob Brown Department of Statistics and Actuarial Science University of Waterloo Abstract In Canada,
Public Consultation Package
 Public Consultation Package Request for Comments Retirement Income Adequacy in Canada Yukon Finance March 2010 Whitehorse, Yukon March 2010 Message from the Premier and Minister of Finance The Yukon Government
Your contributory period ends at the earliest of the following:
 Canada Pension Plan and Old Age Security A. CPP Overview Canada Pension Plan is a contributory, earnings-related insurance program. This means that you must have contributed to the program in order to
The Retirement Income System and. the Risks Faced by Canadian Seniors. Kevin Milligan, University of British Columbia. kevin.milligan@ubc.
 The Retirement Income System and the Risks Faced by Canadian Seniors Kevin Milligan, University of British Columbia kevin.milligan@ubc.ca Tammy Schirle, Wilfrid Laurier University tschirle@wlu.ca This
Planning for Retirement: Are Canadians Saving Enough?
 June 2007 Planning for Retirement: Are Canadians Saving Enough? Document 207055 This study was carried out by the Department of Statistics and Actuarial Science at the University of Waterloo, under the
Qualified Pension Plans and Health Care for the Elderly: The Perfect Macroeconomic Immunized Portfolio
 II Qualified Pension Plans and Health Care for the Elderly: The Perfect Macroeconomic Immunized Portfolio Robert L. Brown, University of Waterloo Presented at Retirement Implications of Demographic and
PENSIONS AT A GLANCE 2009: RETIREMENT INCOME SYSTEMS IN OECD COUNTRIES UNITED STATES
 PENSIONS AT A GLANCE 29: RETIREMENT INCOME SYSTEMS IN OECD COUNTRIES Online Country Profiles, including personal income tax and social security contributions UNITED STATES United States: pension system
Preparing for Retirement. A Guide for Employees. Human Resources
 Preparing for Retirement A Guide for Employees 010 Human Resources Contents Introduction... 3 Canada Pension Plan Retirement Benefits... 4 Old Age Security... 6 Employment Insurance Benefits at Retirement...
Public Pensions. Economics 325 Martin Farnham
 Public Pensions Economics 325 Martin Farnham Why Pensions? Typically people work between the ages of about 20 and 65. Younger people depend on parents to support them Older people depend on accumulated
Measuring the Financial Sustainability of the Canada Pension Plan
 Measuring the Financial Sustainability of the Canada Pension Plan Actuarial Study No. 10 January 2012 Office of the Chief Actuary Office of the Chief Actuary Office of the Superintendent of Financial Institutions
WORKING PAPER 5: HOW TO PROVIDE RETIREMENT BENEFITS *
 WORKING PAPER 5: HOW TO PROVIDE RETIREMENT BENEFITS * 1. Key challenge & overview People in precarious employment are less likely to have access to benefits, including retirement benefits. Retirement income
How to Save for Retirement in Ontario, Canada?
 1 Canadian Labour Congress Background for Individual Responses Questions from the Ministry of Finance Ontario Consulting with Ontarians on Canada s Retirement Income System How much income do you think
Executive Summary... 1. I. Introduction... 5. II. Saving for our Collective Old Age... 7. III. Macroeconomics of Savings and Investments...
 TABLE OF CONTENTS Executive Summary... 1 I. Introduction... 5 II. Saving for our Collective Old Age... 7 III. Macroeconomics of Savings and Investments... 10 IV. Individual Households Incentives to Save...
Securing Our Retirement Future
 Securing Our Retirement Future Consulting with Ontarians on Canada s Retirement Income System ISBN 978-1-4435-5029-1 (Print) ISBN 978-1-4435-4868-7 (HTML) ISBN 978-1-4435-4869-4 (PDF) Ministry of Finance
Sources of Retirement Income Security in Canada
 Ill Sources of Retirement Income Security 3.1 Introduction In Better Pensions for Canadians (Health and Welfare Canada 1982), the government identified three principles as the basis for improvements to
TIME FOR ACTION. CPP Expansion: A critical part of the solution. Prepared by the Pensions Committee FEI Canada Policy Forum May 1, 2014
 TIME FOR ACTION CPP Expansion: A critical part of the solution Prepared by the Pensions Committee FEI Canada Policy Forum May 1, 2014 Debate has intensified on how best to help Canadians plan for retirement
Ontario Trends in Occupational Defined Benefit and Defined Contribution Pension Coverage
 Ontario Trends in Occupational Defined Benefit and Defined Contribution Pension Coverage richard@shillington.ca www.shillington.ca Informetrica Limited Ontario Trends in Occupational Defined Benefit and
e-brief The Piggy Bank Index: Matching Canadians Saving Rates to Their Retirement Dreams
 e-brief March 1, 2010 PENSION PAPERS I N D E P E N D E N T R E A S O N E D R E L E V A N T The Piggy Bank Index: Matching Canadians Saving s to Their Dreams By David A. Dodge, Alexandre Laurin and Colin
An Analysis of the Economic Circumstances of Canadian Seniors
 An Analysis of the Economic Circumstances of Canadian Seniors by Richard Shillington of Tristat Resources* February 2016 * The author would like to thank the following individuals for helpful suggestions
Canadian Retirement System
 Canadian Retirement System Instructor: Karen Chen Actuary, PBI Actuarial Consultants John 55 years old Lived in Canada his whole life Worked since age 25 Current employer offers a pension plan With current
Men retiring early: How How are they doing? Dave Gower
 Men retiring early: How retiring are they doing? early: How are they doing? Dave Gower During the first half of this century, men generally stayed in the labour force until at least age 65. In the second
Notes - Gruber, Public Finance Chapter 13 - Social Security Social Security started in 1935 in Great Depression. Asset values had fallen drastically,
 Notes - Gruber, Public Finance Chapter 13 - Social Security Social Security started in 1935 in Great Depression. Asset values had fallen drastically, many elderly lost their lifetime savings. Workers pay
The 2004 Report of the Social Security Trustees: Social Security Shortfalls, Social Security Reform and Higher Education
 POLICY BRIEF Visit us at: www.tiaa-crefinstitute.org. September 2004 The 2004 Report of the Social Security Trustees: Social Security Shortfalls, Social Security Reform and Higher Education The 2004 Social
Canada Pension Plan Retirement, Survivor and Disability Beneficiaries Mortality Study
 f Canada Pension Plan Retirement, Survivor and Disability Beneficiaries Mortality Study Actuarial Study No. 16 June 2015 Office of the Chief Actuary Office of the Chief Actuary Office of the Superintendent
Retirement Income Coalition
 2005 Pre-Budget Submission STRENGTHENING THE VOLUNTARY PILLAR OF CANADA'S RETIREMENT INCOME SYSTEM SEPTEMBER 2004 TABLE OF CONTENTS Page Introduction 1 Unfinished Business 2 Middle Income Canadians Affected
Employees Retirement Plan University of Windsor Pre-Retirement Seminar
 Employees Retirement Plan University of Windsor Pre-Retirement Seminar Welcome! April 22, 2014 Presentation Overview Preparing for Retirement Sources of Retirement Income Types of Pension Plans Plan Definitions
Ensuring the Ongoing
 Ensuring the Ongoing Strength of Canada s Retirement Income System A Submission to the Federal-Provincial Relations and Social Policy Branch Department of Finance April 30, 2010 On behalf of the Canadian
Research Study on the Canadian Retirement Income System
 Research Study on the Canadian Retirement Income System Prepared for the Ministry of Finance, Government of Ontario By Bob Baldwin November 2009 Table of Contents Acronyms... i Acknowledgements...ii Executive
THE TAX-FREE SAVINGS ACCOUNT
 THE TAX-FREE SAVINGS ACCOUNT The 2008 federal budget introduced the Tax-Free Savings Account (TFSA) for individuals beginning in 2009. The TFSA allows you to set money aside without paying tax on the income
Blinded by the Refund : Why TFSAs may beat RRSPs as better retirement savings vehicle for some Canadians by Jamie Golombek
 January 2011 Blinded by the Refund : Why TFSAs may beat RRSPs as better retirement savings vehicle for some Canadians by Jamie Golombek With the introduction of Tax Free Savings Accounts (TFSAs) in 2009,
The Economists Voice
 The Economists Voice Volume 2, Issue 1 2005 Article 8 A Special Issue on Social Security Saving Social Security: The Diamond-Orszag Plan Peter A. Diamond Peter R. Orszag Summary Social Security is one
POPULATION AGING AND THE MAINTENANCE OF SOCIAL SUPPORT SYSTEMS
 POPULATION AGING AND THE MAINTENANCE OF SOCIAL SUPPORT SYSTEMS Frank T. Denton and Byron G. Spencer IESOP Research Paper No. 9 September 1996 The Program for Research on the Independence and Economic Security
ONTARIO RETIREMENT PENSION PLAN
 THE ONTARIO RETIREMENT PENSION PLAN DISCUSSING A MADE-IN-ONTARIO SOLUTION ASSOCIATE MINISTER S MESSAGE Ask a child what they want to be when they grow up and they ll tell you. A doctor. An astronaut.
Comments on Securing Our Retirement Future: Consulting with Ontarians on Canada s Retirement Income System
 November 29, 2010 Ministry of Finance Retirement Income Security Submission c/o Communications & Corporate Affairs Branch 3rd Floor, Frost Building North 95 Grosvenor Street Toronto, ON M7A 1Z1 Re: Comments
Canada Pension Plan and Old Age Security benefit rates effective January 1, 2015
 1 of 6 27/02/2015 1:08 PM Home News News Releases Canada Pension Plan and Old Age Security benefit rates effective January 1, 2015 News Release Share this page Canada Pension Plan and Old Age Security
The Canadian Retirement Income Guide 2014 Edition. Maximizing your retirement income while minimizing your taxes
 The Canadian Retirement Income Guide 2014 Edition Maximizing your retirement income while minimizing your taxes Introduction When you retire, not only does your daily routine change, but your pay cheque
An update on the level and distribution of retirement savings
 ASFA Research and Resource Centre An update on the level and distribution of retirement savings Ross Clare Director of Research March 2014 The Association of Superannuation Funds of Australia Limited (ASFA)
ON THE CANADA PENSION PLAN
 ON THE CANADA PENSION PLAN J. Bruce MacDonald, Canada Doubts have been expressed recently, both by writers in the media and individual Canadians, about the viability of the Canada Pension Plan (CPP). Most
Strengthening the Canada Pension Plan: Take it to the public
 Strengthening the Canada Pension Plan: Take it to the public by Ken Battle, Sherri Torjman and Michael Mendelson November 2013 Strengthening the Canada Pension Plan: Take it to the public by Ken Battle,
Working After Age 65
 ALTERNATIVE FEDERAL BUDGET 2012 TECHNICAL PAPER Working After Age 65 What is at Stake? Angella MacEwen Highlights The OAS and GIS combined today provide one third of the income of all seniors aged over
PENSION INNOVATION FOR CANADIANS: THE TARGET BENEFIT PENSION PLAN
 PENSION INNOVATION FOR CANADIANS: THE TARGET BENEFIT PENSION PLAN SUBMISSION TO THE DEPARTMENT OF FINANCE, CANADA, FROM THE CONGRESS OF UNION RETIREES OF CANADA, JUNE 23, 2014. The Congress of Union Retirees
Investment Company Institute and the Securities Industry Association. Equity Ownership
 Investment Company Institute and the Securities Industry Association Equity Ownership in America, 2005 Investment Company Institute and the Securities Industry Association Equity Ownership in America,
Estate Planning - Raising the Eligibility Age in Canada
 November 2010 Is 70 the New 65? Raising the Eligibility Age in the Canada Pension Plan Martin Hering & Thomas R. Klassen APPLIED PUBLIC POLICY RESEARCH INFORMED BY ONTARIO S REALITY Is 70 the New 65? Raising
Sample retirement plan prepared with. The Canadian Retirement Planner s Software. For information visit http://www.gobeil.ca/
 RETIREMENT PLAN KAREN AND BILL SWIRE PROVINCE OF ONTARIO AS AT JANUARY 1, 2012 PREPARED BY DAVID GOBEIL, CA, CFP NOVEMBER 4, 2011 VERSION DRAFT Sample retirement plan prepared with The Canadian Retirement
CPP Enhancement: The Debate Takes Centre Stage
 Enhancement of the Canada Pension Plan (CPP) is expected to be a major issue in the upcoming federal election. This article provides an overview of likely features of a CPP enhancement proposal along with
COMMUNICATION THE BOARD OF TRUSTEES, FEDERAL OLD-AGE AND SURVIVORS INSURANCE AND FEDERAL DISABILITY INSURANCE TRUST FUNDS
 114th Congress, 1st Session House Document 114-51 THE 2015 ANNUAL REPORT OF THE BOARD OF TRUSTEES OF THE FEDERAL OLD-AGE AND SURVIVORS INSURANCE AND FEDERAL DISABILITY INSURANCE TRUST FUNDS COMMUNICATION
Canada Pension Plan benefits should be enhanced, and here is why EXECUTIVE SUMMARY. S.M. (Muktar) Homam 1 York University Schulich School of Business
 Homam 1 York University Schulich School of Business") Canada Pension Plan benefits should be enhanced, and here is why S.M. (Muktar) Homam 1 York University Schulich School of Business EXECUTIVE SUMMARY The Canadian three-tier pension system consists of the
Canada Pension Plan benefits should be enhanced, and here is why S.M. (Muktar) Homam 1 York University Schulich School of Business EXECUTIVE SUMMARY The Canadian three-tier pension system consists of the
The Reality of Retirement Income in Canada
 The Reality of Retirement Income in Canada Philip Cross APRIL 2014 Investments Family Savings Home Equity Friends OAS RRSP/RPP CPP April 2014 The Reality of Retirement Income in Canada by Philip Cross
PROPOSED CHANGES TO THE CANADA PENSION PLAN
 PROPOSED CHANGES TO THE CANADA PENSION PLAN Proposed by Federal, Provincial and Territorial Ministers of Finance Ottawa, May 25, 2009 For further information go to the Department of Finance Canada web
June 2015. The Canada Pension Plan Retirement Pension
 June 2015 The Canada Pension Plan Retirement Pension Service Canada delivers the Canada Pension Plan (CPP) program on behalf of the Department of Employment and Social Development Canada. This publication
We all have dreams about retirement. Some day you expect to retire, and you
 Sustainability, Cost-Effectiveness, Fairness and Value A Primer on Modern Pension Plan Design Dr. Bruce Kennedy, Executive Director BC Public Service Pension Plan May 2013 We all have dreams about retirement.
Planning for Retirement
 Planning for Retirement PLANNING FOR RETIREMENT Retirement. It s a period of one s life that most people look forward to, anticipating more time to spend with family and friends, and a welcome end to the
Taxation of Retirement Income
 Taxation of Retirement Income TAXATION OF RETIREMENT INCOME As our population ages, the need to fund a comfortable retirement becomes a priority for more and more Canadians. Many Canadians planning for
Company Pension Plans in Canada
 Company Pension Plans in Canada This article provides an introduction to company pension plans as well as a discussion of several issues currently facing company pension plans in Canada. Company pension
Tax-Free Savings Account (TFSA) now available!
 now available!") Tax-Free Savings Account (TFSA) now available! Customer-owners have a new way to save money with the Tax-Free Savings Account (TFSA), now available at Metro Credit Union. You can save or invest money without
Tax-Free Savings Account (TFSA) now available! Customer-owners have a new way to save money with the Tax-Free Savings Account (TFSA), now available at Metro Credit Union. You can save or invest money without
The Great Divide: Income splitting strategies can lower your family s taxes by Jamie Golombek
 March 2015 The Great Divide: Income splitting strategies can lower your family s taxes by Jamie Golombek While the new Family Tax Cut credit, which provides a form of income splitting, has been getting
Accessing and Optimizing Pensions and Public Benefits
 financial literacy series for older adults Federal Public Benefits for Seniors Accessing and Optimizing Pensions and Public Benefits Ontario edition Both Canada and Ontario have several programs in place
SIEPR policy brief. Efficient Retirement Design. By John B. Shoven. About The Author. Stanford University March 2013
 Stanford University March 2013 Stanford Institute for Economic Policy Research on the web: http://siepr.stanford.edu Efficient Retirement Design By John B. Shoven The pension system in the U.S. has changed
PENSIONS AT A GLANCE 2011: RETIREMENT-INCOME SYSTEMS IN OECD COUNTRIES AUSTRALIA
 PENSIONS AT A GLANCE 2011: RETIREMENT-INCOME SYSTEMS IN OECD COUNTRIES Online Country Profiles, including personal income tax and social security contributions AUSTRALIA Australia: pension system in 2008
Your Guide to Retirement Income Planning
 Your Guide to Retirement Income Planning Your Guide to Retirement Income Planning 3 Your retirement income plan How to create secure income in retirement Your retirement will be as unique as you are. Travel,
E l E c t i o n 2 0 0 8 : A G u i d E t o A n A ly z i n G t h E i s s u E s
 Election 2008: A Guide to Analyzing the Issues Founded in 1965, the Academy is a nonpartisan, non-profit professional association representing 16,000 actuaries in the United States. Members practice in
Income Security Programs and Retirement in Canada
 Income Security Programs and Retirement in Canada Michael Baker, University of Toronto and NBER Jonathan Gruber, MIT and NBER Kevin Milligan, University of Toronto November 2001 C Prepared for Project
ability to accumulate retirement resources while increasing their retirement needs; and
 Consulting Retirement Consulting Talent & Rewards The Real Deal 2012 Retirement Income Adequacy at Large Companies RETIREMENT YOU ARE HERE About This Report This study assesses whether employees of large
John Harris MA, MBA, PhD, CGA, FCMA - member of the CIFP Education Committee. - worked in both administrative and teaching positions in higher
 Current Trends Financial Planning Issues The Economy The Federal Budget The Canada Job Grant Jobs Without People/People Without Jobs Is this a concern within the Financial Services industry (solving the
Improving Retirement Income Coverage in Canada The ACPM Five-Point Plan
 Improving Retirement Income Coverage in Canada Month 00, 2012 ACPM CONTACT INFORMATION Mr. Bryan Hocking Chief Executive Officer Association of Canadian Pension Management 1255 Bay Street, Suite 304 Toronto
getting you ready / retirement planning For members within five years of retiring
 getting you ready / retirement planning For members within five years of retiring Contents 2 / Introduction 3 / HOOPP: More for your money 4 / The pension you ll receive 6 / When you can retire 12 / Survivor
SOCIAL SECURITY REFORM: work incentives ISSUE BRIEF NO. 6. Issue Brief No. 6. work incentives
 Introduction Issue Brief No. 6 Social Security Reform: work incentives This sixth and final Treasury issue brief on Social Security reform discusses Social Security s effect on work incentives and the
Maximizing GIS. A background paper on retirement financial planning for Canadians with very low incomes
 Maximizing GIS A background paper on retirement financial planning for Canadians with very low incomes a Contents Contents Purpose of this paper 3 Summary of GIS eligibility criteria and advice for low-income
Social Security Fundamentals
 Social Security Fundamentals Guidelines for making well-informed decisions There s Wealth in Our Approach. When it comes to thinking about the part Social Security plays in your retirement plan, most of
Elderly Immigrants in Canada: Income Sources and Self-Sufficiency SUMMARY
 Elderly Immigrants in Canada: Income Sources and Self-Sufficiency SUMMARY Prepared for the 2005 Economic Conference, Ottawa May 10 th, 2005 Colleen Dempsey Strategic Research and Statistics Citizenship
Office of the Chief Actuary
 Office of the Superintendent of Financial Institutions Canada Office of the Chief Actuary Bureau du surintendant des institutions financières Canada Bureau de l actuaire en chef Office of the Chief Actuary
Procedures of the Québec Pension Plan
 FOR YOU AND YOUR CHILDREN: GUARANTEEING THE FUTURE OF THE QUÉBEC PENSION PLAN A Reform of the Québec Pension Plan Working Paper Québec II You can obtain additional copies of this document at the following
How Can You Reduce Your Taxes?
 RON GRAHAM AND ASSOCIATES LTD. 10585 111 Street NW, Edmonton, Alberta, T5M 0L7 Telephone (780) 429-6775 Facsimile (780) 424-0004 Email rgraham@rgafinancial.com How Can You Reduce Your Taxes? Tax Brackets.
How To Get A Pension In Canada
 Easy Guide to Retirement Income Options Contents PAGE 1: Your retirement income choices... 2 1. Convert your RSP into an annuity... 2 a. Life Annuity... 2 b. Term Certain Annuity to Age 90... 2 2. Convert
ON THE SCALES 2 OF 2012 NATIONAL BUDGET 2012
 ON THE SCALES 2 OF 2012 NATIONAL BUDGET 2012 On 22 February 2012 the Finance Minister, Pravin Gordhan delivered his National Budget Speech. Whilst we have demonstrated resilience in the face of global
Socio-economic implications of retiring baby boom generation people, shrinking workforce in the developed economy and proposed solution
 Socio-economic implications of retiring baby boom generation people, shrinking workforce in the developed economy and proposed solution By Sonjai Kumar Abstract This paper talks about the socio-economic
Early Retirement Strategies
 If you or a member of your family is facing a permanent lay-off, voluntary early retirement or forced early retirement, there are many important decisions to be made decisions that can have a significant
Australia: Retirement Income and Annuities Markets. Contractual Savings Conference April 2008 Greg Brunner
 Australia: Retirement Income and Annuities Markets Contractual Savings Conference April 2008 Greg Brunner Pension system Age pension in place since 1908, funded on a payas-you go basis Means testing. The
The self-employed and pensions
 BRIEFING The self-employed and pensions Conor D Arcy May 2015 resolutionfoundation.org info@resolutionfoundation.org +44 (0)203 372 2960 The self-employed and pensions 2 The UK s self-employed populace
VALUING YOUR PENSION BENEFITS
 VALUING YOUR PENSION BENEFITS AND THE ASSET ALLOCATION IMPLICATIONS By William W. Jennings and William Reichenstein Asset allocation should be based on the family s extended portfolio that includes the
THE EMERGING RETIREMENT CRISIS
 THE EMERGING RETIREMENT CRISIS PART ONE Ontarians Rank Retirement Income Security as a Top Concern 1 // THE EMERGING RETIREMENT CRISIS: PART ONE Letter from Jim Keohane, HOOPP Dwindling pension coverage
ENGINEERING LABOUR MARKET
 ENGINEERING LABOUR MARKET in Canada Projections to 2025 JUNE 2015 ENGINEERING LABOUR MARKET in Canada Projections to 2025 Prepared by: MESSAGE FROM THE CHIEF EXECUTIVE OFFICER Dear colleagues: Engineers
CFUW Ontario Council Response To the. Consultations on the Ontario Retirement Pension Plan
 CFUW Ontario Council Response To the Consultations on the Ontario Retirement Pension Plan February 2015 Submitted by Brenda Robertson President, Ontario Council Canadian Federation of University Women
Old Age Security Benefits and Canada Pension Plan
 Old Age Security Benefits and Canada Pension Plan Service Canada Service Canada was created in 2005 to improve the delivery of government programs and services to Canadians, by making access to them faster,
The Cypriot Pension System: Adequacy and Sustainability
 Cyprus Economic Policy Review, Vol. 6, No. 2, pp. 49-58 (2012) 1450-4561 49 The Cypriot Pension System: Adequacy and Sustainability Philippos Mannaris Aon Hewitt Abstract The fundamental objective of pension
National Insurance Fund - Long-term Financial Estimates
 Social Security Administration Act 1992 National Insurance Fund - Long-term Financial Estimates Report by the Government Actuary on the Quinquennial Review for the period ending 5 April 1995 under Section
Everybody take a valium: The non-crisis in Canada s retirement system. Panel: What are the problems with the existing retirement income system?
 Everybody take a valium: The non-crisis in Canada s retirement system Calgary School of Public Policy Conference: The Future of Canada s Retirement System Panel: What are the problems with the existing
Global Demographic Trends and their Implications for Employment
 Global Demographic Trends and their Implications for Employment BACKGROUND RESEARCH PAPER David Lam and Murray Leibbrandt Submitted to the High Level Panel on the Post-2015 Development Agenda This paper
How Social Security Benefits Are Computed: In Brief
 How Social Security Benefits Are Computed: In Brief Noah P. Meyerson Analyst in Income Security February 4, 2015 Congressional Research Service 7-5700 www.crs.gov R43542 Summary With about $900 billion
What Every Worker Needs to Know About an Unreformed Social Security System. July 29, 2014
 What Every Worker Needs to Know About an Unreformed Social Security System Statement before the Subcommittee on Social Security Committee on Ways and Means United States House of Representatives July 29,
The Revised Pension Plan of
 The Revised Pension Plan of A Guide to the Pension Plan for Queen s Staff and Faculty Prepared by Pension Services, Department of Human Resources Fleming Hall, Stewart-Pollock Wing 78 Fifth Field Company
Policy Focus. The Need for Social Security Reform. Republicans and Democrats increasingly acknowledge that reforming. what you need to know
 Policy Focus The Need for Social Security Reform Recipes for Rational Government from the Independent Women s Forum Carrie Lukas, Managing Director, Independent Women s Forum August 2011 Volume 1, Number
14 th Annual National Report Card on Health Care. Embargoed until August 18, 2014 at 12:01 am EDT
 14 th Annual National Report Card on Health Care Embargoed until August 18, 2014 at 12:01 am EDT National Report on Heath Care: Seniors Health Issues and the Impact of an Ageing Population August 2014
The Benefits of a Fully Funded Social Security System
 The Benefits of a Fully Funded Social Security System By Nathan Taulbee I. INTRODUCTION The Social Security system, formally known as Old-Age and Survivors Insurance Disability Insurance (OASDI), began
Raising the Retirement Age for Social Security
 A October 2002 I SSUE B RIEF A MERICAN A CADEMY of A CTUARIES Raising the Retirement Age for Social Security When the Social Security program began paying monthly benefits in 1940, workers could receive
pensions backgrounder #4
 pensions backgrounder #4 Private Retirement Savings Part 4 in a Series The full series of pension backgrounders are contained in the National Union s Pensions Manual, Fourth Edition available from the