YELLOW CARD: POTENTIAL NEIGHBORHOOD IMPACTS OF A SOCCER SPECIFIC STADIUM DEVELOPMENT IN EAST SOMERVILLE
|
|
|
- Cuthbert Leonard
- 8 years ago
- Views:
Transcription
1 YELLOW CARD: POTENTIAL NEIGHBORHOOD IMPACTS OF A SOCCER SPECIFIC STADIUM DEVELOPMENT IN EAST SOMERVILLE MELISSA ARMSTRONG WOODS

2

3 Yellow Card: Neighborhood Impacts of a Soccer Specific Stadium Development in East Somerville A thesis submitted by Melissa Woods In partial fulfillment of requirements for the degree of Master in Arts in Urban and Environmental Policy and Planning Tufts University April, 2012 Advisor: Mary Davis, PhD Readers: Ann Rappaport, PhD Wig Zamore, MS

4

5 ABSTRACT This thesis focuses on the potential economic development and environmental health impacts of a 25,000 seat soccer stadium in the Inner Belt and Brickbottom neighborhoods of East Somerville, Massachusetts. The goal of this thesis is to provide recommendations to Somerville about development in the Inner Belt and Brickbottom neighborhoods as it relates to the relocation of the New England Revolution soccer stadium. To make recommendations to Somerville, 10 planning and economic development documents were reviewed from Carson and San Jose, California; Sandy, Utah; Harrison, New Jersey; Bridgeview, Illinois; and Portland, Oregon. These stadiums were built (or majorly renovated) for MLS soccer teams and have access to public transportation. Documents were reviewed for economic development and environmental health impacts. There are many similarities between these other cities and Somerville including a need for a diversified tax base, replacing underutilized industrial sites, and creating a draw for their city. Somerville has shown that it has the capability to work with their residents on complex issues and should proceed with caution as they evaluate a mixed-use stadium development using an independent economic development impacts study and a health impact assessment. v

6

7 ACKNOWLEDGMENTS First and foremost, I would like to thank Professor Mary Davis, Professor Ann Rappaport, and Wig Zamore for their help and assistance throughout this process. With your help, I believe this thesis will do more than sit on a shelf. To my UEP friends, including classmates, faculty, and staff, thank you for your support personally and academically. To the city employees I spoke with throughout this process, thank you for the lively conversation and interest in my topic. And lastly, thank you to my family and friends for your love and support the last two years. vii

8

9 TABLE OF CONTENTS CHAPTER 1 INTRODUCTION 1 CHAPTER 2 BACKGROUND 5 Table 1 Boston Metro Area Soccer Stadiums... 6 Figure 1 The City of Somerville...8 Figure 2 Neighborhoods of Somerville Figure 3 Somerville Transit Infrastructure...10 Figure 4 East Somerville Figure 5 The Inner Belt and Brickbottom Neighborhood...14 Table 2 Demographic Comparison...15 Figure 6 Fewer in the Stands for Soccer...18 CHAPTER 3 LITERATURE REVIEW 21 Table 3 MLS Stadium Financing...23 CHAPTER 4 METHODOLOGY 39 Table 4 US Major League Soccer Stadiums and Selected Characteristics...40 Table 5 Reviewed Documents...42 CHAPTER 5 RESULTS 45 Table 6 Results Comparison...46 Table 7 Population Density of Municipalities with Urban MLS Stadiums...61 CHAPTER 6 RECOMMENDATIONS FOR SOMERVILLE 63 CHAPTER 7 CONCLUSION 67 APPENDIX A INTERVIEW QUESTIONS APPENDIX B MAPS Figure 7 Houston, Texas...71 Figure 8 Chester, Pennsylvania...72 Figure 9 Carson, California...73 Figure 10 Sandy, Utah...74 Figure 11 Harrison, New Jersey...75 Figure 12 San Jose, California...76 Figure 13 Portland, Oregon...77 Figure 14 Bridgeview, Illinois...78 REFERENCES ix

10

11 LIST OF ABBREVIATIONS AMEN - Assessment and Management of Environmental Noise BAC Blood Alcohol Content CEQA California Environmental Quality Act CNE Canadian National Exhibition EIR Environmental Impact Report EPA Environmental Protection Agency FIFA - The Federation of International Football Associations FIRE Financial Insurance and Real Estate HIA Health Impact Assessment MBTA Massachusetts Bay Transportation Authority MLB Major League Baseball MLS Major League Soccer MSA Metropolitan Statistical Area NBA National Basketball Association NFL National Football League NHL National Hockey League TOD Transit Oriented Development WHO World Health Organization WUSA Women s United Soccer Association xi

12

13 Chapter 1 INTRODUCTION Stadium development across the United States has been rampant over the last 25 years ranging from the Centennial Olympic Stadium in Atlanta, Georgia to minor league baseball s Louisville Slugger Stadium in Louisville, Kentucky. The big four leagues, MLB, NHL, NFL, and the NBA have built over 30 stadiums or arenas since During this time, Major League Soccer (MLS) has become a formidable league with twenty teams and thousands of dedicated followers. The league franchises have built 10 soccer specific stadiums in the last 12 years. The Kraft family owns and operates the New England Patriots and the New England Revolution, one of the league s ten founding teams. The New England Revolution play soccer at Foxboro Stadium, a stadium designed for National Football League games. MLS has begun a campaign that all new expansion teams must play in a soccerspecific stadium (Economic Research Associates 2008). Currently, 13 of the 20 MLS teams have built (or majorly renovated) stadiums to seat 18,000-27,000 fans (HVS Consulting and Valuation Services 2009; Sports Economics 2008; City of Houston 2010). Since the Revolution is a founding team from 1996, they are not affected by this MLS campaign. However, this has not stopped 1

14 the organization from exploring options to relocate from the 68,000-seat Foxboro stadium, located 45 minutes outside of Boston, into a smaller urban stadium that fits roughly 25,000 fans. Twice in the last four years the Boston Globe (Moskowitz 2010; Moskowitz 2008) has covered rumors of relocation including the Inner Belt and Brickbottom neighborhoods of East Somerville. The President of the New England Revolution, then the Chief Operating Officer, has even answered questions about stadium relocation in a June 28, 2010 blog post, the Globe confirmed stadium relocation was a top priority for the team in March 2011, and Bilello again acknowledged the priority in March 2012 in a television interview (Bilello 2010; Dell Apa 2011; NECN 2012). The City of Somerville is currently working with residents in a visioning process to imagine the Inner Belt and Brickbottom neighborhoods after the Green Line Extension that is expected to start operation in In addition, a 2008 Scoping Study (CBT et al. 2008) commissioned by Somerville included a stadium utilizing air rights 1 over a Massachusetts Bay Transit Authority (MBTA) maintenance facility as part of a 160-acre site. The Inner Belt and Brickbottom neighborhoods are separated from the majority of the community by major roadways including Interstate 93, McGrath Highway, and Washington Street. Redevelopment, including a 25,000-seat stadium, changes a neighborhood and affects the surroundings. The typical MLS schedule hosts fifteen home games between April and September plus playoffs. Each game would bring an influx of fans and vendors, traffic, light (for night games), and noise to a site surrounded by the typical Somerville housing stock, converted single families and triple-deckers. Somerville already has the greatest number of vehicle miles traveled per square mile in Massachusetts (City of Somerville 2010) but is anticipating relief from the Green Line extension. 1 Air rights is a term used in real estate development that symbolizes a development agreement to build above an existing property or land. 2
.")
15 At the same time, Somerville is seeking economic development opportunities. Somerville has already established the following criteria for redevelopment of the Inner Belt and Brickbottom neighborhoods: reconnect to Somerville and surrounding communities including Cambridge and Boston, create mixed use development and open space, enhance transit access, rework infrastructure, and encourage a life sciences convergence with nearby universities (The City of Somerville 2011e). Somerville loses 85% of its workforce population every workday to neighboring cities. These workers pay their own transportation costs and are more likely to spend money outside of Somerville. Somerville is looking for ways to employ residents to increase opportunity, increase their tax benefits, and help the local economy (The City of Somerville 2008). The goal of this research is to explore potential neighborhood impacts, specifically economic development and environmental health impacts, of a stadium development in the City of Somerville by collecting and reviewing planning and economic development documents from other urban soccer stadiums. This thesis includes the following chapters, a brief history of Boston stadiums, Somerville, and Major League Soccer; a literature review focusing on stadium development, financing and economic development, and environmental health; the review of economic development and planning documents for six urban stadium sites followed by recommendations for Somerville. I chose this approach because much of the academic literature focuses on other US leagues: MLB, NFL, NBA, and NHL. By evaluating these new stadiums, the argument for stadium development can be further informed. 3
. Somerville loses 85% of its workforce population every workday to neighboring cities. These workers pay their own transportation costs and are more likely to spend money outside of Somerville.")
16

17 Chapter 2 BACKGROUND STADIUMS IN BOSTON S HISTORY Boston has a storied history when it comes to its sports teams. From the Red Sox Curse of the Bambino to the Big Three of the 2008 Championship Boston Celtics, Boston is nationally known for being a sports town. The Boston metro area also has a history of professional soccer teams starting in the 19th Century (see Table 1). In 1894, the South End Grounds hosted the Boston Beaneaters and later in 1921 the Boston Soccer Club played games there. Fenway Park, the oldest stadium in Major League Baseball, also hosted a soccer team in 1967 for one season, the Boston Beacons (Foulds 2005). In fact, Nickerson Field (Boston University), Balmoral Park in Andover, Malden Stadium, Everett Stadium, Manning Bowl in Lynn, Alumni Stadium (Boston College), and Bowditch Field in Framingham all have hosted professional soccer teams at one point in their history. Regionally, Sam Mark s Stadium, home to the Fall River Marksmen was the first soccer specific stadium in the U.S. Despite the team name, the stadium was in Tiverton, Rhode Island because Massachusetts blue laws prohibited games on Sundays (Foulds 2005). 5

18 Furthermore, Harvard Stadium hosted soccer games for the Los Angeles 1932 Summer Olympic games and Foxboro Stadium hosted games for both the Men s and Women s national teams. It was actually the success and enthusiasm of fans at the 1994 World Cup that lead to New England being chosen as one of the original MLS teams. In addition, MLS and the Women s United Soccer Association (WUSA) hosted their inaugural championship games at Foxboro Stadium (Foulds 2005). 6

19 The Boston metro area is no exception to the stadium expansion seen nationwide. In the last 25 years, of the three major venues in Boston, only Fenway Park remains. The Boston Celtics (NBA) and the Boston Bruins (NHL) play in the TD Banknorth Garden built in 1995 (opened under the name Fleet Center). Gillette Stadium opened in 2002 after the Krafts almost moved the Patriots to South Boston, Providence, or Hartford (Foulds 2005). Plans to move the Patriots and Red Sox began in 1994, with a proposal for two new stadiums on the South Boston Waterfront. The stadium development was part of a $1 billion project that included a convention center. The project was dead by the end of 1995 because of size, cost, complexity, and political unwieldiness (Powers 2002). Another stadium, only for the Patriots, was proposed. Thirteen hundred South Boston residents came to a public meeting to voice their disapproval for the project. Their protests were successful and the project was ended soon thereafter (Powers 2002). Kraft, still needing a replacement for Foxboro Stadium, then looked to Hartford, Connecticut, where the team would play in a new stadium at Adriaen s Landing paid for by municipal bonds and a sales tax on tickets. The deal fell through because the state couldn t meet the original deadline of the 2002 season. In the end, the Kraft family, with private funds and $70 million from the state of Massachusetts for infrastructure support, built the $275 million Gillette Stadium (Foulds 2005; Delaney and Eckstein 2003a). In 2005, the Red Sox declared that they would stay at Fenway (Goodno 2005). To keep the stadium current it goes through renovations almost every off-season. OVERVIEW OF SOMERVILLE The City of Somerville is a diverse community bordering Boston, Cambridge, Arlington, and Medford (see Figure 1) and has been mentioned as a possible location for a new stadium for the New England Revolution. Somerville, the densest city in New England, is organized into a series of squares and 7

20 neighborhoods, most notably Davis and Union Squares (City of Somerville 2011a). Somerville is accessible by the Red and Orange lines of the MBTA and Interstate 93, and it will eventually be accessible by the Green line extension (see Figures 2 & 3). The City of Somerville is a progressive government run by Mayor Joseph (Joe) Curtatone since 2004 (City of Somerville 2011b). In this time, the City has been named The Model City in the Boston Globe Magazine (2006) because of the local government s cutting edge ideas and willingness to change. In 2009, the city won the All American City Award by the National Civic League. The honor awards communities whose citizens work together to address local issues 8
 because of the local government s cutting edge ideas and willingness to change.")
21 (City of Somerville 2011c). In 2010, Mayor Curtatone was honored as a keynote speaker for the kickoff of First Lady Michelle Obama s Let s Move campaign. Her program is similar to the initiatives of Shape Up Somerville, a program started in 2003 in collaboration with Tufts University (Roy 2010). A Fiscal Year 2009 state report confirmed that Somerville is a lean city (Resistat 2011). Somerville spends the least per capita of any city in Massachusetts. This is the result of the Mayor and his team looking for ways to increase efficiency and decrease costs. Each year the State of Massachusetts has decreased funding to municipalities, and Somerville is no exception. Over the last 10 years, state aid to Somerville has decreased by $20.7 million dollars or 13% of the City s operating budget (Resistat 2011). 9
22 Somerville has made numerous changes over the last 5 years to bridge that budget gap. They have converted the city to a single stream recycling service. The pilot program increased recycling rates which reduces disposal fees. Somerville has also increased several fees such as parking permits, visitor parking, and meter rates. This includes extending the meter times in business districts from 6 to 8 p.m., an additional 2 hours of revenue. The City sees this as preserving an urban community, encouraging residents to take alternative and sustainable forms of transportation, and increasing turnover in business districts (Guha 2009). 10
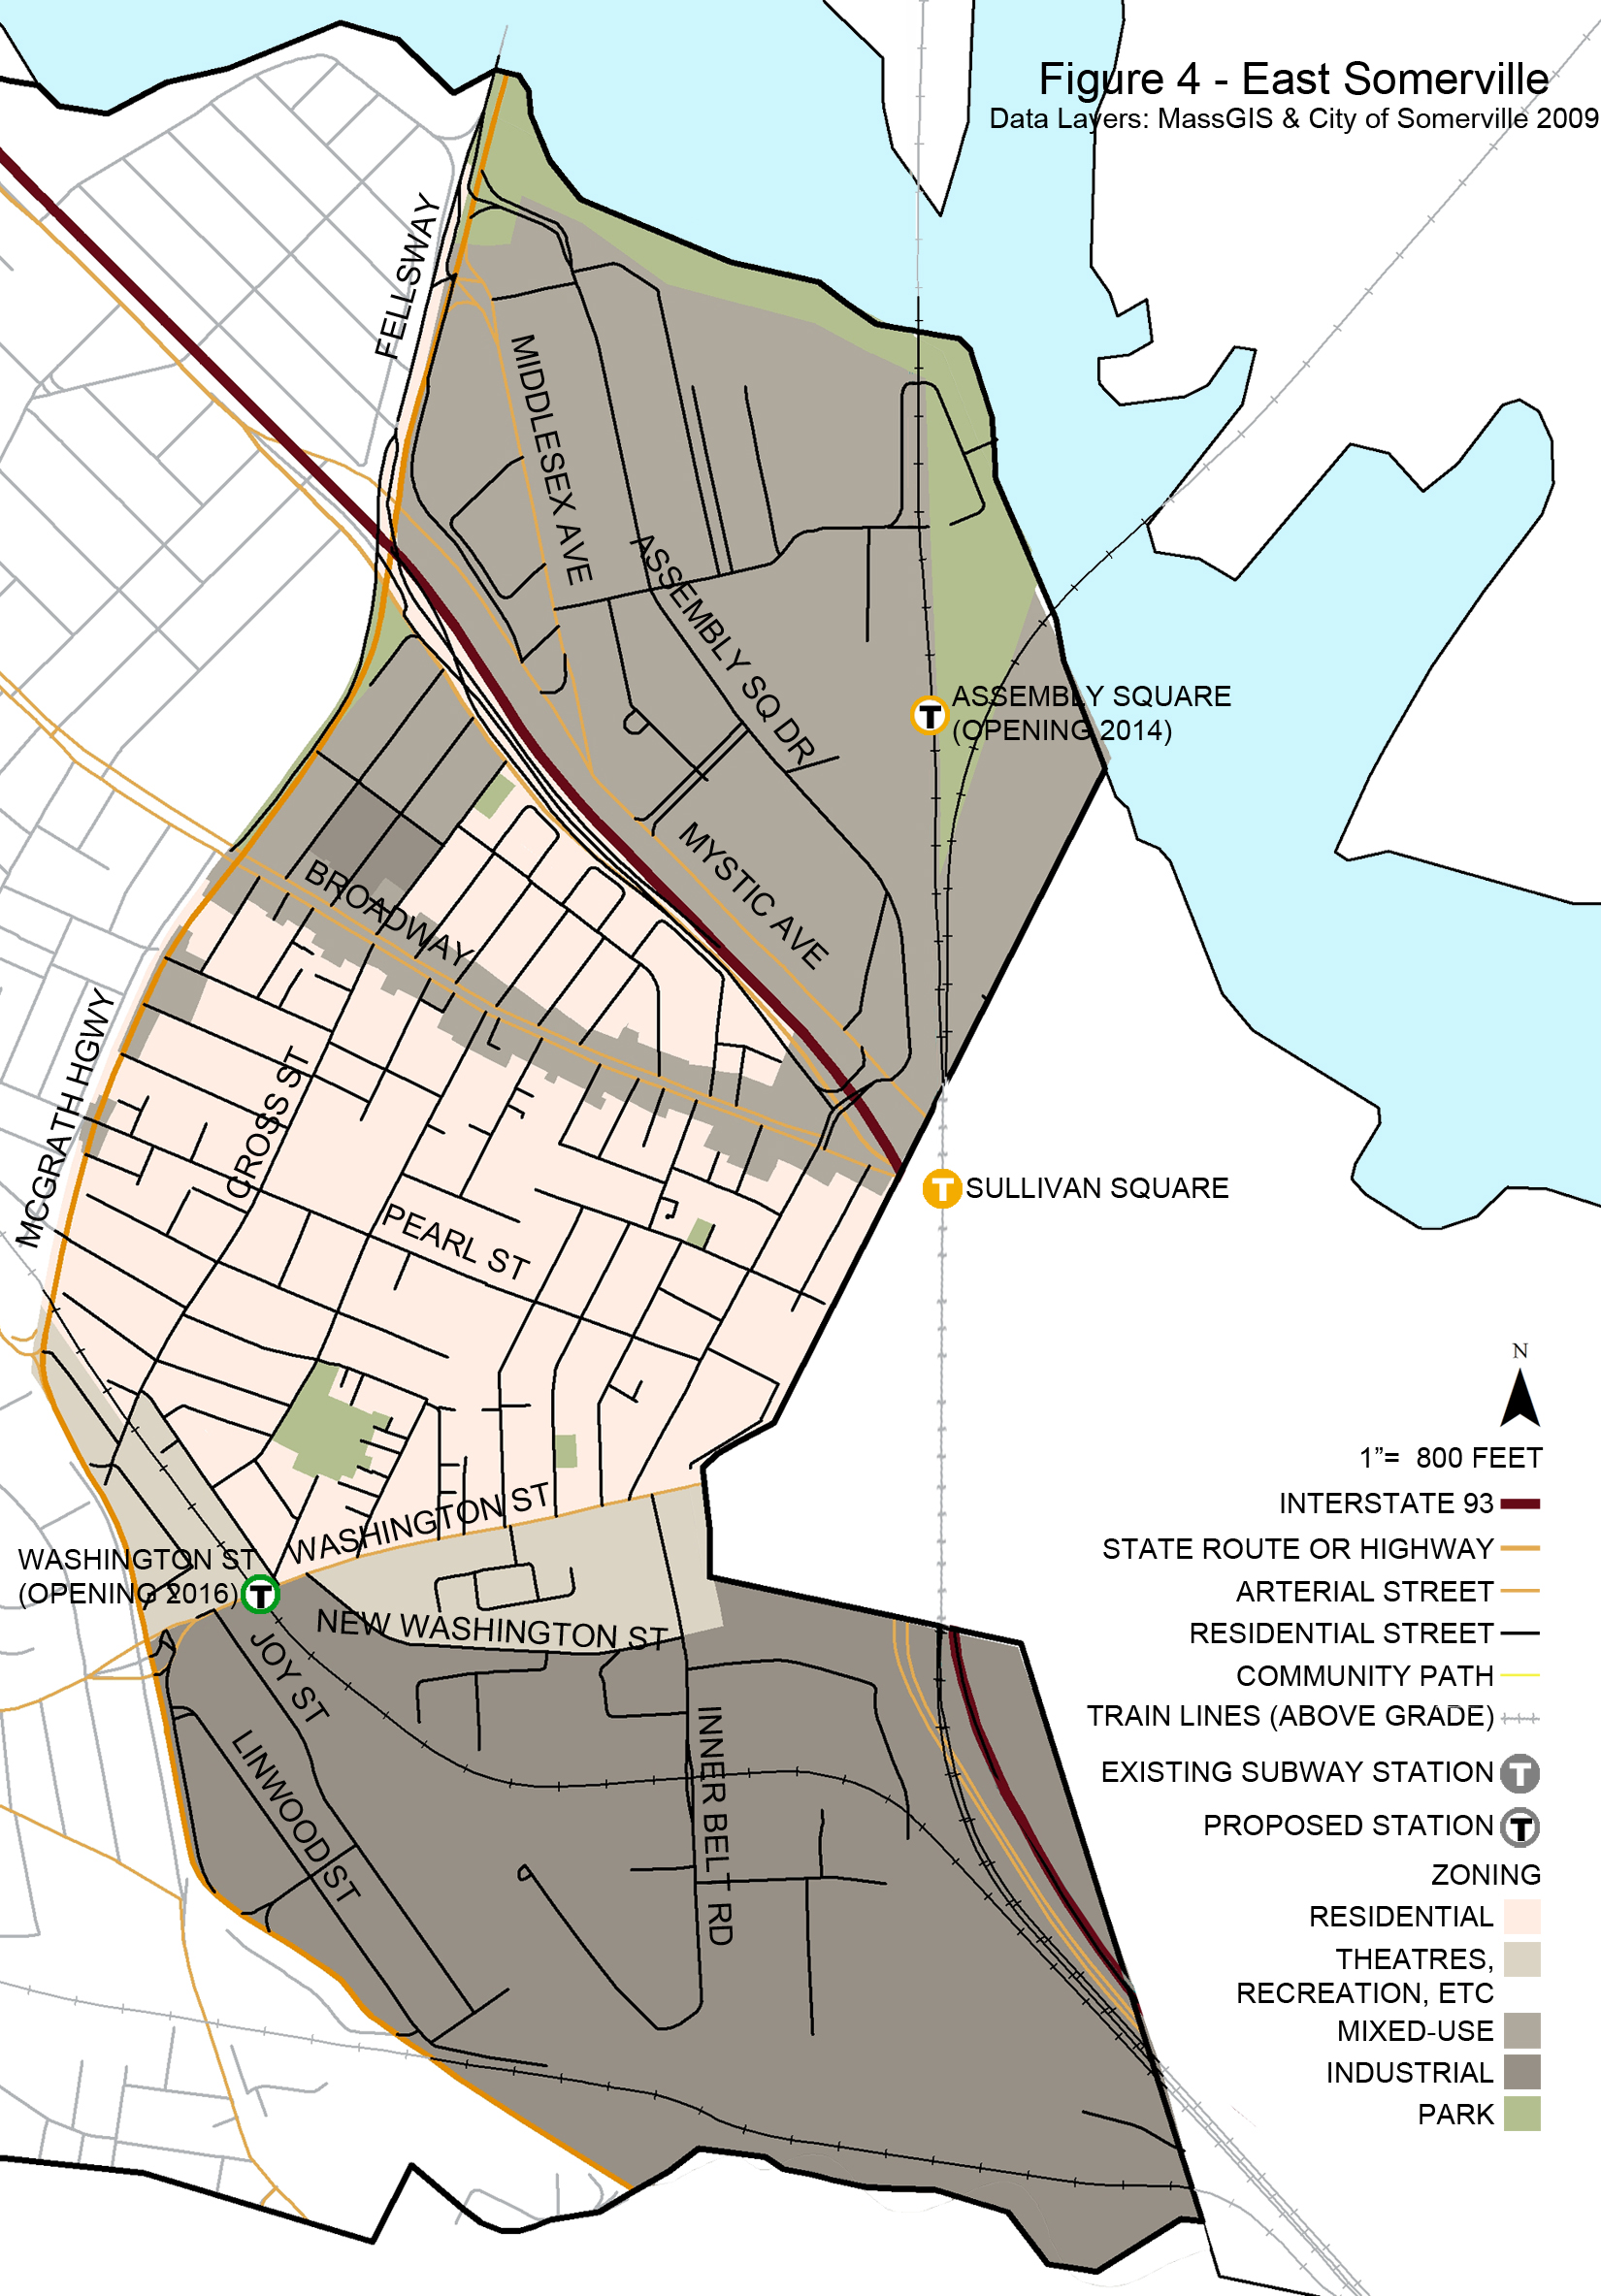
23 Another way of decreasing the budget gap is through development of commercial properties which have a higher tax rate than residential. For the most part, Somerville s 4.1 square miles are fully developed. Because of this, Somerville views underdeveloped land in high regard and wants to transform underdeveloped properties to their maximum potential. In addition, Somerville wants to increase employment opportunities for current and future residents. Some of the underdeveloped sites in Somerville are the vacant Powderhouse Community School in Teele Square, the Kiley Barrel site in Union Square, the MaxPac site near Davis Square, the Inner Belt and Brickbottom neighborhoods, and Assembly Square in East Somerville (see some of these sites in Figure 4). Somerville is currently home to 20,000 jobs and wants to increase to 50,000 jobs by 2030 (City of Somerville 2012). Assembly Square and its redevelopment are an example of the City working with the residents to vision new uses for an underutilized area. Ford Motor Company operated a manufacturing facility on the site until In subsequent years, the building remained empty and several other surrounding manufacturing businesses closed. In 1980, the City adopted a 20-year urban renewal plan to improve the abandoned area, which included a mall of big box retailers and surface parking. In 2000, a new plan was adopted for the site that was a result of collaboration between the City and residents. The residents opposed large retailers using the waterfront for private business. The new plan includes designs for a 145-acre mixed-use, transit oriented development (TOD) with accessible public green space along the Mystic River. The development is expected to bring in $24 million tax dollars annually to Somerville, 9,700 new jobs, and retain 590 existing jobs. The real estate development has been slowed by the economic downturn but infrastructure improvements for the mixed-use district have started to take shape including a new stop of the MBTA s Orange Line called Assembly Square which is expected to open in 2014 (City of Somerville 2011d). 11
24 12
25 One of the other underdeveloped neighborhoods in Somerville is the Inner Belt and Brickbottom neighborhood (see Figure 5), the neighborhood identified as a possible location for the Revolution stadium. The neighborhood is on the eastern edge of Somerville bordering Cambridge and Boston. More specifically, the neighborhood is east of McGrath Highway, south of Washington Street, and West of Interstate 93. It is a 160-acre, or ¼ square mile, light industrial zone (The City of Somerville 2011e). The majority of the neighborhood has gone underutilized since The Inner Belt Highway project, a six-lane highway meant to connect Somerville, Cambridge, Brookline, and Boston ended at that time without a highway being built. Unfortunately, much of the neighborhood had already been demolished to prepare for the highway and interchange construction (The City of Somerville 2011e). Currently, the Inner Belt and Brickbottom neighborhoods are comprised of low-density industrial and commercial uses, a different vernacular than the rest of Somerville. Properties along Washington Street match the context of Somerville and hide the industrial portion from drivers and pedestrians. The neighborhood is part of a fiber optic loop including Cambridge and Boston, which makes it more desirable to high technology tenants because of the high speed internet access (The City of Somerville 2008). Another attraction to the community in the Inner Belt and Brickbottom neighborhoods are the Brickbottom Artist Lofts. The lofts are one of the largest artist communities under one roof in the U.S. The lofts and an affordable housing development serving primarily elderly people account for the small population of the area (The City of Somerville 2011e). The Inner Belt and Brickbottom neighborhood are part of the larger East Somerville designation (see Figure 4). McGrath Highway, elevated through the majority of Somerville, separates East Somerville from the rest of the community. Interstate 93 further separates the neighborhood by dividing the Mystic and Assembly Square neighborhoods to the North and the Inner Belt 13
.")
26 and Brickbottom neighborhoods to the South. Because of these two pieces of regional infrastructure, East Somerville shoulders the burden of transportation infrastructure for the region (The City of Somerville 2008). In total there are 250,000 vehicle trips on Interstate 93, Mystic Avenue, and McGrath Highway per day. In addition, there are 200 diesel rail trips (freight and commuter) per day (STEP 2011). The majority are in the Inner Belt and Brickbottom neighborhoods. The trains do not have a station in Somerville, they simply transport goods and people from the suburbs to downtown Boston. The East Somerville neighborhood includes the residential areas that would be adjacent to a stadium. Table 2 summarizes the demographic differences 14
27 between the Inner Belt and Brickbottom neighborhood, East Somerville, Somerville, and the Boston Metropolitan Statistical Area using 2010 Census information. The majority of East Somerville residents work in service, production, and transportation-related fields (The City of Somerville 2008). These occupations tend to be low-paying, and 62% of East Somerville residents are low and moderate income (The City of Somerville 2008). East Somerville s housing stock is comparable to Somerville as a whole with a few exceptions. The majority of housing units were built between 1875 and 1925 and 86% have two or more units. With an aging housing stock there is concern of lead paint and fire hazards. Some of the housing is in poor condition and suffers from a lack of routine maintenance like painting and weatherproofing (The City of Somerville 2008). However, the biggest problem with housing in the East Somerville neighborhood is crowding. There are too many people living in inadequately sized housing. This is most likely due to 15
28 the high cost of rent and real estate. Crowding in East Somerville is twice the citywide rate at 11% (The City of Somerville 2008). On a positive note, in East Somerville a third of the homes are owner occupied which is 3% higher than the citywide rate (The City of Somerville 2008). Despite the challenges facing East Somerville, the City sees this area as an asset. They are currently engaged in a visioning process with residents of the Brickbottom and Inner Belt neighborhoods. Twenty percent of the land area is commercial and industrial use, the largest in Somerville, plus rental rates are still lower than Cambridge and Boston making it competitive (The City of Somerville 2008). The low-density Inner Belt and Brickbottom neighborhoods are home to 800 jobs. The City of Somerville wants to improve the infrastructure and services to this part of Somerville and sees many large areas of underdeveloped commercial land as potential for job growth and business (The City of Somerville 2008). In short, Somerville is under great pressure to expand its commercial tax base in order to relieve its citizens of the burden of funding basic city services with residential property taxes. Somerville s commercial tax base remains very small in comparison to Boston and Cambridge that derive 66% and 60%, respectively, of their property tax revenue from businesses. By contrast, Somerville derives only 28% of its property tax revenue from businesses (The City of Somerville 2008, 222). Somerville values the Innerbelt and Brickbottom neighborhoods as a place to increase tax revenue with redevelopment. HISTORY OF MAJOR LEAGUE SOCCER & THE NEW ENGLAND REVOLUTION Major League Soccer (MLS) and the New England Revolution began their inaugural season in The international governing body of soccer, FIFA (The Federation of International Football Associations), awarded the United States the right to host the 1994 World Cup. In return, they expected the United States to start a new professional soccer league (Jewell and Molina 2005). The league 16
29 started with 10 teams, expanded to 12 in the second season, and contracted back to 10 in the third season. Although the first few seasons were uncertain, especially in some markets, the league has continued to grow and now has 19 teams in the US and Canada (Jewell and Molina 2005). MLS set up their league differently than other professional soccer leagues of the past and many other professional leagues in the U.S. MLS is a single limited-liability company. Franchise owners own a stake in the league and their team and Major League Soccer owns 50% of each MLS franchise. MLS owns and negotiates all of the player contracts and is responsible for player allocation. Team owners have the right to 50% of the ticket sales, and the remaining percentage goes back to the league to pay for player contracts. This structure avoids larger markets (teams with higher tickets sales) taking good players from smaller markets. In other words, and using a different league as an example, this avoids the difference between the New York Yankees payroll and the Kansas City Royals payroll (Jewell and Molina 2005). Because of this unique league structure, MLS players sued MLS for holding down salaries. In the 2000 decision on the antitrust lawsuit called Frazie, et al. v Major League Soccer, it was decided that the league structure did not defy the Sherman Act 2. The decision did not say that soccer is exempt from antitrust laws but that there was enough competition internationally that they did not create a monopoly (Jewell and Molina 2005; Fizel 2006). In 2007, MLS created the Designated Player Rule allowing teams to sign up to three players with only the first $335,000 of their salary counting towards the team s salary cap. The first player to come to MLS under this new rule was international star David Beckham. There are now over 20 designated players in the league (Foss 2011). Major League Soccer has a unique fan base. They have the largest female and Hispanic fan base of any professional sport representing 48.5% and 19% of the 2 The Sherman Act is a federal statue passed in 1890 that limit business activities that hinder competition in the marketplace. 17
30 fans, respectively. The NBA has the second highest Hispanic fan base at 14.5% and the NHL has the lowest at 10.2%. MLS followers also have the second highest income levels of the professional sports; 40% of fans make more than $50,000 per year. This larger income indicates that soccer fans could have more discretionary income and may spend more at a soccer stadium. These demographics are important to potential sponsors and advertisers because they contain young professionals of both sexes with higher than average incomes. Currently, MLS stadiums generate a 77% utilization rate of their soccer specific stadiums or 19,250 people in a 25,000 seat stadium. In addition, MLS games attract over 10 million television viewers annually (Sports Economics 2008). The Revolution play in the 68,000 seat Gillette Stadium (Foulds 2005). Gillette Stadium and Patriot Place, an outdoor mall next to the stadium, are 28 miles from downtown Boston. The stadium is surrounded by a sea of surface level parking and game day traffic clogs Route 1, a four-lane highway leading to interstates 95 and 495. The MBTA commuter rail runs commuter train service from Boston and Providence for all Patriots home games but not for the Revolution games. These trains carry a maximum of 1,800 fans 3. According to Jonathan Kraft, Investor/Operator of the Revolution, Gillette Stadium provides a valuable economic environment for [the Revolution]. Without it, I don t know if this team would exist (Dell Apa 2011). The 3 Riding the T New England Patriots patriots/ (accessed April 16, 2012). 18
31 Revolution, once one of the best-attended teams in MLS, used to draw up to 19,000+ fans per game (Sports Economics 2008). In the past few seasons they have only drawn around 12,000-13,000 fans per game (Moskowitz 2010; Tomasch 2012). The fans and team look dwarfed in the stadium (see Figure 6). The 2011 season saw only 5 wins. The team is currently in a large transition in the offseason with changes to both the coaching and office staff (New England Revolution 2011). The New England Revolution rarely comment on their work toward an urban stadium site except to state that this is a high priority of the team (NECN 2012). Their intentions can only be approximated by third party sources close to the team, like Frank Dell Apa, the Boston Globe Staff and soccer columnist. In Dell Apa s 2011 article he summarized interviews with Don Garber, MLS Commissioner and Jonathan Kraft, Owner/Investor of the New England Revolution regarding stadium development, the Revolution are not about to vacate Gillette Stadium unless they can find vacant land and receive financial aid from a municipality. In the article, Kraft acknowledges the challenges due to the economic downturn which have municipalities reprioritizing, and Garber acknowledges the need for both commercial revenue to fund a stadium and a municipality s role in garnering public support. In an interview on New England Comcast Network (NECN 2012), Brian Bilello expressed that the New England Revolution s first priority is a soccer-specific stadium. This adds to previous news articles about the Revolution looking for an urban stadium site (Moskowitz 2010; Moskowitz 2008; Dell Apa 2011). A new stadium could increase their chance at success including increased ticket sales. Major League Soccer wants to tap into the young, urban demographic that so deeply loves the game and wants to experience it in a small urban environment (Dell Apa 2011). 19
32 Bilello further clarifies in his television interview that he understands that the Revolution need to work with municipal officials and make sure that a stadium is the right fit (NECN 2012). Dell Apa states that the best scenario for the Revolution would be to combine two MLS stadium scenarios; the Seattle Sounders Qwest Field s urban location with Sporting Kansas City s LiveStrong Sporting Park s financing. LiveStrong Sporting Park received $150 million dollars in public funds (Dell Apa 2011). It s likely the New England Revolution believe a funded, urban locale would be best for their organization. 20
33 Chapter 3 LITERATURE REVIEW Stadium development is rarely about the stadium alone. Stadium owners strike financing deals with municipalities, offer promises of employment and community involvement, and build stadiums that attract thousands of people to otherwise quiet areas. Cities across the US have started to abandon rural stadiums on cheap land with urban infill stadiums that promote entertainment and cultural districts. No matter the sport, it is important to understand the recent history of the stadium debate including arguments about stadium financing, economic development, community morale, and environmental health. STADIUM DEVELOPMENT History of Stadium Development The boom of stadium construction in the last 25 years is not surprising considering the fundamental changes in stadium development, increase in subsidies, and the success and interest in professional sports teams. Before 1945, teams played in privately owned stadiums. After World War II, there was an increase in the popularity of sports but most teams continued to rent stadiums from private owners (Delaney and Eckstein 2003a). With increasing 21
34 coverage on television, cheaper transportation options, and swelling population in the South and West, teams that were once regional pastimes saw the opportunity to capitalize on a new fan base (Delaney and Eckstein 2003a; Noll and Zimbalist 1997). Numerous teams in the saturated markets of the Northeast moved in favor of being the only franchise in a new city (Noll and Zimbalist 1997). These new cities, like many after World War II, had two income households and were focusing on educating their family leading to an increase in attendance at cultural events (Curry, Schwirian, and Woldoff 2004). Municipalities jockeyed over the right to host teams and gain notoriety with them. New stadiums, sometimes built by the municipality, were a way to lure the team to the city. Politicians that supported using municipal dollars to construct the stadium often touted economic development benefits and the increased morale of citizens as a reason for the expense (Delaney and Eckstein 2003b). Stadium Financing Supporters of stadium development will argue that stadiums increase economic development opportunities and therefore should be subsidized to encourage their development. Stadium financing refers to who pays for the construction of the stadium and operating the stadium once it s opened (Noll and Zimbalist 1997, 6). Sports franchises have used stadium financing as a way to pit city versus city in an effort to get the best available deal for their team. This makes stadium funding a contentious debate between franchise owners, city and state officials, and local residents because they are competing for public dollars against other wants and needs including public transportation, environmental cleanup, infrastructure improvement, ADA accessibility, and housing (Curry, Schwirian, and Woldoff 2004). Building a stadium usually takes a mix of resources. Teams make a financial plan that generally has three components: corporate sponsorships, expenses paid by the professional team, and expenses paid by a local or state government. 22
35 23
36 The government issues bonds 4 in order to help pay for the development (Noll and Zimbalist 1997). The government then repays the lender(s) with interest. Municipalities pay back the debt in a variety of ways which can include an increase in sales tax, an additional tax on ticket sales, savings from cuts in public services, and/or increased real estate tax income on the stadium property (Noll and Zimbalist 1997). Another way of subsidizing a stadium is by giving government owned land or providing money to purchase land for the project. One example of this is the new Yankee Stadium which was built on 22 acres of public parkland adjacent to the old Yankee Stadium (Johanson 2009). Harrison, New Jersey gave 40 million dollars for land acquisition. The Houston Dynamo and the LA Galaxy play in stadiums that are built on municipal and state land respectively. See Table 3 for stadium financing of Major League Soccer Stadiums. Even stadiums that tout being subsidy free don t necessarily come without a cost to municipalities. The San Francisco Giants have one of the few stadiums built with 100% private funds. AT&T Park, built in 2000, used $186 million from the sale of personal seat licenses and naming rights to finance the stadium. The stadium cost $307 million to build, but the city of San Francisco paid for a new light rail transit stop, street lighting, and public utility connections (Delaney and Eckstein 2003a). Economic Development The majority of evidence states that stadium development does not contribute to economic development (Delaney and Eckstein 2003a; Noll and Zimbalist 1997; Coates and Humphreys 2000; Santo 2005). Editors Roger Noll and Andrew Zimbalist gather the most common arguments in Sports, Jobs, and Taxes (1997) 4 Bonds are a type of loan that pays the lender back in a specified period of time including principal and interest. The Wall Street Journal What is a Bond? wsj.com/personal-finance/investing/what-is-a-bond/ (accessed April 16, 2012). 24
37 the preeminent book for people against stadium development as an economic development tool (Santo 2005). However, stadium development has changed from the time of their research from rural cookie-cutter stadiums to urban contextual stadiums, which has continued the debate. Santo (2005) more recently argued against the one size fits all approach of the research in Sports, Jobs, and Taxes (1997). Either way, the expectations are high for major league teams: redevelopment projects must do more than just enhance the urbanscape. They are expected to create jobs, stimulate business, attract new investment to the downtown area, make the city more lively and user friendly and enhance the fiscal health of the city government (Curry, Schwirian, and Woldoff 2004, 37). Matheson in the Handbook of Sports Economic Research (2006) acknowledges that these expectations have received significant attention in the United States but little has been written about soccer specifically. These stadiums will become even more common since MLS (17,872 average attendees per game) has overtaken the NBA and NHL as the third most attended sport behind the NFL (66,960) and MLB (30,352) (Edwards 2011). Support for Stadiums as Economic Development Tools Some supporters of stadium development see economic development as the primary reason for a new stadium. To these people the three main benefits are temporary employment for construction trades, permanent employment caused by the operation of the stadium, and increased development around the stadium site such as restaurants and souvenir shops (Delaney and Eckstein 2003a). Benefits exclusive to the municipality are an increase in tax revenue from ticket sales, concessions, and real estate taxes (Delaney and Eckstein 2003a). Curry et al (2004) list three reasons to host sporting events from amateur teams like AAA baseball to the Olympic games; first, cities want the prestige that comes from hosting a team; secondly, they want to stimulate local businesses; lastly, they want to use the team as a way to provide for or reason 25
38 for major urban redevelopment projects. This list could also be used to describe the wants of municipalities hoping to recruit a team. More recent studies like Charles Santo s The Economic Impact of Sports Stadiums Recasting the Analysis in Context try to cover economic development and urban stadiums. In his 2005 Urban Affairs article, he acknowledges the breadth of information supporting the argument that stadium development cannot spur economic development but notes some exceptions. Santo evaluated stadiums from that had experienced a change in NFL or MLB franchises or stadium construction with mixed results. His results show that the presence of a new baseball stadium can have a significant positive impact on a metropolitan statistical area s (MSA) income share. He also notes that stadium location is important. The football and baseball stadiums that had a positive correlation with MSA income share were located in downtown areas. Santo did not define the characteristics that make a downtown area in his journal article. Mark Rosentraub in Sports, Jobs, and Taxes (1997) analyzed 12 cities with downtown stadium developments (10 midwestern and 2 southern) for changes in employment, population, and employment sectors. Cities with downtown stadiums lost less of their population (11%) versus cities without stadiums (13.3%). For both cities with and without stadiums there was a decline in employment opportunities in central business districts including finance, insurance, and real estate (FIRE) sectors. Indianapolis, which made a cluster strategy around sports, did better in this analysis than the other cities. Rosentraub explains that they had a downtown redevelopment plan that included professional sports and national sports organizations (like NCAA) (Noll and Zimbalist 1997). Indianapolis attracted spectators and employers to their downtown with their sports strategy. This strategy combated traditional viewpoints, The factors that attract businesses 26
39 and people to suburban locations are more powerful than the roar of the crowds or the crack of a bat at nostalgic facilities, despite all their architectural splendor (Noll and Zimbalist 1997, 206). Robert Baade and Allen Sanderson (1997) acknowledge that stadiums built as part of a large commercial and residential development tend to fare better at increasing economic development than suburban stadiums tailored to automobile efficiency. Opposition to Stadiums as Economic Development Tools Opponents of stadium development as a tool for economic development express a variety of concerns. The first is that the evaluation of the site compares the stadium development to the alternative of leaving the area undeveloped. Other economic development documents calculate that spending at the stadium and adjacent new developments are new expenditures and not creating a substitution effect from other entertainment and retail districts of the city (Noll and Zimbalist 1997). Expectations for income also change depending on whether the team has recently located to the city or is just in a new stadium. If a stadium moves to a new municipality, income is increased since the ticket and concessions sales are new. However, a new stadium in the same city might only create an incremental increase in these sales (Delaney and Eckstein 2003a). Indirect tax revenues, or spending from tourism, that is accounted for in economic development plans are also frequently overstated. Noll (1997) summarizes this with numerous examples. For instance, a family could visit Boston and take in numerous historical attractions, museums, and also go to a baseball game. Depending on the parameters of the economic development plan their entire vacation could be attributed to the Red Sox. This overstatement is also seen in multiplier effects or businesses near the stadium making money and spending it in the community. Noll argues, the 27
40 local economic effect of a sports facility is between nonexistent and extremely modest (Noll and Zimbalist 1997, 15). Furthermore, some plans account for ever-increasing attendance figures driving a consistent increase in tax revenue. This has been proven false: stadiums usually see increased attendance the first few years of a new stadium, but attendance figures are more likely increased if the team is successful (Noll and Zimbalist 1997). More so, attendance is increased when the outcome of the game is more uncertain and the teams are well matched with one another. Victor Matheson analyzed European soccer matches in the Handbook of Sports Economic Research (2006) and found that games with the league title on the line can attract an additional 13,000 spectators versus a game that did not decide the champion. Another study summarized that fans come to games where they expect that the home team will win in a high-scoring but not too lopsided game (Fizel 2006, 121). These studies find that competition within the stadium increases ticket sales more than having a new stadium. The financial plans cannot account for businesses that may not come to the area because of the stadium. This is the opposite of what supporters of stadiums as an economic development catalyst hope for since it decreases economic development opportunity. In Phoenix, some employers were concerned about being too close to the stadium and having to compete for parking and deal with traffic (Delaney and Eckstein 2003a). There are additional critiques of stadium development that focus on the financial goals of the teams, since they don t necessarily share the same interests of their host municipality. In recent years, beginning with Camden Yards for the Baltimore Orioles, stadiums have gone to further lengths to keep spending inside the stadium with interior themed streets providing entertainment before and after the game. Gates open earlier so fans can enjoy the ambiance of the stadium but end up spending more money within the 28
41 stadium on things like concessions than in the neighborhood (Delaney and Eckstein 2003a). Spending inside the stadium is further critiqued: Stadiums tend to favor national brands so concession and souvenir money goes to large corporations like Coca Cola instead of local suppliers (Delaney and Eckstein 2003a). Many people are against subsidizing new stadiums because of the increasing profit of team owners and salaries of professional athletes. Before the stadium boom, the majority of revenue came from ticket sales so new stadiums were primarily built to accommodate more seating. Now, teams are finding new ways to increase income including naming rights of the stadium, pouring rights (exclusive beer and soda sales), broadcasting rights, concessions, food retail inside the stadiums, and luxury seating (Noll and Zimbalist 1997). For instance, Fleet Bank bought the naming rights to Boston s new NBA and NHL arena for 15 years in 1995 for 30 million dollars ($44.5 million in 2011 dollars) and called it The Fleet Center (Noll and Zimbalist 1997). It is now called TD Banknorth Garden, since Fleet Bank no longer exists. Other Benefits Because of the differences in research outcomes and the need to evaluate urban and suburban stadiums differently, supporters of stadiums as economic development tools have begun to use less tangible benefits in their arguments. Kevin Delaney and Rick Eckstein (2003) argue that these less tangible benefits are brought up because they are harder to argue against and cannot be combated with academic research. Supporters cite an increase in community self-esteem and community collective conscience as being a positive benefit for the city but they cannot be as easily quantified as monetary gains (Delaney and Eckstein 2003a, 4). However, Kuper and Szymanski (2009) argue that happiness is a relatively new measurement and that politicians 29
42 (people promoting stadium development) have realized that a happy community is just as, or more important, than a rich community. More specifically, these benefits are seen two ways; first by changing the way people think about their own city and second by changing the way others outside the community perceive that city (Delaney and Eckstein 2003a). Community consciousness arguments can be seen in campaigns like Cincinnati s, Keep Cincinnati a Major League City (Delaney and Eckstein 2003a, 54). A professional sports team brings publicity and an appeal to a city as well as bringing citizens closer together in solidarity. Lastly, Delaney and Eckstein (2003a) point out that professional sports teams are what corporations and CEOs (unaffiliated with professional sports) want to see. To business leaders it s a matter of recruiting and being able to showcase what their city has to offer (Delaney and Eckstein 2003a). Contemporary stadium development requires teamwork from municipalities, franchises, league organizations, and private developers. There is no standard formula for development and each project takes its own shape. In the end, cities can call themselves home to a favorite sports team but few have summarized the benefits, especially for Major League Soccer stadiums. Santo (2005, 190) summarized his study: a facility s ability to impact its local economy is tied to its context. He argues that urban and suburban stadiums have different economic development capabilities. An MLS stadium in Somerville is an urban but unique context that requires further research. 30
43 ENVIRONMENTAL HEALTH Noise Half of Major League Soccer (MLS) teams have their own open-air stadium. The noise created inside such a stadium is not contained and is likely a cause for concern for residents surrounding the stadium. Most research focuses on traffic and urban noise and does not focus specifically on noise from a stadium (Stansfeld et al. 2005; Vernez Moudon 2009; Chepesiuk 2005; Pandya 2003). However, many stadiums are part of an urban environment and can exacerbate environmental noise. Regulation of environmental noise, including regulation on occupational and community exposures, has waxed and waned over the last 60 years. In the 1970 s, due to industrialization and the advancement of transportation, there were several pieces of legislation enacted, including the 1978 Quiet Communities Act (Vernez Moudon 2009). In 1974, the U.S. Environmental Protection Agency (EPA) set guidelines for outdoor noise levels: a 70 decibel maximum in outdoor areas to avoid hearing loss and 55 decibels for acceptable sound levels to prevent annoyance or activity interference. However, in 1982 when the federal government started shifting more control to state and local governments, the noise control division of the EPA was defunded. In an odd twist, Congress never rescinded the noise control legislation with the above standards and the same regulations stand today but go unenforced (Vernez Moudon 2009). Despite regulation on noise, urban environments have gotten increasingly louder (Vernez Moudon 2009). Ron Chepesiuk (2005) and Anne Vernez Moudon (2009) compiled lists of physical and psychosocial impairments. Loud and/or constant noise can damage the inner ear and result in permanent hearing loss, elevated blood pressure, increased heart rate, cardiovascular constriction, loss of sleep, labored breathing, and changes in brain chemistry. 31
44 Psychosocial changes could include increased aggression, annoyance, and reduced performance quality. Even non-consistent noise or bursts of noise can impair task performance (Abarghani et al. 2009). However, different noise levels and consistency can have varying effects on retention tests (Abarghani et al. 2009). Research also shows that noise exposure in children can lead to decreased cognitive performance including reading, attention, and memory (Vernez Moudon 2009; Chepesiuk 2005; Wells, Evans, and Yang 2010). In the last 15 years, researchers have increasingly linked transportation noise to cardiovascular health (Walker 2012). Although regulation in the United States does not have an enforcing body, it hasn t stopped other organizations from combating noise. In 2000, the World Health Organization (WHO) released guidelines for occupational and community noise levels (Vernez Moudon 2009). In turn, the European Union released their own regulations including a requirement that cities with a population over 250,000 monitor noise levels (Vernez Moudon 2009). This resulted in noise surveillance programs. Nationally, New York City and San Francisco have municipal noise ordinances. San Francisco leads the U.S. in documenting land uses that contribute to noise exposure (Vernez Moudon 2009). Meteorological factors like rain, temperature, and wind can also affect the intensity of noise by as much as 10 decibels (Walker 2012). Specific to soccer stadiums, a recent noise study was completed at Ali Sami Yen Stadium, home to the first division team Galatasaray in Istanbul, Turkey (Akdag and Dal 2011). The stadium is capable of holding 26,000 fans and is located in a bustling commercial and residential district. Researchers used noise mapping and surveys of local residents to assess conditions on game and non-game days. Their research showed that according to Turkey s noise limit regulation, known as the Assessment and Management of Environmental Noise (AMEN), residents were exposed to high levels of urban noise. Every day 7,700 of the 32
45 32,000 residents (24%) are exposed to unacceptable levels of urban noise but on game day that number increases to 11,750 residents (37%). A recent study explored the impact of soccer noise on spatial retention in rats (Abarghani et al. 2009). Groups of rats were trained on a maze while being exposed to a recording of a stadium during a soccer game. The groups were split into varying noise levels: high, medium, and low intensity sound. The groups that were exposed to the same level of noise during training and the final test finished in similar time. However, when exposed to different decibel levels (higher and lower) during the final task, performance declined. Both studies do not discern the types of noise coming out of the stadium. However, the exhibition games leading up to and during the 2010 World Cup in South Africa put the local instrument, the vuvuzela, into mass production. Known for its very loud and distinct vibrating sound, the vuvuzela can be heard for miles around a stadium (Hall and Swanepoel 2010). The noise values produced by vuvuzelas exceed international limits for occupational settings. Two separate studies evaluated spectators hearing and the noise levels from a vuvuzela (HalI and Swanepoel 2010; Hall, Koekemoer, and Swanepoel 2010). They concluded that the intense sounds from a vuvuzela over the duration of a soccer game can put users and spectators at a significant risk of noise-induced hearing loss (Hall, Koekemoer, and Swanepoel 2010, 100). Quite differently, Chase and Healey (1995) compared neighborhood nuisance ratings of noise levels for soccer games and rock concerts at the same stadium. Regarding noise exclusively, soccer games had small spatially confined areas of residents reporting the nuisance, which dissipated with distance. Rock concerts have more variability in noise complaints. Many new stadiums are multi-use in order to increase viability and justify development with more events per year. There is no question about the detriments of constant exposure to sound. The lack of enforced regulation in the United States has allowed transportation, 33
46 machinery, and a variety of land uses to expose neighbors and communities to secondhand noise (Chepesiuk 2005, 36). Researchers have suggested the use of Health Impact Assessments (HIA) to gauge the impacts of specific projects (Vernez Moudon 2009; Wells, Evans, and Yang 2010). HIAs provide information to policy makers with research-based evidence that can inform the debate about a specific policy or development (Wells, Evans, and Yang 2010). Wells et al. summarizes the use of HIAs as a promising mechanism for incorporating health issues into the planning process (2010, 135). Some stadium developers have listened to the neighborhood concerns about noise and included features like land berms into the stadium designs (Bay Area Economics 2006). Geographical features like large expanses of trees and grass can have a great effect on noise and can help absorb sound (Walker 2012). Even though noise and its affects are frequently considered in stadium design, without an enclosed (domed) structure, stadiums will share noise with the surrounding community. Traffic & Parking Traffic and parking are frequently the primary issues with local residents, especially in a built environment that is heavily reliant on car travel with already limited parking space. Even with public transportation nearby, a stadium cannot expect that every spectator will use public transportation. In rural England, Sheffield Wednesday Football Club s stadium seats 30,000 people and city officials expect 90% of those people to travel to the stadium by car (Naldrett 1995). Older stadiums struggle with the influx of cars and short term parking demand, which can force attendees onto neighborhood streets, even blocking driveways. New stadiums, sometimes in rural locations, have either seas of asphalt or parking garages that bring no value to the neighborhood except storing cars on game days (Naldrett 1995). Carson, California widened 34
47 intersections after the stadium events began and traffic delays were found. The first four games were described by the city traffic engineer as a traffic disaster (Bay Area Economics 2006, 13). Sheffield Stadium reports a manageable build up to the game since spectators often come to enjoy the neighborhood and pre-match festivities. However, traffic peaks 45 minutes after the game when people are in a rush to go home but are only going 100 meters (109 yards) every three minutes (Naldrett 1995, 12). Newer stadiums like the Red Bull Stadium in Harrison, NJ acknowledge the importance of transit access as well as bike and pedestrian accessibility (Bay Area Economics 2006). Overall, the current approach of quantifying increased cars per day and analyzing traffic patterns around stadiums after events does not fully describe the effects of increased stress and pollution on neighborhood residents. Alcohol Abuse Another nuisance often not mentioned directly is alcohol consumption inside the stadium resulting in intoxicated patrons exiting the event. Vingilis et al (1992) focused on motor vehicle accidents in Toronto after alcohol sales were permitted at the Canadian National Exhibition (CNE) baseball stadium. They found the results mixed, with no direct relationship between the sale of alcoholic beverages and increased motor vehicle accidents. CNE stadium has access to reliable public transportation but researchers did not focus on an increase in incident reports from the transit authority after the inclusion of alcohol sales. Erickson et al (2011) conducted a study asking fans leaving professional football and baseball games to allow their blood alcohol content (BAC) to be taken followed by a brief survey. Of the 362 in their sample, 60% had a BAC of zero. Of the remaining 40%, people who had reported tailgating had higher odds of having a mid-range or high BAC. People under the age of 35 had twice 35
48 the odds of having a mid-range BAC and over nine times the odds of having a high BAC than a zero BAC. Additionally, games on Fridays and Mondays had fans with higher BACs. Eight percent of the sample had BACs over the legal limit for driving. If their sample is representative, approximately 5,000 attendees of NFL games would leave with blood alcohol content above the legal limit. Using the same percentages for a 25,000 seat stadium, 2,000 people are leaving the stadium with BACs over the legal limit for driving. Lighting Regarding new development, it is assumed that new stadiums will have lighting for evening and night games. Wrigley Field, home to the Chicago Cubs, is one of the oldest major league ballparks and has a modest seating capacity. After a long permitting process, Wrigley Field was allowed to add lighting and began night games in The Lakeview/Wrigleyville neighborhood saw an increase in traffic (possibly due to the game time coinciding with commute times) and further instituted parking restrictions to combat the influx. During public hearings regarding lighting Wrigley Field, a survey revealed that only 22% of residents (those living within a half-mile of Wrigley Field) would accept lighting at the stadium. The remaining 78% would rather have the Cubs relocate. With the increase of nighttime baseball, the neighborhood has changed into more of an entertainment district than a neighborhood. Besides the addition of lighting at Wrigley field, current literature does not highlight lighting itself as a benefit or nuisance to the surrounding neighborhood (Spirou and Bennett 2002). Dartford Soccer Stadium in England was concerned about their neighbors perception of their new stadium in Instead of only building up from the ground level, they lowered the field level inside the stadium leading to a lower elevation of field lighting to lessen the impact of light pollution in the neighborhood (Craik 2008). 36
49 In summary, stadiums can contribute to environmental health outcomes and the economic development potential in a neighborhood, but the results are mixed. Stadiums may serve as an anchor tenant in a redevelopment project, contribute to noise in a neighborhood, and increase less tangible benefits like community self esteem. 37
50
51 Chapter 4 METHODOLOGY The current literature on American 25,000 seat soccer stadium developments including their impacts is lacking due to the short duration in which these stadiums have existed. Stadium developments like these are similar to lower division soccer leagues in Europe but infrastructure and cultural differences make comparisons difficult. The potential impacts of a soccer-specific stadium development in the Inner Belt and Brickbottom neighborhood have been determined by collecting and reviewing planning and economic development, interviews with local officials and stakeholders, and GIS analysis. Economic development and planning documents have been collected for teams in the United States that have a MLS tenant soccer specific stadium and access to public transportation. Table 4 highlights stadiums that fit these requirements. Of the twenty MLS teams, three are from Canada and are excluded due to differences in the planning process. Of the fifteen teams in the United States, eight teams have their own stadium (two are in planning/construction) and 39
52 40
53 access to public transportation. Information from the following municipalities have been selected for review because they fit both requirements: Bridgeview, Illinois - Chicago Fire Houston, Texas - Houston Dynamo Carson, California - LA Galaxy and Chivas USA Harrison, New Jersey New York Red Bulls Chester, Pennsylvania - Philadelphia Union Portland, Oregon - Portland Timbers Sandy, Utah - Real Salt Lake San Jose, California - San Jose Earthquakes There were 11 planning, economic development, and state mandated documents collected and 1 interview with a planning consultant in lieu of documents (see Table 5). Economic development and planning documents for Chester, Pennsylvania and Houston, Texas were not obtained. Each document(s) collected has been reviewed for information regarding job creation, taxes, traffic (automobile, pedestrian, public transit, and parking), noise, pollution, and crowding. In addition to the review of planning documents, interviews with the parties involved in the relocation to Somerville are equally important. The goal, after receiving institutional review board approval, was to interview Mark Abbott, President of Major League Soccer; Brian Bilello, President of the New England Revolution, and Brad Rawson, Senior Planner Economic Development for the City of Somerville. However, only the interview with Brad Rawson was conducted on February 19, Mark Abbott was not reached and Brian Bilello declined an interview since this is an active project for the New England Revolution. Rawson s knowledge of the development and economic goals of the City of Somerville provide a perspective not available in the literature. Interview questions are provided in Appendix A. 41
54 42
55 The last part of the qualitative process has been used to draw similarities of the other stadium locations and Somerville. As Santo (2005, 190) states, a facility s ability to impact its local economy is tied to its context. There is not a prescribed process or attributes that deem successful stadium development but similar characteristics could predict related strengths and challenges. The stadium location and transit access have been mapped using ArcGIS and available plug-ins; they are available in Appendix B. 43
56
57 Chapter 5 RESULTS To uncover potential impacts of stadium development in Somerville it is important to look at the potential impacts from other urban soccer stadiums. By reviewing 11 documents and conducting two interviews there are similarities that can be drawn to Somerville and between these sites. Although there was no standardization of reporting or results, each document provided some information regarding potential economic gain, traffic congestion, or health impacts (see figure 6). Overview of Documents and Interviews Of the 11 documents reviewed and two interviews conducted there was a variety of justifications for stadium development. Municipalities were looking for economic opportunity, rebranding potential, and redevelopment opportunities. Documentation ranged from one environmental report for a stadium complex that was built in 2003 to four documents for a stadium in San Jose that will begin construction this year. More specifically, Harrison, New Jersey and Sandy, Utah both used district redevelopment documents to plan for their stadium. Portland, Oregon, majorly 45
58 Table 6 - Results Comparison Increased Spending Increased Tax Revenue Community Self Esteem Employment Noise City Title Bridgeview, IL Interview Carson, CA Harrison, NJ Portland, OR Sandy, UT San Jose, CA EIR - National Training Center Harrison Waterfront Redevelopment Plan MLS-AAA Citizens' Task Force Consultant Report Economic Impact of Proposed Portland MLS and AAA Stadiums Traffic & Parking Alcohol Abuse Lighting Civic Center District Plan 90th South Gateway Plan EIR - West side of Coleman Avenue between Newell Street Brokaw Road Neighborhood Economic Impacts of the Proposed San Jose Stadium Fiscal and Economic Impact Analysis of MLS Stadium Proposal Market Assessment and Economic Impact Analysis for Proposed Soccer Stadium in San Jose Economic Development Environmental Health Somerville, MA Inner Belt Scoping Study 46
59 renovated an existing stadium to suit MLS field and seating requirements, and San Jose focused on economic impacts. Their reports included market assessments and potential economic outcomes for the municipality and metropolitan statistical area (MSA). It should be noted that the two economic development reports for the Portland stadium included numbers based on the scenario that the existing stadium would be renovated for an MLS team and a new stadium would be built for their AAA baseball team. In actuality, the stadium was renovated but the baseball team moved to California when a stadium agreement was not reached with the City of Portland (Manning 2012). Carson and San Jose, California both included environmental impact reports (EIRs). Carson did not have any additional planning documents for the Home Depot Center because the stadium is built on the campus of California State University Dominguez Hills. The EIR for San Jose s stadium was completed in 2003; it was executed on the basis that the 93-acre district was being rezoned from a heavy industrial use to 3 million square feet of office and research and development use. Hotel, retail, and commercial uses are specified in the EIR but a soccer stadium is not mentioned specifically. Lastly, there were no planning documents for the stadium in Bridgeview, Illinois. In lieu of planning documents, Mike Thiessen of Madison Group Ltd, was interviewed. He is a consultant to the City of Bridgeview. There are two stadiums with access to transit that are not covered thoroughly in this analysis. Houston, Texas (Figure 7 in Appendix B) did not have any available documents except for an Economic Development Agreement and Stadium Lease between the team and the City of Houston (City of Houston 2010). The stadium is near the home of the Houston Astros (MLB) and Houston Rockets (NBA) in a stadium district. The MLB and NBA stadiums were funded by a voter approved hotel and rental car tax (Harris County Sports Authority 2012). The Dynamo stadium is being built with private funds on land owned by the City of Houston as part of the original MLB and NBA deals. The Houston 47
60 Dynamo will lease the stadium from Houston for $65,000 a year (City of Houston 2010). The City of Chester (Figure 8 in Appendix B) used their stadium to redevelop and revitalize a brownfield site in their waterfront district. They projected that the stadium would bring new jobs and recreation possibilities for residents of Chester (City of Chester 2012). The stadium was funded with $102 million from the State of Pennsylvania and gambling tax revenues, along with a $7 million low interest loan from the state and $80 million from private investors. The federal and state governments and the Delaware River Port Authority helped with infrastructure costs (HVS Consulting and Valuation Services 2009). Of all the documents reviewed, all stadiums except two have opened. The Houston Dynamo will begin their 2012 season at their new stadium. The San Jose stadium will most likely start construction this year and open for the 2013 season. A previous December development permit approval was appealed by residents asking for further review of the lighting and noise associated with the stadium. They also wanted a ban on noisemakers like vuvuzelas and fireworks. Their appeal was denied and the planned development permit was upheld on February 22, 2012 (Earthquakes Media Relations 2012; Seipel 2012). Stadium Development More than making the stadium an anchor of a mixed used development, another trend is to make stadiums part of an entertainment district. The goal of these developments is to make the whole district a destination for visitors. This is seen in the Sandy, Utah Civic Area planning document: The plan, in general, provides a vision for the Area that enhances the existing retail, entertainment, hospitality, sports, office, and residential components as a basis to create a true integrated mixed-use designation attracting significantly more people with substantially increased economic activity (Sandy City Community Development Department 2012, 7). Their plan includes branding 48
61 specific to the district and to create the perception of a higher value of the Area for residents and visitors and differentiate the area from other projects of destinations (Sandy City Community Development Department 2012, 15). The average MLS stadium hosts 50 events per year of varying sizes (Sports Economics 2008). San Jose acknowledges the importance of events throughout the year to attract residents and visitors year round (Sports Economics 2008). All of the stadiums except Portland are part of larger development plans. Harrison aimed to make a regional destination in their waterfront redevelopment plan and San Jose would like to make an extension of their downtown (City of Harrison 2003; Bay Area Economics 2006). The Inner Belt Scoping Study (2008) identified the importance that the neighborhood should identify a program that would create a unique identity; a stadium was one possible concept. Similar to Houston s stadium district, the Home Depot Center is part of an athletics development that includes practice facilities for the US National Soccer Team, a velodrome, track, and facilities for CSUDH athletics (The California State University 2001). Although, the majority of MLS stadium planning aims to make stadiums part of mixed use developments, the recent economic downturn has made additional development difficult to achieve. Firehouse Falls, a hotel development with an indoor water park, was proposed for complementary development for Toyota Park. The project was abandoned due to economic reasons and the City of Bridgeview is still looking for a complementary development (Thiessen 2012). In Harrison, redevelopment has been slower than expected even though there is progress on several projects (Mokha 2011). Municipalities have had to readjust their timelines for development. Economic Development and Employment Even if not an economic development report specifically, the majority of documents mentioned at least employment opportunities and spending in the 49
62 local economy. Some of the economic development documents quantified the outcomes of the stadium developments while others implied the opportunity. The economic development reports also summarized benefits outside of the stadium. Both economic development and planning reports cited the need for new jobs. New stadium developments are often expected to be employment generators (Curry, Schwirian, and Woldoff 2004). Of the reports that do none cite specific numbers, The Home Depot Center (Figure 9 in Appendix B) EIR reviews employment growth with an environmental perspective. It cites marginalized job growth at a scale that would not affect the regional population (The California State University 2001). The Sandy, Utah Master Plan (Figure 10 in Appendix B) and Harrison Plan (Figure 11 in Appendix B) focus on creating a wide range of employment opportunities and an equitable distribution of jobs (Sandy City Community Development Department 2003; City of Harrison 2003). More vaguely, the Inner Belt Scoping Study (2008) sees the district as a place for economic opportunity. Some hiring was not quantified by other reports. For instance neighborhood restaurant owners in Carson, California, reported that their revenues rise by as much as 30-40% on game days, which could increase the demand for staff (Bay Area Economics 2006). The City of Bridgeview (Figure 14 in Appendix B) did not quantify jobs generated by the stadium. Thiessen believes that the majority of people that work at the stadium live within 5 miles and use the stadium jobs as supplemental income (Thiessen 2012). San Jose views any increase in employment as a way to balance the housing to jobs ratio and make San Jose less of a bedroom community (City of San Jose 2003). Two reports published employment numbers for construction of the stadium. The MLS and AAA baseball scenario would generate 1,200 full time construction jobs (Economic Research Associates 2008). In San Jose (Figure 12 50
63 in Appendix B), construction activity is expected to generate 14,542 jobs (part and full time) and $879 million in wages (Economic & Planning Systems, Inc. 2008). Employment created by the stadium operation is much lower than the temporary construction jobs created. The Portland (Figure 13 in Appendix B) stadium is expected to generate 205 full time equivalent (FTE) jobs and 51 jobs outside of the stadium (Economic Research Associates 2008). The San Jose stadium is expected to create a combined 1,480-1,860 jobs both in the stadium and outside of the stadium (Sports Economics 2008). Of the reports reviewed there is a range of 256-1,860 stadium and ancillary service jobs created and 1,200-14,542 construction jobs created. However, the metrics used are barely comparable. The reports don t always report in full time equivalent numbers as well as separate stadium employment from an increase in neighborhood employment. The other economic development impacts are generally summarized as spending benefits. These spending benefits are often based on different aggregates like spending within the city, county, or MSA. The average San Jose spectator is expected to spend more outside of the stadium than inside it. It is estimated that fans will spend $77 per day outside of the stadium and $51 inside. This adds up to $24 million dollars of spending outside of the stadium (Sports Economics 2008). Sports Economics (2008) expects the San Jose stadium to contribute $49.6 to $62.3 million dollars in direct and indirect spending to the City. Likewise, the Portland stadium is expected to bring in $1.9 million of spending outside of the stadium within Multnomah County (Economic Research Associates 2008). Instead of analyzing spending on a per fan basis, Sports Economics (2008) researched other professional sports teams and found that slightly more than 20% of the budgeted annual expenditure of a team will be spent in its 51
64 city. Since the Earthquakes annual budgeted expenditures are $15 million, a projected $3 million would be spent in San Jose. Another aspect of local economic development related to stadiums focuses on municipal benefits like an increase in tax revenues. Building on the site turns it into a productive site in terms on tax dollars rather than an unproductive site, one with few buildings or a use with a low property tax rate (Thiessen 2012). Many times the redevelopment includes an entire mixed-use district in which the stadium serves as the anchor tenant. Harrison, New Jersey, Bridgeview, Illinois, and San Jose, California all had industrial uses prior to their stadium development (City of Harrison 2003; City of San Jose 2003; Thiessen 2012). The Harrison Waterfront District has an industrial heritage that left them with 20 properties with environmental contaminants. The waterfront plan states several benefits of redevelopment including a strengthened and diversified tax base, expanded retail and housing options, and an increased value in the housing stock (City of Harrison 2003). This all leads to increased tax revenues for the city. The Sandy Master Plan acknowledged that the private market was not able to get the full value out of their property when redevelopment was needed. They wanted to stabilize declining neighborhoods and commercial property values (Sandy City Community Development Department 2003). The stadium site was undeveloped and the canals that bordered the site were suffering from maintenance problems, illegal dumping, and burglaries in the vicinity (Sandy City Community Development Department 2003). In addition, the San Jose EIR (2003) explains that the objective of the project is to prepare the site for uses consistent with the San Jose General Plan. The site, in its current condition, is underutilized and mostly vacant. An infill development is encouraged in the General Plan because an increase in property value would increase property tax revenue (City of San Jose 2003). 52
65 The only documents that quantified tax benefits were for San Jose (Economic and Planning Systems 2008 and Sports Economics 2008). The proposed 2.25 million square feet of mixed-use development is estimated to generate $1,722,145 of sales tax revenue (Economic & Planning Systems 2008). This will help fulfill one of their goals outlined in their EIR (2003): a stronger tax base. None of the documents quantified the increased income in property taxes. This is possibly due to stadium financing agreements that sometimes forgive tax payments. ENVIRONMENTAL HEALTH A stadium development brings an influx of fans, traffic, and noise into a neighborhood. The EIRs required for the San Jose and Carson stadiums were the only documents that summarized emissions and impacts during and post construction (The California State University 2001; City of San Jose 2003). Other planning and economic development documents did touch on at least one factor contributing to environmental health aspects of a stadium development although in a qualitative way. Traffic One of the downsides of regional attractions, like a stadium, is traffic (Rawson 2012). Most documents at least mentioned increased traffic due to the stadium. However, each municipality studied traffic differently and used non-compatible quantification methods such as cars per day, vehicle trips, and increased trips. Some municipalities only knew their baseline traffic numbers. Harlem Avenue, the main thoroughfare in Bridgeview, Illinois hosts 60,000 vehicles per day (Thiessen 2012). In Sandy, Utah, Interstate 15, the nearest interstate to the stadium, carried 171,726 cars per day in State Street, which borders the stadium, carried 32,390 vehicles per day in 2001 (Sandy City Community 53
66 Development Department 2003). In Sandy, existing traffic and congestion was reported to be hindering business and in Bridgeview the stadium development was meant to support existing businesses on Harlem Avenue (Sandy City Community Development Department 2003; Thiessen 2012). Sandy identified congestion as a major problem for businesses in the master planning area (Sandy City Community Development Department 2003). A stadium development in Somerville tested for 20, 40 and 60% transit use estimates a 1,300-2,700 increase in vehicle trips (CBT et al. 2008). Emissions and mitigations strategies for traffic in the Bridgeview, Sandy, and Somerville reports were never identified. The EIR for the Home Depot Center and San Jose stadiums quantified the increased number of vehicles and their emissions. In Carson, there was an expected increase of 698 vehicles on non-event weekdays and up to 6,646 vehicles on weekend sold-out event days. The additional traffic would contribute to an increase in eight-hour carbon dioxide concentrations that violate the California Ambient Air Quality Standards and an increase in carbon dioxide, volatile organic compounds, and nitrous oxide on event days that violate the thresholds for the South Coast Air Quality Management District. There were 19 mitigation measures suggested to ease traffic at four intersections and additional measures to safeguard the neighborhood like strategies to minimize cut-through traffic (The California State University 2001). The EIR for San Jose (2003) estimates an increase of 3,441-3,534 vehicle trips. The additional trips would impact three local intersections and create a need for increased capacity to 16 freeway segments. The increase in emissions was predicted to impact regional air quality, and the developed site would increase levels of volatile organic compounds, ozone, and particulate matter (PM10). Increases in these pollutants can lead to eye irritation, respiratory impairment, and aggravation of heart and lung disease symptoms (San Jose 2003). 54
67 Mitigation measures include a new public transit station and a carpooling program (Bay Area Economics 2006). Parking Traffic related to a stadium event also results in a parking problem during event times. Urban stadium sites have been trying to manage the problem without a sea of asphalt around the stadium. In Carson there is a need for an additional 4,166 parking spaces that could not be accommodated on the CSUDH campus. Measures were proposed to reduce significant impacts of parking in four neighborhoods near the stadium like resident permit parking. The EIR did note that there would be no carbon dioxide hot spots in the parking lots before or after the event (The California State University 2001). Other planning documents only mentioned parking. Sandy, Utah acknowledged that the Gateway District will still be auto oriented and that convenient and accessible parking is important. However, they want parking away from primary views in order to maintain a more positive community image (Sandy City Community Development Department 2003, 57). In Harrison, New Jersey, their formula allowed one parking spaces for every six seats, not to exceed 5,000 spaces (City of Harrison 2003). The San Jose mixeduse development project proposed adding 9,600 parking spots which would cover 62% of the site (City of San Jose 2003). Public Transportation All of the stadiums reviewed have access to public transportation. In addition, several communities used their stadium as part of a transit oriented development (TOD). Harrison wanted to capitalize on the existing commuter traffic that the train station provided. Since Harrison is only eight miles from downtown Manhattan and one mile from Newark, the waterfront redevelopment plan focused on making the area desirable for commuters 55
68 and attracting new residents (City of Harrison 2003). The proposed San Jose stadium and commercial development have access to a train and several bus lines. The Portland stadium has always utilized the existing network including buses and the light rail system (Economic Research Associates 2008). Sandy acknowledges that, An aggressive, comprehensive transportation system is vital to the long term vigor of Sandy City (Sandy City Community Development Department 2003, 21). In the Civic Area plan they acknowledge that the convergence of the interstate, light rail, and commuter rail can create an opportunity to reduce vehicle miles travelled. Sandy goes as far as to introduce the idea of a personal rapid transit network within the civic arena district. Personal rapid transit networks are a system of personal vehicles available at collector stations that can run directly to other collector stations instead of making additional stops like a traditional rail network (Sandy City Community Development Department 2012). The other aspects of transit-oriented development include accessibility for pedestrians and bicyclists. Portland was already a bicycle friendly city (Economic Research Associates 2008). The Harrison plan focuses on the pedestrian s circulation and experience at the street level (City of Harrison 2003). They also plan for bicycle racks along commercial roadways. The Sandy master plan acknowledges the need for increased pedestrian access like benches and shade trees and a street network within the civic area that is safe and efficient for pedestrians, cyclists, and transit users (Sandy City Community Development Department 2003; Sandy City Community Development Department 2012). In Sandy, instead of including bicyclists on roadways, they are including connections throughout the district to the local trail network that connects the district to the whole community (Sandy City Community Development Department 2003). The Inner Belt plan not only sees an increase in transit due to the green line extension but a link to open space at the station locations (CBT et al 2008). 56
69 For other cities, transit options have been increased since the stadium was built. For instance, Bridgeview has started running shuttles between the subway station and the stadium on game days (1.25 miles). They admit that transportation access to the stadium needs to improve in Bridgeview (Thiessen 2012). Urban stadium developments are increasingly considering current and proposed transit systems and incorporating the experience of the pedestrian, bicyclist, transit and automobile user into their designs. Noise Noise in and around soccer stadiums can be the result of construction of the stadium, an event, traffic or people entering and leaving the stadium. During construction, the EIR for the Home Depot Center (2001) recommended that heavy impact equipment within 200 feet of residential units should use a noise barrier. Post occupancy, there were several measures suggested to mitigate noise impacts. For instance, stadium events can only increase the noise level in adjacent neighborhoods by five decibels over the non-event day noise levels. This is attainable with acoustic panels and a land berm to absorb sound. In addition, tailgating and air horns are prohibited (The California State University 2001). Unfortunately, the EIR identified some impacts that were unavoidable and that could not be mitigated. They include traffic noise and aircraft flyovers. Events and set up and tear down times are limited and neighborhood impacts of traffic noise and pedestrian activity are suggested to be mitigated by proactive planning and management of parking. Management of noise also identifies the importance of a strong working relationship between the stadium and the surrounding neighborhoods (The California State University 2001). The San Jose development is adjacent to an airport. The reporting of noise in the EIR related to aircraft noise versus stadium noise. San Jose aims to avoid interior noise levels above 45 dba. To reduce noise impacts they recommend 57
70 that projects be reviewed by an acoustic consultant, maintain a minimum setback from existing noise sources, and use noise mitigating building materials like insulation. They further restrict outdoor uses in areas with an average over 60 dba (City of San Jose 2003). Lighting The only document addressing lighting is the EIR for the Home Depot Center. There was no mitigation available for the marquee signs. Since the signs are perpendicular to the freeway and use direction louvers to aim the light, this was regarded as an aesthetic impact instead of a health impact (The California State University 2001). Environment Only San Jose and Carson, California summarized environmental losses of development because of the state required environmental impact report. Carson residents lost the view of the vista on the CSUDH campus due to the stadium development (The California State University 2001). The San Jose development will cause the loss of mature trees but they developed a plan to keep the five largest oak trees and a ratio of replanting depending on the size of the trees lost. Lastly, the San Jose development identifies losses to the Burrowing Owl habitat (City of San Jose 2003). Both the San Jose and Harrison, New Jersey sites required remediation from hazardous materials, although little detail was provided in the planning documents (City of Harrison 2003; City of San Jose 2003). Other Benefits The majority of the documents reviewed mentioned the less tangible reasons for a stadium development that are described in the Literature Review (Delaney and Eckstein 2003a). Bridgeview and Harrison are redefining their cities from their industrial past. Bridgeview s Mayor Steve Landek has the vision to change 58
71 Bridgeview from a manufacturing and distribution hub into an urban village (Thiessen 2012). Harrison is a city that depended on industry for employment but wants to be capable of supporting and attracting the diverse uses important in the 21st century (City of Harrison 2003, 5). Even CSUDH saw the opportunity in hosting a soccer specific stadium. The soccer stadium fit into the campus plan and university mission to enhance the prestige and visibility of CSUDH (The California State University 2001, 1). San Jose was the only city to mention the benefits of the increased media exposure. MLS plays in seven of the 10 largest media markets and has the ability to reach 180 million households through an agreement with ESPN International. There are 10 million television viewers annually (Sports Economics 2008). The media coverage is considered free media for the municipality. San Jose is also the only city to mention the emotional benefits to residents. They say that these are greater than the financial benefits of hosting a team. The economic development report uses the terms psychic impact and public consumption benefits but notes that quantifying the increase was outside of the scope of their study (Sports Economics 2008, 5). COMPARISONS TO SOMERVILLE There are many similarities between the MLS host communities reviewed and Somerville. These commonalities can help Somerville navigate the stadium development process. There are similarities in goals for job creation, redevelopment of neighborhoods, and demographics. In my interview with Brad Rawson, Senior Planner Economic Development for the City of Somerville, he was able to share some of the City s goals for development in 59
72 the Inner Belt and Brickbottom neighborhoods that strengthens some of these similarities. Somerville is seeking a variety of sectors with a mix of employment opportunities for existing and new residents, but wants development to fit within the existing community. Somerville does acknowledge that the solution is not to create a heavy commercial district like Kendall Square in Cambridge. Kendall Square is lacking in neighborhood qualities including residential development and feels more like a business center (Rawson 2012). San Jose s plan of a mixed-use development was used to bring more employment to the city to make it less of a bedroom community to San Francisco and Oakland (City of San Jose 2003). A mix of residential and commercial development is what gives a neighborhood an active street life and makes residents feel safe in their neighborhood (Rawson 2012). Somerville wants to see more opportunities for employment of their residents in Somerville since 85% of its workforce population leaves the City each workday (The City of Somerville 2008). All of the stadiums except Portland have been developed as part of other developments. Because of the economic downturn some are still in the process of being developed. With the average MLS stadium hosting 50 events per year, this is a way to increase commercial activity around the site on non-event days (Sports Economics 2008). This further increases the commercial tax base and employment opportunities. New development is more difficult in an existing neighborhood. Somerville has the challenge of implementing a master plan while showing support for longtime resident businesses that have been a value to the community. In 60
73 addition, Somerville is anticipating the Green Line Extension and is expecting the Washington Street stop (that will service the Inner Belt and Brickbottom neighborhoods) to spur development before its 2016 opening date. The Green Line Extension will also serve as a catalyst to make the neighborhoods more accessible to pedestrians and cyclists; Somerville acknowledges that the Inner Belt and Brickbottom neighborhoods are not very accessible. That being said, development has to balance the vision of any neighborhood with the market realities (Rawson 2012). Rawson was able to talk about Somerville s interest in regional attractions but not specifically a soccer stadium. In fact, a soccer stadium would be a regional attraction and Somerville has interest in hosting these types of events. Regional attractions increase people s awareness of Somerville and can strengthen the Somerville brand. Soccer is a multicultural sport and connecting that to Somerville could be a special thing (Rawson 2012). Similarly, Bridgeview, Illinois and Harrison, New Jersey had manufacturing pasts similar to the Inner Belt and Brickbottom neighborhoods and used their stadiums as municipal rebranding tools. They developed a vision for a more modern city that is similar to the approach taken by Mayor Curtatone, who has been in the process of redefining Somerville since his first term started in This includes a three-year 61
74 community vision process released February 24th, 2012 entitled SomerVision, a Comprehensive Plan (City of Somerville 2012). Lastly, of the eight urban stadiums outlined for review, only three are major metropolitan areas, Houston, Portland, and San Jose. Houston and Portland both had previous structures for stadium development, an existing neighborhood and stadium respectively. The remaining five are dense urban edge cities to major metropolitan areas (see Table 6). The density of these cities makes them more likely to be walkable and bikeable like Somerville (Churchman 1999). These 11 documents and 2 interviews reveal that Somerville has many characteristics similar to other urban MLS host communities. Some cities share a manufacturing past, density of residents, or a need for economic development. However, Somerville is a unique community and no MLS host community will ever be exactly the same. 62
75 Chapter 6 COMPARISONS AND RECOMMENDATIONS FOR SOMERVILLE The New England Revolution have outlined requirements for stadium development and Somerville has outlined development requirements for the Inner Belt and Brickbottom neighborhood. The Revolution want an urban stadium site, access to public transportation, and a municipality that is willing to work with them on support of the stadium (NECN 2012). Dell Apa, of the Boston Globe, believes that they also want financial support from a municipality. The City of Somerville wants new development to fit in the current urban fabric of Somerville but also spur job creation. It is no surprise that the Revolution have looked at Somerville as a potential stadium site. MLS teams have gravitated towards developing stadiums in urban municipalities that are close to major metropolitan areas; Somerville is more densely populated than any other urban soccer stadium community that was studied. The Green Line extension, in particular the Washington Street station, will provide transit access to the neighborhood and any future development. Lastly, Mayor Curtatone has demonstrated that he has the ability to work with residents on important issues. This can be seen in the visioning work in neighborhoods around the City. 63
76 There are also implications in the media that the Revolution are looking for financial support that need to be considered. Somerville has acknowledged that transit access and infrastructure improvements are important for redevelopment (City of Somerville 2011e). Somerville can fairly support development of all types by investing in infrastructure improvements. These improvements could be similar to the public private partnership that Somerville has with the developers of Assembly Square (City of Somerville 2011d). Regarding the development of a soccer-specific stadium in Somerville, the City should consider commissioning reports that explore both economic development and environmental health concerns. A report focused on economic development issues would study the potential employment, indirect, and direct spending created by the stadium and ancillary developments. Of the four economic development reports reviewed it is clear that these are contextual to their site and development parameters. These reports are increasingly complex when the site is yards away from other municipalities with a variety of development types, stakeholders, and development time lines. Although an Environmental Impact Report will most likely be required for a redevelopment project in the Inner Belt and Brickbottom neighborhoods 5, the environmental health implications of a soccer stadium should be explored with a Health Impact Assessment. This would be similar in scope to the EIRs from San Jose and Carson and would include health outcomes and possible mitigation strategies to combat increased traffic, noise, and crowding. The two existing residential developments in the Inner Belt and Brickbottom neighborhoods are the most important to the study but the assessment should also include residents of East Somerville and residential development in Inner Belt and 5 The Massachusetts Environmental Policy Act requires EIR for projects requiring agency action. 301 CMR 11.00: MEPA Regulations mepa/regs/11-01.aspx (accessed April 16, 2012). 64
77 Brickbottom. East Somerville already shoulders the burden of infrastructure and emissions of regional transportation and that burden should not be increased. Somerville is already planning for the future of the Inner Belt and Brickbottom neighborhood and is including residents in a visioning process. An increase in development in the Inner Belt and Brickbottom neighborhoods would increase property tax income but Somerville has to balance existing businesses and residents with the context of a changing neighborhood. An economic development study and health impact assessment will help guide Somerville through the potential redevelopment process. 65
78
79 Chapter 7 CONCLUSION For this thesis, I reviewed the potential economic development and environmental health impacts of a soccer specific stadium development. I provided a brief history of stadiums in the Boston metro area, the history of Somerville, and Major League Soccer and the New England Revolution in the Background Chapter. Then I grounded my research in the current literature on stadium planning, development, and the environmental health impacts of stadiums. Finally, I reviewed 11 documents from other urban MLS stadiums and made recommendations to Somerville. There were some limitations to my methodology. I was not able to access documents for Houston, Texas or Chester, Pennsylvania. Documents may have been accessible if requested using the Freedom of Information Act. Planned interviews with MLS and the New England Revolution were not possible. Throughout the review process, each of the documents shared some similarities with Somerville whether it was a common manufacturing past or a need for an increased tax base. In the least, Somerville can use the compilation of documents for an internal review. However, I hope they are able to use my 67
80 research and suggestions for an economic development study and health impact assessment to further inform a potential stadium development in the Inner Belt and Brickbottom neighborhood. 68
81 APPENDIX A Interview Questions for Brad Rawson the Senior Planner for Economic Development in the Mayor s Office of Strategic Planning & Community Development for the City of Somerville. 1. How does the City of Somerville define successful development? 2. What is the role that the city plays in development of the Inner Belt/ Brickbottom neighborhood? 3. What are some challenges Somerville is facing with redevelopment of underutilized site? 4. What are Somerville s goals in redeveloping the Inner Belt/Brickbottom neighborhood? 5. Who are the stakeholders at the City of Somerville that make development decisions? 6. Is Somerville reaching out to other communities for examples of successful development? 7. What is the timeline for development of the Inner Belt/brickbottom neighborhood? 8. What is the position of the City of Somerville on a 25,000 seat stadium in the Inner Belt/Brickbottom neighborhood? 69
82

83 APPENDIX B 71
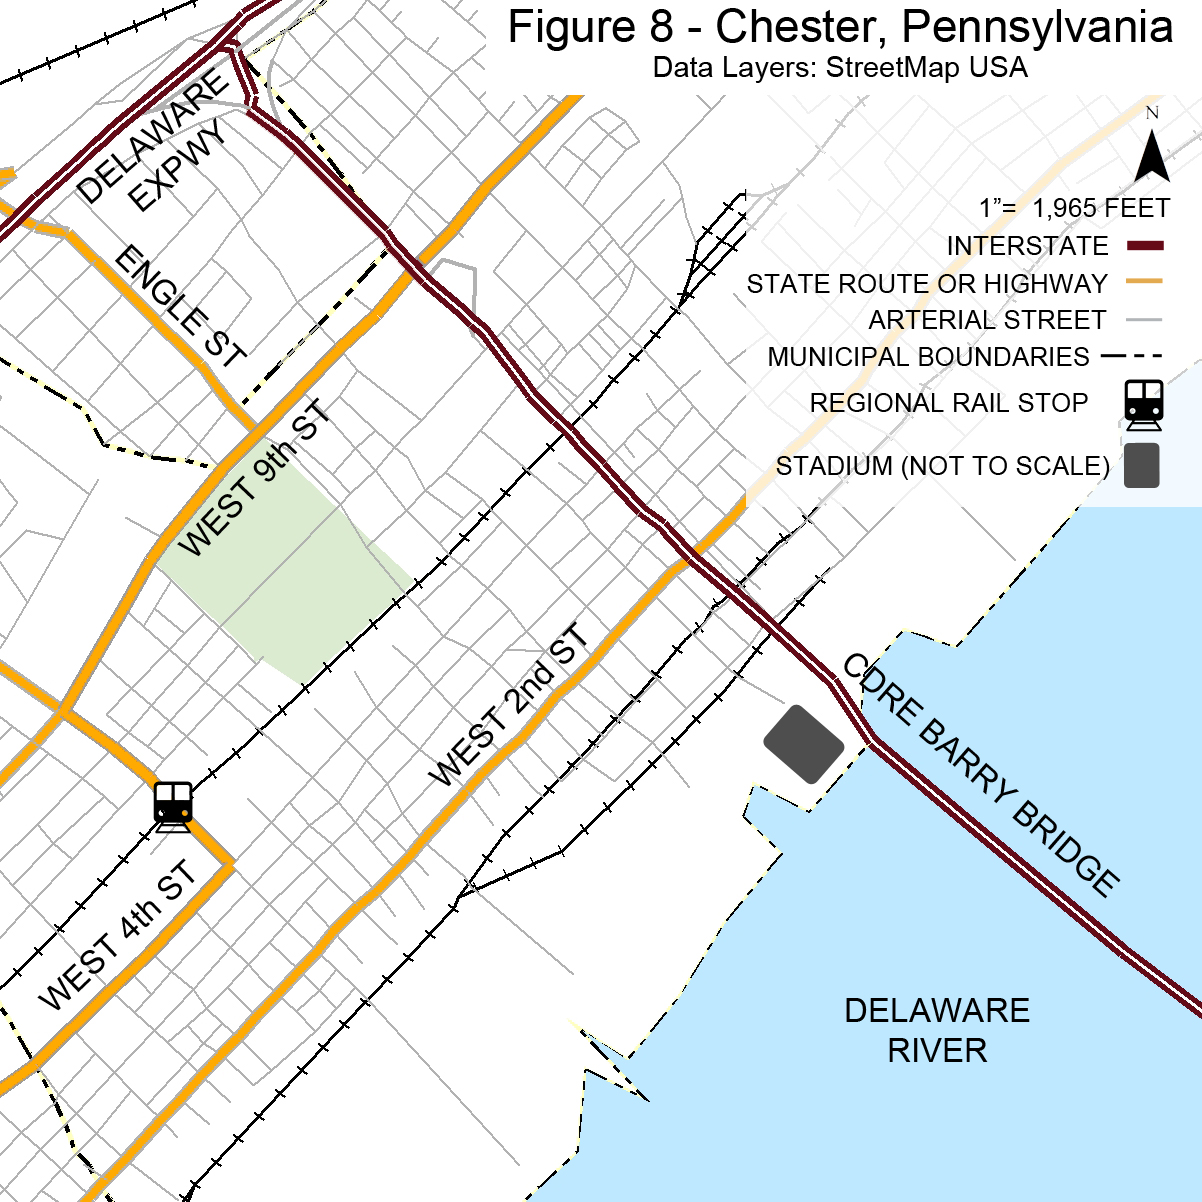
84 72

85 73
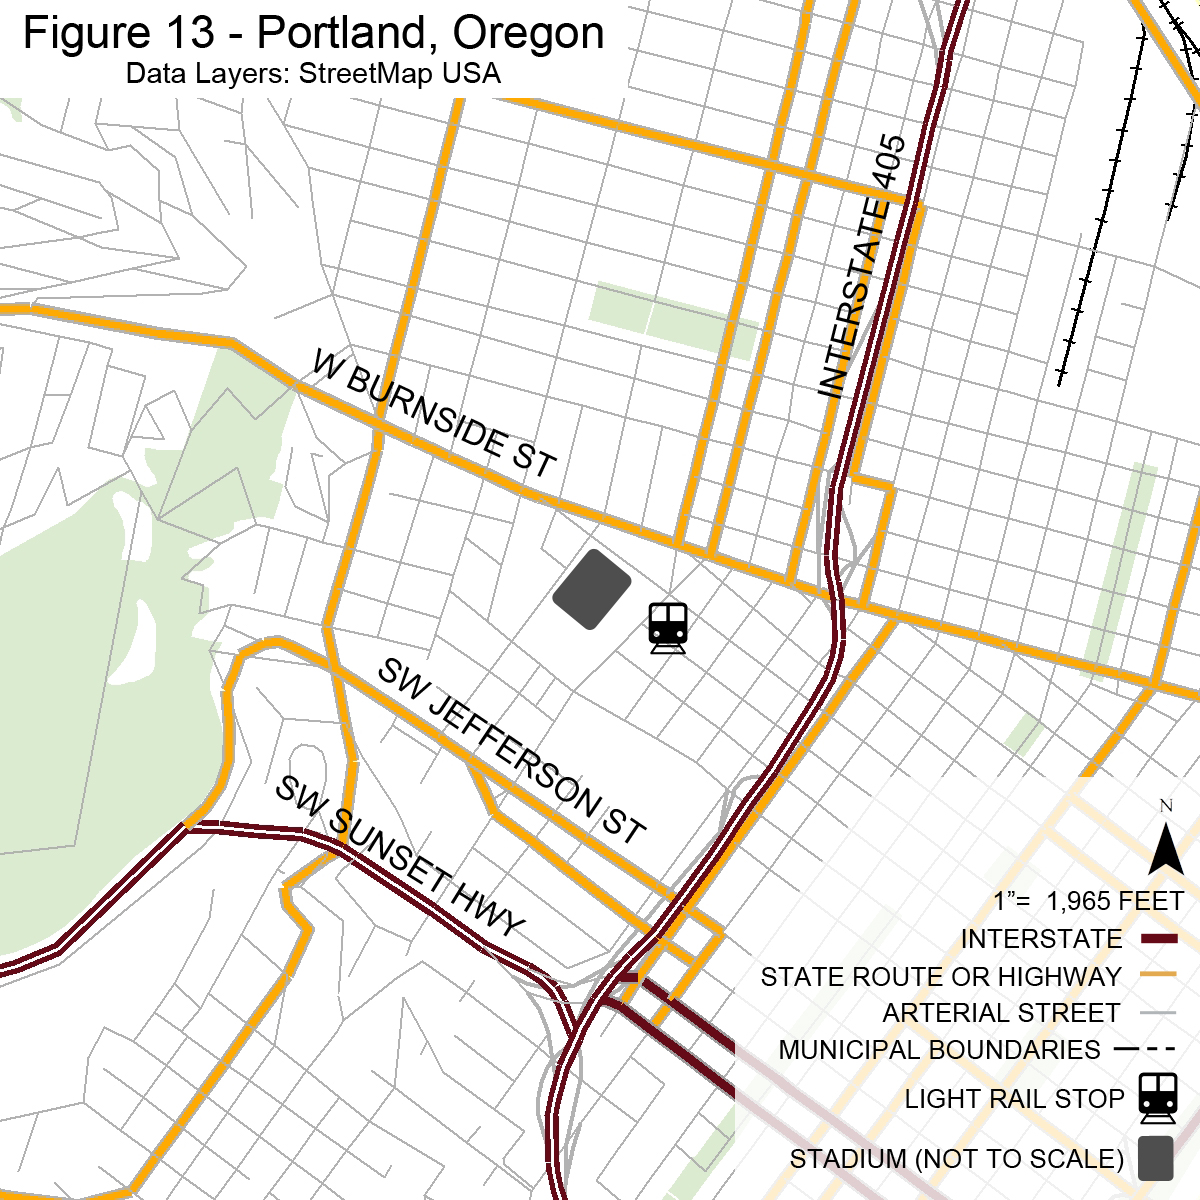
86 74

87 75
A baseball stadium is unlikely to spur economic development in the area around it. Publicly financed stadiums do not pay for themselves.
 820 First Street, NE, Suite 610, Washington, DC 20002 Tel: 202-408-1080 Fax: 202-408-8173 http://www.dcfpi.org June 9, 2003 WOULD A PUBLICLY FINANCED BASEBALL STADIUM PAY OFF FOR DC? Economic Research
Philadelphia County. Land Use and Growth Management Profile
 Philadelphia County is located in the southeastern corner of Pennsylvania and is bordered by the Pennsylvania counties of Delaware, Montgomery, and Bucks, and the New Jersey counties of Burlington, Camden,
inaugural opening 2007 3,270,210 2008 3,456,641 2009 3,609,048 2010 4,002,000 2011 5,468,951 2012 (projected) 6,000,000+
 6,000,000+") The World s game in the USA The U.S. soccer community is currently at 65 million participants, including youth and adult players, fans, and volunteers. 14 million children between the ages of 6-17 play
The World s game in the USA The U.S. soccer community is currently at 65 million participants, including youth and adult players, fans, and volunteers. 14 million children between the ages of 6-17 play
IV. Market Analysis. A. Executive Summary. The Economy. The Site
 IV. Market Analysis A. Executive Summary The Economy The St. Louis metropolitan area population has grown at the moderate annual rate of 4.4% over the last eight years while employment (the best measure
SAN FRANCISCO NEIGHBORHOOD PROFILES
 SAN FRANCISCO NEIGHBORHOOD PROFILES September 2011 Primary Sources: http://www.ubayp.com/neighborhoods/index.aspx http://www.sanfrancisco.travel/ Downtown: Union Square Area San Francisco's Downtown neighborhood
EXPERIENCE INVESTMENT MANAGEMENT & REAL ESTATE SERVICES
 INVESTMENT & REAL ESTATE SERVICES Who We Are A trusted advisor. A consistent presence. A valued resource. Forest City Investment Management & Real Estate Services is the investment management and third-party
Impact Analysis: The Atlanta Braves new Stadium Project. March 2014. A Cushman & Wakefield Research Publication
 Impact : The new Stadium Project A Cushman & Wakefield Research Publication March 2014 1 Executive Summary The new baseball stadium project will dramatically transform the Cumberland/Galleria area of Northwest
III. Focused Issues. 1. Economic Development C I T Y OF P E T E R S B U R G, V I R G I N I A - C O M P R E H E N S I V E P L A N 2 011
 III. Focused Issues 1. Economic Development Economic development efforts require a multi-faceted approach to best serve the current workforce, train the next generation, and position the City to adapt
Financial Issues in Sport Chapter 1
 C H A P T E R 1 Financial Issues in Sport Chapter 1 Chapter Objectives Understand how important managing money is for anyone in the sport industry. Understand how math, strategy, and managerial skills
Economic Development Element
 The Strawberry Ladies by Tara Stood Economic Development Element Economic development enhances San Clemente s quality of life by providing local goods and services and expanding employment and business
Final Recommendations of the Committee on Regional Truck Issues June 27, 2001
 Final Recommendations of the Committee on Regional Truck Issues June 27, 2001 STUDY OBJECTIVES 1) Reduce the impacts of truck noise and vibrations on residents in the six MOU communities, especially at
CANADA UNITED STATES MONTREAL TORONTO BOSTON NEW YORK CITY PHILADELPHIA WASHINGTON, D.C. CHICAGO SALT LAKE CITY DENVER COLUMBUS SAN JOSE KANSAS CITY
 VANCOUVER SEATTLE CANADA PORTLAND MONTREAL TORONTO BOSTON SAN JOSE SALT LAKE CITY DENVER KANSAS CITY CHICAGO COLUMBUS NEW YORK CITY PHILADELPHIA WASHINGTON, D.C. LOS ANGELES ATLANTA DALLAS UNITED STATES
Atlanta City Council Finance Committee February 13, 2013
 Atlanta City Council Finance Committee February 13, 2013 1 Presentation Studies/Analysis Phase I Master Plan Analysis of Entire GWCC Campus Phase II Master Plan Develop a solution for renovation of existing
How the Seattle Sonics Became the Oklahoma City Thunder and the Economic Implications
 How the Seattle Sonics Became the Oklahoma City Thunder and the Economic Implications One of the most popular sports in the United States today is basketball and a large part of that popularity is facilitated
Amway Center Orlando, Florida
 Amway Center Orlando, Florida PROJECT DETAILS 18,000 seats 1,400 club seats 58 suites 60 loge boxes 4 bunker suites Opened: October 2010 While employed by Populous, the Partners of Venue Solutions Group
Transportation Best Practices for Serving Low Income Residents National Resource Network 311 for Cities
 Transportation Best Practices for Serving Low Income Residents National Resource Network 311 for Cities In August 2015, a city submitted a request for assistance to the National Resource Network s 311
Real Estate Trends. in the Sacramento Region. Key Points
 Real Estate Trends The opening of Golden 1 Center in the fall of 2016 will certainly be one of the most significant events in recent Sacramento history. Golden 1 Center Downtown Sacramento photo credit:
ATLANTA The premier growth city in south- east United States. By Aman Goyal. www.pineheron.com Tel: 404-996- 0545 Email: aman@pineheron.
 ATLANTA The premier growth city in south- east United States By Aman Goyal www.pineheron.com Tel: 404-996- 0545 Email: aman@pineheron.com Atlanta, Georgia, USA Atlanta is the capital and most populous
Executive Summary. Viability of the Return of a Major League Baseball Franchise to Montreal (the Expos )
") Executive Summary Viability of the Return of a Major League Baseball Franchise to Montreal (the Expos ) November 2013 Table of Contents 1. CONTEXT AND OBJECTIVES... 3 2. RESEARCH METHODS... 5 3. KEY RESULTS...
Executive Summary Viability of the Return of a Major League Baseball Franchise to Montreal (the Expos ) November 2013 Table of Contents 1. CONTEXT AND OBJECTIVES... 3 2. RESEARCH METHODS... 5 3. KEY RESULTS...
Flickr: Randy Pertiet. Baltimore s Inner Harbor: Economic Impact, Importance, and Opportunities for Investment October 31, 2013
 Flickr: Randy Pertiet Baltimore s Inner Harbor: Economic Impact, Importance, and Opportunities for Investment October 31, 2013 Executive Summary: Baltimore s Inner Harbor drives substantial economic and
District of Columbia Zoning Requirements for Parking Study
 District of Columbia Zoning Requirements for Parking Study Project Review Project Overview Kickoff May 2007 Review of Existing Conditions: Zoning, Reports, Data Review of Best Practices Review of On-Street
SECTION ONE CHAPTER 2: A LAND USE PROFILE OF MANCHESTER
 SECTION ONE CHAPTER 2: A LAND USE PROFILE OF MANCHESTER Land use is the central element of a comprehensive plan because it establishes the overall physical configuration of the city, including the mix
Downtown Los Angeles Streetcar Economic Analysis
 Downtown Los Angeles Streetcar Economic Analysis Executive Briefing Prepared for: Los Angeles Streetcar, Inc. 550 S. Hope Street, Ste. 2300 Los Angeles, CA 90071 Prepared by: AECOM 515 S. Flower Street,
Near West Side Comprehensive Plan Executive Summary (Revised) April 2004 City of Milwaukee DCD
 April 2004 City of Milwaukee DCD") Near West Side Comprehensive Plan Executive Summary (Revised) April 2004 City of Milwaukee DCD Boundaries The Near West Side Comprehensive Plan covers a broad area immediately west of Milwaukee s downtown.
Near West Side Comprehensive Plan Executive Summary (Revised) April 2004 City of Milwaukee DCD Boundaries The Near West Side Comprehensive Plan covers a broad area immediately west of Milwaukee s downtown.
Economic Impact and Development Analysis. Proposed Sports Entertainment District
 THE LONDON GROUP Economic Impact and Development Analysis Proposed Sports Entertainment District Prepared For: The City of Escondido November 2010 The London Group 2010 Report Prepared by: Gary H. London,
Data Management Summative MDM 4U1 Alex Bouma June 14, 2007. Sporting Cities Major League Locations
 Data Management Summative MDM 4U1 Alex Bouma June 14, 2007 Sporting Cities Major League Locations Table of Contents Title Page 1 Table of Contents...2 Introduction.3 Background.3 Results 5-11 Future Work...11
2010 Salida Community Priorities Survey Summary Results
 SURVEY BACKGROUND The 2010 Salida Community Priorities Survey was distributed in September in an effort to obtain feedback about the level of support for various priorities identified in the draft Comprehensive
KATHIE CANNING EXECUTIVE DIRECTOR
 OVEMBER 20, 2013 DISTRICT NOVEMBER ADVISORY BOARD MEETING KATHIE CANNING EXECUTIVE DIRECTOR AGENDA INTRODUCTION/OVERVIEW 2014 PROJECTIONS COMPETITIVE OVERVIEW 2013 CLIENT ADVISORY BOARD CAPITAL IMPROVEMENT
U.S. Culture Series: American Sports. Scott Manley
 U.S. Culture Series: American Sports Scott Manley Sports in the U.S. Sports in the U.S. are an important part of the culture. The sporting culture is different from that of other countries, with a unique
Ne w J e r s e y Tr a f f i c Co n g e s t i o n :
 Ne w J e r s e y Tr a f f i c Co n g e s t i o n : A Growing Crisis January 2008 Cover photo : Route 3, Passaic County introduction A rising tide of traffic congestion threatens to increase roadway gridlock,
IN THEOR Y, PUBLIC INVESTMENTS IN MASS TRANSIT CAN MAKE URBAN
 Can Public Transportation Increase Economic Efficiency? M AT T H E W D R E N N A N A N D C H A R L E S B R E C H E R IN THEOR Y, PUBLIC INVESTMENTS IN MASS TRANSIT CAN MAKE URBAN economies more efficient
Community and Economic Development
 Business Center Index Organizational Chart 12 2 Business Center Summary 12 3 Permits and Inspections 12 4 Economic Development 12 5 Planning 12 6 Willett Hall 12 7 Community Planning and Development Program
The Gateway Temple City
 The Gateway Temple City California Pacific Group Regional Center (CPG-RC) has been designated as Regional Center by the United States Citizenship and Immigration Services. (See exhibit A ) We assist foreign
New York Avenue-Florida Avenue- Galludet University Metro Station: A Case Study
 New York Avenue-Florida Avenue- Galludet University Metro Station: A Case Study The New York Avenue-Florida Avenue-Galludet University Metro station in Washington DC is a result of planners and neighborhood
Economic Profile THE ECONOMIC CONTRIBUTIONS OF DATA CENTERS IN NORTH CENTRAL WASHINGTON WASHINGTON RESEARCH COUNCIL
 WASHINGTON RESEARCH COUNCIL Economic Profile THE ECONOMIC CONTRIBUTIONS OF DATA CENTERS IN NORTH CENTRAL WASHINGTON January 2010 WASHINGTON RESEARCH COUNCIL 16300 Christensen Road, Suite 207 Tukwila, Washington
BASSETT CREEK VALLEY MASTER PLAN OPEN HOUSE
 BASSETT CREEK VALLEY MASTER PLAN OPEN HOUSE February 23, 2006 PROJECT INTRODUCTION Project Area 230 acres $50 million estimated market value (approximately) 50 acres parkland 100 residences (estimated)
SPORTS MARKETING 2013
 SPORTS MARKETING 2013 September 2012; 476 pages; ISBN# 1-57783-183-7; $385.00 (print or electronic edition) Published by Richard K. Miller & Associates (RKMA) 1 MARKET SUMMARY 1.1 The U.S. Sports Market
East Somerville. What is important to me Survey Results
 What is important to me Survey Results The What is important to me survey was used at the Somerville by Design: Crowdsourcing meeting on May 28, 213. About 35 people filled out the survey at that meeting,
Mid-Coast Corridor Transit Project San Diego, California New Starts Project Development (Rating Assigned November 2014)
") Mid-Coast Corridor Transit Project San Diego, California New Starts Project Development (Rating Assigned November 2014) Summary Description Proposed Project: Light Rail Transit 10.9 Miles, 9 Stations Total
Mid-Coast Corridor Transit Project San Diego, California New Starts Project Development (Rating Assigned November 2014) Summary Description Proposed Project: Light Rail Transit 10.9 Miles, 9 Stations Total
Mid-Coast Corridor Transit Project San Diego, California New Starts Engineering (Rating Assigned November 2015)
") Mid-Coast Corridor Transit Project San Diego, California New Starts Engineering (Rating Assigned November 2015) Summary Description Proposed Project: Light Rail Transit 10.9 Miles, 9 Stations Total Capital
Mid-Coast Corridor Transit Project San Diego, California New Starts Engineering (Rating Assigned November 2015) Summary Description Proposed Project: Light Rail Transit 10.9 Miles, 9 Stations Total Capital
Manager of Community Planning and Development
 Manager of Community Planning and Development City of Denver: Manager of Community Planning and Development The City and County of Denver is a world-class municipal government that is leading the way with
Understanding Value Capture as a Transportation Finance Strategy in Massachusetts. March 15, 2013
 Understanding Value Capture as a Transportation Finance Strategy in Massachusetts March 15, 2013 Background The Massachusetts Legislature will soon explore options to increase transportation revenue. One
FACT BOOK Use these interesting facts and figures from around the world and the world of soccer to help inspire your soccer season.
 FACT BOOK Use these interesting facts and figures from around the world and the world of soccer to help inspire your soccer season. 1994 USA The Most Successful World Cup EVER! In 1994 the World Cup came
The primary focus of state and local government is to provide basic services,
 Tax Relief and Local Government The primary focus of state and local government is to provide basic services, such as public safety, education, a safety net of health care and human services, transportation,
The Economists Voice
 The Economists Voice Volume 2, Issue 4 2005 Article 4 Should the Government Rebuild New Orleans, Or Just Give Residents Checks? Edward L. Glaeser Summary Should government rebuild New Orleans? Edward Glaeser
Facts and Analysis About Parking
 Smarter Parking, Better Communities Sparking New Ideas Conference 8 April 2014 Dukakis Center For Urban and Regional Policy Northeastern University School of Public Policy & Urban Affairs www.northeastern.edu/dukakiscenter
Private Money for Public Projects
 By Paul Landow and Carol Ebdon Private Money for Public Projects In the non-profit environment, a new form of philanthropy has emerged in which the contributor s role extends beyond merely providing financial
Why Downtowns Matter ~ ~ Geoffrey Anderson
 Why Downtowns Matter ~ ~ Geoffrey Anderson We re a little confused Richard Drudl Why Downtowns? Increasing demand for walkable live/work/play destinations Downtowns are again a key factor in economic
Market Analysis Retail Housing Office [CITY OF BERLIN MARKET ANALYSIS] City of Berlin, Wisconsin
![Market Analysis Retail Housing Office [CITY OF BERLIN MARKET ANALYSIS] City of Berlin, Wisconsin](/thumbs/34/17190064.jpg "Market Analysis Retail Housing Office [CITY OF BERLIN MARKET ANALYSIS] City of Berlin, Wisconsin") 2013 Market Analysis Retail Housing Office [CITY OF BERLIN MARKET ANALYSIS] City of Berlin, Wisconsin Executive Summary Berlin is a community of roughly 5,500 residents, located along the Fox River in
2013 Market Analysis Retail Housing Office [CITY OF BERLIN MARKET ANALYSIS] City of Berlin, Wisconsin Executive Summary Berlin is a community of roughly 5,500 residents, located along the Fox River in
Demographic Characteristics (Tables 1-4)
") Jupiter TOD Market Overview Jupiter, FL ERA Real Estate & Economic Advisors Washington, D.C. Why a Market Overview? Understand current market conditions and impacts on near-term redevelopment opportunities
Jupiter TOD Market Overview Jupiter, FL ERA Real Estate & Economic Advisors Washington, D.C. Why a Market Overview? Understand current market conditions and impacts on near-term redevelopment opportunities
OAKLAND OVERSIGHT BOARD MEMORANDUM
 OAKLAND OVERSIGHT BOARD MEMORANDUM TO: Oakland Oversight Board FROM: Fred Blackwell SUBJECT: Property Management Plan DATE: February 25, 2013 ITEM: #6 EXECUTIVE SUMMARY This is an informational report
Camden Community Conversation. Vibrancy Survey Results May 21, 2009
 Camden Community Conversation Vibrancy Survey Results May 21, 2009 Prepared by Friends of Midcoast Maine For the Citizens of Camden Electronic survey and analysis by Jane Lafleur and Deborah Dodge. May
The Economic Impact of One WVU Home Football Game on the Monongalia County Economy. Dr. Christiadi Demographer
 The Economic Impact of One WVU Home Football Game on the Monongalia County Economy Dr. Christiadi Demographer October 2012 The Economic Impact of One WVU Home Football Game on the Monongalia County Economy
Hosting Big Events. How Airbnb helps cities open their doors
 Hosting Big Events How Airbnb helps cities open their doors Big events are big business for destinations around the world. As event organizers and destination managers bid for, win and host events, they
REFERENCES-COMMERCIAL. Montgomery County Community College. 60,000 Sq. Ft. Montgomery County Community College 12,000 Sq. Ft.
 Montgomery County Community College West Campus Expansion 60,000 Sq. Ft. Warehouse adaptive reuse of the former Vaughn Knitting Mill, a major architectural component of Pottstown s Industrial Heritage.
David Kanthor. date created: 8/15/2013 12:44:36 PM speaking for: * Stadium Casino, LLC (Live! Hotel and Casino)
") David Kanthor date created: 8/15/2013 12:44:36 PM speaking for: * Stadium Casino, LLC (Live! Hotel and Casino) This location (Live! Hotel and Casino, Stadium Casino LLC, 900 Pacleer Avenue} is the best
David Kanthor date created: 8/15/2013 12:44:36 PM speaking for: * Stadium Casino, LLC (Live! Hotel and Casino) This location (Live! Hotel and Casino, Stadium Casino LLC, 900 Pacleer Avenue} is the best
DENSITY AND PUBLIC SPACE AT BISHOP STREET
 DENSITY AND PUBLIC SPACE AT BISHOP STREET Niehoff Urban Studio Senior Planning Capstone Spring 2015 Justin M. Lightfield U N I V E R S I T Y O F C I N C I N N A T I Table of Contents Overview... 3 Design
2. Market Area Background and Demographics Deliverable 1B
 2. Market Area Background and Demographics Deliverable 1B This section evaluates demographic and economic characteristics of the two principal sources of demand in the market area, the resident population
The Lancaster Medical District Master Plan. The Lancaster Campus District 1
 The Lancaster Medical District Master Plan The Lancaster Campus District 1 Table of Contents 1 INTRODUCTION 3 2 THE PLANNING PROCESS 4 Assumptions 6 3 PLANNING CONTEXT AND ECONOMIC OUTLOOK 7 Site Analysis
How To Improve Housing In Seminole County
 ELEMENT Introduction Issues and Concerns Goals, Objectives and Policies Exhibits 2020 ELEMENT INTRODUCTION Since populations group themselves into households, the socioeconomic makeup of those households
How to Perform a Feasibility Study for Indoor and Outdoor Waterpark Resorts
 How to Perform a Feasibility Study for Indoor and Outdoor Waterpark Resorts By David J. Sangree, MAI, CPA, ISHC Before a developer or organization considers construction of a new indoor or outdoor waterpark
High Mileage Moms - The Report
 High Mileage Moms - The Report Mothers are spending more time behind the wheel than ever before, and this is leaving less time for the rest of their lives, for everything from playing with children to
Executive Summary. Does a Streetcar Make Sense in Anaheim
 Does a Streetcar Make Sense in Anaheim Streetcar in Portland s Pearl District Anaheim s proposed streetcar compares well with national best practice in Portland, Seattle and Tampa where new streetcars
AGL CONFERENCE: Perspectives & Case Studies in Small Cells and DAS
 DAS & Small Cell Business Group AGL CONFERENCE: Perspectives & Case Studies in Small Cells and DAS PRESENTED BY RICH GRIMES Chief Operating Officer DAS & Small Cell Group InSite Wireless Group, LLC June
March 2015 Prepared by the Department of Finance & Performance Management. 2013 Regional Peer Review PERFORMANCE MEASURES
 March 2015 Prepared by the Department of Finance & Performance Management 2013 Regional Peer Review PERFORMANCE MEASURES CONTENTS CONTENTS... 1 EXECUTIVE SUMMARY... 2 SNAPSHOT... 4 PEER SELECTION... 5
Mortgage Forgiveness Debt Relief Act of 2007
 2007 California Wildfires Disaster Tax Issues Presidentially Declared Disaster Areas Anna Maria Galdieri is a CPA in Oakland, California. She developed her expertise in the area of disaster tax law working
Re: Draft Environmental Impact Statement & Growth and Equity Analysis for the Seattle Comprehensive Plan Update
 June 18, 2015 City of Seattle Department of Planning and Development Attn: Gordon Clowers 700 5th Avenue, Suite 2000 PO Box 34019 Seattle, WA 98124 Re: Draft Environmental Impact Statement & Growth and
Cost and Financial Analysis
 Chapter 19: Cost and Financial Analysis A. INTRODUCTION The purpose of this chapter is to present examples of financial resources available to the Metropolitan Transportation Authority (MTA), which may
STOP CONSOLIDATION TRANSIT STRATEGIES
 TRANSIT STRATEGIES STOP CONSOLIDATION Transit stops are the places where people access transit service, and greatly impact many elements of passengers transit experiences. They are typically thought of
Request for Information
 Request for Information Date of Issue: February 13, 2015 Responses Due: May 29, 2015 Overview Forest West Properties Inc. (FWP) is soliciting qualifications from qualified developers for the development
CITY OF BEATRICE, NEBRASKA ECONOMIC DEVELOPMENT PROGRAM (LB840)
") CITY OF BEATRICE, NEBRASKA ECONOMIC DEVELOPMENT PROGRAM (LB840) Effective April 1, 2013 March 31, 2023 TABLE OF CONTENTS NEED AND PURPOSE 1 SECTION I. GENERAL COMMUNITY AND ECONOMIC DEVELOPMENT STRATEGY
CITY OF BEATRICE, NEBRASKA ECONOMIC DEVELOPMENT PROGRAM (LB840) Effective April 1, 2013 March 31, 2023 TABLE OF CONTENTS NEED AND PURPOSE 1 SECTION I. GENERAL COMMUNITY AND ECONOMIC DEVELOPMENT STRATEGY
For more information, visit: rethinkingstreets.com
 For more information, visit: rethinkingstreets.com 37 Arterial Rehab Busy, multi-lane streets, often referred to as arterials, crisscross the landscape of our cities and suburbs. Alongside these wide thoroughfares,
Chief Building Official
 Chief Building Official To be considered, please submit a cover letter, résumé with salary history and five (5) professional references to: Ms. Patricia Palmer Director, Community and Human Resources 22
Affordable Transit, Affordable New York
 Affordable Transit, Affordable New York Guaranteeing the Transit Tax Break for Employees and Businesses April 27, 2014 A Report by the Riders Alliance Principal Author: Benjamin Lowe EXECUTIVE SUMMARY:
PASSED BY THE CITY COUNCIL OF THE CITY OF FREEPORT, ILLINOIS: THIS DAY OF, A.D., 20. APPROVED: MAYOR PASSED: APPROVED: ATTEST: CITY CLERK
 Special Ordinance for Variation, Permit or Amendment of Codified Ordinances of Freeport, Illinois ORDINANCE NO. 2007-08 1. Type of Relief: Amendment of Zoning Ordinance from R6 (Multiple Family Residence)
March 13, 2006. Hon. Scott M. Stringer Manhattan Borough President 1 Centre Street New York, NY 10007. Dear Borough President Stringer:
 THE CITY OF NEW YORK INDEPENDENT BUDGET OFFICE 110 WILLIAM STREET, 14 TH FLOOR NEW YORK, NEW YORK 10038 (212) 442-0632 FAX (212) 442-0350 EMAIL: ibo@ibo.nyc.ny.us http://www.ibo.nyc.ny.us Hon. Scott M.
PHILADELPHIA: SMART CITY. SMART CHOICE.
 PHILADELPHIA: SMART CITY. SMART CHOICE. City of Philadelphia LIFE L IBERTY AND YOU TM WELCOME to the city and region that is the smart choice for investment and growth in the fast changing, global market
Community Content Collaboration
 2015 Community Content Collaboration Conferences Meetings Training Marketing Trade Shows Government Fund-Raising Business Entertaining Destination Management Incentive Entrepreneurs Wedding & Social Corporate
10/14/2015 HOW DID WE GET HERE? Breaking the Cycle of Disinvestment Downtown
 Breaking the Cycle of Disinvestment Downtown OEDA 10/20/2015 heritageohio.org THE KEY TO DOWNTOWN DEVELOPMENT IS TO INTERRUPT THE CYCLE OF DISINVESTMENT AND CREATE ECONOMICALLY VIABLE BUILDINGS. HOW DID
CITY OF LANCASTER, PA
 CITY OF LANCASTER, PA HIGH STYLE, SMALL CITY, BIG SURPRISES LancasterCityAlliance.org WELCOME TO THE CITY OF LANCASTER A compact city of seven square miles and 60,000 residents, Lancaster City is located
Land Banks and Affordable Housing
 September 2008 Volume 7 Issue 5 Land Banks and Affordable Housing You can hardly turn on the news today without hearing a report that the number of foreclosed properties continues to rise nationwide. In
FORMULA FOR ILLINOIS FUTURE IN BIOSCIENCE ILLINOIS SCIENCE + TECHNOLOGY PARK. EXECUTIVE SUMMARY ADDENDUM February 2006
 FORMULA FOR ILLINOIS FUTURE IN BIOSCIENCE ILLINOIS SCIENCE + TECHNOLOGY PARK EXECUTIVE SUMMARY ADDENDUM February 2006 PREPARED BY Applied Real Estate Analysis, Inc. (AREA), a multidisciplinary real estate
Corporate Relocation & Retention
 Corporate Relocation & Retention Contents Page Quality of Life Attracts Businesses 7-3 Greenways Contribute to Quality of Life 7-4 Greenways Promote Employee Fitness 7-6 How to Use These Rationales in
How To Calculate The Benefits From Hosting A Major League Team
 What Are the Benefits of Hosting a Major League Sports Franchise? By Jordan Rappaport and Chad Wilkerson Over the last few decades the number of U.S. metropolitan areas large enough to host a franchise
Picture Your Business in...
 Picture Your Business in... W E L C O M E T O C O L L I N C O U N T Y, T E X A S Clearly the Place to be. Collin County has made a name for itself as a great place to live and to work. With some of the
# U N I V E R S I T Y A V E N U E S P E C I F I C P L A N Page 1-1 # 1.0 INTRODUCTION. 1.1 University Avenue, Historical Context
 1.0 INTRODUCTION 1.1 University Avenue, Historical Context By the late 1880s, the role of University Avenue, then known as Eighth Street, was already well established as a link between the original Riverside
Tuesday, June 14, 2016 2:00 PM
 Agenda Arlington City Council Special Meeting Council Briefing Room 101 W. Abram St., 3rd Floor Tuesday, June 14, 2016 2:00 PM I. CALL TO ORDER II. WORK SESSION A. City Council Committees B. Economic Development
Market Analysis for Padre Boulevard Initiative in the Town of South Padre Island, TX
 Market Analysis for Padre Boulevard Initiative in the Town of South Padre Island, TX Prepared for Gateway Planning Group Spring 2010 TXP, Inc. 1310 South 1st Street; Suite 105 Austin, Texas 78704 (512)
Fire Chief. Coweta County, Georgia
 Fire Chief To be considered, please submit a cover letter, résumé with salary history and five (5) professional references to: Ms. Patricia Palmer Director, Community and Human Resources 22 East Broad
San Diego is a community that holds the talent, resources and progressive mindset that provides businesses the opportunity to flourish.
 San Diego is a community that holds the talent, resources and progressive mindset that provides businesses the opportunity to flourish. George Stelling, President and COO, Altec Lansing The perfect place.
Appendix J Santa Monica Travel Demand Forecasting Model Trip Generation Rates
 Appendix J Santa Monica Travel Demand Forecasting Model Trip Generation Rates SANTA MONICA TRAVEL DEMAND FORECASTING MODEL TRIP GENERATION RATES SUBMITTED BY: 201 Santa Monica Blvd., Suite 500 Santa Monica,
Evaluating the Effects of Projected Job Growth on Housing Demand
 Evaluating the Effects of Projected Job Growth on Housing Demand The Association of Bay Area Governments (ABAG) Jobs Housing Connection Draft Land Use Scenario (Draft Scenario) projects that 1.1 million
CREATING A STRONG LOCAL ECONOMY PROMOTING THE COMMUNITY PROVIDING NETWORKING OPPORTUNITIES REPRESENTING BUSINESS TO GOVERNMENT POLITICAL ACTION
 2015 Rock Springs Chamber of Commerce Annual Progress Report Introduction: The Rock Springs Chamber of Commerce operates under five core values: CREATING A STRONG LOCAL ECONOMY PROMOTING THE COMMUNITY
GIS Analysis of Population and Employment Centers in Metro Denver Served by RTD s FasTracks
 APA Transportation Planning Division 2011 Student Paper Competition GIS Analysis of Population and Employment Centers in Metro Denver Served by RTD s FasTracks Patrick Picard 2208 E. 17 th Ave., Apt. #4
The Business of Sports: Where s the Money?
 The Business of Sports: Where s the Money? Dr Justin Wolfers Assistant Professor of Economics www.stanford.edu/people/jwolfers jwolfers@stanford.edu 1 Why the Business of Sports? For all his brilliance,
The Role of Land Use and Transportation in Building Successful Sustainable Cities City of Vancouver
 The Role of Land Use and Transportation in Building Successful Sustainable Cities City of Vancouver Dr. Ann McAfee Co-Director of Planning, Vancouver Transportation & Land Use 1. Vancouver s Transportation
Changing Your Tax Residence
 M u l t i - M a n a g e r P o r t f o l i o A r c h i t e c t s SM Changing Your Tax Residence from the desk of Charles Edward Falk, January 2010 A New York newspaper recently reported that residents of
Alewife Working Group June 14, 2016
 Alewife Working Group June 14, 2016 cambridgema.gov/citywideplan 1 Agenda What we ve heard Past plans and studies for Alewife Alewife Revitalization Plan (1979) Citywide Plan (1997-2000) Concord-Alewife
Los Angeles Union Station, CA Sustainable Neighborhood Assessment. April 22-23, 2014
 Los Angeles Union Station, CA Sustainable Neighborhood Assessment April 22-23, 2014 Sustainable Neighborhood Assessment Through the Sustainable Neighborhood Assessment Tool developed by Global future development
CITY OF FLORENCE NEIGHBORHOOD REVITALIZATION STRATEGY SECOND PUBLIC MEETING
 CITY OF FLORENCE NEIGHBORHOOD REVITALIZATION STRATEGY SECOND PUBLIC MEETING Prepared for: City of Florence July 7th, 2014 AGENDA Review Feedback from First Community Meeting Present Catalytic Project Areas