User Guide 980 HDMI Protocol Analyzer
|
|
|
- Jeffry Shelton
- 8 years ago
- Views:
Transcription
1 User Guide 980 HDMI Protocol Analyzer Gen 3 System Rev: C6 Page 1 February 7, 2013

2 Table of Contents 1 About the 980 HDMI Protocol Analyzer What makes the 980 HDMI Protocol Analyzer Unique? Scope of this User Guide What options are available with the 980 HDMI Protocol Analyzer? Changes to this User Guide User Interface What kinds of data does the 980 HDMI Protocol Analyzer allow you to view? 10 2 Getting Started What is in the 980 HDMI Protocol Analyzer shipping box? Operational workflow for Source Analysis Testing Connector Description HDMI Protocol Analyzer Operational Modes HDMI Protocol Analyzer Analysis Configurations Data Analysis Capture Modes Getting Started Procedures Connection for external 980 GUI Manager 27 3 Overview of the 980 GUI Manager (External) Overview GUI Manager (External) Panel Descriptions Navigation Panel Capture Control panel Video Analysis Panel Data Decode Panel Event Plot Panel Audio Analysis Panel Timing Analysis Panel EDID Editor Panel Opening up the EDID Editor Loading an EDID into the EDID Editor Making Modifications to an EDID with the EDID Editor Emulating a Specific EDID 109 Page 2 February 7, 2013

3 5 Real Time Mode Accessing the Real Time mode Real Time Mode Overview Real Time Mode Data Panels Auxiliary Channel Analyzer (ACA) Accessing the ACA Panel ACA Panel Description Monitoring the HDMI and MHL auxiliary channels with the ACA Viewing HDMI and MHL auxiliary channel traces on a PC with the ACA Testing HDMI Sources, Cables and Distribution Networks for Pixel Errors Accessing the Real Time mode Testing HDMI Distribution Network Components with the Pixel Error Test Running the Pixel Error Test through the command line Testing HDMI Cables and Distribution Networks with the PRN Test Running the Pseudo-Random Noise Test through the command line Analyzing HDMI/MHL Data with your 980 Protocol Analyzer Overview Operational workflow for capturing data with your 980 HDMI Protocol Analyzer Setting the 980 HDMI Protocol Analyzer mode to MHL or HDMI Setting the Configuration of the Link Mode Setting the RX HDCP mode Setting the +5V levels Configuring the 980 HDMI Protocol Analyzer with an EDID Viewing Incoming Video (Built-Embedded GUI only) Using automatic triggering Using External Triggering Using Manual Triggering Using Precision Trigging and Pre-Capture Filtering Examining Captured Data Passively Monitoring between a Source and Sink Device Running HDMI tests using the Pass-Through Mode Running MHL tests using the Pass-Through Mode Running HDMI tests using the Encrypted Link Analyzer 247 Page 3 February 7, 2013

4 10 Running Standard Tests Running a video timing test Running a video analysis test Audio Analysis AVmute Test Loading and Importing Capture files Loading an existing captures with the 980 HDMI Protocol Analyzer Importing Capture Files from other 980 Systems Transferring Capture Files from the 980 Protocol Analyzer to a PC Transferring Capture Files using the Data Transfer Utility Transferring Capture Files using the command line Transferring Capture Files using USB drives Audio Return Channel (HEAC) Testing Test ARC on an HDMI source (ARC Rx) Test ARC on an HDMI sink (ARC Tx) Viewing Decoded EDIDs Reading an EDID from an HDMI or MHL display or sink device HDMI Generator Playback Function Generator Playback function Using the Playback Function through the 980 GUI Manager Using the Playback Function through the Command Line Custom Playback lists Upgrading the 980 Manager and Command Line Interface for Capturing Data Overview Command Line Examples 356 We wish to thank Chris Pasqualino of Broadcom for his helpful suggestions and feedback during the development of the 980 HDMI Protocol Analyzer. His help in reviewing requirements and providing useful feedback during alpha testing were greatly appreciated. Page 4 February 7, 2013
 Testing 296 13.1 Test ARC on an HDMI source (ARC Rx) 299 13.")
5 1 About the 980 HDMI Protocol Analyzer This chapter provides an overview of features of the 980 HDMI Protocol Analyzer and the 980 GUI Manager. The 980 HDMI Protocol Analyzer is an analyzer for HDMI/MHL source devices. It provides visibility into the HDMI/MHL protocol to help resolve common interoperability problems in HDMI/MHL systems. The 980 GUI Manager is a PC application to manage and use the 980 HDMI Protocol Analyzer. There are two 980 HDMI Protocol Analyzer options: The 980 HDMI Protocol Analyzer Gen 3 is able to parse HDMI streams from source devices with a TMDS clock and pixel clock up to 297MHz. The 980 HDMI Protocol Analyzer enables you to specify the type of data that you want to capture. This could be: Data Analysis (Audio, Video, Data Island) - The 980 will capture all the audio packets, video data and the data islands, timing data and auxiliary data. Data Analysis (Only Data Islands) - The 980 will only capture the data islands (not the video packets). Protocol Analysis The 980 will capture the protocol data such as the preamble and guard band data. You will not be able to see the details of the data island, video or audio data. 1.1 What makes the 980 HDMI Protocol Analyzer Unique? The 980 HDMI Protocol Analyzer for HDMI and MHL source devices provides full visibility into the HDMI/MHL protocol, timing, control and auxiliary data. It captures and decodes encrypted or unencrypted metadata (audio sample, infoframes and other data packets) as well as HDMI DDC transactions, MHL C-Bus transactions and HDMI CEC messages. Competitive analyzers available on the market are more limited because they utilize commercial silicon chips. The 980 HDMI Protocol Analyzer uses a proprietary solution and therefore can provide much greater visibility into the protocol, timing and control data. The competitive analyzers support some of the 980 features but not nearly Page 5 February 7, 2013

6 all of them. They support functional testing but not true interoperability testing. Functional test analyzers often support only real time monitoring. The 980 supports capture, store and analysis as well as Real Time monitoring. For these same reasons, the 980 HDMI Protocol Analyzer can support all of the HDMI/MHL source protocol compliance tests in Sections 7.4 through 7.8 of the CTS. Functional test instruments cannot. For example, the 980 HDMI Protocol Analyzer supports all the Protocol tests in Test 7-17 related to control periods, preamble and guard bands and the 980 HDMI Protocol Analyzer can measure the audio sample rate precisely and therefore measure audio jitter correctly. Functional test instruments cannot support these tests correctly. 1.2 Scope of this User Guide This User Guide documents the operation of the 980 HDMI Protocol Analyzer Gen 3 system. For purchases after January 2013 users are encouraged to use the 980 Advanced Test Platform Quick Start Guide and the 980 HDMI Protocol Analyzer module User Guide and associated compliance User Guides described below. The User Guide describes the features and functions of the 980 HDMI Protocol Analyzer Gen 3 system as operated through the standalone PC application, i.e. the 980 Manager. In some cases there are functions of the embedded 980 GUI Manager that will be covered in detail as well. These include: 1) Provisioning the IP address of the ) Viewing the incoming video content from a source device. 3) Viewing the incoming HDMI or MHL video metadata and DDC transactions in real time. This User Guide does not include description or procedural information for any of the compliance test options available with the 980 HDMI Protocol Analyzer (or module). Procedures for running the HDMI/MHL source and sink compliance tests are covered in separate User Guides for MHL/HDMI source and sink compliance testing. The following is a list of the User Guides available for the 980 systems: 980 HDMI Protocol Analyzer Gen 3 System This User Guide covers source analysis testing for HDMI and MHL source devices as well as various transmitter features. This user guide is specifically for the functions of the 980 HDMI Protocol Analyzer Gen 3 system sold through HDMI Protocol Analyzer module This User Guide covers source analysis features of the 980 HDMI Protocol Analyzer module. Used in conjunction with the 980 Advanced Test Platform Quick Start Guide for purchases in Advanced Test Platform Quick Start Guide This Quick Start Guide covers startup procedures for the 980/980B platform. Used in conjunction with the 980 HDMI Protocol Analyzer Module User Guide for purchases in HDMI Protocol Analyzer module This User Guide covers source analysis testing for HDMI and MHL source devices as well as various transmitter features. This user guide is specifically for the functions of the 980 HDMI Protocol Analyzer module equipped in one of the 980 Advanced Test Platform slots (980 Gen 3 or 980B). Used in conjunction with the 980 Advanced Test Platform Quick Start Guide. 980 HDMI Protocol Analyzer HDMI/MHL Source Compliance Test This User Guide covers source compliance testing for both MHL and HDMI sources. These compliance test applications are provided by the 980 HDMI Protocol Analyzer module or the 980 HDMI Protocol Analyzer Gen 3 system. Used in conjunction with the 980 Advanced Test Platform Quick Start Guide. 980 HDMI Protocol Analyzer HDMI/MHL Sink Compliance Test This User Guide covers sink compliance testing for both MHL and HDMI sinks (and MHL dongles). These compliance test applications are provided by the 980 HDMI Protocol Analyzer module or the 980 HDMI Protocol Analyzer Gen 3 system. Used in conjunction with the 980 Advanced Test Platform Quick Start Guide. Page 6 February 7, 2013

7 980 MHL CBUS Compliance Test Module - This User Guide covers MHL CBUS compliance testing for both MHL sources as well as sinks and dongles. This compliance test applications are provided by the 980 CBUS Compliance Test module. Used in conjunction with the 980 Advanced Test Platform Quick Start Guide. 980 HDMI Video Generator module This User Guide covers the features and functions offered by the 980 HDMI Video Generator module. (This User Guide.). Used in conjunction with the 980 Advanced Test Platform Quick Start Guide. 1.3 What options are available with the 980 HDMI Protocol Analyzer? There are six (6) options that you can purchase with the 980 HDMI Protocol Analyzer. You must have a license to use these options: Encrypted Link Analyzer mode for monitoring encrypted data between an HDMI source and sink device. HDMI Source Compliance tests in accordance with HDMI 1.4 CTS Sections 7.4 through 7.8. EDID Compliance test in accordance with Sections 8.2 and 8.5 of the HDMI 1.4 CTS. HDMI Sink Compliance tests in accordance with HDMI 1.4 CTS Sections 8.2 and 8.4 through 8.8 (supported on Gen 3 only). MHL Source Compliance tests in accordance with MHL 1.2 & 2.0 CTS Section 3 (supported on Gen 3 only). MHL Sink Compliance tests in accordance with MHL 1.2 & 2.90 CTS Section 4 (supported on Gen 3 only). The MHL Sink Compliance test suite requires the Quantum Data 882E or 882EA instrument, release or later which uses firmware version You can determine what options the 980 is provisioned with by looking at the label on the bottom of the 980 or by accessing the Instrument Information screen on either the built-in or external 980 GUI manager. When using the external 980 GUI Manager you must be connected to the 980 in order to read the Instrument Information. Refer to the following screen. Page 7 February 7, 2013


8 Select Information to view the Instrument Information panel. Page 8 February 7, 2013

9 1.4 Changes to this User Guide The following changes have been made to this User Guide recently: Corrected Pseudo-Random noise commands. Note: Please be sure to check the Quantum Data website for updates to this User Guide User Interface The 980 provides a graphical user interface (980 GUI Manager) for operation. This GUI can run both on the 980 itself through the built-in color touch screen display (embedded 980 GUI Manager) or as a standalone application running on a PC (external 980 GUI Manager). The look and feel and functions are similar but not identical GUI Manager The external 980 GUI Manager provides easy access to the captured data on your PC for sharing with others. Also the external 980 GUI Manager enables you to operate the 980 through a larger interface which allows you to use multiple panels at the same time. Page 9 February 7, 2013

10 1.5.2 Embedded 980 GUI Manager Real Time Monitoring You can operate the 980 HDMI Protocol Analyzer fully through the built-in color touch screen display. In addition to the basic operation of the 980 HDMI Protocol Analyzer the touch screen display GUI there are two key features that are only available in the embedded 980 GUI Manager GUI: 1) viewing the video in real time, 2) viewing the MHL video/audio metadata and DDC (MHL C-Bus) transactions in real time using the Real Time mode. You can view the incoming video from a source even when encrypted with HDCP content protection. The ability to view the incoming video also enables you to control the menus of the HDMI and MHL source device to ensure that it is in the correct mode. The built-in GUI also enables you to view the HDMI and MHL video metadata and DDC and MHL C-Bus transactions in real time, as they are being captured, using the Real Time mode. You can transfer data captures taken from the built-in touch display to your PC where they can be viewed through the external 980 GUI Manager and also disseminated to others for analysis. 1.6 What kinds of data does the 980 HDMI Protocol Analyzer allow you to view? By providing visibility into the HDMI and MHL protocol, metadata, video, audio and auxiliary data, the 980 HDMI Protocol Analyzer enables you to detect changes and identify anomalies in the HDMI or MHL signal. The following is a list of the data types you can view (currently): Video o Timing parameters o Pixel values Protocol Data o o Guard band Preamble Data Islands, including: o o o o Infoframes (AVI, Audio, Source Product Descriptor, etc.) General Control Packet (GCP) Audio Clock Regeneration (ACR) Audio Sample Packet Header including Channel Status Blocks Hot plug events DDC, C-Bus (MHL) transactions, including: o o HDCP EDID Control data (vsync, hsync, encryption enable) HDMI CEC transactions HDMI Audio Return Channel (ARC) data Page 10 February 7, 2013

11 2 Getting Started This chapter explains what is involved in getting your 980 HDMI Protocol Analyzer up and operating to capture data. 2.1 What is in the 980 HDMI Protocol Analyzer shipping box? You will find the following items in the 980 shipping box: Quantum Data 980 test instrument. Ethernet cable (P/N ) used for connecting to the 980 over the LAN interface. Detachable power cable used for supplying power to the 980. HDMI cable (P/N ) used for connecting to the 980 to the device under test. ESD warning sheet (P/N ) information useful for protecting the HDMI interface against static discharge. Quick Start Guide (P/N ). Please note that the quick start guide included in the 980 shipping box does not provide procedures on how to run the optional compliance tests. 2.2 Operational workflow for Source Analysis Testing The following are the high level steps you will need to follow to get your 980 HDMI Protocol Analyzer up and running: 1. Remove the 980 from the shipping box. 2. Assemble the source device under test into your lab area and power it up. When using the optional passthrough feature to monitor between an HDMI or MHL source and an HDMI or MHL sink, assemble the display device as well. 3. Connect the 980 Protocol Analyzer power cable (provided) to a suitable outlet ( V 50/60Hz) and apply power to the (Optional not required if using the built-in display) Select a suitable PC to host the 980 GUI Manager application. A minimum of 512MB of RAM is recommended. (Note that you do not need a PC because you can use the built-in Front Panel display; however the external 980 GUI Manager provides you with a larger viewing area). 5. (Optional not required if using the built-in display) Determine how you are going to connect to the 980 Protocol Analyzer from the external 980 GUI Manager in order to operate the instrument: o Put the 980 on your corporate network and enable DHCP using an available Ethernet patch cable, or o Connect directly with a host PC or laptop using the Ethernet crossover cable provided. 6. (Optional not required if using the built-in display) Assign an IP address to the 980 either directly or by enabling DHCP. 7. (Optional not required if using the built-in display) Download the latest 980 GUI Manager application from the Quantum Data website: 8. (Optional not required if using the built-in display) Install the 980 Manager application on your host PC. 9. (Optional not required if using the built-in display) Establish a connection to the 980 from the 980 Manager resident on your host PC. 10. (Optional not required if using the built-in display) Through the 980 Manager Add the 980 as an Instrument. Page 11 February 7, 2013
 information useful for protecting the HDMI interface against static discharge. Quick Start Guide (P/N 68-00223).")
12 11. Connect the source device under test to the HDMI Rx port on the 980 Protocol Analyzer. 12. (Optionally) connect a display to the HDMI Tx port on the 980 Protocol Analyzer. This is used when you are using the Pass-Through or the optional Encrypted Link Analyzer feature. 14. View the video in real time to verify that the source is outputting video. 15. Set the capture trigger criteria and the pre-capture filtering criteria. 16. Initiate the capture. 17. View and analyze the captured data. 18. (Optional) You may wish to view the protocol data (guard band and preamble bits) using the protocol mode. 19. (Optional) If you have purchased the HDMI or MHL source compliance test option you can run this test series as well. However you will have to refer to the User Guide for Compliance Tests for these procedures. 2.3 Connector Description This User Guide covers three configurations of the 980 rear panels with the HDMI Protocol Analyzer module installed. Each illustration shows a single 980 HDMI Protocol Analyzer module installed in the 980 along with an auxiliary bus board. Use the following table to identify the connector function and descriptions on your 980 system configuration. 980 Configurations Information / Function Protocol Analyzer board Rev C. Auxiliary slot module (vertical mount) The following is a description of each connector: 980 HDMI Protocol Analyzer module (Rev C): A BNC connector for trigger input. Used for special sync to trigger a capture with Protocol Analyzer module. B HDMI Rx port for analyzing HDMI and MHL sources or for running HDMI or MHL compliance tests on sources. I J E F G H A B C D C HDMI Tx port for HDMI and MHL pass-through to HDTVs and for playback captured files. D BNC connector for trigger output. Used for triggering a scope or camera on the 980 Tx output. Auxiliary Slot module: E RCA connector for SPDIF function. SPDIF audio can be injected into HDMI 1.4 ARC function. F RCA connector for SPDIF function. Extracted SPDIF from HDMI 1.4 ARC can be connected to external instrument. G Ethernet Rx connector use for HEAC function. Ethernet can be injected into the HDMI 1.4 outgoing stream. H Ethernet Tx connector use for HEAC function. Extracted Ethernet can be connected to a NIC card. Page 12 February 7, 2013
 You may wish to view the protocol data (guard band and preamble bits) using the protocol mode. 19.")
13 980 Configurations Information / Function Lower Panel: Protocol Analyzer board Rev. C Auxiliary slot module (horizontal mount) I Ethernet port for connection to PC host for 980 GUI Manager application, telnet for command line control and FTP for transferring files. J Various USB ports for transferring files and restoring system. The following is a description of each connector: 980 HDMI Protocol Analyzer module (Rev C): A BNC connector for trigger input. Used for special sync to trigger a capture with Protocol Analyzer module. B HDMI Rx port for analyzing HDMI and MHL sources or for running HDMI or MHL compliance tests on sources. L K H G F E A B C D C HDMI Tx port for HDMI and MHL pass-through to HDTVs and for playback captured files. D BNC connector for trigger output. Used for triggering a scope or camera on the 980 Tx output. Auxiliary module (horizontal mount): E Ethernet Tx connector use for HEAC function. Ethernet can be injected into the HDMI 1.4 outgoing stream. F Ethernet Rx connector use for HEAC function. Ethernet can be injected into the HDMI 1.4 outgoing stream. I RCA connector for SPDIF function. Extracted SPDIF from HDMI 1.4 ARC can be connected to external instrument. J RCA connector for SPDIF function. SPDIF audio can be injected into HDMI 1.4 ARC function. Lower Panel: Protocol Analyzer board Rev. C QD Bus Board (p/n ) K Ethernet port for connection to PC host for 980 GUI Manager application, telnet for command line control and FTP for transferring files. L Various USB ports for transferring files and restoring system. The following is a description of each connector: 980 HDMI Protocol Analyzer module (Rev C): A BNC connector for trigger input. Used for special Page 13 February 7, 2013

14 980 Configurations Information / Function J K I L H G F E A B D C sync to trigger a capture with Protocol Analyzer module. B HDMI Rx port for analyzing HDMI and MHL sources or for running HDMI or MHL compliance tests on sources. C HDMI Tx port for HDMI and MHL pass-through to HDTVs and for playback captured files. D BNC connector for trigger output. Used for triggering a scope or camera on the 980 Tx output. QD Bus Board ( ): E Ethernet Rx connector use for HEAC function. Ethernet can be injected into the HDMI 1.4 outgoing stream. F Ethernet Tx connector use for HEAC function. Extracted Ethernet can be connected to a NIC card. G BNC Trig OUT connector. Not used in this configuration. H BNC Trig IN connector. Not used in this configuration. I RCA OUT connector for SPDIF function. Extracted SPDIF from HDMI 1.4 ARC can be connected to external instrument. J RCA IN connector for SPDIF function. SPDIF audio can be injected into HDMI 1.4 ARC function. Lower Panel: Protocol Analyzer board Rev. D QD Bus Board (p/n ) K Ethernet port for connection to PC host for 980 GUI Manager application, telnet for command line control and FTP for transferring files. L Various USB ports for transferring files and restoring system. The following is a description of each connector: 980 HDMI Protocol Analyzer module (Rev D): A Ethernet Tx connector use for HEAC function. Extracted Ethernet can be connected to a NIC card. B HDMI Rx port for analyzing HDMI and MHL sources or for running HDMI or MHL compliance tests on sources. C Ethernet Rx connector use for HEAC function. Ethernet can be injected into the HDMI 1.4 outgoing stream. Page 14 February 7, 2013

15 980 Configurations Information / Function D HDMI Tx port for HDMI and MHL pass-through to HDTVs and for playback captured files. QD Bus Board ( ): E Internal Ethernet Tx connector; not used. F Internal Ethernet Rx connector; not used. J K I L H G F E A B C D G BNC Trig OUT connector. Used to trigger and oscilloscope from the HDMI output. H BNC Trig IN connector. Used for special sync to trigger a capture with Protocol Analyzer module. I RCA OUT connector for SPDIF function. Extracted SPDIF from HDMI 1.4 ARC can be connected to external instrument. J RCA IN connector for SPDIF function. SPDIF audio can be injected into HDMI 1.4 ARC function. Lower Panel: K Ethernet port for connection to PC host for 980 GUI Manager application, telnet for command line control and FTP for transferring files. L Various USB ports for transferring files and restoring system. Page 15 February 7, 2013

16 980 HDMI Protocol Analyzer Operational Modes The 980 HDMI Protocol Analyzer can be operated in one of two operational modes: 1) Capture and Store for Analysis and 2) Real Time Monitoring Capture, Store and Post Analysis The Capture and Post Analysis mode is the typical mode of operation and the mode used to analyze HDMI/MHL data and is available both through the built-in touch display GUI and the external 980 GUI Manager. You can capture various sets of data: 1) Data islands, 2) Data islands with video and audio, 3) Protocol data (guard band and preamble), 4) Control data and 5) DDC transactions Real Time Monitoring The Real Time Monitoring mode is used to provide at-a-glance insights into the incoming video. You can view the incoming video even when the video encrypted with HDCP content protection. You can also view the incoming HDMI/MHL video/audio metadata and HDMI DDC or MHL C-Bus transactions. The Real Time mode enables you to collect data in real time and compare incoming data over time to reference data collected earlier. The Real Time mode is available only through the built-in touch display GUI HDMI Protocol Analyzer Analysis Configurations The 980 HDMI Protocol Analyzer can be setup for analysis in one of three configurations: Sink emulation for source analysis In the sink emulation monitoring configuration the 980 HDMI Protocol Analyzer HDMI Rx port is connected directly to the source device under test. The 980 is emulating an HDMI/MHL sink device. The sink emulation mode is the typical mode of operation. In the sink emulation mode you monitor the HDMI/MHL transactions between the source device under test and the 980 Rx port. All of the data types described in this manual can be monitored in the sink emulation mode unless noted otherwise. Page 16 February 7, 2013
 Data islands, 2) Data islands with video and audio, 3)")
17 HDMI Sink Emulation for Source Analysis Configuration using Rev D Protocol Analyzer module HDMI Sink Emulation for Source Analysis Configuration using Rev C Protocol Analyzer module Page 17 February 7, 2013

18 MHL Sink Emulation for Source Analysis Configuration (MHL 2.0 example shown) Page 18 February 7, 2013
 Page 18")
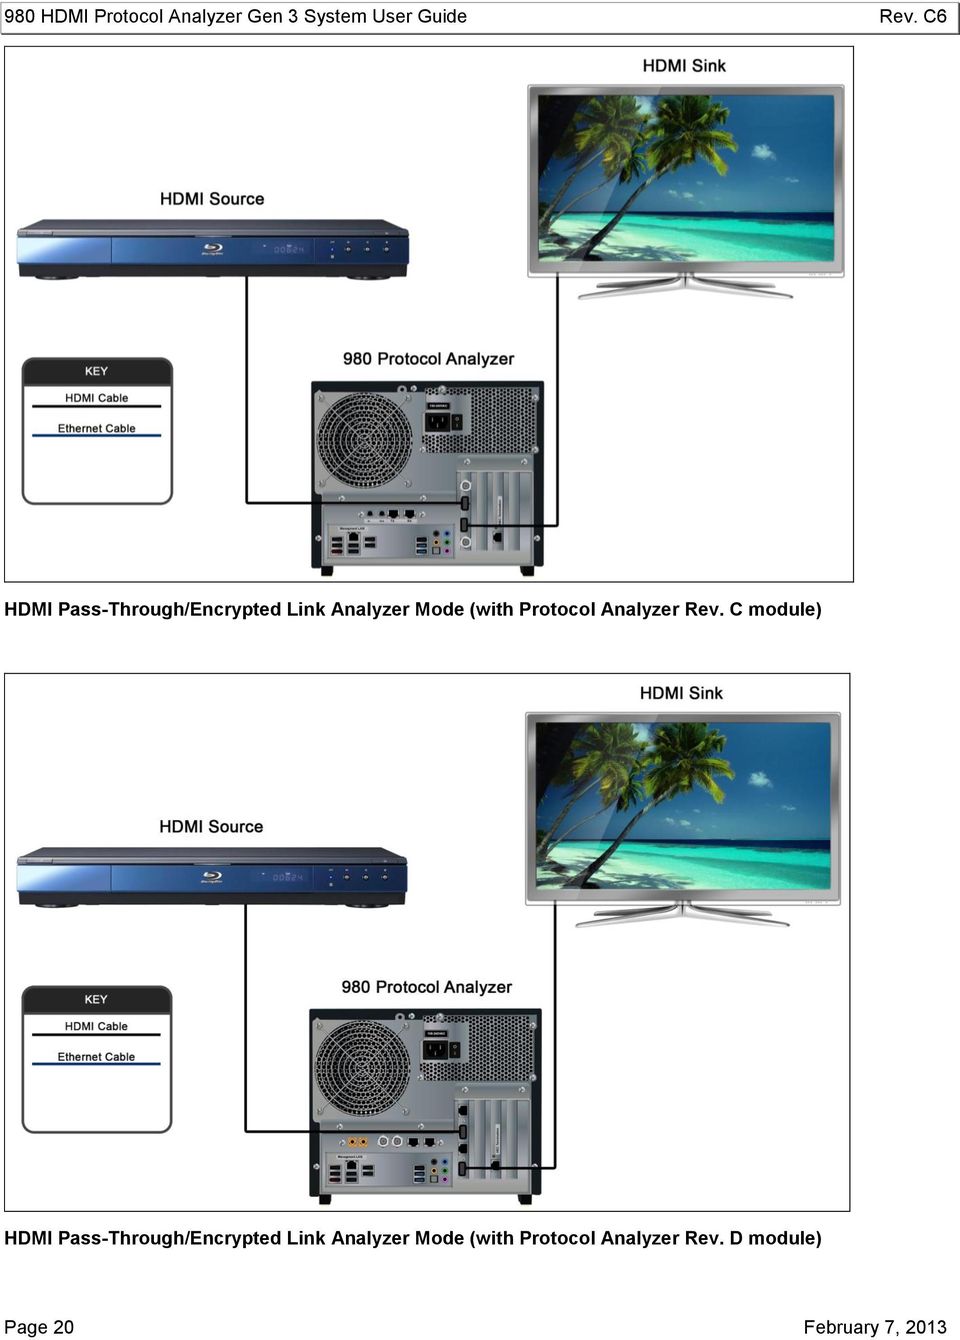
19 2.4.2 Pass-Through Monitor The pass-through mode enables you to monitor the HDMI/MHL traffic passively between an HDMI/MHL source and an HDMI/MHL sink device. In the pass-through monitoring configuration the 980 HDMI Protocol Analyzer HDMI Rx port is connected to the source device under test and the 980 HDMI Protocol Analyzer HDMI Tx port is connected to a sink device. If the video content from the source device is unencrypted you will be able to see all the data through the capture period. If the video content from the source device is encrypted with HDCP you will be able to see all the data and the incoming video up until encryption is enabled. Once encryption is enabled, you will be able to see the HDMI DDC transactions and CEC messages or MHL C-Bus transactions and the timing parameters but not the HDMI/MHL metadata and protocol data. The HDCP transactions that you will see are the transactions that occur between the source and the sink device. Note: For MHL 2.0 using the TPA-MHL2-8R test point adapter, the Pass-Through mode is only supported in MHL Normal mode and only for the TMDS stream; it is not supported in Packed Pixel mode and the CBUS traffic is not passed through Encrypted Link Analyzer In the Encrypted Link Analyzer configuration the 980 HDMI Protocol Analyzer HDMI Rx port is connected to the source device under test and the 980 HDMI Protocol Analyzer HDMI Tx port is connected to a sink device. The Encrypted Link Analyzer configuration enables you to monitor and analyze HDCP encrypted protocol data transmitted between an HDMI source device and sink device. Note that you will not be able to view the HDCP transactions between the source and the sink. With the Encrypted Link Analyzer you can investigate HDMI interoperability while the content is encrypted by viewing the metadata in real time and observing the behavior of the downstream sink device. The Encrypted Link Analyzer enables you to capture the encrypted metadata and store it for detailed analysis. With the capture operation, you can monitor the downstream HDMI sink device for particular symptoms and then initiate a capture when the symptoms exhibit themselves. This ensures that the relevant data data related to interoperability is captured. Note: For MHL 2.0 using the TPA-MHL2-8R test point adapter, the Encrypted Link Analyzer mode is only supported in MHL Normal mode and only for the TMDS stream; it is not supported in Packed Pixel mode and the CBUS traffic is not passed through. Page 19 February 7, 2013

20 HDMI Pass-Through/Encrypted Link Analyzer Mode (with Protocol Analyzer Rev. C module) HDMI Pass-Through/Encrypted Link Analyzer Mode (with Protocol Analyzer Rev. D module) Page 20 February 7, 2013
21 Pass-Through or Encrypted Link Analyzer Mode Configuration MHL 1.2 Testing Pass-Through or Encrypted Link Analyzer Mode Configuration MHL 2.0 Testing Page 21 February 7, 2013
22 Data Analysis Capture Modes The 980 can be configured to view different types of data in a capture and store application. These are described below Data Analysis (Audio, Video, Data Island) The 980 will capture all the audio packets, video data and the data islands. When you select this option you can then refine your selection to include or exclude Timing data and Video data. This mode is useful when you want to see all the video, audio, timing and metadata. In this mode the data island, audio sample packets and video component values for each pixel are visible. This mode requires more time for a capture Data Analysis (Only Data Islands) The 980 HDMI Protocol Analyzer will only capture the data islands. It will not capture the video or audio sample packets. This mode enables you to capture more frames of specific types of data islands. For example if you wish to capture only infoframe packets, you can use this mode and capture thousands of frames of data depending on which types of infoframes you capture Protocol Analysis The Protocol Analysis mode will capture the protocol data such as the preamble and guard band data. You will not be able to see the details of the data island, video or audio data. This data is especially useful in debugging failures in the HDMI or MHL source compliance tests for the Protocol tests. 2.6 Getting Started Procedures The getting started procedures involve the following tasks: Downloading, unzipping and launching the 980 GUI Manager application to allow you to operate the 980. (Not required if using the embedded 980 GUI Manager on the built-in display exclusively.) Powering up the 980 HDMI Protocol Analyzer. Establishing a physical connection from the HDMI source device you wish to test and the 980 Protocol Analyzer. (Not required if using the built-in display exclusively) Changing the IP address of the 980 so that it is compatible with your PC and or corporate LAN. (Not required if using the built-in display exclusively) Establishing an initial IP connection from the 980 Manager (residing on your host PC) and the 980 HDMI Protocol Analyzer Downloading and installing the 980 GUI Manager 1. Download the 980 GUI Manager from the Quantum Data downloads page to your PC. The link to the downloads page is: Page 22 February 7, 2013
23 1. From the Quantum Data downloads page, double click on the External Manager link. 2. A dialog box will appear asking you to save the file: The file will be saved in the downloads folder on the PC. Page 23 February 7, 2013
24 3. Double click on the msi file to initiate the download. A dialog box will appear asking you to Run the installer program. 2. Run the installer program. You will be prompted to for the location of the application. Select the installation folder. We recommend installation in the default folder. 3. After installation completes, run the new 980 GUI Manager. It should be available in the Start Menu under All Programs Quantum Data, and also from an icon on your Desktop. 4. Verify that the version number in the title bar matches the version on the website Powering up the 980 Use the following procedures to power up the 980 Protocol Analyzer. 1. If necessary, apply power by toggling the rocker type power switch on the back of the 980. Page 24 February 7, 2013
25 Note: The power switch in the front is used when you are turning off the 980 HDMI Protocol Analyzer for a short period of time. For extended off periods, it is best to power down the 980 HDMI Protocol Analyzer by first using the power button on the front and then the rocker switch on the back. 2. Turn the 980 on by pressing and releasing the power button on the lower portion of the front panel. The following prompt will occur. Select the desired option. Page 25 February 7, 2013

26 Page 26 February 7, 2013
27 2.7 Connection for external 980 GUI Manager This subsection describes the options for connecting the external 980 GUI Manager to the 980 HDMI Protocol Analyzer. In order to operate the 980 HDMI Protocol Analyzer with the 980 GUI Manager you will need to establish a connection between the 980 HDMI Protocol Analyzer and the PC hosting the 980 GUI Manager. The 980 GUI Manager will be running on your laptop or host PC. You will either be connecting directly from the 980 GUI Manager to the 980 HDMI Protocol Analyzer through an Ethernet cable or you will be connecting through your corporate LAN network. If you are connecting directly between your host PC and the 980 HDMI Protocol Analyzer you will need to ensure that the IP addresses of the 980 and the network interface card on your host PC are compatible. To be compatible, the IP addresses must have the same network portions of their IP address but different host portions. You can either change the IP address of the host PC using standard Windows OS techniques or you can change the IP address of the 980. The 980 is provisioned with a default IP address ( ). The procedures for changing the IP address of the 980 are provided in the next subsection. If you are connecting through your corporate LAN, the PC that the external 980 GUI Manager is running on, will typically have an IP address assigned to it through DHCP services. You can either assign an IP address to the 980 directly or allow the network DHCP server to assign one to the 980 that is compatible with your corporate network. To be compatible, the IP address of the 980 must have the same network portion of the IP address as your network but a unique host portion. The 980 is provisioned with a default IP address ( ). The procedures for changing the IP address of the 980 are provided in the following subsection. These procedures also describe how to enable the 980 DHCP client to allow the network to assign an IP address Making the physical Ethernet connections for 980 GUI Manager This section describes how to connect the 980 HDMI Protocol Analyzer to your PC hosting the 980 GUI Manager. This procedure assumes that you have assembled the 980 HDMI Protocol Analyzer and source device under test into your work area. There are three connection scenarios depending on whether you are using the embedded 980 GUI Manager or the external 980 GUI Manager and also depending on whether you are connecting your host PC to the 980 through your corporate LAN or directly. Ethernet connections when using the embedded 980 GUI Manager: There are no Ethernet connections necessary when using the 980 s embedded GUI manager. To make the physical Ethernet connection when using the external 980 GUI Manager when connecting through your corporate LAN or local Ethernet hub: This procedure is used when you are using the external 980 GUI Manager and connecting to the 980 through your corporate LAN network. This procedure is required to establish an IP session between the 980 GUI Manager running on the 980 Protocol Analyzer. This procedure assumes that you have assembled the 980 HDMI Protocol Analyzer, host PC and source device under test and applied power to all these devices. Refer to the procedures and diagrams below. The first diagram shows the Ethernet connections through a LAN or hub for testing an HDMI source. The second diagram shows the Ethernet connections through a LAN or hub for testing an MHL source. The Ethernet connections are the same regardless of whether you are testing HDMI or MHL but examples are shown for both below. Page 27 February 7, 2013
28 Ethernet connection through Hub HDMI example Ethernet connection through Hub MHL example 1. Connect an Ethernet cable from the 980 Ethernet jack on the lower left half of the back panel of the 980 Protocol Analyzer to your corporate LAN. The IP address on this 980 Ethernet port is configurable using the procedures that following. Refer to the diagrams below. 2. Connect an Ethernet cable from your PC hosting the external 980 GUI Manager to your corporate LAN or local Ethernet hub. Page 28 February 7, 2013
29 To make the physical connections using Ethernet Point-to-Point connection with the external GUI Manager: This procedure is used when using the external 980 GUI Manager and connecting to the 980 directly with an Ethernet cable. If you are connecting through your corporate LAN, use the previous procedure. This procedure is required to establish an IP session between the 980 GUI Manager running on the 980 Protocol Analyzer. This procedure assumes that you have assembled the 980 Protocol Analyzer, host PC and source device under test and applied power to all these devices. Refer to the diagrams and procedure below. The first illustration shows a direct Ethernet connection when testing an HDMI source. The second illustration shows a direct Ethernet connection when testing an MHL source. The Ethernet connections are the same regardless of whether you are testing HDMI or MHL but examples are shown for both below. Ethernet direct connection HDMI example Page 29 February 7, 2013
30 Ethernet direct connection MHL example 1. Connect an Ethernet cable from the 980 Ethernet jack on the lower left half of the back panel of the 980 Protocol Analyzer frame to your PC hosting the 980 GUI Manager. The IP address on this 980 port is configurable using the procedures that follow Setting the IP address of the 980 HDMI Protocol Analyzer This procedure describes how to set the IP address of the 980 HDMI Protocol Analyzer. You can change the 980 s IP address through the 980 s front panel touch screen display manually or use the command line. You can also allow the network DHCP server to assign an IP address. These procedures assume that you have powered up the 980 and that the embedded 980 GUI Manager has been launched and established a physical Ethernet connection between the PC hosting the 980 GUI Manager and the 980. To set the IP address of the 980 through the embedded 980 GUI Manager: 1. One option for accessing the Instrument Settings dialog box to set the IP address is to touch select the terminal icon on the lower right corner of the 980 built-in display to access the Connection Properties dialog box to view the current IP address. If the IP address of the 980 is compatible with IP address of your PC and corporate network, no further action is required. Page 30 February 7, 2013

31 2. A second option for accessing the Instrument Settings dialog box to set the IP address is to touch select the Instrument pull-down menu and select Configure. 3. A third option for accessing the Instrument Settings dialog box to set the IP address is from the Main window, touch select the pop-up menu icon on the lower left corner of the 980 built-in display and select Configure Network to access the Instrument Settings dialog box to view the current IP address. Page 31 February 7, 2013

32 The following dialog box appears: 4. If you are wish to allow the 980 s IP address to be set through DHCP services, select the DHCP Checkbox as shown below: Page 32 February 7, 2013

33 5. Alternatively, if you wish to set the IP address without DHCP, touch select the IP address field to access the on-line keyboard which enables you to change the IP address. Edit the IP address and press the Enter key on the on-line keyboard. Note: You will have to deselect DHCP if it is checked in order to access the pop up keyboard. 6. Touch select the Change activation button to initiate the change. You do not have to reboot the 980 for the IP address change to take effect. To set the IP address of the 980 through the command line: 1. Open up a DOS window on your PC. Note: This procedure requires a telnet session. Use standards Windows OS utilities or third party utilities. 2. Establish a telnet session to the 980 using the default IP address as follows: telnet You will be prompted with the Pscope login: prompt. Enter the following for a user name and password: Pscope login: qd Password: qd When the p-scope prompt appears, you will need to execute a command to change its IP address using the following command: Setip <IP_address> <subnet mask> <gateway> Note: You will have to include the subnet mask and gateway address as arguments. Page 33 February 7, 2013

34 The following is an example: p-scope> setip If you wish to use DHCP to set the IP address, use the following command: p-scope> setip dhcp Reboot the 980 by pressing the power button on the lower middle part of the front panel bezel. When the 980 initializes, you will be able to view the new IP address by touch selecting the terminal icon on the lower right corner of the 980 built-in display through the Connection Properties dialog box to view the current IP address Establishing a Management Session between the 980 GUI Manager and the 980 HDMI Protocol Analyzer This procedure describes how to establish a management session between your 980 GUI Manager and the 980. The procedure assumes that you have IP addresses provisioned in the 980 and the PC hosting the 980 GUI Manager and that you have a suitable Ethernet cable connected between the PC and the 980. To establish a management session to the 980: 1. Add your 980 HDMI Protocol Analyzer to the 980 GUI Manager application using the green + icon or the + Add item on the Instrument pull-down menu identified below. Page 34 February 7, 2013
35 The Add Instrument dialog appears enabling you to enter the name and IP information for the 980 that you are trying to connect to (below). 2. Enter the name (any suitable name) and IP address of the 980 that you want to connect to in the Add Instrument dialog box (above) and click on the Add activation button. You will see a series of messages on a dialog boxes describing the progress. One example is shown below: Page 35 February 7, 2013
.")
36 Note: If you receive an Incompatible Software error dialog (below); this means that you should upgrade your 980 with the lastest firmware. The 980 with the IP address you entered appears on the list in the 980 Navigator panel (below). The 980 GUI Manager application will automatically connect to the 980 once you add the 980 to the application. 3. (If not already connected) Connect to the 980 using either the Connect icon or the Connect item on the right click menu as shown in the screen below. Note that you can also double click on the 980 in the Instrument dialog box in order to initiate a connection. Page 36 February 7, 2013

37 A dialog box appears indicating that a connection is in progress: Once the connection is made the information about the connected 980 HDMI Protocol Analyzer is available via the right click menu as shown below. Page 37 February 7, 2013

38 Page 38 February 7, 2013
39 The information is then displayed in a separate window. The information on the Instrument Information window tells you the firmware and hardware release and version information as well as what options you have. This information will be helpful if you call Quantum Data customer support during an upgrade process. Page 39 February 7, 2013
40 2.7.4 Establishing a physical HDMI connection from an HDMI source device under test to the 980 Use the following procedures to connect your HDMI source device to the 980 HDMI Protocol Analyzer. 1. Connect the HDMI-to-HDMI cable provided from your HDMI source device under test to the topmost HDMI connector on the back of the 980 HDMI Protocol Analyzer (labeled Rx). Refer to the picture below. HDMI sink emulation for source analysis using Rev D Protocol Analyzer module Page 40 February 7, 2013
41 HDMI sink emulation for source analysis using Rev C Protocol Analyzer module 2. (For Pass-Through or Encrypted Link Analyzer modes only) You will also connect a second HDMI-to-HDMI cable provided from an HDMI display device to the lower HDMI connector the Tx connector on the back of the 980 HDMI Protocol Analyzer. The procedures for using the Pass Through or Encrypted Link Analyzer mode are provided at: Passively Monitoring between a Source and Sink Device. Refer to the picture below. Page 41 February 7, 2013
42 HDMI connection for pass-through/encrypted Link Analyzer using (Rev D Protocol Analyzer module) HDMI connection for pass-through/encrypted Link Analyzer using (Rev C Protocol Analyzer module) Page 42 February 7, 2013
43 2.7.5 Establishing the MHL 1.2 connections from the MHL 1.2 source device under test to the 980 Use the following procedures to connect your MHL source device to the 980 HDMI Protocol Analyzer. You will use the Quantum Data TPA-MHL-8R Test Point Adapter between the MHL device under test and the 980 HDMI Protocol Analyzer. The general setup is depicted below. To connect an MHL 1.2 source under test to an MHL 1.2 sink device: 1. Connect your MHL source device under test to the TPA-MHL-8R Test Point Adapter. Use the MHL IN FROM DUT connector on the section on the TPA labeled 980 CONNECTIONS SOURCE DUT. Use an MHL compliant cable connecting the HDMI end to the TPA and the micro USB end to the MHL source. 2. Using an HDMI cable, connect the TPA-MHL-8R Test Point Adapter to the 980 HDMI Protocol Analyzer. Connect the HDMI cable to the topmost HDMI connector on the 980 labeled Rx. Use the OUT TO 980 PORT 1 connector on the section on the TPA labeled 980 CONNECTIONS SOURCE DUT. Use an HDMI-compliant cable. Sink emulation connection for MHL 1.2 source analysis (Rev C Protocol Analyzer module) Page 43 February 7, 2013
44 Sink emulation connection for MHL 1.2 source analysis (Rev D Protocol Analyzer module) To connect an MHL 1.2 source device under test to an MHL 1.2 sink device in pass-through mode: 1. Connect your MHL 1.2 source device under test to the TPA-MHL-8R Test Point Adapter. Use the MHL IN FROM DUT connector on the section on the TPA labeled 980 CONNECTIONS SOURCE DUT. Use an MHL compliant cable connecting the HDMI end to the TPA and the micro USB end to the MHL source. 2. Using an HDMI cable, connect the TPA-MHL-8R Test Point Adapter to the 980 HDMI Protocol Analyzer. Connect the HDMI cable to the topmost HDMI connector on the 980 labeled Rx. Use the OUT TO 980 PORT 1 connector on the section on the TPA labeled 980 CONNECTIONS SOURCE DUT. Use an HDMI-compliant cable. 3. Connect an HDMI-to-HDMI cable from the 980 HDMI Tx connector (lower HDMI connector see image below) on the 980 to the connector on the TPA-MHL-8R labeled HDMI IN on the section of the TPA labeled 882 CONNECTIONS SINK DUT. 4. Connect an MHL cable from your MHL 1.2 sink device under test to the connector on the TPA-MHL-8R labeled MHL OUT TO DUT on the section of the TPA labeled 882 CONNECTIONS SINK DUT. Page 44 February 7, 2013
45 Connection for MHL 1.2 Pass-through or Encrypted Link Analyzer (Rev C Protocol Analyzer module) Establishing the MHL 2.0 connections from the MHL 2.0 source device under test to the 980 Use the following procedures to connect your MHL 2.0 source device to the 980 HDMI Protocol Analyzer. You will use the Quantum Data TPA-MHL2-8R Test Point Adapter between the MHL device under test and the 980 HDMI Protocol Analyzer. The general setup is depicted below. To connect an MHL 2.0 source under test to an MHL 2.0 sink device: 1. Connect your MHL 2.0 source device under test to the TPA-MHL2-8R Test Point Adapter. Use the MHL IN FROM DUT connector on the section on the TPA labeled VIDEO ANALYSIS SOURCE DUT. Use an MHL compliant cable connecting the HDMI end to the TPA and the micro USB end to the MHL source. 2. Using an HDMI cable, connect the TPA-MHL2-8R Test Point Adapter to the 980 HDMI Protocol Analyzer. Connect the HDMI cable to the topmost HDMI connector on the 980 labeled Rx. Use the TO PROTOCOL ANALYZER RX connector on the section on the TPA labeled VIDEO ANALYSIS SOURCE DUT. Use an HDMI-compliant cable. Page 45 February 7, 2013
46 Sink emulation connection for MHL 2.0 source analysis (Rev C Protocol Analyzer module) Sink emulation connection for MHL 2.0 source analysis (Rev D Protocol Analyzer module) Page 46 February 7, 2013
47 To connect an MHL 2.0 source device under test to an MHL 2.0 sink device in pass-through mode: Note: For MHL 2.0 using the TPA-MHL2-8R test point adapter, the Pass-Through mode is only supported in MHL Normal mode and only for the TMDS stream; it is not supported in Packed Pixel mode and the CBUS traffic is not passed through. 1. Connect your MHL 2.0 source device under test to the TPA-MHL2-8R Test Point Adapter. Use the MHL IN FROM DUT connector on the section on the TPA labeled VIDEO ANALYSIS SOURCE DUT. Use an MHL compliant cable connecting the HDMI end to the TPA and the micro USB end to the MHL source. 2. Using an HDMI cable, connect the TPA-MHL2-8R Test Point Adapter to the 980 HDMI Protocol Analyzer. Connect the HDMI cable to the topmost HDMI connector on the 980 labeled Rx. Use the TO PROTOCOL ANALYZER RX connector on the section on the TPA labeled VIDEO ANALYSIS SOURCE DUT. Use an HDMI-compliant cable. 3. Connect an HDMI-to-HDMI cable from the 980 HDMI Tx connector (lower HDMI connector see image below) on the 980 to the connector on the TPA-MHL2-8R labeled HDMI IN on the section of the TPA labeled HDMI >MHL - SINK DUT. 4. Connect an MHL cable from your MHL 2.0 sink device under test to the connector on the TPA-MHL2-8R labeled MHL OUT TO DUT on the section of the TPA labeled HDMI >MHL - SINK DUT. Connection for MHL 2.0 Pass-through or Encrypted Link Analyzer (Rev C Protocol Analyzer module) Page 47 February 7, 2013
48 Connection for MHL 2.0 Pass-through or Encrypted Link Analyzer (Rev D Protocol Analyzer module) Page 48 February 7, 2013
49 3 Overview of the 980 GUI Manager (External) 3.1 Overview This chapter describes the 980 Manager panels. The 980 GUI Manager is an application that runs on your local PC. It enables you to examine the data captured by the 980 HDMI Protocol Analyzer through a user friendly graphical interface Main Window An example of the main window configuration of the 980 GUI Manager is shown in the figure below. The 980 HDMI Protocol Analyzer panel can be rearranged and resized using standard windowing control techniques. You can also double click on a panel to enlarge it such that it consumes the entire area of the application. Page 49 February 7, 2013

50 You can specify which panels are open on the main window by selecting them from the View/Show pull-down menu as shown below. Page 50 February 7, 2013
51 You can also double click on a panel to enlarge it such that it consumes the entire area of the application. The result of double clicking on the Data Decode panel is shown below. Note that the icons for the other windows are positioned on the left and right side panels of the application window. Page 51 February 7, 2013
52 You can redisplay any of the panels by double clicking on the icons. You can revert to the default configuration by invoking the Reset Perspective option available in the Window pull-down menu as shown below. Page 52 February 7, 2013

53 3.1.2 Top level menus There are a series of top level menus on the 980 GUI Manager. These are described in the following image and table: Top Level Menu Items Selection Function File Open Save View Info/Text Rename Delete Import... Export... Refresh List Switch Workspace Exit Opens a capture in the GUI. You must select a capture for this option to be available. Saves the EDID that you have created or modified using the EDID Management Editor to the host PC. Enables you to view the information related to a capture or EDID in the Navigator/Data view. Enables you to rename a capture or EDID file. Enables you to delete a capture or EDID file from the 980 Manager application. Enables you to import a file that resides on the 980 Manager host into the 980 Manager application. This can be a capture, ACA data, EDID, or any compliance result. The file must be a zip file. Enables you to export a file that you have highlighted in the 980 Manager. The file is compressed to a zip file. This can be a capture, ACA data, EDID, or any compliance result. Enables you to refreshes the list of captures to remove captures that you have marked for deletion. Also resets the list to the default unexploded view. Browse to store captures in a different capture directory other than the default. Enables you to exit out of the 980 Manager application. EDID Set 980 RX EDID Configures the 980 Rx port with the specified EDID. Read 980 TX EDID View Decoded EDID Add Data Loads an EDID from the HDMI sink device connected to the 980 Tx port. Enables you to view the human readable text of the selected EDID Enables you to add an EDID data element such Page 53 February 7, 2013
54 Top Level Menu Items Selection Function Note: This menu is context sensitive. Its contents depend on whether the EDID Editor Panel is open and being used. Delete EDID Block Delete Selected CEA Data Block or Timing as a CEA extension block or a Video or Data block to the CEA extension block. Deletes a selected EDID block. Deletes a selected CEA data block. Instrument Link Mode Clicking on this item will open up the Mode dialog box enabling set the Link Mode configuration: Sink Emulation Pass-Through Encrypted Link Analyzer. Rx HDCP Settings Rx 5 Volts Add Delete Connect Clicking on this item will open up the Mode dialog box enabling set the Rx HDCP Mode configuration: HDCP Enabled BSTATUS (HDMI or DVI) BCAPS. Brings up a dialog box that enables you to define various parameters related to the 5V source. Shows the current measured voltage level of the source +5V supply. Allows you to set the voltage threshold of the source +5V supply. Reducing the threshold will enable you to test sources whose 5V level is too low. Allows you to set the current load that the 980 applies to the source +5V supply. Increasing the current load will reduce the 5V level from the source. Clicking on this item will open up the Add Instrument dialog box which enables you to define a 980. Note that you can have multiple 980s defined in the 980 GUI Manager. This action is required before connecting to a 980. Enables you do delete the selected 980 instrument. Clicking on this item will initiate a connection to the 980 that is selected in the list. This item will not be highlighted if you have not selected a Page 54 February 7, 2013
55 Top Level Menu Items Selection Function Disconnect 980. Clicking on this item will initiate a disconnection from the 980 that is selected in the list that you are currently connected to. This item will not be highlighted if you have not selected a 980. Information Edit [the Instrument Entry] Configure [Instrument Network] Upgrade GUI Application Upgrade Firmware/ Gateware Upgrade System Components Set 980 License Key Provides information about the 980 that the 980 Manager is currently selected. This information includes: o 980 Name o IP address of the 980 o o o o Netmask Gateway IP address Hardware revisions of the 980 circuit boards Firmware/Gateware version of the release applied to the 980 o Serial number of the 980 o OS version o Licensed options applied to the 980 Enables you to edit certain information about the 980 that you have selected. You can edit the name and IP address. Allows you to view and set the network information such as the 980 IP address, netmask and gateway IP address. Upgrade GUI Application - Enables you to apply an upgrade of the 980 built-in GUI. You can download new GUI release from the Quantum Data website on the downloads page. Upgrade Firmware/Gateware - Enables you to apply an upgrade to the 980. You can download new releases from the Quantum Data website on the downloads page. Upgrade System Components - Enables you to apply an upgrade to the 980 HDMI Source Compliance Test application or any other optional application. You can download new releases from the Quantum Data website on the downloads page. This enables you to activate a license for an Page 55 February 7, 2013
56 Top Level Menu Items Selection Function optional feature you have purchased. When you click on this item, you will browse for a license key file (Qd.lic) that you have obtained from Quantum Data Customer Support. Options Time Stamp Format Nano-Seconds [HHMMSSmsusns] - Time is shown in nanoseconds. The baseline time is the time from the time of the last boot of the 980. View Memory Monitor Micro-Seconds [HHMMSSms.usns] - Time is shown in microseconds. The baseline time is the time from the time of the last boot of the 980. HH:MM:SS.ms.us.ns - Time is shown in relative time meaning the time from the previous event listed. Absolute Base Time - Time for each item is shown from the time of the beginning of the capture. Relative Time - Time is shown in relation to the previous item. Milli-Seconds [HHMMSS.ms] - Time is shown in milliseconds. The baseline time is the time from the time of the last boot of the 980. This is a toggle function which turns on and off the memory monitor. A dialog box appears informing you of the memory monitor status. This menu enables you to display the listed panels as follows: Navigator - Displays the Navigator Panel. Capture Opens up a secondary pull-down menu enabling you to select capture related panels. This is defined further below. Generator Opens up the Generator Panel enabling you to capture files and play them back through the 980 Tx port. ACA Opens up the Auxiliary Channel Analyzer (ACA) panel enabling you to monitor the auxiliary channel transactions such as DDC traffic and CEC messages. Format Editor Not currently used. Format List Editor Not currently used. Image List Editor Not currently used. EDID Editor Opens up the EDID Management Panel. HEAC Opens up the HEAC Panel for monitoring ARC and HEC Page 56 February 7, 2013

57 Top Level Menu Items Selection Function transactions. Console - Displays the Console Panel. Capture Sub-Menu Capture Control - Displays the Capture Control Panel. Reset Perspective Help About the 980 Manager Data Decode - Displays the Data Decode Panel. Event Plot - Displays the Event Plot Panel. Timing Analysis - Displays the Timing Analysis Panel. Video Analysis - Displays the Video Analysis Panel. Data Analysis - Displays the Data Analysis Panel which can either be the AVmute test results of the Audio Analysis test results. Resets the panel configuration to the default view. Provides release and version information about the 980 Manager software components. Page 57 February 7, 2013

58 4 980 GUI Manager (External) Panel Descriptions This section describes the 980 GUI Manager panels in more detail Navigation Panel The 980 Navigator panel provides a set of tabs to access a variety of data sets and panels as shown in the screen example below Navigation Panels and Icons The 980 Navigator panel provides a set of tabs to access a variety of data sets and panels as shown in the screen example below. The windows for these tabs are shown in the following table. The icons associated with these Navigator tabs are described in the table that follows these screens. These icons also appear on the right click menus of the directories where the various data types are stored or the data items themselves. Navigator Tabs - Item Captures Provides access to the list of captures. Associated Icons Connect Enables you to connect to the selected 980, if you have not already established a connection to it. This item will not be available if you have already connected to the selected device. Only appears when the Navigator/Instrument tab is selected. Disconnect Enables you to disconnect from the selected 980, if you have already established a connection to it. This item will not be available if you are not already connected to the selected device. Only appears when the Navigator/Instrument tab is selected. Add a Enables you to add or define a 980 instrument in the 980 Manager application. This is required before connecting to a 980. Only appears when the Navigator/Instrument tab is selected. Edit Instrument Information - Enables you to edit name and IP address of the 980 that you have selected. Only appears when the Navigator/Instrument tab is selected. Compliance Instrument Network Information - Allows you to view and set the network information such as the 980 IP address, Page 58 February 7, 2013

59 Navigator Tabs - Item Provides access to the data for the various compliance tests. Associated Icons subnet mask and gateway IP address. Only appears when the Navigator/Instrument tab is selected. Execute a Capture - Initiates a capture on the selected 980 device. This requires that your source device is connected to the 980 and that it is sending video. Only appears when the Navigator/Capture tab is selected. Transfer data - Opens up the FTP browser enabling you to transfer data to and from the host PC and the 980 instrument. Available for all Navigator tabs except Instruments tab. ACA Provides access to ACA trace files that have been saved. You can open a trace file through the right click menu or the icon associated with it. When you Create new folder - Enables you to create a folder under the highlighted directory. Available for all Navigator tabs except Instruments and ACA tab. Transfer data - Opens up the FTP browser enabling you to transfer data between locations on the host PC. Available for all Navigator tabs except Instruments and ACA tab. Browse - Opens up a window to the folder location of the selected file. Available for all Navigator tabs except Instruments tab. EDID Provides access to EDID files that have been saved. Delete the Selected Capture - Deletes a data item that you have selected. Available for all Navigator tabs except Instruments tab. Information - Provides information about the selected data type and the 980 used to capture the data. Available for all Navigator tabs except Instruments tab. Open [the Selected item] - Loads the selected data item into the 980 Manager for viewing and analysis. Available for all Navigator tabs except Instruments tab. Formats Provides access to format files that have been saved and format library lists that have Open [the Selected item] - Applies the selected data item into the 980 instrument. Available only for the EDID, Formats and Images tabs. Page 59 February 7, 2013

60 Navigator Tabs - Item been configured. Associated Icons Images Provides access to bitmap image files that have been saved and image library lists that have been configured. Instruments Provides access 980s that have been configured through the 980 GUI Manager. Page 60 February 7, 2013

61 Navigation Instruments Panels and Right-Click items The 980 Navigator Instruments panel provides a set of right click functions when a specific 980 instrument is selected. These are described in the following table. Navigator Panel - Item Right click on 980 Instrument Function Link Mode Opens up a dialog box that enables you to set the configuration mode to: 1) Sink Emulation, 2) Pass-Through, 3) Encrypted Link Analyzer. RX HDCP Settings Opens up a dialog box that enables you to set the HDCP mode: 1) Enable/disable HDCP on the 980 Rx port, 2) Set the HDMI status to HDMI or DVI, 3) Set the BCAPS register values. RX 5 Volts - Brings up a dialog box that enables you to define various parameters related to the 5V source. o o Also shows the current measured voltage level of the source +5V supply. Allows one to set the threshold and current load that the 980 applies to the source +5V supply. Connect/Disconnect Enables you to connect or disconnect to the selected 980, if you have not already established a connection to it. This item will not be available if you have already connected to the selected device. [Instrument] Information - Provides information about the 980 that the 980 Manager is currently connected to. This information includes: o 980 Name o IP address of the 980 o o o o Netmask Gateway IP address Hardware revisions of the 980 circuit boards Firmware/Gateware version of the release applied to the 980 o Serial number of the 980 o OS version o Licensed options applied to the 980 Edit Instrument Entry - Enables you to edit certain Page 61 February 7, 2013
62 Navigator Panel - Item Function information about the 980 that you have selected. [Instrument Network] Configure - Allows you to view and set the network information such as the 980 IP address, subnet mask and gateway IP address. Upgrade GUI Application - Upgrade GUI Application - Enables you to apply an upgrade of the 980 built-in GUI. You can download new GUI release from the Quantum Data website. Upgrade Firmware/Gateware - Enables you to apply and upgrade to the 980. You can download new releases from the Quantum Data website. Upgrade HDMI CT Scripts - Enables you to apply and upgrade to the optional HDMI Compliance Test application. You can download new releases from the Quantum Data website. Upgrade System Components - Enables you to apply an upgrade to the 980 HDMI Source Compliance Test application or any other optional application. You can download new releases from the Quantum Data website. Set License Key - This enables you to activate a license for an optional feature you have purchased. When you click on this item, you will browse for a license key file (Qd.lic) that you have obtained from Quantum Data Customer Support Navigation Captures Panels and Right-Click items The 980 Navigator Capture panel provides a set of right click functions when a specific 980 instrument is selected. These are described in the following table. Navigator Panel - Item Right click on 980 Capture Function Export Capture Data - Enables you to export a capture file that resides on the 980 Manager host PC. All captured data is zipped up into a single file. Open [the Selected Capture] - Loads the selected capture into the 980 Manager for viewing and analysis. The Page 62 February 7, 2013
63 Navigator Panel - Item Function capture that is currently loaded has an asterisk next to it. [Capture] Information - Provides information about the selected capture and the 980 used to capture the data: o o o o Creation date and time of the capture. Status of the capture, i.e. was it successful or were there errors. Configuration of the triggering and pre-capture filtering. All information shown above for the Instrument Information. Rename - Enables you to rename a capture file. A useful practice might be to rename the file to include the device tested. Delete [a Capture] - Enables you to delete a capture from the 980 Manager application. Rename Rename the capture file. Capture Listing (Status) Capture Valid - Indicates that the capture completed successfully and all data was saved. Capture Invalid - Indicates that the capture did not complete successfully but there may be some valid data. Red text - Indicates that an error occurred and some or all of the data is not valid. Yellow text Is a warning indicating that at least some of the data is missing. Active Capture * - Indicates that this is the capture that is currently loaded. Page 63 February 7, 2013

64 4.2 Capture Control panel The Capture Control panel enables you to setup the capture parameters. The figure below shows the Capture Control panel and its control and selection items. Page 64 February 7, 2013

65 The following table describes the functions of the Capture Control panel. Capture Control Panel - Function Instrument Selection Item - Description Enables you to select the 980 that you want to use for a capture. Note that in some cases you might have more than one 980 defined in the 980 Manager. Capture Configuration Enables you to define the capture criteria. Use the information below. [Capture] Buffer Size Slidebar [Capture] Buffer Position Slidebar Generate HotPlug on Captured Start Video Check Start Capture (Capture Tab) Data Tab Enables you to set the size of the captured data in percent. This is a slidebar that provides an indication (on the left) of the percent of the total possible size to be captured. A lower value will require less time for the captured data to accumulate. Enables you to set the position of the trigger event within the captured data. This is a slidebar that provides an indication (on the left) of the location of the trigger event within the captured data. The value is expressed as a percent. A value of 0% indicates that the trigger event occurs at the beginning of the resulting captured data and 100% indicates that the trigger event occurs at the end of the resulting captured data. A value of 50% indicates that the trigger event is in the middle of the captured data. Note: The Buffer Position Slidebar is not applicable when you select Vsync as the trigger condition. Causes a hot plug event when the data capture begins, in other words when you click on the Start Capture activation button. Enables you to specify the length of the hot plug pulse in milliseconds. A hot plug pulse, issued by the 980, will reinitiate HDCP authentication if the video content from the source is content protected. Verifies that there is incoming video prior to a capture. Initiates a capture using the criteria defined in the Data, Trigger and Match tabs below. Enables you to specify the type of data that Page 65 February 7, 2013
 - The 980 will capture all the audio packets, video data and the data islands.")
66 Capture Control Panel - Function Item - Description (Capture Tab) Trigger Tab (Capture Tab) you want to capture. This could be: Data Analysis (Audio, Video, Data Island) - The 980 will capture all the audio packets, video data and the data islands. If you select this option you can then refine your selection to include or exclude Timing data and Video data using the associated check boxes under the Analysis heading. Data Analysis (Only Data Islands) - The 980 will only capture the data islands (not the video or audio sample packets) Protocol Analysis The 980 will capture the protocol data such as the preamble and guard band data. You will not be able to see the details of the data island, video or audio data. Enables you to specify the trigger condition that you want to use for the capture. This could be: Vsync Asserted - Capture begins when a vsync control is detected. Encryption Enabled - Capture begins when an encryption enable pulse is detected. Encryption Disabled - Capture begins when encryption is disabled. External Trigger Input - Capture begins when a pulse is detected on the BNC input. Manual Trigger Enables you trigger manually. Typically this would be used when you are observing the behavior of a connected sink and then manually initiate the trigger when a particular symptom exhibits itself. TMDS Clock Change - Capture begins when a change in the TMDS clock is detected. Page 66 February 7, 2013
67 4.2.1 Defining Precision Triggering and Pre-Capture Filtering The 980 Capture Control function has an advanced triggering and pre-capture filtering function which enables you to specify the triggering and pre-capture filtering with a greater degree of detail. These advanced features are configured through the Match functional tab under the Capture tab shown below. Use and operation of this feature is described in section: Using Precision Trigging and Pre-Capture Filtering. Page 67 February 7, 2013
68 4.3 Video Analysis Panel The Video Analysis panel enables you to view the captured video images. It provides thumbnails of each captured frame. It also enables you to navigate to the Data Decode panel to view the transactions for that frame. You can synchronize the Data Decode panel to the Video Analysis panel by pressing the ALT key and clicking on a frame. You can also synchronize by activating the sync button on the upper left side of the Data Decode panel. Once you synchronize the Data Decode panel to a frame you can view the transactions for that frame in the Data Decode panel. You can also perform this action in reverse, i.e. from a particular record in the Data Decode panel you can to that frame in the Video Analysis panel by ALT clicking on the transaction or by activating the synchronization button on the top, right portion of the Data Decode panel. The Video Analysis panel is shown in the screen image below. Note: You cannot view frames of video that are encrypted with HDCP. The Video Analysis panel will show blue thumbnails and the word Encrypted will be shown in the upper left corner of the panel as shown below. Page 68 February 7, 2013
69 Page 69 February 7, 2013
70 4.3.1 Image Viewer The Video Analysis panel enables you view the video pattern or content for a frame in full size by simply double clicking on a frame. The screen below shows the Video Image Viewer for a specific frame. Page 70 February 7, 2013
71 Once you have activated the full view of a frame in the Video Image Viewer panel you can view the pixel values for any pixel by moving your mouse over the pattern. In the example below pixel (x=537, y=184) is selected. Its RGB color values are (R=180, G=16, B=16). If the color space is YCbCr the Video Image Viewer will show these values and indicate the color space. Deep color values are also shown in either YCbCr or RGB color space. You can advance to an adjacent pixel (up/down or left/right) using the thick green arrow buttons on the bottom of the Video Image Viewer panel. You can advance to the image of an adjacent frame (earlier or later) using the thin green arrow buttons / on the bottom of the Video Image Viewer panel. These are shown in the screen image below. Page 71 February 7, 2013
72 4.3.2 Viewing 3D Images You can view captured 3D images in the Video Analysis panel. The 3D images appear adjacent to one another in the window, either side by side or one on top and the other below it for the left and right eyes depending on the 3D structure used. The screen shot below shows an example of a 3D image in the Frame Packing format at 720p60. Note the vertical timing (1470 lines) shown in the heading area just above the top image. Page 72 February 7, 2013
73 4.4 Data Decode Panel The Data Decode panel (shown below) is the primary panel for examining data at the detail level. The example shows data captured in the Data Analysis mode where the audio, video and data islands are captured. Page 73 February 7, 2013

74 The following example shows data captured in the Protocol Analysis mode where the audio, video and data islands are not shown in detail. Page 74 February 7, 2013

75 When you select a packet in the Data Decode panel that packet is highlighted in the Event Plot panel. It is only visible if the Event Plot is zoomed to show each distinct packet. Refer to the screen shot below. The following table describes the activation buttons available through the Data Decode panel. In some cases clicking on these buttons opens up dialog box. These dialog boxes are described in detail following the table. Data Decode Status Icons Function Icons Navigator / Data Segment Large captures are broken into smaller distinct sections called segments to make them more manageable and to improve speed and performance. When you click on the Segment activation button, a dialog box appears enabling you to select and load another segment. This dialog box is described further below. Events The Events activation button enables you to filter the captured data by type. When you click on the Events button a Page 75 February 7, 2013
76 Data Decode Status Icons Function dialog box appears enable you do select or deselect data types individually or a page at a time. This dialog box is described further below. Find The Find activation button enables you to locate captured data by type. When you click on the Find button a dialog box appears enable you do specify a data type to search on. individually or a page at a time. This dialog box is described further below. Sync The Sync activation button enables you to synchronize the Event Plot and the Timing Analysis panels to the data in the Data Decode panel. Details The Details activation button enables you to toggle the view of the Details subpanel. The Details subpanel provides human readable text description of the data of the record that is highlighted. Raw Data The Raw Data activation button enables you to toggle the view of the hex data on and off. Marker icon The Marker icon enables you to flag certain important records for easy identification. You can also flag a record by double clicking on the record. Clear Marker icon The Clear Marker and Clear All icons enable you to clear the flags on specific records or all records. You can also clear the flag on a record by double clicking on the record. There is a vertical scroll bar available on the right side of the Data Decode panel. This enables you to browse through the Data Decode records. The buttons enable you to advance downward or upward one record at a time. The button is a scroll button that you can slide up or down. Page 76 February 7, 2013

77 Page 77 February 7, 2013
78 4.4.1 Working with Segments in the Data Decode Panel Large captures are broken into smaller distinct sections called segments to make them more manageable and to improve speed and performance. When you click on the Segment activation button, a dialog box appears (shown below) enabling you to select and load another segment. This dialog box is shown below. The Selections section on the left lists the segments in the capture. The Details section on the right shows you the packet makeup of the segment as well as the number of packets and the range of packets in the overall capture. From the Selections panel you can select and load a different segment by highlight a segment and then clicking on the Load Segment activation button on the bottom right. You can also select any segment to view its packet contents in the Details panel. If you wish to view the total packets of all segments simply highlight the Totals button. Page 78 February 7, 2013

79 4.4.2 Searching for Data in the Data Decode Panel You can search for data in the Data Decode panel using the search function. The search function is accessible using the magnifying glass icon on the upper left of the Data Decode panel. In the example below, a search for the next occurrence of an AVI infoframe is being initiated. You can specify a search forward (Find Next) or backward (Find Previous). Page 79 February 7, 2013
80 4.4.3 Post-Capture Filter Selection tab The Post-Capture Events button on the Data Decode panel enables you to do the following: Specify the data that you want to view in the Event Plot and Data Decode panels. View the number of packets for each data type and each category of data type. These are shown in parentheses after each data type or on the tab for each category. The screens below show the Post-Capture Decode Event Selection panel and its control and selection items. In this example all items are checked meaning that the Data Decode panel will show all the data captured. Note that you can select or deselect all items on a page with the Select All on Page or Clear All on Page buttons or you can individually select an item. There is a pair of navigation buttons on the right to enable you to see all the tabs in the panel. You can also select and deselect all items on all pages with the Select All and Clear All buttons. Page 80 February 7, 2013
81 Page 81 February 7, 2013
82 4.4.4 Data Decode Record Field Descriptions The Data Decode panel enables you to select the individual protocol transactions (records). When you highlight a transaction, the details for the selected transaction, are shown in the lower panels: There are two lower panels: top and bottom. The top lower panel shows the data for the selected transaction parsed out in human readable form. The bottom panel shows the data for the selected transaction parsed out in hex form. The following table describes the information on the Data Decode panel. Field Packet Timestamp Frame Line Pixel Type SubType Info Function Lists the packet numbers in sequential order beginning from the first packet captured. Timestamp Provides the timestamp in nanoseconds for each transaction since the beginning of the captured data. Lists the frame number of the record. The frame count begins when the capture begins and they are counted sequentially. Lists the line number of the particular frame. Lists the pixel number in the particular line The type of data of the selected record. This could be one of: TMDS or DDC. The sub type of the data for a selected record. This is a more specific designation of the type of data. For example for a Type of TMDS this could be a data island such as an audio sample, infoframe, control signal, etc. A description of the data of a selected line. Page 82 February 7, 2013

83 4.4.5 Data Decode Record Selection and Configuration The Data Decode panel has a right-click menu to define how the timestamp is displayed. This is shown below. The table that follows the screen image defines each option: Right click option Nano-Seconds [HHMMSSmsusns] Micro-Seconds [HHMMSSmsusns] HH:MM:SS.ms.us.ns Absolute Base Time Relative Time Milli-Seconds [HHMMSSms.usns] Description Time is shown in nanoseconds. The baseline time is the time from the time of the last boot of the 980. Time is shown in microseconds. The baseline time is the time from the time of the last boot of the 980. Time is shown in relative time meaning the time from the previous event listed. Time for each item is shown from the time of the beginning of the capture. Time is shown in relation to the previous item. Time is shown in milliseconds. The baseline time is the time from the time of the last boot of the 980. Page 83 February 7, 2013
84 4.5 Event Plot Panel The Event Plot panel (shown below) is the primary panel for locating the data for high level navigation to the detail level provided by the Data Decode panel. The vertical axis is the data types. The Event Plot panel provides a set of data types labeled on the left of the panel that inform you of the type of data for that layer. (You can change this configuration.) The horizontal axis is time. The scale along the bottom of the Event Panel shows the timestamp for each point in time. The example shows data captured in the Data Analysis mode where the audio, video and data islands are captured. Page 84 February 7, 2013
85 The following example shows the Event Plot with data captured in the Protocol Analysis mode where the audio, video and data islands are not shown in detail. The control bits for the preamble are shown and guard band bits for each channel in a given video data period are shown as well Locating Data in the Event Plot Panel The Event Plot enables you to locate data by searching for specific data types, panning, scrolling and zooming using various techniques. You can filter the data by type to limit the amount of data to sift through. You can synchronize the Data Decode and Timing panels to the Event Plot or you can synchronize the Event Plot to the Data Decode panel. A scroll bar is provided to enable you to quickly browse through the data. The scroll bar is under the set of function icons just above the data panel where the data is displayed. You can also scroll to the end, scroll by page or scroll incrementally in either direction using the buttons. See the screen shot below. backward and forward activation Page 85 February 7, 2013

86 4.5.2 Zooming in the Event Plot Panel You can zoom in and zoom out and pan across the data using the slide bars provided. You can also zoom by surrounding a specific section of the captured data. These functions are described in the following table. Even Plot Zoom & Panning Icons Icons Zoom and Panning Function Surround activation button You can select an area of the Event Plot by clicking and dragging across. When you do this the new view will be limited to the horizontal range that you selected. The midpoint of the selection will become the new center of the data displayed. Zoom % The Zoom % function enables you to enter a specific zoom amount in the associated field provided. Zoom In/Out icons The Zoom In/Out function buttons enables you to zoom in and zoom out by clicking on the activation button. The centered point will remain the same. Panning The panning function enables you scan across the data quickly by clicking and dragging. Pointer The pointer icon enables you to click on any point and obtain information such as the data packet type and the timestamp, about that data packet. The information is displayed in a dark panel just above the scroll bar and below the icons. Page 86 February 7, 2013

87 4.5.3 Viewing the Timestamps of the Data The timestamp indicated on the dark status panel just below the icons indicates the location of the scroll bar. When you scroll or pan through the data, the timestamps are shown in the status panel. If you use the pointer tool to select a particular point, the timestamp and data element will be shown in the center of the dark status panel. In the example below, a selection has been made on an AVI infoframe either with the pointer tool or in the Data Decode panel. Page 87 February 7, 2013

88 4.5.4 Surrounding and Zooming The Event Plot provides a Range Zoom tool. You can select an area of the Event Plot by clicking and dragging across. When you do this the new view will be limited to the horizontal range that you selected. The midpoint of the selection will become the new center of the data displayed. The two screens below show an example of surrounding a segment of data. The dotted indicates the resultant section that is surrounded. The second view shows the resulting view. Page 88 February 7, 2013
89 4.5.5 General Controls The various other icons and controls in the Event Plot are described in the tables and screens that follow. Even Plot Icons Function Icons General Control Segment Large captures are broken into smaller distinct sections called segments to make them more manageable and to improve speed and performance. When you click on the Segment activation button, a dialog box appears enabling you to select and load another segment. This dialog box is described further below. Events The Events activation button enables you to filter the captured data by type. When you click on the Events button a dialog box appears enable you do select or deselect data types individually or a page at a time. This dialog box is described further below. Rows The Rows activation button enables you to configure the data types that appears in the Event Plot window. When you click on this icon a dialog box appears enabling you to configure the rows. This dialog box is described further below. Find The Find activation button enables you to locate captured data by type. When you click on the Find button a dialog box appears enable you do specify a data type to search on. This dialog box is described further below. Sync The Sync activation button enables you to synchronize the Data Decode and the Timing Analysis panels to the data in the Event Plot panel. Legend The Legend activation button enables you to view the color coding for the data packets appearing in the Event Plot. When you click on this icon a panel appears enabling you to view the color codes. This panel is shown below. Page 89 February 7, 2013

90 The Event Plot legend panel is shown in the screen shot below. The Event Plot Row configuration dialog panel is shown in the screen shot below. The default configuration is shown below. Simply check the time items that you wish to show in the Event Plot. Then click OK. Page 90 February 7, 2013
91 4.5.6 Working with Segments in the Event Plot Panel The Segments in the Event Plot panel work the same way they do as the Data Decode panel. Large captures are broken into smaller distinct sections called segments to make them more manageable and to improve speed and performance. When you click on the Segment activation button, a dialog box appears (shown below) enabling you to select and load another segment. This dialog box is shown below. The Selections section on the left lists the segments in the capture. The Details section on the right shows you the packet makeup of the segment as well as the number of packets and the range of packets in the overall capture. From the Selections panel you can select and load a different segment by highlight a segment and then clicking on the Load Segment activation button on the bottom right. You can also select any segment to view its packet contents in the Details panel. If you wish to view the total packets of all segments simply highlight the Totals button. Page 91 February 7, 2013

92 4.5.7 Working with Markers The Event Plot panel enables you to view the data at a high level and identify points of interest for further analysis. You can set two cursors or "markers" in the Event Plot panel at particular points of interest. The Event Plot will show you the time difference between the two cursors. You can fine tune the position of the cursors with the left and right arrows associated with each marker. The center icon allows you to center the particular marker on the Event Plot window. The screens below show the markers being set and the resulting markers placed in the Event Plot panel. Note that you can also set the markers using the right click menu also shown below and this is the preferred method because the markers will appear exactly where you right click. You can see the timestamp associated with each marker which are color coded (blue and red) just above the area where the data is shown. The dark text to the right shows the difference in microseconds and pixels between the two markers. Page 92 February 7, 2013

93 Page 93 February 7, 2013
94 4.6 Audio Analysis Panel The Audio (Data) Analysis panel enables you to assess the consistency of the audio metadata. The audio test is a special test. It is executed from the Std Tests tab of the Capture Control panel. The information included in the Audio Analysis listing is defined in the table below. Field Audio InfoFrame Sampling Freq (Fs) Audio InfoFrame Sample Size Audio InfoFrame Channel Count Audio Packetization Audio Clock Regeneration Channel Status Block Audio [type] Channel Status Block Sampling Freq (Fs) Channel Status Block Original Sampling Freq (Fs) Channel Status Channel Count Calculated Sampling Freq (Fs) Audio Clock Regeneration packet rate Function The sampling frequency or rate provided in the audio infoframe. The sample size that is provided in the audio infoframe. The channel count that is provided in the audio infoframe. The sample packets in the audio sample. The CTS and N values in the ACR packet and the sampling frequency or rate that is calculated using those CTS and N values. The audio format read from the channel status bits. The audio format provided in the audio sample packet headers. The sampling frequency or rate that is provided in the channel status bits. The channel count that is provided in the channel status block. The sampling frequency or rate that is calculated based on the audio sample packets captured. The rate at which the ACR packets are arriving. Both the values captured and the expected rate based on the calculation with the pixel rate and the sampling rate. Page 94 February 7, 2013

95 4.7 Timing Analysis Panel The Timing Analysis panel provides timing information about a particular frame and line or for all frames and lines. It tells you if the incoming data is compliant with a known-standard timing. You can toggle the viewing of either the Frame Statistics panel or the Line Statistics panel to show/hide using the Frame Stats and Line Stats activation buttons. The Timing Analysis panel can be synchronized with the other panels such as the Event Plot panel and Data Decode panel by activating the synchronization button on the top, left portion of the Frame and Line Statistics panels of the Timing Analysis panel. There are several quick navigation buttons on the right side of the panel. These enable you to: 1) Move up one line, 2) Move down one line, 3) Move up one page, 4) Move down one page, 5) Move to the top of the capture, 6) Move to the bottom of the capture. The key icon aside a frame indicates that that frame is encrypted. You can sort on any frame or line column in either ascending or descending order by clicking on the column name heading. An up arrow or a down arrow will appear indicating the direction of the sort as show below. Page 95 February 7, 2013
96 The following screen shows and HDMI 4K by 2K format timing. Note: Support for 4K by 2K is only available on the MHz Gen 3 version of the Protocol Analyzer. Page 96 February 7, 2013
97 The following table describes the information on the Timing Analysis panel. Panel Item - Column Description Video Format CEA Name VIC BPP HFreq Interlaced Htotal Vtotal Hactive Hfront Hsync Width VActive Vfront Vsync Width Hsync Polarity Vsync Polarity HToVPulse Delay Pix Freq (MHz) The CEA name of the format that the 980 has detected based on the timing parameters. The CEA Video Identification Code. Number of bits per pixel. The horizontal rate of the format timing. The scan type: No = progressive; Yes = interlaced. The number of pixels in the line including active and blanking. The total number of lines in a frame including active and blanking. The number of active pixels in the line excluding active and blanking. The number of pixels in the front porch portion of blanking. The number of pixels in the horizontal sync pulse width. The number of lines in the active region. The number of lines in the vertical front porch, i.e. the number of lines that occur before the vertical sync pulse. The number of pixels within the vertical sync pulse. The polarity of the horizontal sync pulse: Negative; Positive. The polarity of the vertical sync pulse: Negative; Positive. The number of lines after the active video (leading edge of vertical blanking) before the leading edge of the vertical sync pulse. The pixel rate in Megahertz. Frame Statistics CEA Format The CEA name of the format that the 980 has detected based on the timing parameters. Frame Time Stamp Duration Vfreq (Hz) Indicates the frame number. Timestamp for the beginning of the frame. Provided in nanoseconds in HH:MM:SS:ms:us:ns. Example: 2:0:29:803:393:350 2 Hours; 0 Minutes; 29 seconds; 803 milliseconds; 393 microseconds; 350 nanoseconds. The duration of the frame in nanoseconds. Same format as that shown for Time Stamp above. The rate that a frame is rendered. Page 97 February 7, 2013
98 Panel Item - Column Description Hfreq (khz) Vtotal Vactive Pix Freq (MHz) Hsync Width Vsync (width) Start Video Line HToVDelay Encryp Start Pixel Encryp Pulse Line Encryp Length The rate that a line in a frame is rendered. The total number of lines in the vertical frame. The number of lines in the vertical resolution. The pixel rate of the format. The number of pixels in the horizontal sync pulse. The number of lines in the vertical sync pulse. The line that the active video begins on. The delay in pixels between the horizontal and vertical sync pulse. The pixel in the line that the encryption enable pulse begins on. The line that the encryption enable pulse occurs on. The length of the encryption enable pulse in pixels. Line Statistics Frame The frame number in the captured data. Line Time Stamp Duration Htotal TMDS HTotal Hsync Width Hback HActive The number of a particular line in the frame. Timestamp for the beginning of the frame. Provided in nanoseconds in HH:MM:SS:ms:us:ns. Example: 2:0:29:807:126:843 2 Hours; 0 Minutes; 29 seconds; 807 milliseconds; 126 microseconds; 843 nanoseconds. The duration of the frame in nanoseconds. Same format as that shown for Time Stamp above. The total number of pixels in a line including blanking. The total number of clock cycle in a line including blanking. The number of pixels in the horizontal sync pulse. Horizontal back porch delay. The total number of pixels in the active video. Page 98 February 7, 2013
99 4.8 EDID Editor Panel The EDID Editor panel enables you to modify existing EDIDs or create new ones through a graphical interface. You can import.xml-based EDID files from your PC for use on the 980 HDMI Protocol Analyzer Rx port. In this way you can emulate any EDID in the 980 HDMI Protocol Analyzer to ensure that your source responds correctly to it. 4.9 Opening up the EDID Editor You may have many EDIDs stored in the EDID directory of the external GUI Manager suite of directories. You can open any one of these EDIDs, modify it and resave it under a different name. To open an EDID stored on your host PC: 1. Enable the EDID Editor through the View menu (below). Page 99 February 7, 2013
100 The EDID Editor will then appear in the set of tabs in the GUI as shown below. Page 100 February 7, 2013

101 Page 101 February 7, 2013

102 4.10 Loading an EDID into the EDID Editor You can either load a new EDID or modify and existing EDID. In the later case, you may have many EDIDs stored in the EDID directory of the external GUI Manager suite of directories. You can open any one of these EDIDs, modify it and resave it under a different name. To open a new EDID: 1. Select New EDID from the EDID pull-down/edit menu. To open an EDID stored on your host PC: 2. Access the EDID tab under the Navigator tab as shown below. Page 102 February 7, 2013

103 Note: You must have downloaded EDIDs or saved EDIDs into the EDID directory in order to see them in the EDID navigator tab shown above. You can use the Quantum Data EDID Library to obtain these EDIDs. The EDID Library which uses a naming convention for all its EDIDs; these are represented in the screen shot above. Also note that there is a 980 EDID Library Application Note available on the EDID Library website which describes how to use the EDID Library with the 980 HDMI Protocol Analyzer. Once you load an EDID the name appears on the status strip on the top of the panel as shown below. Page 103 February 7, 2013
104 4.11 Making Modifications to an EDID with the EDID Editor Once you have loaded an EDID you can make changes to individual field values, add data blocks, delete data blocks, add or delete timings or audio formats supported, etc. You can enable or disable parameters using radio buttons or check boxes and you can change values through pull-down menus or text field boxes. To make a change to an EDID loaded into the EDID Editor: 1. To add a block into an EDID, use the pull-down menus as shown below (adding a Video Data Block into the CEA Extension block): Page 104 February 7, 2013

105 2. Select the block of EDID data that you wish to view or modify using the EDID Elements list on the left of the EDID Editor panel. Examples below. Page 105 February 7, 2013

106 Page 106 February 7, 2013
107 3. Once you make a change on a particular EDID block you use the Apply button to invoke the change. Page 107 February 7, 2013
108 Item Item - Column Description EDID Edit Append CEA Block Adds a CEA extension block to the existing VESA block. Append CEA DTD Add CEA Speaker Allocation Data Block Add CEA Colorimetry Data Block Add CEA Video Capability Add CEA Audio Data Block Add CEA Video Data Block Add CEA Vendor Specific Data Block - General Add CEA Vendor Specific Data Block - HDMI Insert CEA Vendor Specific Audio Data Block Add CEA Vendor Specific Video Data Block Delete Element Adds a CEA Detailed Timing Data block. Enables you to add a new Speaker Allocation Data Block to the CEA extension block. Enables you to add a new Colorimetry Data Block to the CEA extension block. Enables you to add a new Video Data Block to the CEA extension block. Enables you to add a new Audio Data Block to the CEA extension block. Enables you to add a new Video Data Block to the CEA extension block. Enables you to add a new Vendor Specific Data Block to the CEA extension block. Enables you to add HDMI information to new Vendor Specific Data Block to the CEA extension block. Enables you to add a new Vendor Specific Audio Data Block to the CEA extension block. Enables you to add a new Vendor Specific Video Data Block to the CEA extension block. Deletes a selected EDID element or block. Page 108 February 7, 2013
109 4.12 Emulating a Specific EDID Once you have loaded an EDID and made your changes it to it you can assign it to the980 HDMI Protocol Analyzer Rx port for emulation and testing your source device. This subsection describes how you can do that. To assign an EDID to the Rx port: 1. Use the EDID pull-down menu and select Set 980 Rx EDID. The dialog box shown below opens up. Page 109 February 7, 2013
110 2. Select an EDID to assign to the 980 HDMI Protocol Analyzer s Rx port. Click Ok after selecting the EDID. Note that there are two checkbox options on the dialog box. The following is a description of each: Permanently set the 980 HDMI Protocol Analyzer s EDID This means that the EDID that you provision will persist through a reboot of the 980. Otherwise the default 980 EDID will be reprovisioned when a reboot occurs. Issue Hot Plug This means that the 980 HDMI Protocol Analyzer will issue a hot plug when you click the OK activation button on this dialog box. Page 110 February 7, 2013
111 5 Real Time Mode This chapter describes how to view the incoming HDMI and MHL video metadata in real time using the Real Time mode. The Real Time mode is only available through the built-in front panel display. It is not supported through the external 980 GUI Manager. The Real Time mode enables you can view the following data in real time: Video View the incoming video even when encrypted with HDCP. Infoframes View the AVI, Audio, Vendor Specific infoframes. Data Islands View various other data islands such as General Control Packet and Source Product Descriptor. Video Timing Data View the format, resolution, color depth, video type and specific pixel values. DDC Data View the DDC transactions such as the EDID and HDCP transactions and CEC messaging. MHL C-Bus Data View the MHL C-Bus data which includes EDID and HDCP transactions and hot plug events. 5.1 Accessing the Real Time mode When you boot up the 980, the 980 HDMI Protocol Analyzer Real Time mode will be displayed by default. However once you have selected to view the Capture mode, you can navigate back to the Real Time using the procedure below. It assumes that you have an HDMI cable connected from your HDMI source device and the 980 HDMI Protocol Analyzer and that your source device is outputting HDMI video. To enable the Real Time mode: 4. Select the Real Time mode on the built-in front panel by touch selecting the View pull-down menu and selecting the Receiver item. 5. From the Home screen (below) you can access the Real Time mode by selecting the Receiver item. Page 111 February 7, 2013
112 Page 112 February 7, 2013
113 5.2 Real Time Mode Overview This section describes the Real Time mode user interface Real Time Mode - Interface Description This subsection describes the functions of the main interface of the Real Time mode. The Real Time mode interface is shown in the two example screens below. The first screen image shows the Real Time mode without any of the viewing windows open. This screen shows you the Real Time mode with only the main control panel on the right and the dashboard on the left and the incoming video image. The second screen example shows the Real Time mode with several data panels open. The table that follows describes the main control panel. Page 113 February 7, 2013

114 Page 114 February 7, 2013
115 5.2.2 Dashboard Panel This subsection describes the dashboard components on the top of the Real Time panel. Refer to the table below for a description of these components. Real Time Mode Dashboard Items The following items are on the Real Time dashboard: Top Row Items Module and Port: Port The Port area shows the current Rx port that is being displayed on the Real Time Mode. Currently the only analyzer port is the 980 HDMI Protocol Analyzer port. Card The Card area shows the current module whose port is being displayed on the Real Time Mode HDMI Protocol Analyzer module.. Currently the only analyzer module (card) is the 980 Second Row Items - Mode: Monitor The Monitor area indicates what mode the module is in. In the example here the 980 HDMI Protocol Analyzer module is in the HDMI monitoring mode. The other option is MHL. Mode The mode field provides an indication of the configuration the module is in. In the example here, the 980 HDMI Protocol Analyzer is in the Sink Emulation mode. The other options are Pass-through and Encrypted Link analyzer. HDCP The HDCP-related fields provide an indication of the HDCP status on all active ports. This will vary depending on the mode (sink emulation, pass-through, encrypted link analyzer). In the example here, HDCP is active on the Rx port and not active on the Tx port. This is what you would expect when the 980 HDMI Protocol Analyzer is in the Sink Emulation mode with an HDMI HDCP protected stream coming into the analyzer port. If the module were in the Encrypted Link Analyzer mode both the Rx an and the Tx indications would be green. The + or sign after the port indicates if the authentication is successful. The Ri field indicates the number of Ri values exchanged since the monitoring began. Third Row Items - Mode: Video Identification (format) The first item indicates the video identification code (if there is one). If the incoming video is not determined to be a CEA format, there will be an indication of CEA VIC 0 and a note: No Video Identification Code Available. Resolution. The next item is the active horizontal and vertical resolution. In this example the format is 1080i so the vertical lines are indicated per field. Scan. The next item is the scan. In this example the field indicates Interlaced. The other option is Progressive. Bit Depth and Video colorimetry. The next item is the bit depth and video mode. In this example the field indicates YCbCr with 4:4:4 sampling and 24 bit color depth options are: RGB, YCbCr 4:2:2 and deep color at either 30 or 36 bit color depth.. The other Page 115 February 7, 2013
116 Real Time Mode Dashboard Items HDCP Status. The next item is HDCP status which could either be Encrypted or Not Encrypted. TMDS Mode. The next item is TMDS mode which is either HDMI, DVI or MHL Main Control Panel This subsection describes the main control panel for the Real Time mode. Refer to the table below for a description of these controls. Real Time Mode Main Control Panel Main Control Panel (two views Active / Inactive) Control Button Descriptions The following controls are provided in the main control panel on the right edge of the Real Time mode interface. Each of the buttons have a pulldown menu associated with them. The purpose of each button and their basic control functions are described below: Start/Stop The Start / Stop button / is used to enable and disable the active collection of real time data. Video The video button and associated pulldown menu (not shown) is used to display the Video Info panel which provides timing, resolution and other basic information about the incoming video. Scale The Scale button and associated pulldown menu (not shown) enables you to control how the video image is displayed in the Real Time mode window. AVI-IF - The AVI-IF button and associated pulldown menu (not shown) enables you to show or hide the AVI info panel and pause and resume updates to the panel. It also enables you to control which set of data serves as a Reference Frame of data that can be used for comparisons with subsequent frames collected. VS-IF - The VS-IF button and associated pulldown menu (not shown) enables you to show or hide the Vendor Specific infoframe info panel and pause and resume updates to the panel. It also enables you to control which set of data serves as a Reference Frame of data that can be used for comparisons with subsequent frames collected. GCP - The GCP button and associated pulldown menu (not shown) enables you to show or hide the General Control Packet panel and pause and resume updates to the panel. It also enables you to control which set of data serves as a Reference Frame of data that can be used for comparisons with subsequent frames collected. User - The User button and associated pulldown menu (not shown) enables you to select other packet types (Audio infoframe, Source Product Page 116 February 7, 2013
117 Real Time Mode Main Control Panel Control Button Descriptions Descriptor and MPEG infoframe) for viewing. Once the type of user specific data is selected you can choose to show it or hide it, and pause and resume updates to the panel and control which set of data serves as a Reference Frame of data that can be used for comparisons with subsequent frames of that type that are collected. Back - The arrow button enables you to toggle between the current view and the previous view. Mode - The Mode button opens up dialog boxes that enable you to select the operating mode of the 980. You can control the pass through modes and HDCP modes. Tools - The Tools button provides access to various tools such as Set EDID management. Page 117 February 7, 2013

118 5.3 Real Time Mode Data Panels This section describes the Real Time controls and data panels. The Real Time mode is only available through the embedded GUI. It is not available through the external 980 GUI Manager. Note: Detailed procedures for operating the 980 HDMI Protocol Analyzer through the built-in GUI are provided in the 980 Quick Start Guide Reference Frames Concept The 980 HDMI Protocol Analyzer Real Time feature uses the concept of Reference Frames which are sets of data values that you can compare with other collected frames of data of the same type. As you collect data in the Real Time mode, the feature will create a distinct view for each change in the source stream for that specific data type. For example, if you have opened up the AVI infoframe panel, a change in any data that is part of the infoframe, such as the video type (RGB, YCbCr), will result in a new distinct view of the data. By default, the Real Time mode establishes the initial data set as the Reference Frame. The initial view is the view of data that occurs when you open up a panel or when you initiate a Clear operation. You can change the Reference Frame at any time using a pull-down menu. The data in all other views is compared against the data in the Reference Frame. Differences are highlighted in gold text Zoom Feature Because the Real Time mode can only be viewed in the embedded 980 GUI where screen real estate is limited, the interface has a zoom feature for setting the viewing size of each dialog box. The zoom feature enables you to set the viewing size if a data panel to any of three settings: 1) Small, 2) Medium, and 3) Large. The zoom dialog box is accessible from the upper right corner of each panel. Simply touch select the desired checkbox. The following image depicts a typical zoom dialog box. Page 118 February 7, 2013
119 5.3.3 Image Scale Dialog Box The incoming video content, whether it be full motion video or a basic test pattern, is shown in the window (refer to the screen examples above). You can control the way the incoming video is displayed using the Video pop-out dialog box on the right side control panel. When you select the Scale button of this pop-out menu, the Image Scale dialog box appears. The control features of the Image Scale dialog box are described in the following table. Real Time Mode Image Scale Image Scale dialog box Controls The following controls are provided in the Image Scale dialog box. These controls determine how the incoming video is displayed in the Real Time main window. Mode The Mode can be either 1:1 or Full. Use the checkbox adjacent to each item to select. The 1:1 selection will show the image in its true size; because the Real Time window on the built-in front panel display does not support higher resolutions, much of the content will not be viewable in the window when 1:1 is selected. The Full mode enables you to view the entire image. When Full is selected you can also select which Aspect Ratio setting to use. Quality The Quality setting determines the frame rate used to show the incoming video. Selecting Low reduces the frame rate. The High selection will display the video in its native frame rate. Aspect Ratio The Aspect Ratio options can be set only if the Mode is set to Full. The Fit option will cause the image to be scaled such that it occupies the entire window. The H:V option will display the image at its native aspect ratio with letter boxing used to fill in the blank area. The 4:3 option will cause the image to scale to a 4:3 aspect ratio. The 16:9 option will cause the image to be scaled to 16:9. Page 119 February 7, 2013
 Information The following information is provided in the Video Timing dialog box: VIC The Video Identification")
120 5.3.4 Video Timing Panel The Video Timing panel (shown below) enables you to view basic video information of the incoming video content. The table below describes the information in this panel. Real Time Mode Video Timing Video Timing panel (shown left side and right side below) Information The following information is provided in the Video Timing dialog box: VIC The Video Identification Code is the CEA number assigned to a particular timing. Resolution - The horizontal and vertical resolution is shown. In this example the resolution is 720 by 480. Scanning mode The scanning mode is indicated; either progressive or interlaced. In the example the scanning mode is progressive. Aspect Ratio The aspect ratio is provided on the top line. In this example the aspect ratio is 16:9. Color depth The color depth is provided in bits per pixel. In this example the color depth is 24 bits per pixel. The Color mode and sampling is provided. In this example the color mode is YCbCr with 4:4:4 sampling. Other options are RGB and YCbCr 4:2:2. Colorimetry standard The colorimetry standard is presented on the third line. In this example the standard is ITU-709. Timing Data The horizontal and vertical timing parameters are shown. Page 120 February 7, 2013
121 5.3.5 Video Info Panel The Video Color panel (shown below) enables you to view the pixel values of the incoming video content. The table below describes the information in this panel. Real Time Mode Video Color Video Color panel Information The following information is provided in the Video Timing dialog box: Pixel and pixel values The pixel x/y coordinates and the color values for any selected pixel are shown in their format RGB or YCbCr. There are a series of arrows on the bottom of the Video Info dialog box. These arrows are described below: Up Arrow The up arrow enables you to move up to an adjacent pixel to view its color components. Down Arrow The down arrow enables you to move down to an adjacent pixel to view its color components. Left Arrow The left arrow enables you to move left to an adjacent pixel to view its color components. Right Arrow The right arrow enables you to move right to an adjacent pixel to view its color components. Page 121 February 7, 2013

122 5.3.6 AVI Infoframe Panel The AVI-IF button to open up the AVI panel (shown below). The AVI panel enables you to view the AVI infoframe data. There is a control pull down menu associated with the AVI Info panel. The control menu can be accessed either from the panel itself (the pull down tab on the upper right corner) or from the AVI-IF button on the main control panel on the right side of the Real Time window. The table below describes the information in the AVI Info panel and the associated control menu. Real Time AVI Infoframe AVI Infoframe Information / Function The following information is provided in the AVI Infoframe dialog box: Checksum Calculation of a checksum to ensure integrity of the data. Scan Info Indicates whether there is any underscan or overscanning applied to the video. Active info Indicates whether the Active Format Descriptor is information is valid. RGB/YCC indicator Indicates whether the incoming video is in the RGB mode or the YCC mode and what sampling mode is used with YCC (YCbCr 4:4:4 or 4:2:2) Active format Active format aspect ratio. Picture aspect ratio The aspect ratio of the video format transmitted. Colorimetry The colorimetry standard used; typically ITU-601 or ITU-709. Non-uniform scaling Indicates if the picture has been scaled vertically and/or horizontally. Quantization range Indicates the range of values for defining the data is limited or full. IT content Indicates when the picture content is composed in accordance with common IT practices. Video format The CEA video identification code (VIC) and the resolution and frame rate. Pixel repetition Indicates to the DTV how many of each unique pixels are transmitted. Line number of end of top bar. Line number of start of bottom bar. Pixel number of end of left bar. Pixel number of start of right bar. Page 122 February 7, 2013
123 Real Time AVI Infoframe AVI Pulldown Menu Upper Status Bar Pause mode Information / Function There is a pulldown menu associated with the AVI Info panel. You can access either from the main control panel or from the AVI panel via the icon on the upper right of the panel. The AVI pulldown menu provides the following functions: Show/Hide Enable or disable the appearance of the AVI infoframe panel in the Real Time window. Pause/Start Halt the updates of the data to the AVI panel or Start collection. Clear Clear the currently displayed reference frame. Set Ref Set a new reference frame. The upper status bar shows the following information from left to right: The pause/resume (active) status. Resume (active) mode The type of data panel (e.g. AVI). The number of changes defined since you set the reference frame. The number of distinct data views in parentheses. The total number of frames captured since the panel was opened or since the last clear. Lower Control Panel Pause mode Pause mode after going to the reference frame Resume (active) mode The lower control panel enables you to control and view the following: Set the pause/resume (active) status. Go to the Reference Frame (must be in paused mode). Navigate left or right through the distinct data views (must be in pause mode). The data view currently displayed. This field shows Reference if you are at the reference frame. The number of distinct data views. Page 123 February 7, 2013
124 5.3.7 VS-IF Infoframe Panel The VS-IF button opens up the VS-IF panel (shown below). The VS-IF panel enables you to view the Vendor Specific infoframe data. There is a control pull down menu associated with the VS-IF panel. The control menu can be accessed either from the panel itself (the pull down tab on the upper right corner) or from the VS-IF button on the main control panel on the right side of the Real Time window. The table below describes the information in the AVI Info panel and the associated control menu. Real Time VS-IF Vendor Specific Infoframe VS-IF Pulldown Menu Information / Function The following information is provided in the Vendor Specific Infoframe dialog box: Length The length in hex of the Vendor Specific infoframe. Checksum A checksum to verify the integrity of the infoframe. Registration ID IEEE Registration ID HDMI Video Format Provides additional information such as 4K by 2K or 3D format structure. 3D Structure This is the 3D format structure used. This could be one of: Frame Packing, Field Alternative, Line Alternative, Side-by-Side (Full), L + depth, L + depth + Graphics-Depth, Side-by-Side (half) 3D Extra Data Applies when the 3D structure is Side-by-Side (half). Indicates the horizontal sub-sampling and Quincunx matrix. 3D Meta Data Indicates whether 3D metadata is present or not. There is a pulldown menu associated with the VS-IF Info panel. You can access either from the main control panel or from the VS-IF panel via the icon on the upper right of the panel. The AV-IF pulldown menu provides the following functions: Show/Hide Enable or disable the appearance of the VS-IF infoframe panel in the Real Time window. Pause Halt the updates of the data to the VS IF panel. Clear Clear the currently displayed reference frame. Set Ref Set a new reference frame. Page 124 February 7, 2013
125 Real Time VS-IF Upper Status Bar Pause mode Information / Function The upper status bar shows the following information from left to right: The pause/resume (active) status. Resume (active) mode The type of data panel (e.g. VS-IF). The number of changes defined since you set the reference frame. The number of distinct data views in parentheses. The total number of frames captured since the panel was opened or since the last clear. Lower Control Panel Pause mode Pause mode after going to the reference frame Resume (active) mode The lower control panel enables you to control and view the following: Set the pause/resume (active) status. Go to the Reference Frame (must be in paused mode). Navigate left or right through the distinct data views (must be in paused mode). The data view currently displayed. The number of distinct data views. Page 125 February 7, 2013

126 5.3.8 General Control Packet Data Panel The GCP (General Control Packet) button opens up the GCP panel (shown below). The GCP panel enables you to view the General Control Packet data. There is a control pull down menu associated with the GCP panel. The control menu can be accessed either from the panel itself (the pull down tab on the upper right corner) or from the GCP button on the main control panel on the right side of the Real Time window. The table below describes the information in the GCP Info panel and the associated control menu. Real Time General Control Packet General Control Packet Information / Function The following information is provided in the General Control Packet data island dialog box: AVmute flag (clear/set) Identifies whether the AVmute is set or cleared. Color depth Indicates the color depth in bits per pixel Pixel packing phase Indicates the pixel packing phase of the last pixel character sent prior to the GCP when the source is transmitting deep color. GCP Pulldown Menu Upper Status Bar Resume (active) mode There is a pulldown menu associated with the GCP Info panel. You can access either from the main control panel or from the GCP panel via the icon on the upper right of the panel. The GCP pulldown menu provides the following functions: Show/Hide Enable or disable the appearance of the GCP panel in the Real Time window. Pause Halt the updates of the data to the GCP panel. Clear Clear the currently displayed reference frame. Set Ref Set a new reference frame. The upper status bar shows the following information from left to right: The pause/resume (active) status. Pause mode The type of data panel (e.g. GCP). The number of changes defined since you set the reference frame. The number of distinct data views in parentheses. Page 126 February 7, 2013
127 Real Time General Control Packet Information / Function The total number of frames captured since the panel was opened or since the last clear. Lower Control Panel Pause mode The lower control panel enables you to control and view the following: Set the pause/resume (active) status. Pause mode after going to the reference frame Resume (active) mode Go to the Reference Frame (must be in paused mode). Navigate left or right through the distinct data views (must be in paused mode). The data view currently displayed. The number of distinct data views User: Type Selection Panel The User: Type dialog box enables you to active additional data panels. The table below describes these panels. Real Time User: Type Selection User Type Selection Information / Function The following information is provided in a pop-up menu when you select User: Show/Hide Enable or disable the appearance of the panel that you have selected from the Type Selection dialog box. Type Opens up the Type Selection panel. Pause Halt the updates of the data to the GCP panel. Clear Clear the currently displayed reference frame and reset the captured frames. Set Ref Set a new reference frame for the panel that you have selected from the Type Selection dialog box. The following selection options are available from the DI (Data Island) Type Selection panel. You can only select one of the following panels: Audio Clock Regeneration Selects the Audio Clock Regeneration panel to check on the N & CTS values. Audio Content Protection Selects the Audio Content Protection panel. ISRC1 - Selects the ISRC1 panel. ISRC2 - Selects the ISRC2 panel. Page 127 February 7, 2013
128 Real Time User: Type Selection Information / Function Gamut Metadata Selects the Audio Clock Regeneration panel. Infoframes SPD Infoframe Selects to Source Product Descriptor (SPD) InfoFrame. Audio Infoframe Selects the Audio Infoframe panel. MPEG Infoframe Selects the MPEG Infoframe panel. User Defined Match Custom This check box activates the associated Edit dialog box. Edit Opens up the Data Island Match Editor which enables you to define specific match criteria for viewing. Page 128 February 7, 2013

129 User: Audio Infoframe Panel The User AUD (Audio Infoframe) button opens up the AUD panel (shown below). The AUD panel enables you to view the Audio Infoframe data. There is a control pull down menu associated with the AUD panel. The control menu can be accessed either from the panel itself (the pull down tab on the upper right corner) or from the User: AUD button on the main control panel on the right side of the Real Time window. The table below describes the information in the AUD Info panel and the associated control menu. Real Time User: Audio Infoframes Audio Infoframes Audio Infoframe Pulldown Menu Information / Function The following information is provided in the Audio Infoframe data dialog box: [Audio] Coding type Indicates the audio format such as AC-3, DTS, One Bit Audio, Dolby Digital, etc. Refer to Stream Header indicates that this information is carried in the audio stream. Channel Count Indicates the number of audio channels. Sampling frequency Indicates the sampling frequency which can be 32, 44.1, 48, 88.2, 96, or 192kHz. Refer to Stream Header indicates that this information is carried in the audio stream. Sample size Indicates the sampling size which is 16, 20 or 24 bit. Refer to Stream Header indicates that this information is carried in the audio stream. Channel speaker allocation Applies only to multichannel LPCM audio. Describes how various speaker locations are allocated to transmission channels. Level shift value Indicates how much attenuation is applied. Range of values are: 0dB to 15dB. Down mixed stereo out - Applies only to multichannel LPCM audio. Indicates how much the source had attenuated the audio during the down-mixing operation. There is a pulldown menu associated with the audio infoframe panel. You can access either from the main control panel or from the audio infoframe panel via the icon on the upper right of the panel. The audio infoframe pulldown menu provides the Page 129 February 7, 2013
130 Real Time User: Audio Infoframes Information / Function following functions: Show/Hide Enable or disable the appearance of the audio infoframe panel in the Real Time window. Type You can select/change which type of User data you want to display. Pause Halt the updates of the data to the audio infoframe panel. Clear Clear the currently displayed reference frame. Set Ref Set a new reference frame. Upper Status Bar Pause mode The upper status bar shows the following information from left to right: The pause/resume (active) status. Resume (active) mode The type of data panel (e.g. AUD IF). The number of changes defined since you set the reference frame. The number of distinct data views in parentheses. The total number of frames captured since the panel was opened or since the last clear. Lower Control Panel Pause mode Pause mode after going to the reference frame Resume (active) mode The lower control panel enables you to control and view the following: Set the pause/resume (active) status. Go to the Reference Frame (must be in paused mode). Navigate left or right through the distinct data views (must be in paused mode). The data view currently displayed. The number of distinct data views. Page 130 February 7, 2013

131 User: Source Product Descriptor Infoframe Panel The User SPD (Source Product Descriptor) check box in the DI Type Selection opens up the SPD Infoframe panel (shown below). The SPD Infoframe panel enables you to view the Source Product Descriptor Infoframe data. There is a control pull down menu associated with the SPD Infoframe panel. The control menu can be accessed either from the panel itself (the pull down tab on the upper right corner) or from the User: SPD button on the main control panel on the right side of the Real Time window. The table below describes the information in the SPD Info panel and the associated control menu. Real Time User: SPD Infoframes Source Product Descriptor Infoframes Information / Function The following information is provided in the Source Product Descriptor Infoframe data dialog box: Vendor Name The vendor s name. Product Description The vendor supplied description of the product. Source information This is the product type of the source, sink or repeater. In this example it is a digital STB. SPD Pulldown Menu Upper Status Bar Resume (active) mode There is a pulldown menu associated with the SPD Info panel. You can access either from the main control panel or from the SPD panel via the icon on the upper right of the panel. The SPD pulldown menu provides the following functions: Show/Hide Enable or disable the appearance of the SPD panel in the Real Time window. Type You can select/change which type of User data you want to display. Pause Halt the updates of the data to the SPD panel. Clear Clear the currently displayed reference frame and reset the captured frames. Set Ref Set a new reference frame. The upper status bar shows the following information from left to right: The pause/resume (active) status. Pause mode The type of data panel (e.g. SPD IF). Page 131 February 7, 2013
132 Real Time User: SPD Infoframes Resume (active) mode Information / Function The number of changes defined since you set the reference frame. The number of distinct data views in parentheses. The total number of frames captured since the panel was opened or since the last clear. Lower Control Panel Pause mode Pause mode after going to the reference frame Resume (active) mode The lower control panel enables you to control and view the following: Set the pause/resume (active) status. Go to the Reference Frame (must be in paused mode). Navigate left or right through the distinct data views (must be in paused mode). The data view currently displayed. The number of distinct data views. Page 132 February 7, 2013

133 User: Audio Clock Regeneration (ACR) Panel The User ACR (Audio Clock Regeneration) check box in the DI Type Selection opens up the ACR panel (shown below). The ARC panel enables you to view the Audio Clock Regeneration data. There is a control pull down menu associated with the ACR panel. The control menu can be accessed either from the panel itself (the pull down tab on the upper right corner) or from the User: Type button on the main control panel on the right side of the Real Time window. The table below describes the information in the ACR Info panel and the associated control menu. Note: Typically not all packets will be collected. You may see an indication of dropped packets. Real Time User: ACR Packet Audio Clock Regeneration Packet ACR Pulldown Menu Upper Status Bar Resume (active) mode Information / Function The following information is provided in the Source Product Descriptor Infoframe data dialog box: Vendor Name The vendor s name. Product Description The vendor supplied description of the product. Source information This is the product type of the source, sink or repeater. In this example it is a digital STB. There is a pull-down menu associated with the ACR Info panel. You can access either from the main control panel or from the ACR panel via the icon on the upper right of the panel. The ACR pull-down menu provides the following functions: Show/Hide Enable or disable the appearance of the ACR panel in the Real Time window. Type You can select/change which type of User data you want to display. Pause Halt the updates of the data to the ACR panel. Clear Clear the currently displayed reference frame. Set Ref Set a new reference frame. The upper status bar shows the following information from left to right: The pause/resume (active) status. Pause mode Resume (active) mode The type of data panel (e.g. ACR). The number of changes defined since you set the reference frame. The number of distinct data views in Page 133 February 7, 2013
134 Real Time User: ACR Packet Information / Function parentheses. The total number of frames captured since the panel was opened or since the last clear. Lower Control Panel Pause mode Resume (active) mode The lower control panel enables you to control and view the following: Set the pause/resume (active) status. Go to the Reference Frame (must be in paused mode). Navigate left or right through the distinct data views (must be in paused mode). The data view currently displayed. The number of distinct data views. Page 134 February 7, 2013
 in the Match tab for each Match definition.")
135 Data Island Match Editor The Data Island Match Editor function enables you to specify the Real Time match filtering with a high degree of detail. To set the match criteria for pre-capture filtering or triggering, you check the appropriate box (Data or Trigger) in the Match tab for each Match definition. Once you check either the Data or Trigger checkbox the Edit activation button becomes enabled. Clicking on the Edit activation button will open up the Data Island Match Editor dialog box (shown below). The Data Island Match Editor dialog box is where you define the advance triggering and/or pre-capture filtering. Note: If you are going to set both a custom match trigger and a custom match data you must use different Match Edit dialog boxes. For example you might use Match 1 for setting a custom trigger and Match 2 for setting a custom match. Advanced Triggering using Match Definition You can trigger on a single condition or multiple conditions in the same data island type using one of the Match definitions (Match 1, 2 or 3). When you trigger on multiple conditions using the same Match definition in a single type of data island, the two conditions are treated as a logical AND. This means that only when both conditions are met, will the trigger activate. You can trigger on multiple conditions in the different data island types using two of the Match definitions (Match 1, Match 2). When you trigger on multiple conditions in separate Match definitions, the two conditions are treated as a logical OR. This means that the trigger will activate when either condition is met. Page 135 February 7, 2013
136 Advanced Pre-Capture Filtering using Data Match Definition If you are using the Match function for advanced triggering, you will have to define the pre-capture filter using a different Match definition. For example if you are using Match 1 to set the triggering, you should use Match 2 or 3 for pre-capture filtering. You can either define a pre-capture filter: 1) for a single specific data island type, 2) for all data islands, or 3) for several types of data islands. If you wish to capture all data islands you use the default setting of Custom in the Match definition. This selection can be found in the Data Island Match Editor on the right side under the heading labeled, Data Island Type. If you wish to capture only a single type of data island, then you specify that type in the Match definition from the pull-down selection menu. The example in the figure below shows that the user is defining a trigger condition (or pre-capture filter) based on the value of the video type of the AVI infoframe. Note that you will have to know the binary values of the data island field in order to specify the criteria. This may require that you refer to the HDMI specification and CEA-861-D. There are two tables on the left side of the panel: Data Bytes and Masks. You do not have to set the Masks; they will be set for you when you select an item under the Field in the table on the right. For example in the screen below, RGB/YCbCr Indicator is selected and the mask that applies to those bits, are selected for you. You then have to select the values in the Data Bytes area to define the match criteria. In the example below, the match condition is set such that if the 980 receives incoming video with a video type of YCbCr 4:4:4 (Hex 40 Y1=1, Y0=0), it will display the data in the appropriate data panel. Page 136 February 7, 2013
137 Setting a Custom Data Match Definition Configuring the system to capture a subset of the data islands is more complex and involves setting the mask data to values for the data island header which satisfies multiple data island types. You do this using the Data Bytes table on the left side of the Data Island Match Editor. For example, if you want to capture only infoframes, you would set the first byte of the header value under Data Bytes to a value that satisfies all infoframes. Since all infoframes have an 8 as the first value in the header, you would set that value to 80. You would set the corresponding value in the Masks table 7F such that only the first bit (most significant) would be used to set the pre-capture filter criteria. This is shown in the screen capture below. Page 137 February 7, 2013

138 Mode Configurations The 980 HDMI Protocol Analyzer can operate in three different configuration modes. The configuration of these modes can be accomplished both through the Real Time mode and the Capture mode. The table below describes the panels in the Real Time mode that are used to set the configuration mode. Real Time Link and HDCP Mode Settings Link and HDCP mode Link Mode Setting Information / Function The following modes are available in the Mode pop-out panel: Link Mode The Link setting enables you to set the configuration: 1) Sink Emulation, 2) Pass-Through, 3) Encrypted Link Analyzer. Rx HDCP The Rx HDCP setting enables you to configure the HDCP mode: 1) HDCP Enabled, 2) BSTATUS (HDMI or DVI), 3) BCAPS. 5 Volts Set the 5 Volt threshold level. There are four sets of status information provided on the Link Mode panel. They are described below: Link Mode This field shows the current Link Mode which is one of: o o MHL The 980 HDMI Protocol Analyzer Rx port is enabled for parsing MHL incoming streams. HDMI The 980 HDMI Protocol Analyzer Rx port is enabled for parsing HDMI incoming streams. Link field (e.g. Sink Emulation) This field shows the current Link Mode which is one of: o o o Sink Emulation The 980 Rx port is emulating a sink. Pass-Through Monitor - In the pass-through monitoring configuration the 980 HDMI Protocol Analyzer Rx port is connected to the source device under test and the 980 HDMI Tx port is connected to a sink device. The pass-through mode enables you to monitor the HDMI traffic passively between an HDMI source and an HDMI sink device. Encrypted Link Analyzer - In the Encrypted Link Analyzer configuration the 980 HDMI Protocol Analyzer Rx port is connected to the source device under test and the 980 HDMI Protocol Analyzer Tx port is connected to a sink device. The Encrypted Link Analyzer configuration enables you to monitor and analyze HDCP encrypted protocol data transmitted between an HDMI source device and Page 138 February 7, 2013
139 Real Time Link and HDCP Mode Settings Information / Function o o o sink device. Note that you will not be able to view the HDCP transactions between the source and the sink. Checking the TX-RX HPD checkbox will replicate the hot plug signal from the TX side (an attached sink device) on the RX side (like a hot plug repeater). Selecting the HDMI Monitor radio button will enable the 980 HDMI Protocol Analyzer to process and analyze HDMI incoming streams. Selecting the MHL Monitor radio button will enable the 980 HDMI Protocol Analyzer to process and analyze MHL incoming streams. Tx - This field shows the status related to HDCP on the 980 HDMI Protocol Analyzer Rx port. A + sign and green text indicates that the HDCP is enabled on the 980 Rx port. Tx - This field shows the status related to HDCP on the 980 HDMI Protocol Analyzer Tx port. A + sign and green text indicates that HDCP is active on the 980 HDMI Protocol Analyzer Tx port. Ri - This field shows the current Ri count since collection began. Refresh This button refreshes the Link Mode to ensure that it is current with the setting on the 980. HDCP Mode Setting The upper status bar shows the following information from left to right: HDCP Enabled In the Enabled mode, the 980 sink emulator (Rx port) will respond to HDCP authentication from a source device under test. When disabled the 980 sink emulator will not respond to an HDCP authentication request. BSTATUS This check box enables you to toggle between the 980 sink emulator responding to a source HDCP authentication by indicating in its BSTATUS register that it is or is in HDMI mode or DVI mode. Set BCAPS This check box opens up a dialog box enabling you to configure the bits of the BCAPS register. The dialog box is shown as well. You can set the bits by clicking on that bit. Clicking on any one bit will toggle the binary value. The hex value of the BCAPS register is shown in the field above the bit values (80 in the Page 139 February 7, 2013
.")
140 Real Time Link and HDCP Mode Settings Information / Function example). Page 140 February 7, 2013
141 6 Auxiliary Channel Analyzer (ACA) The ACA (Auxiliary Channel Analyzer) enables you to view the DDC traffic for HDMI streams and the C-Bus traffic for MHL streams. The Real Time viewing of DDC and CBUS traces is only available through the embedded GUI. However, you can save these ACA traces and then view them with the ACA application off-line from a PC. 6.1 Accessing the ACA Panel The ACA Real Time viewer can be accessed through the View pulldown menu as shown below. The ACA window appears as shown below: Page 141 February 7, 2013
142 Page 142 February 7, 2013
143 6.2 ACA Panel Description The ACA Events panel enables you to view the transaction data in real time. There is a details panel associated with the ACA panel that provides additional information about a selected transaction in the ACA Events panel. A populated ACA panel with the details panel shown is provided below: Page 143 February 7, 2013

144 There is a control menu panel on the right side. The control menu and elements of the ACA panel are described in the following table. Real Time ACA Auxiliary Channel Analyzer Information / Function The following information is provided in the ACA data dialog box for each Event: Item number This is a unique sequence number of the transaction. Type The type of DDC transaction; either EDID, HDCP or CBUS. Transaction Description A description of the transaction. ACA Control Menu There is a menu associated with the ACA Info panel. It is location on the right side of the panel. The ACA pull-down menu provides the following functions: Home Navigates you back to the Home menu screen of the embedded 980 GUI Manager. Back Navigates back to the previous screen in the Real Time mode. Start/Stop Starts and Stops the collection of DDC data. Resume/Pause Halts the updates of the data to the ACA panel. Events Shows or hides events enabling you to configure what events you see in the real Page 144 February 7, 2013

145 Real Time ACA Information / Function time panel. Data Opens up the Details panel described below. Clear Clears the ACA trace panel. Open Opens an existing trace file stored on the 980 or the PC. Save Saves a current trace file to the 980. \ The following information is provided in the ACA Event Details dialog box: Type The type of event, one of HDCP, EDID or CBUS. Start Time This the start time of the transaction in microseconds from a reference time determined when the capture of real time data began. Duration The duration in milliseconds of the transaction. Maximum I2C Rate The rate that the DDC channel clock is operating. Details (text) The contents of the transaction in human readable text. Details (hex) The contents of the transaction in hex data. There are some control arrows and a status panel on the bottom of the ACA Event Details panel. These are as follows: Left arrow The left arrow allows you to see the details of the next transaction. Right arrow The right arrow allows you to see the details of the previous transaction. Status field Shows the sequence number and the description of the selected transaction. 6.3 Monitoring the HDMI and MHL auxiliary channels with the ACA This subsection describes the procedures for monitoring the auxiliary channel data. You can monitor the HDMI DDC and MHL C-Bus transactions in real time either while the 980 HDMI Protocol Analyzer is emulating a sink Page 145 February 7, 2013
146 device or you can monitor the transactions passively. Procedures for these applications are provided in this subsection Setting the 980 HDMI Protocol Analyzer mode to MHL or HDMI Use the following procedures to set the 980 HDMI Protocol Analyzer to the MHL or HDMI mode. To set the 980 HDMI Protocol Analyzer mode to MHL or HDMI: 1. From the Instrument menu, select the Link Mode. The following menu appears: 1. Select the pull-down menu as shown below and select the HDMI Monitor checkbox. The default mode is HDMI. Page 146 February 7, 2013
147 The Link Mode menu will show HDMI (or MHL accordingly) as the Link Mode Monitoring the HDMI DDC Transactions in Real Time mode Use the following procedures to monitor the HDMI DDC transactions from an HDMI source device in real time. The procedures assume that the HDMI source device is powered up and connected to the 980 HDMI Protocol Analyzer Rx port. The procedure also assumes that the 980 HDMI Protocol Analyzer is in the HDMI mode. The following diagrams depict the test setups. There are two configurations: 1) you can monitor the DDC transactions with the 980 HDMI Protocol Analyzer emulating an HDMI sink device or 2) you can passively monitor the DDC transactions between an HDMI source and sink device. Page 147 February 7, 2013
148 Connection for HDMI sink emulation (Rev D Protocol Analyzer module) Connection for HDMI sink emulation (Rev C Protocol Analyzer module) Page 148 February 7, 2013
149 Connection for HDMI Pass-through or Encrypted Link Analyzer (Rev D Protocol Analyzer module) Connection for HDMI Pass-through or Encrypted Link Analyzer (Rev C Protocol Analyzer module) To monitor the HDMI DDC transactions: Page 149 February 7, 2013
150 1. Touch select the Real Time mode on the built-in front panel by touch selecting the GoTo pull-down menu and selecting the ACA item. You can also access the ACA panel from the Home menu as shown below: Page 150 February 7, 2013
151 The ACA panel appears as shown below: Page 151 February 7, 2013
152 2. Select the event types that you wish to capture by touch selecting the Events button on the ACA panel menu at the right. Refer to the screen example above. The ACA Event Selection dialog box is shown below with all HDMI events selected for monitoring. If you wish to view only a subset of the events deselect the All Events option and then select the specific event. Page 152 February 7, 2013

153 3. Take the necessary action such as a hot plug to initiate EDID or HDCP transactions from the HDMI source device. You will see the DDC transactions in the ACA panel as shown below. 4. Touch select the Start button on the ACA Menu panel on the right to initiate the viewing of the HDMI HDCP and EDID transactions. An example showing monitored data is shown below. You can stop or pause the collection at any time using the buttons on the ACA menu panel on the right. These are indicated in the screen example below. Page 153 February 7, 2013
154 5. Scroll through the data to find specific events. The scroll bars are indicated in the screen example above. 6. The ACA Find dialog box is accessible through the Data pop-out menu shown in the screen example below. The ACA Find function enables you to quickly locate different types of events. a) Click the Add button to add a new search criteria. b) Define the search by selecting the Source, Type and any Text on the Event. c) Click Previous or Next to locate the item in the transactions Monitoring the MHL C-Bus Transactions in Real Time mode There are three configurations for monitoring the C-Bus transactions. 1) You can monitor the C-Bus transactions passively between an MHL source and an MHL sink device. In this application the 980 HDMI Protocol Analyzer is not monitoring any of the MHL TMDS traffic. 2) You can monitor the C-Bus transactions between an MHL source device and the 980 HDMI Protocol Analyzer while it is emulating an MHL sink device. In this application you can also monitor the MHL TMDS audio, video and metadata between the MHL source and the 980 HDMI Protocol Analyzer emulating a sink. 3) You can monitor the C-Bus transactions between an MHL source device and the 980 HDMI Protocol Analyzer while it is emulating an MHL source device. In this application you can also monitor the MHL TMDS audio, video and metadata between the MHL sink device and the 980 HDMI Protocol Analyzer while it is emulating a source device. Page 154 February 7, 2013
155 Making the physical connections for monitoring the MHL C-Bus transactions passively between an MHL 1.2 source and 1.2 sink device. The procedures for monitoring C-Bus transactions passively are provided below. The procedures assume that the MHL source and sink devices powered up and that the 980 HDMI Protocol Analyzer is in the MHL mode. The illustration below depicts the general test setup.update Connection for MHL 1.2 CBUS passive monitoring (Rev C Protocol Analyzer module) To monitor the C-Bus transactions while the 980 HDMI Protocol Analyzer is emulating an MHL 1.2 display device, make the following connections and refer to the diagram that follows: 1. Apply power to the TPA-MHL-8R using the 12VDC power adapter provided. 2. Connect an MHL cable from the MHL 1.2 source device under test to the MHL IN FROM SOURCE connector on the section of the TPA-MHL-8R labeled 980 CONNECTIONS CBUS ANALYSIS. 3. Connect a Coax cable from the connector labeled TO 980 TRIGGER IN CBUS on the section of the TPA-MHL-8R labeled to 980 CONNECTIONS CBUS ANALYSIS to the BNC connector labeled TRIG IN on the 980 HDMI Protocol Analyzer. 4. Connect a second MHL cable from the MHL OUT TO SINK connector on the section of the TPA-MHL-8R labeled 980 CONNECTIONS CBUS ANALYSIS to the MHL sink device under test. Making the physical connections for monitoring the MHL C-Bus transactions passively between an MHL 2.0 source and 2.0 sink device. The procedures for monitoring C-Bus transactions passively are provided below. The procedures assume that the MHL 2.0 source and 2.0 sink devices powered up and that the 980 HDMI Protocol Analyzer is in the MHL mode. The illustration below depicts the general test setup. Page 155 February 7, 2013
156 Connection for MHL 2.0 CBUS passive monitoring (Rev C Protocol Analyzer module) Connection for MHL 2.0 CBUS passive monitoring (Rev D Protocol Analyzer module) Page 156 February 7, 2013
157 To monitor the C-Bus transactions while the 980 HDMI Protocol Analyzer is emulating an MHL 2.0 display device, make the following connections and refer to the diagram that follows: 1. Apply power to the TPA-MHL2-8R using the 12VDC power adapter provided. 2. Connect an MHL cable from the MHL 2.0 source device under test to the MHL IN FROM SOURCE connector on the section of the TPA-MHL2-8R labeled CBUS PASSIVE MONITOR. 3. Connect a Coax cable from the connector labeled TO 980 TRIGGER IN on the section of the TPA-MHL2-8R labeled to CBUS PASSIVE MONITOR to the BNC connector labeled TRIG IN on the 980 HDMI Protocol Analyzer. 4. Connect a second MHL cable from the MHL OUT TO SINK connector on the section of the TPA-MHL2-8R labeled 980 CONNECTIONS CBUS ANALYSIS to the MHL sink device under test. To monitor the MHL transactions: 1. Touch select the Real Time mode on the built-in front panel by touch selecting the GoTo pull-down menu and selecting the ACA item. You can also access the ACA panel from the Home menu as shown below: Page 157 February 7, 2013
158 The ACA panel appears as shown below: Page 158 February 7, 2013
159 Page 159 February 7, 2013

160 2. Select the event types that you wish to capture by touch selecting the Events button on the ACA panel menu at the right. Refer to the screen example above. The ACA Event Selection dialog box is shown below with all HDMI events selected for monitoring. If you wish to view only a subset of the events deselect the All Events option and then select the specific event. Page 160 February 7, 2013

161 3. Take the necessary action such as a hot plug to initiate EDID or HDCP transactions from the HDMI source device. You will see the DDC transactions in the ACA panel as shown below. 4. Touch select the Start button on the ACA Menu panel on the right to initiate the viewing of the HDMI HDCP and EDID transactions. An example showing monitored data is shown below. You can stop or pause the collection at any time using the buttons on the ACA menu panel on the right. These are indicated in the screen example below. Page 161 February 7, 2013

162 5. Scroll through the data to find specific events. The scroll bars are indicated in the screen example above. 6. The ACA Find dialog box is accessible through the Data pop-out menu shown in the screen example below. The ACA Find function enables you to quickly locate different types of events. a) Click the Add button to add a new search criteria. b) Define the search by selecting the Source, Type and any Text on the Event. c) Click Previous or Next to locate the item in the transactions. 6.4 Viewing HDMI and MHL auxiliary channel traces on a PC with the ACA This subsection describes how you can view ACA traces using the ACA viewer off-line on your PC. In order to view the ACA files on your PC with the 980 GUI Manager application you will first have to transfer them to the PC using the Data Transfer utility. The ability to save ACA traces enables you to disseminate them to other subject matter experts for analysis or to Quantum Data for support. You can view the ACA traces without a 980 test instrument. You simply download the 980 GUI Manager from the Quantum Data website on the downloads page. To view saved ACA trace files: Page 162 February 7, 2013
163 1. Make sure the 980 GUI Manager is installed on your PC. Use the procedures at Downloading and installing the 980 GUI Manager. 2. Access the ACA data from the Navigator panel and highlight a directory as shown below. 3. Access the Data Transfer utility by double clicking on the Transfer Data icon. The Data Transfer: ACA Data dialog box appears (below) enabling you to select the 980 that you want to transfer data from. Select the desired 980 and click OK. The Data Transfer: ACA Data panel will appear. 4. Access the Data Transfer panel by double clicking on the Transfer Data icon. 5. The Data Transfer panel appears in context with the ACA files on the 980 (Instrument) under the Instrument Files available as shown below. Page 163 February 7, 2013
164 6. Highlight a directory on the Local Files side (host PC) and then initiate a Copy or Move. The file appears on the PC host Local Files (below). Page 164 February 7, 2013
 or with the ACA button on the top status bar.")
165 The data appears in the Navigator panel under the ACA data as shown below. 7. Open up the ACA panel to view the transferred file. You can access the ACA panel from the View pull-down menu (below) or with the ACA button on the top status bar. Page 165 February 7, 2013

166 The Aux Channel Analyzer panel appears. 8. Select the Open button to open the ACA file as shown below: Page 166 February 7, 2013
167 7 Testing HDMI Sources, Cables and Distribution Networks for Pixel Errors The 980 HDMI Protocol Analyzer enables you to test the video quality of an HDMI or MHL stream. There are two tests available: 1) Pixel Error test, and 2) Pseudo-Random Noise (PRN) test. These tests are only available through the Receiver application in the Real Time mode on the embedded 980 GUI Manager display. The test are not available on the external 980 GUI Manager. The Pixel Error test and the Pseudo-Random noise test can also be run through the command line. The commands necessary for running these tests are included in this chapter. The Pixel Error test (Frame Compare) checks for pixel errors in the HDMI or MHL stream from an upstream source device through a cable or distribution network. The Pixel Error test enables you to verify either the source, the cable or distribution network or any combination of the three. For example, if your application is to test distribution network components such as splitters, switches and extenders, then you would use a known-good source device and known-good HDMI cables. For testing a source, you would use the Pixel Error test with a short known-good HDMI cable. You can also use the Pixel Error test to test an HDMI cable if the two cable ends are not, and cannot be, collocated. The PRN test (Cable Test) uses a specific pseudo-random noise test pattern designed to stress a cable or distribution network. The test is run in a loop back configuration with the 980 HDMI Protocol Analyzer Tx looped to the Rx port. The test enables you to verify a cable or distribution network. For example, if your application is to test a distribution network components such as splitters, switches and extenders, then you would use known-good HDMI cables and loop the near and far ends to the 980 Tx and Rx ports. 7.1 Accessing the Real Time mode To access the Real Time mode: 1. From the embedded 980 GUI manager if you are currently in the Main capture panel you can access the Pixel Error test through the View pull-down menu by selecting Receiver or by touch selecting Receiver activation button as shown below. Page 167 February 7, 2013
168 The Receiver Real Time panel appears as shown below: 2. From the embedded 980 GUI manager if you are currently in the Home screen you can access the Pixel Error test by touch selecting Receiver activation icon as shown below. Page 168 February 7, 2013

169 The Receiver Real Time panel appears as shown above. 7.2 Testing HDMI Distribution Network Components with the Pixel Error Test Use the following procedures to setup and test HDMI Distribution Network components. This procedure assumes that you are in the Real Time mode through the Receiver application panel. To Run the Pixel Error test: 1. Connect the source and HDMI distribution network to the 980 HDMI Protocol Analyzer Rx port as shown below: Page 169 February 7, 2013
 Note: If you are testing the source or cable the test setup is shown below: Page 170 February 7,")
170 Connection for running pixel error test on HDMI distribution network (Rev C Protocol Analyzer module) Connection for running pixel error test on HDMI distribution network (Rev D Protocol Analyzer module) Note: If you are testing the source or cable the test setup is shown below: Page 170 February 7, 2013
171 Connection for HDMI source analysis (Rev D Protocol Analyzer module) Connection for HDMI source analysis (Rev C Protocol Analyzer module) Page 171 February 7, 2013
172 From the Real Time window select the Tools menu as shown below: The Pixel Error test dialog box appears as shown below: Page 172 February 7, 2013
173 The table below describes the fields and buttons on the Pixel Error Test dialog box. Pixel Error test dialog box - Item Information / Function The following is a description of the items on the Pixel Error Test dialog box: Number of Frames This is the number of frames to test when Continuous is deselected. Max Recorded Errors This is the maximum number of errors that can be recorded and presented in the Report. Enter in the range of 1 top 256; default 100. Continuous A checkbox indicating whether the test runs continuously and requires manual intervention to stop or unchecked with the test stopping after the number specified in Number of Frames. Reference Frame; Auto Radio buttons indicating whether the test will use a reference frame video image generated from the source as the test in initiated (ON) or if the test will use a reference frame video image stored on the PC (OFF). Path This field is used only if Reference Frame; Auto is disabled. The field indicates the file name and path where the reference frame is obtained from. Capture Used only when using a video Page 173 February 7, 2013
174 Pixel Error test dialog box - Item Information / Function reference frame stored on the 980 (Auto=OFF). Enables you to capture a video reference frame from a source to use a reference frame in subsequent testing. Save Saves the captured reference frame to the 980. Select Enables you to browse for a video reference frame stored on the 980 for testing. View Enables you to view the reference frame captured from the source or loaded from the 980. Start Analysis Activation button to initiate the test. Turns to a Stop Analysis when running in the Continuous mode. Frames Analyzed Indicates the number of frames currently analyzed or completed in the analysis once the test completes. Total Errors Indicates the number of errors currently identified or the total errors determined when the test is completed. Report Enables you to view an HTML report of the test results. 2. Use the Continuous checkbox to specify whether you wish to run the test manually for an arbitrary number of frames or for a specific number of frames. a. For testing with a specific number of frames deselect the Continuous checkbox and enter the number of frames. Page 174 February 7, 2013
 stored on your 980. a. For testing with a reference frame generated from the source during the test, select the Auto ON radio button.")
175 b. For testing in the continuous mode select the Continuous checkbox. 3. Specify whether you wish to run the test using a reference frame generated dynamically from the source under test or use a reference ( golden frame ) stored on your 980. a. For testing with a reference frame generated from the source during the test, select the Auto ON radio button. Page 175 February 7, 2013
176 b. For testing with a reference frame obtained from the file stored on your 980, select the Auto OFF radio button and then activate the Select button to browse for a file on the 980. When you activate the Select button the Load Reference Frame dialog button will appear enabling you to select a reference frame that you have previously captured. Select the file and OK or Cancel to start over. Page 176 February 7, 2013
177 4. Activate the Start Analysis button to initiate the test. The Frames Analyzed and the Total Errors fields will indicate the progress and status of the test. 5. If you are running in continuous mode, halt the test using the Stop Analysis button. If you are running the test non continuously, then the test will stop automatically when the number of frames specified in the Number of Frames field is reached. The Frames Analyzed and the Total Errors fields will indicate the progress and status of the test. Page 177 February 7, 2013

178 Page 178 February 7, 2013

179 6. Touch select the Report button to obtain a report of the results. In the example shown below there are no errors. The second example shows a report with many errors. Page 179 February 7, 2013
180 7.3 Running the Pixel Error Test through the command line You can run the Pixel Error test through the command line. Refer to the Chapter Command Line Interface for Capturing Data for information on how to establish a command line session with the 980. Commands for Pixel Error Test Note: Commands are not case sensitive. Command Description Syntax Command Example PDAX:NFRS Set number of frames to analyze in pixel data analysis test or sets test to continuous mode requiring user intervention to terminate. PDAX:NFRS < frames > Where <frames> is the number of frames to capture and compare during the test. Set to 0 for continuous mode which requires user interaction to stop test. To set number of frames to analyze in pixel data analysis test to 50: >PDAX:NFRS 50 PDAX:CAPF Capture a reference frame for pixel data analysis test PDAX:CAPF To capture a reference frame for pixel data analysis test: >PDAX:CAPF PDAX:GFCA Saves a captured frame to a file. This is used as a reference frame ( golden frame) for comparison with subsequent captured frames. PDAX:GFCA <path> Where <path> is the directory path and file name of the stored reference frame. If the path is omitted the default path is used. To save a captured frame to a file to use as a reference frame: >PDAX:GFCA /user/cap1 or: >PDAX:GFCA cap1 PDAX:GFCL Load a captured reference frame from a file. PDAX:GFCL <path> Where <path> is the directory path and file name of the reference frame to load. If the path is omitted the default path is used. To load a captured reference frame from a file: >PDAX:GFCL /user/cap1 or: >PDAX:GFCL cap1 PDAX:MXER Set maximum number of detailed errors to record in pixel data analysis test. PDAX:MXER <errors> Where <errors> is maximum number of errors to provide a detailed report for up to 256 errors. To set maximum number of detailed errors to record in pixel data analysis test to 100: >PDAX:MXER 100 Page 180 February 7, 2013
181 Commands for Pixel Error Test Note: Commands are not case sensitive. Command Description Syntax Command Example PDAX:ERRQ PDAX:NERR Get recorded detailed error records. Returns the following: Frame number that an error occurred X,Y coordinate that the error occurred. The measured red component value. The measured green component value. The measured blue component value. The reference expected red component value. The reference expected green value. The reference expected blue value. Get number of errors during a pixel data analysis test. PDAX:ERRQ PDAX:NERR To get recorded detailed error records: > PDAX:ERRQ 007: [1450:0000:0006] 0xb4b4b4 0xebebeb 008: [1450:0000:0007] 0xb4b4b4 0xebebeb 009: [1450:0000:0008] 0xb4b4b4 0xebebeb 010: [1450:0000:0009] 0xb4b4b4 0xebebeb 011: [1450:0000:0010] 0xb4b4b4 0xebebeb 012: [1450:0000:0011] 0xb4b4b4 0xebebeb 013: [1450:0000:0012] 0xb4b4b4 0xebebeb To obtain the number of errors during a pixel data analysis test: > PDAX:NERR PDAX:PDAU Initiates the pixel data analysis test. PDAX:PDAU To initiate the pixel data analysis test: > PDAX:PDAU PDAX:STOP Stops the pixel data analysis test. PDAX:STOP To stop a pixel data analysis test: > PDAX:STOP PDAX:STAT Returns the test status including running or done, frames analyzed, errors detected, etc. Can be run either during a test or after a test is terminated. Provides results from the last test. Note: The commands are not case sensitive. PDAX:STAT To obtain the test status: > PDAX:STAT pdax: in progress frames: 1659 threshold 0 errors: threshold 0 To Run the Pixel Error test for a specified number of frames from the command line: 1. Set the number of frames to use during the test. #p-scope>pdax:nfrs 255 pdax:nfrs Capture a reference frame for the test: #p-scope>pdax:capf Page 181 February 7, 2013
182 pdax_capf: capture buffer size 179MB bs=128 INFO: Capture Trigger condition is satisfied END: pcap_capture_start Capture complete END: pcap_info info request type=118 complete 3. Save the captured frame to a file: #p-scope>pdax:gfca myrefrm2 pdax:gfca myrefrm2 4. Load the captured frame: #p-scope>pdax:gfcl myrefrm2 pdax:gfcl myrefrm2 pdax_gfcl: Loading Reference frame: [myrefrm2] 5. Run the pixel error test (will run for 255 frames) #p-scope>pdax:pdau pdax:pdau 6. Get statistics for the test: #p-scope>pdax:stat pdax:stat pdax: stopped frames: 255 threshold 255 errors: 0. threshold 255 To Run the Pixel Error test continuously from the command line: 1. Set the pixel error test to run continuously: #p-scope>pdax:nfrs 0 pdax:nfrs 0 2. Initiate the test : #p-scope>pdax:pdau pdax:pdau 3. Query statistics for the test: #p-scope>pdax:stat pdax:stat pdax: in progress frames: 1071 threshold 0 errors: threshold 255 Page 182 February 7, 2013
183 4. Stop the test: #p-scope>pdax:stop pdax:stop 5. Get the number of errors. #p-scope>pdax:nerr pdax:nerr Get a detailed list out of the 255 errors: #p-scope>pdax:errq 0x x : [0699:0646:0742] 0x x : [0699:0646:0743] 0x x : [0699:0646:0744] 0x x : [0699:0646:1170] 0x x : [0699:0646:1171] 0x x : [0699:0646:1172] 0x x Testing HDMI Cables and Distribution Networks with the PRN Test Use the following procedures to setup and test HDMI cables and Distribution Network components using the Pseudo-Random Noise (PRN) test. The PRN test is run in a loop-back configuration from the 980 HDMI Protocol Analyzer Tx to the Rx ports. This procedures assumes that the 980 GUI Manager is in the Real Time mode in the Receiver application panel. To Run the Pseudo-Random Noise (PRN) test: 1. Connect the HDMI cable connector at the upstream end of the HDMI cable and HDMI distribution network to the HDMI Tx port (refer to the illustration below). 2. Connect the HDMI cable connector at the downstream end of the HDMI cable or HDMI distribution network to the HDMI Rx port (refer to the illustration below). Page 183 February 7, 2013
184 Pseudo-random noise cable or link test using Rev C Protocol Analyzer module Pseudo-random noise cable or link test using Rev D Protocol Analyzer module 3. From the Real Time window select the Tools menu as shown below: Page 184 February 7, 2013

185 The PRN test dialog box appears as shown below: Page 185 February 7, 2013
186 The table below describes the fields and buttons on the Pseudo-Random Noise Test dialog box. Pseudo-Random Noise test dialog box - Item Information / Function The following is a description of the items on the Pixel Error Test dialog box: Number of Frames This is the number of frames to test when Continuous is deselected. Max Recorded Errors This is the maximum number of errors that can be recorded and presented in the Report. Enter in the range of 1 top 256; default 100. Continuous A checkbox indicating whether the test runs continuously and requires manual intervention to stop or unchecked with the test stopping after the number specified in Number of Frames. Format Pull-down menu to selects the format to be used for the test. Start Analysis Activation button to initiate the test. Turns to a Stop Analysis when running in the Continuous mode. Frames Analyzed Indicates the number of frames currently analyzed or completed in the analysis once the test completes. Total Errors Indicates the number of errors Page 186 February 7, 2013
187 Pseudo-Random Noise test dialog box - Item Information / Function currently identified or the total errors determined when the test is completed. Pixels Analyzed Indicates the number of pixels currently analyzed or completed in the analysis once the test completes. Error Rate Indicates the pixel error rate calculation once the test is complete. Report Enables you to view an HTML report of the test results. 4. Use the Continuous checkbox to specify whether you wish to run the test manually for an arbitrary number of frames or for a specific number of frames. a. For testing with a specific number of frames deselect the Continuous checkbox and enter the number of frames. b. For testing in the continuous mode select the Continuous checkbox. 5. Activate the Start Analysis button to initiate the test. Page 187 February 7, 2013

188 The Frames Analyzed and the Total Errors fields will indicate the progress and status of the test. 7. If you are running in continuous mode, halt the test using the Stop Analysis button. If you are running the test non-continuously, then the test will stop automatically when the number of frames specified in the Number of Frames field is reached. The Frames Analyzed and the Total Errors fields will indicate the progress and status of the test. 6. Touch select the Report button to obtain a report of the results. Page 188 February 7, 2013

189 In the example shown below there are not errors. 7.5 Running the Pseudo-Random Noise Test through the command line You can run the Pseudo-Random Noise test through the command line. Refer to the Chapter Command Line Interface for Capturing Data for information on how to establish a command line session with the 980. Commands for Pseudo-Random Noise Test Note: Commands are not case sensitive. Command Description Syntax Command Example PRNA:NFRS Set number of frames to analyze in pseudo-random noise test PRNA:NFRS < frames > Where <frames> is the number of frames to capture and compare during the test. Enter 0 to run the test in continuous mode which requires user intervention to stop. To set number of frames to analyze in pseudo-random noise test: > PRNA:NFRS 50 Page 189 February 7, 2013
190 Commands for Pseudo-Random Noise Test Note: Commands are not case sensitive. Command Description Syntax Command Example PRNA:PNST Load a format resolution for testing. PRNA:PNST <format> Where <format> is the output format resolution for the test. Could be one of: 480pc24 To load 1080p60 resolution with 24 bit color for testing: > PRNA:PNST 1080p60c24 PRNA:MXER PRNA:ERRQ PRNA:NERR Set maximum number of detailed errors to record in pseudo-random noise test. Get one or more recorded detailed error records. Returns the following: Frame number that an error occurred X,Y coordinate that the error occurred. The measured red component value. The measured green component value. The measured blue component value. The reference expected red component value. The reference expected green value. The reference expected blue value. Get number of errors during a pseudo-random noise test. 720p60c i30c p60c p60c36 4Kx2Kp30c24. PRNA:MXER <errors> Where <errors> is maximum number of errors to provide a detailed report for up to 1000 errors. PRNA:ERRQ PRNA:NERR To set maximum number of detailed errors to record in pseudo-random noise test to 100: > PRNA:MXER 100 To obtain the detailed error records: > PRNA:ERRQ To obtain the number of errors during a pseudo-random noise test: > PRNA:NERR? PRNA:PNAU Initiate pseudo-random noise test. PRNA:PNAU To run pixel data analysis test: > PRNA:PNAU Page 190 February 7, 2013
191 Commands for Pseudo-Random Noise Test Note: Commands are not case sensitive. Command Description Syntax Command Example PRNA:STOP Stop pseudo-random noise test. PRNA:STOP To stop a pseudo-random noise test: > PRNA:STOP PRNA:STAT Returns the test status including running or done, frames analyzed, errors detected, etc. Note: The commands are not case sensitive. PRNA:STAT To obtain the test status: > PRNA:STAT To Run the Pseudo-Random Noise (PRN) test from the command line: 1. Set the resolution using the following command (e.g. 720p60 at 24 bit deep color): prna:pnst 720p60c24 2. Specify the number of errors you wish to see detailed information on. #p-scope>prna:mxer 100 prna:mxer Initiate the pseudo-random noise test. #p-scope>prna:pnau prna:pnau 4. Stop the pseudo-random noise test: #p-scope>prna:stop prna:stop 5. Get statistics on errors that occurred. #p-scope>prna:stat prna:stat pdax: stopped frames: 1377 threshold 0 errors: 0. threshold Retrieve the number of errors encountered during the test. #p-scope>prna:nerr prna:nerr 0 #p-scope>prng:errq Note: If errors had occurred this command would provide the list of errors. Page 191 February 7, 2013
192 8 Analyzing HDMI/MHL Data with your 980 Protocol Analyzer This chapter describes how to use the 980 HDMI Protocol Analyzer to view HDMI/MHL protocol data from the HDMI/MHL source device under test. 8.1 Overview These procedures assume that you have powered up the 980 HDMI Protocol Analyzer, connected your HDMI/MHL source device (and possibly sink device if you are testing in the optional pass-through mode), connected the Ethernet cable and established an IP connection from the 980 GUI Manager running on your PC to the 980 Protocol Analyzer application. You should now have the 980 GUI Manager open on your PC. 8.2 Operational workflow for capturing data with your 980 HDMI Protocol Analyzer This subsection describes how to use the 980 HDMI Protocol Analyzer to capture and analyze HDMI/MHL source devices. It assumes you have established a connection to the 980 HDMI Protocol Analyzer from the 980 GUI Manager. Testing an HDMI/MHL source device involves the following high level steps: 1. Configure the 980 HDMI Protocol Analyzer in the proper mode HDMI or MHL. 2. Determine what operational configuration you are using: 1) Sink Emulation, 2) Pass-Through, 3) Encrypted Link Analyzer. If you are using the Pass-Through or Encrypted Link Analyzer configuration connect an HDMI display device to the HDMI Tx port. If using the Sink Emulation mode you do not need to connect any device to the HDMI Tx port. 3. Setting the desired HDCP mode (enabled or disabled). 4. Set the +5V threshold level 5. Configure the 980 HDMI Protocol Analyzer Rx port with the proper EDID. 6. View the incoming video in real time to check the status of the device under test. 7. Specify a trigger method. 8. Specify the data that you want to capture and how much data you want to capture. 9. Initiate the capturing of the data. 10. Examine the test data through the 980 GUI Manager at the high level view on the Event Plot panel or the Video Analysis panel. 11. Drill down to examine the data at the lower level through the details of the Data Decode panel view. 12. (Optional) You may wish to view the protocol data (guard band and preamble bits). 13. Use the analysis tools (Video Analysis, Timing Analysis, Audio Analysis, AVmute Test) to examine the data. 14. (Optional) If you have purchased the HDMI or MHL source compliance test option you can run these test suites as well. 8.3 Setting the 980 HDMI Protocol Analyzer mode to MHL or HDMI Use the following procedures to set the 980 HDMI Protocol Analyzer to the MHL or HDMI mode. To set the 980 mode to MHL or HDMI: 1. From the Instrument menu, select the Link Mode. Page 192 February 7, 2013

193 The following menu appears: 2. Select the pull-down menu as shown below and select the HDMI Monitor or the MHL Monitor checkbox. The default mode is HDMI. Page 193 February 7, 2013
194 The Link Mode menu will show MHL (or HDMI) as the Link Mode. 8.4 Setting the Configuration of the Link Mode Prior to a capturing or viewing video you will need to set the configuration of the Link Mode: 1) Sink Emulation, 2) Pass-Through, 3) Encrypted Link Analyzer. If you are using the Pass-Through or Encrypted Link Analyzer configuration you will connect an HDMI display device to the HDMI Tx port. If using the Sink Emulation mode you do not need to connect any device to the HDMI Tx port. Use the following procedures to select the configuration mode. Note: The procedures in this subsection assume that you are capturing data in the Sink Emulation Mode. The procedures for capturing data in the Pass-Through and Encrypted Link Analyzer mode are provided later in this User Guide. To set the 980 link configuration mode: 1. Ensure that you are sending video from your source device under test. 2. Select the configuration of the Link Mode item from the Instrument pull-down menu on the built-in front panel as shown below. Page 194 February 7, 2013
195 The mode dialog box appears as shown below. 3. Select the Link Mode item from the pull-down menu on the built-in front panel as shown below. A pop out menu will appear enabling you to select the desired mode using the check boxes provided. Sink emulation In the sink emulation monitoring configuration the 980 HDMI Protocol Analyzer HDMI Rx port is connected directly to the source device under test. The 980 HDMI Protocol Analyzer is Page 195 February 7, 2013
196 emulating an HDMI/MHL sink device. The sink emulation mode is the typical mode of operation. You can monitor the HDMI/MHL transactions between the source device under test and the 980 HDMI Protocol Analyzer Rx port. All of the data types described in this manual can be monitored in the sink emulation mode unless noted otherwise. Pass-Through Monitor In the Pass-Through monitoring configuration the 980 HDMI Protocol Analyzer HDMI Rx port is connected to the source device under test and the 980 HDMI Protocol Analyzer HDMI Tx port is connected to a sink device. The pass-through mode enables you to monitor the HDMI traffic passively between an HDMI/MHL source and an HDMI/MHL sink device. Encrypted Link Analyzer - (Optional) In the Encrypted Link Analyzer configuration the 980 HDMI Protocol Analyzer HDMI Rx port is connected to the source device under test and the 980 HDMI Protocol Analyzer HDMI Tx port is connected to a sink device. The Encrypted Link Analyzer configuration enables you to monitor and analyze HDCP encrypted protocol data transmitted between an HDMI source device and sink device. Note: The procedures for using the Pass-Through mode and Encrypted Link Analyzer are covered in the next Chapter. TX-RX HPD - Enabling this option will replicate the hot plug signal from the TX side (an attached sink device) on the RX side (like a hot plug repeater). 8.5 Setting the RX HDCP mode The 980 enables you to enable and disable HDCP on the Rx sink emulation port. This enables you to test how your source device under test responds to a sink that does not support HDCP. You can also configure certain HDCP configuration registers such as the BSTATUS and BCAPS. Use the following procedures to set the HDCP mode and registers. 1. Select the Rx HDCP Settings item from the Instrument pull-down menu on the built-in front panel as shown below. Page 196 February 7, 2013

197 The RX HDCP Settings dialog box appears as shown below. 1. Select the RX HDCP Settings using the check boxes. HDCP Enabled In the Enabled mode, the 980 HDMI Protocol Analyzer sink emulator will respond to HDCP authentication from a source device under test. When disabled the 980 sink emulator will not respond to an HDCP authentication request. BSTATUS This check box enables you to toggle between the 980 HDMI Protocol Analyzer sink emulator responding to a source HDCP authentication by indicating in its BSTATUS register that it is or is not in HDMI mode. Set BCAPS This check box opens up a dialog box enabling you to configure the bits of the BCAPS register. The Edit dialog box is shown below. You can set the bits by clicking on that bit. Clicking on any one bit will toggle the binary value. The hex value of the BCAPS register is shown in the field above the bit values (80 in the example below). Page 197 February 7, 2013

198 8.6 Setting the +5V levels The 980 enables you to view the +5V levels from the source device under test and to set the current load on the +5V lead. 1. Select the RX 5 Volts item from the Instrument pull-down menu on the built-in front panel as shown below. The RX 5V Status/Configuration dialog box is displayed as shown below. Page 198 February 7, 2013
199 Note the current Measured 5V level (4.98 in the example above). 2. Select the Threshold Level using the upper slidebar (0.0 to 5.3V). Be sure to select the Apply button. Then hit Refresh to view the new value. You may wish to lower the threshold to enable testing of a source whose 5V level is too low. If you specify a threshold higher than the voltage detected there will be no effect on the ability to test. 3. Select the current Load using the lower slidebar provided. Increasing the current load will cause the detected voltage to fall. Be sure to select the Apply button. Then hit Refresh to view the new value. Page 199 February 7, 2013
200 8.7 Configuring the 980 HDMI Protocol Analyzer with an EDID Use the procedures below to provision the 980 HDMI Protocol Analyzer Rx port with an EDID to emulate a sink device. To provision the EDID: 1. (optional) Load the EDID to use in the 980 HDMI Protocol Analyzer. This is the EDID that the 980 HDMI Protocol Analyzer will be emulating. The default EDID in the 980 HDMI Protocol Analyzer has a preferred timing of 1080p60 with a maximum TMDS rate of 165MHz. You can provision the 980 HDMI Protocol Analyzer with a different EDID. Sample EDIDs are available from the Quantum Data website on the downloads page ( You can download these EDIDs to the host PC where the 980 GUI Manager is running. Select an EDID file by activating the Set 980 Rx EDID (shown on the screen below). The dialog box shown below opens up. 2. Select an EDID to assign to the 980 HDMI Protocol Analyzer s Rx port. Click Ok after selecting the EDID. Note that there are two checkbox options on the dialog box. The following is a description of each: Permanently set the 980 HDMI Protocol Analyzer s EDID This means that the EDID that you provision will persist through a reboot of the 980. Otherwise the default 980 EDID will be reprovisioned when a reboot occurs. Issue Hot Plug This means that the 980 HDMI Protocol Analyzer will issue a hot plug when you click the OK activation button on this dialog box. Page 200 February 7, 2013
 Connect the HDTV to the 980 s Tx port and then initiating a Read 980 HDMI Protocol Analyzer Tx EDID from the EDID pull-down menu.")
201 If you wish to use a different EDID from an HDTV that you have available you can quickly provision the 980 HDMI Protocol Analyzer with that EDID. 3. (optional) Connect the HDTV to the 980 s Tx port and then initiating a Read 980 HDMI Protocol Analyzer Tx EDID from the EDID pull-down menu. When you initiate a read of the EDID on the Tx port, the following dialog box will appear: 4. Assign a name to the EDID and then click Ok to save the EDID for use on the 980 Rx port. 8.8 Viewing Incoming Video (Built-Embedded GUI only) Prior to a capture you may wish to view the incoming video from the source device under test. This subsection describes how to use the 980 HDMI Protocol Analyzer to view live video. Please note however that you can only view the live video on the built-in GUI through the Real Time Video panel. You cannot view the incoming live video on the 980 GUI Manager application. Page 201 February 7, 2013
202 Note: You can view incoming video bitmaps that are encrypted with HDCP content protection on the external 980 GUI Manager; however, once you power cycle the 980 HDMI Protocol Analyzer it will be removed. To view incoming video on the 980 use the following procedure (examples use HDMI): 1. Ensure that you are sending video from your source device under test. 2. Select the Real Time mode on the built-in front panel by touch selecting the Receiver Mode item on the top banner. Page 202 February 7, 2013
203 A video image appears in the Real Time panel. An example is shown below: You can adjust the image viewing area using the Image Scale dialog box which is accessible from the Video pop-out menu as shown below. Page 203 February 7, 2013


204 Mode The Mode can be either 1:1 or Full. Use the checkbox adjacent to each item to select. The 1:1 selection will show the image in its true size; because the Real Time window on the built-in front panel display does not support higher resolutions, much of the content will not be viewable in the window when 1:1 is selected. The Full mode enables you to view the entire image. When Full is selected you can also select which Aspect Ratio setting to use. Quality The Quality setting determines the frame rate used to show the incoming video. Selecting Low reduces the frame rate. The High selection will display the video in its native frame rate. Aspect Ratio The Aspect Ratio options can be set only if the Mode is set to Full. The Fit option will cause the image to be scaled such that it occupies the entire window. The H:V option will display the image at its native aspect ratio with letter boxing used to fill in the blank area. The 4:3 option will cause the image to scale to a 4:3 aspect ratio. The 16:9 option will cause the image to be scaled to 16:9.Frame: This is the number of frames that have been captured since the Start button was activated. 3. Select the Video Timing panel to view the video characteristics, timing and metadata. Refer to the section Video Timing Panel. Page 204 February 7, 2013
205 4. Select the Video Color panel to view the video color any pixel. Refer to section Video Info Panel. 5. Select other panels in accordance with the data you wish to view. 8.9 Using automatic triggering The 980 provides a variety of automatic triggers available through Capture Control panel. The following procedures describe how to capture data using these automatic triggers. To capture data using automatic triggering: 1. (optional) If you are going to be taking some action on the device under test that will halt video, such as unseating and reseating the HDMI cable, you will need to check the Video Check box in the Capture Configuration section of the Capture Control dialog box. 2. Check the Generate Hot Plug on Capture Start button if you want the 980 to issue a hot plug to initiate HDCP authentication. You also need to specify the duration of hot plug pulse in milliseconds. 3. Set the Capture Buffer Size slidebar to a percent value to meet your requirements. You can capture up to about 2GB of data which is about 1150 frames at 576p/480p and about 204 frames at 1080p which includes Page 205 February 7, 2013

206 the video. If you do not want to capture the video and only capture the metadata, you can store over 100,000 frames of data. 4. Set the Trigger Position within the Buffer slidebar to a percent value to meet your requirements. This slide bar enables you to set the position of the trigger event within the captured data. This is a slidebar that provides an indication (on the left) of the location within the captured data, expressed as a percent with 0% indicating that the trigger event occurs at the beginning of the captured data and 100% indicating that the trigger event occurs at the end of the captured data. Note: When using a Manual trigger it is important to set the Trigger Position to ensure that there is some captured data prior to the manual trigger start point. The manual trigger is particularly useful when you are observing the behavior of a connected sink and then manually initiating the trigger when a particular symptom exhibits itself. Typically, you should move the trigger position to the right nearer the 100% mark. This way you ensure that there is data prior to the trigger event by accounting for reaction time between the time the symptom occurs and you initiate the trigger. 5. Select the Capture tab. 6. Select the Data Selection Type from the pull-down menu provided. The following selections are available: Data Analysis [Audio, Video, Data Islands] - The 980 will capture all the audio packets, video data and the data islands. If you select Data Analysis you can then refine your selection to include or exclude Timing data and Video data using the associated check boxes under the Analysis heading. Only Data Islands - The 980 will only capture the data islands (not the video packets) Matched Data Islands This selection is not required. If you wish to define pre-captured data, you use the Match tab. Page 206 February 7, 2013
207 7. Select the trigger Condition 8. (optional) Specify the Data Island Match for advanced triggering and pre-capture filtering. Refer to Using Precision Trigging and Pre-Capture Filtering. 9. Click on the Execute Capture button. Page 207 February 7, 2013
208 The 980 HDMI Protocol Analyzer will capture the data. A series of dialog boxes will appear showing the capturing in progress (one example shown below). Note: If there is some action that needs to be taken by a user in order to cause the trigger condition occur, the capture dialog box will stating Waiting for capture trigger to occur This is shown in the following screen shot. Page 208 February 7, 2013
209 When the 980 HDMI Protocol Analyzer is done capturing data a decode file is shown in the Event Plot panel and the Data Decode panel. The screen example below shows data captured using the Data Analysis mode with video and audio data captured as well. Page 209 February 7, 2013
210 8.10 Using External Triggering The External Trigger Input enables you to initiate a capture trigger event from an external source. You select the external trigger from the Trigger pull-down menu as shown below: The minimum voltage required to activate the external trigger is 2.1 volts and will accept up to 5V. The pulse duration of the External Trigger must be greater than 1 TMDS pulse clock period. The Trigger Input is on the rear of the 980. It is the top most BNC connector. There are a few 980 configurations; the most common are shown below Using Manual Triggering In addition to the triggers provided in the pull-down menu, you can select to manually trigger on an event. Refer to the screen shot below: Page 210 February 7, 2013
211 Typically manual triggers are used in the Pass-through or Encrypted Link Analyzer mode. In these modes there is a display connected to the 980 HDMI Protocol Analyzer Tx port. A common application would be to observe the connected display and when it exhibits the behavior you are looking for, you can initiate the manual trigger. Page 211 February 7, 2013

212 8.12 Using Precision Trigging and Pre-Capture Filtering If the trigger and data matching selections available on the Data and Trigger menus are not sufficient, you can use the Match feature to define more specific triggering and matching criteria. The 980 HDMI Protocol Analyzer Capture Control function has an advanced triggering and pre-capture filtering function which enables you to specify the triggering and pre-capture filtering with a greater degree of detail. These advanced features are configured through the Match functional tab under the Capture tab shown below. To set the match criteria for either pre-capture filtering or triggering, you check the appropriate box (Data or Trigger) in the Match tab for each Match definition. Once you check either the Data or Trigger checkbox the Edit activation button becomes enabled. Clicking on the Edit activation button will open up the Data Island Match Editor dialog box (shown below). The Data Island Match Editor dialog box is where you define the advance triggering and pre-capture filtering. Note: If you are going to set both a custom match trigger and a custom match data you must use different Match Edit dialog boxes Advanced Triggering using Match Definition You can trigger on a single condition or multiple conditions in the same data island type using one of the Match definitions (Match 1, 2 or 3). When you trigger on multiple conditions using the same Match definition in a single type of data island, the two conditions are treated as a logical AND. This means that only when both conditions are met, will the trigger activate. You can trigger on multiple conditions in the different data island types using two of the Match definitions (Match 1, Match 2). When you trigger on multiple conditions in separate Match definitions, the two conditions are treated as a logical OR. This means that the trigger will activate when either condition is met Advanced Pre-Capture Filtering using Data Match Definition If you are using the Match function at all for advanced triggering, you will have to define the pre-capture filter using a different Match definition. For example if you are using Match 1 to set the triggering, you should use Match 2 or 3 for pre-capture filtering. Page 212 February 7, 2013
213 You can either define a pre-capture filter: 1) for a single specific data island type, 2) for all data islands, or 3) for several types of data islands. If you wish to capture all data islands you use the default setting of Custom in the Match definition. This selection can be found in the Data Island Match Editor on the right side under the heading labeled, Data Island Type. If you wish to capture only a single type of data island, then you specify that type in the Match definition. The example in the figure below shows that the user is defining a trigger condition (or pre-capture filter) based on the value of the video type of the AVI infoframe. Note that you will have to know the binary values of the data island field in order to specify the criteria. This may require that you refer to the HDMI specification and CEA-861-D. There are two tables on the left side of the panel: Data Bytes and Masks. You do not have to set the Masks; they will be set for you when you select an item under the Field in the table on the right. For example in the screen below, RGB/YCbCr Indicator is selected and the mask that applies to those bits, are selected for you. You then have to select the Data Bytes values to define the match criteria. In the example below, the match condition is set such that if the 980 HDMI Protocol Analyzer receives incoming video with a video type of YCbCr 4:4:4 (Hex 40 Y1=1, Y0=0), it will display the data in the appropriate data panel. Page 213 February 7, 2013
214 Setting a Custom Data Match Definition Configuring the system to capture a subset of the data islands is more complex and involves setting the mask data to values for the data island header which satisfies multiple data island types. You do this using the Data Bytes table on the left side of the Data Island Match Editor. For example, if you want to capture only infoframes, you would set the first byte of the header value under Data Bytes to a value that satisfies all infoframes. Since all infoframes have an 8 as the first value in the header, you would set that value to 80. You would set the corresponding value in the Masks table 7F such that only the first bit (most significant) would be used to set the pre-capture filter criteria. This is shown in the screen capture below. Page 214 February 7, 2013
215 8.13 Examining Captured Data The procedures below describe how to view various types of captured data through the Data Decode and Event Plot panels. This procedure assumes that you have captured the data or have opened up a previously captured data file Viewing Data Analysis captures through the Data Decode panel This subsection provides procedures for viewing the captured data taken using one of the Data Analysis capture modes through the Data Decode panel in the 980 GUI Manager. To view captured data through the Data Decode panel: 1. To view the protocol data transactions on the Data Decode panel, activate the Data Decode tab. The Data Decode window shows the protocol data in a report. Page 215 February 7, 2013

216 2. Highlight an AVI infoframe record to view its contents as shown below. The Data Decode window above shows the AVI Infoframe data record selected. The AVI infoframe contents are parsed out in human readable text on the upper panel. The hex representation of the contents is presented in the lower panel. Page 216 February 7, 2013

217 3. Highlight a Vendor Specific infoframe record to view its contents. The example below shows a Vendor Specific infoframe where the HDMI/MHL source is transmitting 3D content in Frame Packing. Page 217 February 7, 2013

218 4. Highlight a General Control Packet record to view its contents as shown below. 5. Highlight an audio infoframe record to view its contents as shown below. Page 218 February 7, 2013

219 6. Highlight an Audio Clock Regeneration packet record to view its contents as shown below. 7. Highlight an audio sample packet record to view its contents as shown below. The number of channels and samples are provided and the content of the samples is shown in the lower panel. Page 219 February 7, 2013
 corresponds to the Left channel and the second subframe (B) corresponds to the Right channel.")
220 8. Highlight an audio sample packet channel status block record to view its contents as shown below. The channel status block is shown in the detailed data window when it is fully acquired, i.e. after the 192 frames are all captured. There are two blocks, one for each subframe A and B. The first subframe (A) corresponds to the Left channel and the second subframe (B) corresponds to the Right channel. You can determine when the channel status bits begin to be acquired by looking at the top section of the Details panel (not shown below). Page 220 February 7, 2013

221 9. Highlight a DDC transaction to view its contents as shown below. The example below shows a BCAPS register read. Page 221 February 7, 2013
222 Viewing Protocol Analysis captures through the Data Decode panel This subsection provides procedures for viewing the captured data taken using the Protocol Analysis capture mode through the Data Decode and Event Plot panels in the 980 GUI Manager. To view captured data through the Data Decode panel: 1. To view the Protocol Analysis data transactions on the Data Decode and Event Plot panels, activate the Data Decode and Event Plot tabs. The screen example below shows data captured using the Protocol Analysis mode. The preamble data is shown as a distinct data type in both the Event Plot and the Data Decode. The guard band data is shown as part of the Video data period in the example Filtering the data in the Data Decode panel The procedures below describe how to filter the data in the Data Decode panel. You use the panel on the right that is adjacent to the Data Decode panel to apply filtering on the data displayed on the Data Decode panel. To apply filters to the data: Page 222 February 7, 2013
223 1. From the Data Decode panel, select the Events activation button to access the Decode Event Selection dialog box The Decode Event Selection dialog box is shown below. In the example below, only some of the data islands are selected. Page 223 February 7, 2013
224 The following is a screen example of the Control Packets page. 2. Select the data items you want to appear in the Data Decode panel. The filtering you apply in this series of dialog boxes also applies to the Event Plot panel. 3. Click the OK button on the bottom right to set your selections or click on the Cancel button to exit without saving the changes. Note that you can clear all the selections on all pages with the Clear All top left. Alternatively you can select all items on all pages with the Select All activation button on the activation button. You can also apply the same Select and Clear operations to each tab of the Decode Event Selection dialog box. Page 224 February 7, 2013

225 Searching through the data in the Data Decode panel The procedures below describe how to search through the data in the Data Decode panel. To search through the data: 1. Click on the Search icon. You can search on a variety of packet types and some of the fields in the Data Decode panel such as Packet, Timestamp, Frame, Line and Pixel. You can also search for a variety of control events such as the occurrence of Avmute in an ACR packet or a Vsync/Hsync. The default is to search Forward which is a search for events that occur later in time. You can change that to search backward by selecting associated radio button. A dialog box appears that enables you can enter search criteria. In this example we will search for an Audio Clock Regeneration packet. The Data Decode panel will then show the next General Control Packet (GCP) packet. If you are searching for a specific packet number, timestamp or frame you will have to enter value in the Find/Goto field. Page 225 February 7, 2013

226 Sometimes you may wish to search for the trigger event. In this case you have to select Any Control Packet under Field / Type and then select Capture Trigger under Sub-Type as shown below Viewing data through the Event Plot panel The Event Plot panel provides you with a graphical view of the data. It enables you to see relationships between the various data types on a time line. A sample screen of the Event Plot is shown below. The operation of the Event Plot is described at: Event Plot Panel. Page 226 February 7, 2013
227 The screen example below shows data captured using the Protocol Analysis mode. The preamble data is shown as a distinct data type in both the Event Plot and the Data Decode. The guard band data is shown as part of the Video data period in the example. Page 227 February 7, 2013
228 9 Passively Monitoring between a Source and Sink Device This chapter describes how to use the 980 HDMI Protocol Analyzer to passively monitor protocol, metadata, timing and auxiliary data between an HDMI/MHL source and an HDMI/MHL sink. There are two configuration modes, the Pass-Through mode and the optional Encrypted Link Analyzer mode. These are described below Pass-Through In the pass-through monitoring configuration the 980 HDMI Protocol Analyzer HDMI Rx port is connected to the source device under test and the 980 HDMI Tx port is connected to a sink device. The pass-through mode enables you to monitor the HDMI/MHL traffic passively between an HDMI/MHL source and an HDMI/MHL sink device. If the video content from the source device is unencrypted you will be able to see all the data through the capture period. If the video content from the source device is encrypted with HDCP you will be able to see all the data and the incoming video up until encryption is enabled. Once encryption is enabled, you will be able to see the HDMI DDC or MHL C-Bus and CEC transactions and the timing parameters but not the HDMI/MHL data islands. The HDCP transactions that you will see are the transactions that occur between the source and the sink device. In pass-through mode the 980 passes through the EDID of the display to the source device under test. The 980 HDMI Protocol Analyzer does not function as an HDCP repeater. Note: For MHL 2.0 using the TPA-MHL2-8R test point adapter, the Pass-Through mode is only supported in MHL Normal mode and only for the TMDS stream; it is not supported in Packed Pixel mode and the CBUS traffic is not passed through Encrypted Link Analyzer In the (optional) Encrypted Link Analyzer configuration the 980 HDMI Protocol Analyzer HDMI Rx port is connected to the source device under test and the 980 HDMI Tx port is connected to a sink device. The Encrypted Link Analyzer configuration enables you to monitor and analyze HDCP encrypted protocol data transmitted between an HDMI source device and sink device. Note that you will not be able to view the HDCP transactions between the source and the sink. With the Encrypted Link Analyzer you can investigate HDMI interoperability while the content is encrypted by viewing the metadata in real time and observing the behavior of the downstream sink device. The Encrypted Link Analyzer enables you to capture the encrypted metadata and store it for detailed analysis. With the capture operation, you can monitor the downstream HDMI sink device for particular symptoms and then initiate a capture when the symptoms exhibit themselves. This ensures that the relevant data data related to interoperability is captured. Note: For MHL 2.0 using the TPA-MHL2-8R test point adapter, the Encrypted Link Analyzer mode is only supported in MHL Normal mode and only for the TMDS stream; it is not supported in Packed Pixel mode and the CBUS traffic is not passed through. 9.2 Running HDMI tests using the Pass-Through Mode This section describes how to use the 980 HDMI Protocol Analyzer Pass-Through feature in the Capture and Store mode. The Pass-Through mode enables you to monitor the HDMI traffic passively between an HDMI source and an HDMI sink device. In the Pass-Through mode the 980 HDMI Protocol Analyzer Rx port is connected to the source device under test and the 980 HDMI Protocol Analyzer Tx port is connected to a display device. The source device can be used with HDCP authentication and encryption but you will not be able to see the encrypted data or video once the data is Page 228 February 7, 2013
229 \ 980 HDMI Protocol Analyzer Gen 3 System User Guide Rev. C6 encrypted. If the video content from the source device is encrypted with HDCP you will be able to see all the data until encryption is enabled. Once encryption is enabled, you will only be able to see the DDC, CEC traffic and the timing parameters. Note: On the MHz Gen 2 unit pass through on the Tx port is limited to 165MHz. On the MHz Gen 3 unit pass through on the Tx port is up to 297MHz. The setup is depicted in the illustration below for HDMI testing. HDMI configuration for pass-through/encrypted Link Analyzer (Rev D Protocol Analyzer module) Page 229 February 7, 2013
230 HDMI configuration for pass-through/encrypted Link Analyzer (Rev C Protocol Analyzer module) Pass-through is enabled through 980 GUI Manager. Use the following procedures to activate and use the pass-through mode and refer to the connection diagrams above. To connect a source under test to a sink device in pass-through mode: 1. Connect the HDMI-to-HDMI cable provided from your HDMI source device under test to the topmost HDMI connector on the back of the 980 HDMI Protocol Analyzer. Refer to the connection diagrams above above. 2. Connect a second HDMI-to-HDMI cable from the HDMI display device to the bottom HDMI connector on the back of the 980 HDMI Protocol Analyzer. Refer to the connection diagrams above above. 3. Power up the 980 HDMI Protocol Analyzer using the power rocker switch on the back. Then press the power on button on the front panel Configuring the 980 with an EDID When in Pass-Through mode, the EDID of the far end display is passed through to the source device under test. HDCP authentication is achieved directly with the far end display. The 980 HDMI Protocol Analyzer does not act as an HDCP repeater Setting the Configuration of the Link Mode Prior to a capturing or viewing video you will need to set the Link Mode to Pass-Through. When using the Pass-Through mode configuration you will connect an HDMI display device to the HDMI Tx port. To set the configuration of the link mode: Page 230 February 7, 2013
231 1. Ensure that you are sending video from your source device under test. 2. Select the Mode item from the Instrument pull-down menu on the built-in front panel as shown below. The mode dialog box appears as shown below. 2. Select the Pass-Through Link Mode item from the pull-down menu on the built-in front panel as shown below. Page 231 February 7, 2013
232 The Link Mode dialog box indicates that you have selected the Pass-Through mode: Checking the TX-RX HPD checkbox will replicate the hot plug signal from the TX side (an attached sink device) on the RX side (like a hot plug repeater) Setting the 980 HDMI Protocol Analyzer mode to HDMI Use the following procedures to set the 980 HDMI Protocol Analyzer to the HDMI mode. To set the 980 HDMI Protocol Analyzer mode to HDMI: 1. From the Instrument menu, select the Link Mode. Page 232 February 7, 2013
233 The following menu appears: 2. Select the pull-down menu as shown below and select the HDMI Monitor checkbox. The default mode is HDMI. The Link Mode menu will show HDMI as the Link Mode. Page 233 February 7, 2013
234 9.2.4 Initiating a Capture Typically in the Capture mode you will want to specify a manual capture. With the manual capture, you can monitor the downstream HDMI sink device for particular behavior or symptom to a problem and then initiate a capture when the particular condition exhibits itself. This ensures that the relevant data data related to interoperability is captured. Use the procedures below to initiate a new capture. 1. (optional) If you are going to be taking some action on the device under test that will halt video, such as unseating and reseating the HDMI cable, you will need to check the Video Check box in the Capture Configuration section of the Capture Control dialog box. 2. Check the Generate Hot Plug on Capture Start button if you want the 980 HDMI Protocol Analyzer to issue a hot plug to initiate HDCP authentication. You also need to specify the duration of hot plug pulse in milliseconds. 3. Set the Capture Buffer Size slidebar to a percent value to meet your requirements. You can capture up to about 2GB of data which is about 1150 frames at 576p/480p and about 204 frames at 1080p which includes the video. If you do not want to capture the video and only capture the metadata, you can store well over 100,000 frames of data. 4. Set the Trigger Position within the Buffer slidebar to a percent value to meet your requirements. This slide bar enables you to set the position of the trigger event within the captured data. This is a slidebar that provides an indication (on the left) of the location within the captured data, expressed as a percent with 0% indicating that the trigger event occurs at the beginning of the captured data and 100% indicating that the trigger event occurs at the end of the captured data. Note: When using a Manual trigger it is important to set the Trigger Position to ensure that there is some captured data prior to the manual trigger start point. The manual trigger is particularly useful when you are observing the behavior of a connected sink and then manually initiating the trigger when a particular symptom exhibits itself. Typically, you should move the trigger position to the right nearer the 100% mark. This way you ensure that there is data prior to the trigger event by accounting for reaction time between the time the symptom occurs and you initiate the trigger. Page 234 February 7, 2013
235 5. Select the Capture tab. 6. Select the Data Selection Type from the pull-down menu provided. Refer to the table above to learn what each option does. 7. Select the Trigger selection Condition. Note: If you wish to define a precise trigger using the Match feature, refer to section Defining Precision Triggering and Pre-Capture Filtering. 8. (optional) Specify the Data Island Match for advanced triggering and pre-capture filtering. Refer to the Panel Descriptions section in Chapter 2: Overview of the 980 Manager GUI. 9. Click on the Execute Capture button. Page 235 February 7, 2013

236 The 980 HDMI Protocol Analyzer will capture the data. A series of dialog boxes will appear showing the capturing in progress (one example shown below). Note: If there is some action that needs to be taken by a user in order to cause the trigger condition occur, the capture dialog box will stating Waiting for capture trigger to occur This is shown in the following screen shot. When the 980 HDMI Protocol Analyzer is done capturing data a decode file is shown in the Event Plot panel and the Data Decode panel. Page 236 February 7, 2013
237 9.3 Running MHL tests using the Pass-Through Mode This section describes how to use the 980 HDMI Protocol Analyzer Pass-Through feature in the Capture and Store mode. The Pass-Through mode enables you to monitor the MHL traffic passively between an MHL source and an MHL sink device. Pass-Through monitoring of MHL devices requires the TPA-MHL-8R; refer to the MHL Quick Start Guide on the Quantum Data webpage for MHL for more information on the TPA-MHL-8R: Note: For MHL 2.0 using the TPA-MHL2-8R test point adapter, the Pass-Through mode is only supported in MHL Normal mode and only for the TMDS stream; it is not supported in Packed Pixel mode and the CBUS traffic is not passed through. In the Pass-Through mode the 980 HDMI Protocol Analyzer Rx port is connected to the source device under test and the 980 HDMI Protocol Analyzer Tx port is connected to a display device. If the video content from the source device is encrypted with HDCP you will be able to see all the metadata and protocol data up until the point encryption is enabled. Once encryption is enabled, you will only be able to see the timing data and the HDCP and EDID traffic if you were also monitoring the C-Bus transactions. You can monitor the MHL TMDS metadata, protocol data and timing with or without also monitoring the MHL C-Bus transactions. There are two sets of procedures below for each case. If the MHL content for the source is unencrypted you will be able to see all the MHL TMDS metadata, timing, protocol and control data Monitoring MHL TMDS stream in the Pass-Through mode Use the procedures in this section to monitor the MHL TMDS stream between an MHL source and an MHL sink device. The test setup for passively monitoring the MHL TMDS stream between an MHL source and MHL sink device is shown below. Note that the procedures and setup in this procedure only allow you to monitor the MHL TMDS stream. The next set of procedures enable you to monitor the MHL TMDS stream and the C-Bus transactions. To connect an MHL 1.2 source under test to an MHL 1.2 sink device in pass-through mode: SHOULD ALSO SHOW REV D BOARD Page 237 February 7, 2013
238 MHL1.2 configuration for pass-through/encrypted Link Analyzer (Rev C Protocol Analyzer module) 1. Apply power to the TPA-MHL-8R device by plugging in the 12VDC power adapter provided with the TPA. 2. Connect an MHL cable from your MHL 1.2 source device under test to the connector on the TPA-MHL-8R labeled MHL IN FROM DUT on the section of the TPA labeled 980 CONNECTIONS SOURCE DUT. 3. Connect an HDMI-to-HDMI cable from the connector labeled OUT TO 980 PORT 1 on the section of the TPA labeled 980 CONNECTIONS SOURCE DUT to the 980 HDMI Rx port (topmost HDMI connector - see image below). 4. Connect an HDMI-to-HDMI cable from the 980 HDMI Tx connector (lower HDMI connector see image below) on the 980 to the connector on the TPA-MHL-8R labeled HDMI IN on the section of the TPA labeled 882 CONNECTIONS SINK DUT. 5. Connect an MHL cable from your MHL 1.2 sink device under test to the connector on the TPA-MHL-8R labeled MHL OUT TO DUT on the section of the TPA labeled 882 CONNECTIONS SINK DUT. To connect an MHL 2.0 source under test to an MHL 2.0 sink device in pass-through mode: Page 238 February 7, 2013
239 MHL2.0 configuration for pass-through/encrypted Link Analyzer (Rev C Protocol Analyzer module) MHL2.0 configuration for pass-through/encrypted Link Analyzer (Rev D Protocol Analyzer module) Page 239 February 7, 2013
240 1. Apply power to the TPA-MHL2-8R device by plugging in the 12VDC power adapter provided with the TPA. 2. Connect an MHL cable from your MHL 2.0 source device under test to the connector on the TPA-MHL2-8R labeled MHL IN FROM DUT on the section of the TPA labeled VIDEO ANALYSIS MHL SOURCE DUT. 3. Connect an HDMI-to-HDMI cable from the connector labeled TO PROTOCOL ANALYZER RX on the section of the TPA labeled VIDEO ANALYSIS MHL SOURCE DUT to the 980 HDMI Rx port (topmost HDMI connector - see image below). 4. Connect an HDMI-to-HDMI cable from the 980 HDMI Tx connector (lower HDMI connector see image below) on the 980 to the connector on the TPA-MHL2-8R labeled HDMI IN on the section of the TPA labeled HDMI -> MHL - MHL SINK DUT. 5. Connect an MHL cable from your MHL 2.0 sink device under test to the connector on the TPA-MHL2-8R labeled MHL OUT TO DUT on the section of the TPA labeled HDMI -> MHL - MHL SINK DUT Configuring the 980 HDMI Protocol Analyzer with an EDID When in Pass-Through mode, the EDID of the far end display is passed through to the source device under test. HDCP authentication is achieved directly with the far end display. The 980 HDMI Protocol Analyzer does not act as an HDCP repeater Setting the Configuration of the Link Mode Prior to a capturing or viewing video you will need to set the Link Mode to Pass-Through. To set the configuration of the link mode: 1. Ensure that you are sending video from your source device under test. 2. Select the Mode item from the Instrument pull-down menu on the built-in front panel as shown below. Page 240 February 7, 2013
241 The mode dialog box appears as shown below. 3. Select the Pass-Through Link Mode item from the pull-down menu on the built-in front panel as shown below. The Link Mode dialog box indicates that you have selected the Pass-Through mode: Checking the TX-RX HPD checkbox will replicate the hot plug signal from the TX side (an attached sink device) on the RX side (like a hot plug repeater) Setting the 980 HDMI Protocol Analyzer mode to MHL Use the following procedures to set the 980 HDMI Protocol Analyzer to the MHL mode. To set the 980 HDMI Protocol Analyzer mode to MHL: 1. From the Instrument menu, select the Link Mode. Page 241 February 7, 2013

242 The following menu appears: 2. Select the pull-down menu as shown below and select the MHL Monitor checkbox. The default mode is HDMI. The Link Mode menu will show MHL as the Link Mode. Page 242 February 7, 2013
243 9.3.5 Initiating a Capture Typically in the Capture mode you will want to specify a manual capture. With the manual capture, you can monitor the downstream MHL sink device for particular behavior or symptom to a problem and then initiate a capture when the particular condition exhibits itself. This ensures that the relevant data data related to interoperability is captured. Use the procedures below to initiate a new capture. 1. (optional) If you are going to be taking some action on the device under test that will halt video, such as unseating and reseating the MHL cable, you will need to check the Video Check box in the Capture Configuration section of the Capture Control dialog box. 2. Check the Generate Hot Plug on Capture Start button if you want the 980 HDMI Protocol Analyzer to issue a hot plug to initiate HDCP authentication. You also need to specify the duration of hot plug pulse in milliseconds. 3. Set the Capture Buffer Size slidebar to a percent value to meet your requirements. You can capture up to about 2GB of data which is about 1150 frames at 576p/480p and about 204 frames at 1080p which includes the video. If you do not want to capture the video and only capture the metadata, you can store well over 100,000 frames of data. 4. Set the Trigger Position within the Buffer slidebar to a percent value to meet your requirements. This slide bar enables you to set the position of the trigger event within the captured data. This is a slidebar that provides an indication (on the left) of the location within the captured data, expressed as a percent with 0% indicating that the trigger event occurs at the beginning of the captured data and 100% indicating that the trigger event occurs at the end of the captured data. Note: When using a Manual trigger it is important to set the Trigger Position to ensure that there is some captured data prior to the manual trigger start point. The manual trigger is particularly useful when you are observing the behavior of a connected sink and then manually initiating the trigger when a particular symptom exhibits itself. Typically, you should move the trigger position to the right nearer the 100% mark. This way you ensure that there is data prior to the trigger event by accounting for reaction time between the time the symptom occurs and you initiate the trigger. Page 243 February 7, 2013
244 5. Select the Capture tab. 6. Select the Data Selection Type from the pull-down menu provided. Refer to the table above to learn what each option does. 7. Select the Trigger selection Condition. Note: If you wish to define a precise trigger using the Match feature, refer to section Defining Precision Triggering and Pre-Capture Filtering. 8. (optional) Specify the Data Island Match for advanced triggering and pre-capture filtering. Refer to the Panel Descriptions section in Chapter 2: Overview of the 980 Manager GUI. 9. Click on the Execute Capture button. Page 244 February 7, 2013
245 The 980 HDMI Protocol Analyzer will capture the data. A series of dialog boxes will appear showing the capturing in progress (one example shown below). Note: If there is some action that needs to be taken by a user in order to cause the trigger condition occur, the capture dialog box will stating Waiting for capture trigger to occur This is shown in the following screen shot. When the 980 Protocol Analyzer is done capturing data a decode file is shown in the Event Plot panel and the Data Decode panel. Page 245 February 7, 2013
246 Page 246 February 7, 2013
247 9.4 Running HDMI tests using the Encrypted Link Analyzer This section describes how to use the optional Encrypted Link Analyzer feature in the Capture and Store mode. The general operations of the 980 such as setting up the triggers, capture buffer, pre-capture filtering, post capture filtering and searching etc. described in the previous section apply to the Encrypted Link Analyzer mode. Exceptions only will be covered in this section. Note: You must have purchased the Encrypted Link Analyzer option in order to be able to use this feature. In the Encrypted Link Analyzer mode, the 980 HDMI Protocol Analyzer HDMI Rx port is connected to the source device under test and the 980 HDMI Protocol Analyzer HDMI Tx port is connected to a sink device. The Encrypted Link Analyzer enables you to monitor and analyze HDCP encrypted protocol data transmitted between an HDMI source device and sink device. With the Encrypted Link Analyzer you can investigate HDMI interoperability while the content is encrypted by viewing the protocol data (data islands, infoframes, control and timing data) in real time and observing the behavior of the downstream sink device. You can also capture the encrypted metadata and store it for detailed analysis. Note that you will not be able to view the HDCP transactions between the source and the sink. The Encrypted Link Analyzer is especially useful in the Capture mode. Typically in the Capture mode you will want to specify a manual capture. With the manual capture, you can monitor the downstream HDMI sink device for a particular behavior or symptom to a problem and then initiate a capture when the particular condition exhibits itself. This ensures that the relevant data data related to interoperability is captured. HDMI configuration for pass-through/encrypted Link Analyzer (Rev D Protocol Analyzer module) Page 247 February 7, 2013
248 HDMI configuration for pass-through/encrypted Link Analyzer (Rev C Protocol Analyzer module) To connect a source under test to a sink device in Encrypted Link Analyzer mode: 1. Connect the HDMI-to-HDMI cable provided from your HDMI source device under test to the topmost HDMI connector on the back of the 980 HDMI Protocol Analyzer. Refer to the connection diagrams above. 2. Connect a second HDMI-to-HDMI cable from the HDMI display device to the bottom HDMI connector on the back of the 980 HDMI Protocol Analyzer. Refer to the connection diagrams above. 3. Power up the 980 HDMI Protocol Analyzer using the power rocker switch on the back. Then press the power on button on the front panel Configuring the 980 with an EDID Use the procedures below to provision the 980 HDMI Protocol Analyzer Rx port with an EDID. Typically when using the Encrypted Link Analyzer you will want to provision the 980 HDMI Protocol Analyzer Rx port with the EDID of the downstream sink device. However there are exceptions. For example, if the EDID of the downstream sink is flawed in some way you may wish to use a standard known-good EDID provided by the 980 HDMI Protocol Analyzer. To provision the EDID: 1. (optional) Load the EDID to use in the 980 HDMI Protocol Analyzer. This is the EDID that the 980 will be emulating. The default EDID in the 980 HDMI Protocol Analyzer has a preferred timing of 1080p60 with a maximum TMDS rate of 165MHz. You can provision the 980 with a different EDID. Sample EDIDs are available from the Quantum Data website on the downloads page ( Page 248 February 7, 2013
249 You can download these EDIDs to the host PC where the 980 Manager is running. If you are in Pass-Through or Encrypted Link Analyzer mode you can also read the EDID of the downstream display (connected to the Tx port of the 980 HDMI Protocol Analyzer) and then provision the 980 HDMI Protocol Analyzer Rx port with that EDID. Select an EDID file by activating the Set 980 Rx EDID (shown on the screen below). The dialog box shown below opens up enabling you to select an EDID to assign to the 980 HDMI Protocol Analyzer s Rx port. Note that there are two checkbox options on the dialog box. The following is a description of each: Permanently set the 980 HDMI Protocol Analyzer s EDID This means that the EDID that you provision will persist through a reboot of the 980. Otherwise the default 980 HDMI Protocol Analyzer EDID will be reprovisioned when a reboot occurs. Issue Hot Plug This means that the 980 HDMI Protocol Analyzer will issue a hot plug when you click the OK activation button on this dialog box. You can use the EDID of an HDTV that you have on hand. In cases where you are using the Pass-Through mode or the Encrypted Link Analyzer mode you can use the EDID of the downstream HDTV. Page 249 February 7, 2013

250 If you wish to use the EDID of the downstream HDTV or a different EDID from some other HDTV that you have available you can quickly provision the 980 HDMI Protocol Analyzer with that EDID by connecting the HDTV to the 980 HDMI Protocol Analyzer s Tx port and then initiating a Read 980 Tx EDID from the EDID pull-down menu. When you initiate a read of the EDID on the Tx port, the following dialog box will appear: When you click Ok a dialog box appears Setting the Configuration Link Mode Prior to a capturing or viewing video you will need to set the Link Mode to Encrypted Link Analyzer. When using the Encrypted Link Analyzer configuration you will connect an HDMI display device to the HDMI Tx port. 1. Ensure that you are sending video from your source device under test. 2. Select the Link Mode item from the Instrument pull-down menu on the built-in front panel as shown below. Page 250 February 7, 2013
251 3. The mode dialog box appears as shown below. 4. Use the pull-down menu on the Link Mode dialog box to set the Encrypted Link Analyzer mode Setting the 980 HDMI Protocol Analyzer mode to HDMI Page 251 February 7, 2013

252 Use the following procedures to set the 980 HDMI Protocol Analyzer to the HDMI mode. To set the 980 HDMI Protocol Analyzer mode to HDMI: 1. From the Instrument menu, select the Link Mode. The following menu appears: 2. Select the pull-down menu as shown below and select the HDMI Monitor checkbox. The default mode is HDMI. Page 252 February 7, 2013
253 The Link Mode menu will show HDMI as the Link Mode Setting the +5V levels The 980 enables you to view the +5V levels from the source device under test and to set the current load on the +5V lead. 1. Select the RX 5 Volts item from the Instrument pull-down menu on the built-in front panel as shown below. Page 253 February 7, 2013
254 The RX 5V Status/Configuration dialog box is displayed as shown below. 2. Note the current Measured 5V level (4.98 in the example above). 3. Select the Threshold Level using the upper slidebar (0.0 to 5.3V). Be sure to select the Apply button. Then hit Refresh to view the new value. You may wish to lower the threshold to enable testing of a source whose 5V Page 254 February 7, 2013

255 level is too low. If you specify a threshold higher than the voltage detected there will be no effect on the ability to test. 4. Select the current Load using the lower slidebar provided. Increasing the current load will cause the detected voltage to fall. Be sure to select the Apply button. Then hit Refresh to view the new value Setting the HDCP mode The 980 HDMI Protocol Analyzer enables you to enable and disable HDCP on the Rx sink emulation port. This enables you to test how your source device under test responds to a sink that does not support HDCP. You can also configure certain HDCP configuration registers such as the BSTATUS and BCAPS. Use the following procedures to set the HDCP mode and registers. 1. Select the RX HDCP Settings item from the Instrument pull-down menu on the built-in front panel as shown below. The mode dialog box appears as shown below. Page 255 February 7, 2013

256 2. Select the Link Mode item from the pull-down menu on the built-in front panel as shown below. A pop out menu will appear enabling you to select the desired mode using the check boxes provided: HDCP Enabled In the Enabled mode, the 980 HDMI Protocol Analyzer sink emulator will respond to HDCP authentication from a source device under test. When disabled the 980 sink emulator will not respond to an HDCP authentication request. BSTATUS This check box enables you to toggle between the 980 HDMI Protocol Analyzer sink emulator responding to a source HDCP authentication by indicating in its BSTATUS register that it is or is DVI in HDMI mode. Set BCAPS This check box opens up a dialog box enabling you to configure the bits of the BCAPS register. The dialog box is shown below. You can set the bits by clicking on that bit. Clicking on any one bit will toggle the binary value. The hex value of the BCAPS register is shown in the field above the bit values (80 in the example below) Initiating a Capture Typically in the Capture mode you will want to specify a manual capture when using the Encrypted Link Analyzer. With the manual capture, you can monitor the downstream HDMI sink device for particular behavior or symptom to a problem and then initiate a capture when the particular condition exhibits itself. This ensures that the relevant data data related to interoperability is captured. Use the procedures below to initiate a new capture. 1. (optional) If you are going to be taking some action on the device under test that will halt video, such as unseating and reseating the HDMI cable, you will need to check the Video Check box in the Capture Configuration section of the Capture Control dialog box. Page 256 February 7, 2013

257 2. Check the Generate Hot Plug on Capture Start button if you want the 980 HDMI Protocol Analyzer to issue a hot plug to initiate HDCP authentication. You also need to specify the duration of hot plug pulse in milliseconds. 3. Set the Capture Buffer Size slidebar to a percent value to meet your requirements. You can capture up to about 2GB of data which is about 1150 frames at 576p/480p and about 204 frames at 1080p which includes the video. If you do not want to capture the video and only capture the metadata, you can store well over 100,000 frames of data. 4. Set the Trigger Position within the Buffer slidebar to a percent value to meet your requirements. This slide bar enables you to set the position of the trigger event within the captured data. This is a slidebar that provides an indication (on the left) of the location within the captured data, expressed as a percent with 0% indicating that the trigger event occurs at the beginning of the captured data and 100% indicating that the trigger event occurs at the end of the captured data. Note: When using a Manual trigger it is important to set the Trigger Position to ensure that there is some captured data prior to the manual trigger start point. The manual trigger is particularly useful when you are observing the behavior of a connected sink and then manually initiating the trigger when a particular symptom exhibits itself. Typically, you should move the trigger position to the right nearer the 100% mark. This way you ensure that there is data prior to the trigger event by accounting for reaction time between the time the symptom occurs and you initiate the trigger. Refer to the settings below which are typical. 5. Select the Capture tab. 6. Select the Data Selection Type from the pull-down menu provided. Refer to the table above to learn what each option does. Page 257 February 7, 2013
258 7. Select the Trigger selection Condition. Note: If you wish to define a precise trigger using the Match feature, refer to section Defining Precision Triggering and Pre-Capture Filtering 8. (optional) Specify the Data Island Match for advanced triggering and pre-capture filtering. Refer to the Panel Descriptions section in Chapter 2: Overview of the 980 Manager GUI. 9. Click on the Execute Capture button. The 980 Protocol Analyzer will capture the data. A series of dialog boxes will appear showing the capturing in progress (one example shown below). Note: If there is some action that needs to be taken by a user in order to cause the trigger condition occur, the capture dialog box will stating Waiting for capture trigger to occur This is shown in the following screen shot. Page 258 February 7, 2013
259 When the 980 Protocol Analyzer is done capturing data a decode file is shown in the Event Plot panel and the Data Decode panel. Page 259 February 7, 2013
260 10 Running Standard Tests This chapter describes how to use the 980 HDMI Protocol Analyzer special tests. The 980 HDMI Protocol Analyzer supports the following special tests: Video timing analysis Verifies that the timing parameters from an HDMI/MHL source device including all horizontal and vertical parameters. Video analysis Enables you to check the video parameters and pixel values from the HDMI/MHL source device. Audio analysis - Identify audio inconsistencies in metadata related to sampling rate and audio clock recover that could result in interoperability problems. AVmute Verifies that an HDMI source has implemented Avmute properly Running a video timing test The procedures below describe how to run the video timing test on an HDMI source device through the 980 GUI Manager. This subsection describes how to use the 980 HDMI Protocol Analyzer to run a timing test on an HDMI or MHL source device. The setup procedures described above in the section: Analyzing HDMI/MHL Data with your 980 Protocol Analyzer should be followed for the timing tests. These setup procedures are listed below: 1. Configure the 980 HDMI Protocol Analyzer in the proper mode HDMI or MHL. 2. Set the threshold of the +5V. 3. Configure the 980 HDMI Protocol Analyzer Rx port with the proper EDID. 4. View the incoming video in real time to check the status of the device under test. To run the video timing test: 1. Select the 980 HDMI Protocol Analyzer that you are using to capture the data from your HDMI/MHL source device under test from the pull-down menu. 2. Set the Capture Buffer Size slidebar to a percent value to meet your requirements. You can capture up to about 2GB of data which is about 1150 frames at 576p/480p and about 204 frames at 1080p which includes the video. If you do not want to capture the video and only capture the metadata, you can store well over 100,000 frames of data. Page 260 February 7, 2013
261 3. Set the Capture Buffer Position slidebar to a percent value to meet your requirements. This slide bar enables you to set the position of the trigger event within the captured data. This is a slidebar that provides an indication (on the right) of the location within the captured data, expressed as a percent with 0% indicating that the trigger event occurs at the beginning of the captured data and 100% indicating that the trigger event occurs at the end of the captured data. 4. Select the Capture tab under the Options section of the Capture Control panel. 5. Select Data Analysis (Audio, Video, Data Islands) in the Data Selection Type pull-down menu provided as shown below. Then make sure you check the Timing check box. 6. Select Vsync Asserted for the Trigger Selection condition. 7. Click on the Execute Capture button to initiate the test. Page 261 February 7, 2013
262 The 980 Protocol Analyzer will capture the data including the timing data. A series of dialog boxes will appear showing the capturing in progress (one example shown below). Note: If there is some action that needs to be taken by a user in order to cause the trigger condition occur, the capture dialog box will indicate that. This is shown in the following screen shot. When the 980 HDMI Protocol Analyzer is done capturing data you can view the timing parameters in the Timing Analyzer panel. The Timing Analysis panel has three subpanels: 1) Video Format, 2) Frame Statistics 3) Line Statistics. The Video Format panel shows a summary of the key parameters and indicates the standard format timing that the timing parameters detected from the source match. If there is not a precise match between the timing parameters of a format in the 980 HDMI Protocol Analyzer format library and the measured values, the 980 will select the format nearest to the values measured and indicate any parameters that deviate from that standard timing. The Frame Statistics panel shows the frame or vertical parameters. When you highlight a particular frame, the parameters for each of the lines in that frame are listed in the Line Statistics panel. The Frame Statistics panel also indicates whether the frame is encrypted or not. If the frame is encrypted a key icon will be shown on the left side of each frame. Refer to the screen example below. Page 262 February 7, 2013

263 . Page 263 February 7, 2013

264 You can view captured 3D timing in the Timing Analysis panel. The screen shot below shows an example of a 3D timing data for the Frame Packing format at 720p60. Note the vertical active timing (1470 lines). Page 264 February 7, 2013
265 You can view 4K by 2K timing data on the 980 HDMI Protocol Analyzer 297MHz Gen 3 version of the Protocol Analyzer. Page 265 February 7, 2013
266 10.2 Running a video analysis test The procedures below describe how to run the video analysis test on an HDMI/MHL source device through the 980 Manager. The Video Analysis panel enables you to view the captured video images. It provides thumbnails of each captured frame. It also enables you to navigate to the Data Decode panel to view the transactions for that frame. The Video Analysis panel can synchronize with the Data Decode panel by pressing the ALT key and clicking on a frame. You can also synchronize by activating the sync button on the upper left side of the Data Decode panel. Once you synchronize the Data Decode panel to a frame you can view the transactions for that frame in the Data Decode panel. The setup procedures described above in the section: Analyzing HDMI/MHL Data with your 980 Protocol Analyzer should be followed for the video analysis tests. These setup procedures are listed below: 1. Configure the 980 HDMI Protocol Analyzer in the proper mode HDMI or MHL. 2. Set the threshold of the +5V. 3. Configure the 980 Rx port with the proper EDID. 4. View the incoming video in real time to check the status of the device under test. To run the video analysis test: 1. Select the 980 HDMI Protocol Analyzer that you are using to capture the data from your HDMI source device under test from the pull-down menu. 2. Set the Capture Buffer Size slidebar to a percent value to meet your requirements. You can capture up to about 2GB of data which is about 1150 frames at 576p/480p and about 204 frames at 1080p which includes the video. If you do not want to capture the video and only capture the metadata, you can store well over 100,000 frames of data. 3. Set the Capture Buffer Position slidebar to a percent value to meet your requirements. This slide bar enables you to set the position of the trigger event within the captured data. This is a slidebar that provides an indication (on the right) of the location within the captured data, expressed as a percent with 0% indicating that the trigger event occurs at the beginning of the captured data and 100% indicating that the trigger event occurs at the end of the captured data. 4. Select the Capture tab under the Options section of the Capture Control panel. Page 266 February 7, 2013
267 5. Select Data Analysis (Audio, Video, Data Islands) in the Data Selection Type pull-down menu provided as shown below. Then make sure you check the Video Analysis check box. 6. Select Vsync Asserted for the Trigger Selection condition. 7. Click on the Execute Capture button to initiate the test. The 980 Protocol Analyzer will capture the data including the video data. A series of dialog boxes will appear showing the capturing in progress (one example shown below). Note: If there is some action that needs to be taken by a user in order to cause the trigger condition occur, the capture dialog box will indicate that. This is shown in the following screen shot. Page 267 February 7, 2013
268 When the 980 Protocol Analyzer is done capturing data you can view the video thumbnails in the Video Analysis panel. The Video Analysis panel enables you to view the captured video images. It provides thumbnails of each captured frame. Note: You cannot view video frames of video that is encrypted with HDCP. The Video Analysis will show blue thumbnails and the word Encrypted will be shown in the upper left corner of the panel as shown below. Page 268 February 7, 2013
269 Page 269 February 7, 2013
270 8. View the pixel values of any frame by double clicking on any frame to open up the Video Image Viewer panel (shown below). The Video Analysis panel enables you view the video pattern or content for a frame in full size by simply double clicking on a frame. Once you have activated the full view of a frame in the Video Image Viewer panel you can view the pixel values for any pixel by moving your mouse over the pattern. In the example below pixel (x=537, y=184) is selected. Its RGB color values are (R=180, G=16, B=16). If the color space is YCbCr the Video Image Viewer will show these values and indicate the color space. Deep color values are also shown in either YCbCr or RGB color space. You can advance to an adjacent pixel (up/down or left/right) using the thick green arrow buttons on the bottom of the Video Image Viewer panel. You can advance to the image of an adjacent frame (earlier or later) using the thin green arrow buttons / on the bottom of the Video Image Viewer panel. Page 270 February 7, 2013
271 These are shown in the screen image below. Page 271 February 7, 2013
272 You can view captured 3D images in the Video Analysis panel. The 3D images appear adjacent to one another in the window, either side by side or one on top and the other below it for the left and right eyes depending on the 3D structure that is used. The screen shot below shows an example of a 3D image in the Frame Packing format at 720p60. Note the vertical timing (1470 lines) shown in the heading area just above the top image. 9. Navigate to the Data Decode panel by first synchronizing the Data Decode Panel to the Video Analysis panel and then activating the Data Decode panel. The Video Analysis panel is shown in the screen image below. The Video Analysis panel can synchronize with the Data Decode panel by pressing the ALT key and clicking on a frame. You can also synchronize by activating the sync button Decode panel. on the upper left side of the Data Page 272 February 7, 2013
273 10.3 Audio Analysis The Audio (Data) Analysis feature enables you to detect inconsistencies in the metadata relating to the sampling rate and the audio clock regeneration values. The following items are listed and/or verified during the test: Sampling rate shown in the Audio Infoframe. Sampling size (bit depth) in the Audio Infoframe. Channel count in the Audio Infoframe. N and CTS values in the Audio Clock Regeneration packets. Audio type listed in the Channel Status Blocks. Sampling frequency in the Channel Status Blocks. Original sampling frequency listed in the Channel Status Blocks. Channel count listed in the Channel Status Blocks. Sampling rate calculated from the audio samples. Rate that the ACR packets are transmitted. The setup procedures described above in the section: Analyzing HDMI/MHL Data with your 980 Protocol Analyzer should be followed for the audio analysis tests. These setup procedures are listed below: 1. Configure the 980 HDMI Protocol Analyzer in the proper mode HDMI or MHL. 2. Set the threshold of the +5V. 3. Configure the 980 HDMI Protocol Analyzer Rx port with the proper EDID. 4. View the incoming video in real time to check the status of the device under test. To run the audio analysis test: 1. Select the 980 that you are using to capture the data from your HDMI/MHL source device under test. 2. Set the Capture Buffer Size slidebar to a percent value to meet your requirements. You can capture up to about 2GB of data which is about 1150 frames at 576p/480p and about 204 frames at 1080p which includes the video. Since you do not need to capture the video data for the audio analysis test, you can set this to a lower value such as 5%. Note: You do not need to set the Trigger Position or the Trigger Selection when running the Audio Analysis test. The Trigger Position is always reset to 0% and the Trigger Selection is set to Vsync. These settings occur as part of the test when you initiate the test. 3. Select the Std Tests tab under the Options section of the Capture Control panel (below). Page 273 February 7, 2013
274 4. Click on the Audio Test to initiate the Audio Analysis test. The results are shown in the Data Analysis panel in the main window of the 980 Manager. A sample is shown below. Page 274 February 7, 2013
275 10.4 AVmute Test The AVmute Test enables you to verify that an HDMI source is supporting AVmute properly. The AVmute test, verifies that AVmute had been set for the conditions shown below: Vsync has been changed compared to previous frame. HActive is inconsistent in the current frame. Invalid Frame Time Duration based on VSYNC time-stamp. Frame time duration change more than 0.02% compare to the previous frame. Pixel rate change during the video frame for more that 0.02%. VIC in AVI infoframe is changed compare to the previous frame. AVI info frame is not present in current frame. VTotal is changed compare to the previous frame. VSYNC duration is changed compare to the previous frame. HSYNC duration is inconsistent in current frame. The setup procedures described above in the section: Analyzing HDMI/MHL Data with your 980 Protocol Analyzer should be followed for the AVmute tests. These setup procedures are listed below: 1. Configure the 980 HDMI Protocol Analyzer in the proper mode HDMI or MHL. 2. Set the threshold of the +5V. 3. Configure the 980 HDMI Protocol Analyzer Rx port with the proper EDID. 4. View the incoming video in real time to check the status of the device under test. To run the AVmute test: 1. Select the 980 that you are using to capture the data from your HDMI source device under test. 2. Set the Capture Buffer Size slidebar to a percent value to meet your requirements. You can capture up to about 2GB of data which is about 1150 frames at 576p/480p and about 204 frames at 1080p which includes the video. Since you do not need to capture the video data for the audio analysis test, you can set this to a lower value such as 5%. 3. Set the Trigger Position slidebar to a percent value to meet your requirements. This slide bar enables you to set the position of the trigger event within the captured data. This is a slidebar that provides an indication (on the right) of the location within the captured data, expressed as a percent with 0% indicating that the trigger event occurs at the beginning of the captured data and 100% indicating that the trigger event occurs at the end of the captured data. Page 275 February 7, 2013

276 For the AVmute test it is best to set the Trigger Position slidebar somewhere in the middle as shown below. Note: You do not need to set the Trigger Selection when running the AVmute test. The Trigger Selection is set to Pixel Rate change. This setting occurs as part of the AVmute test when you initiate it. 4. Select the Std Tests tab under the Options section of the Capture Control panel (below). 5. Click on the AVmute Test to initiate the AVmute test. The 980 Protocol Analyzer will capture the data including the timing data. A series of dialog boxes will appear showing the capturing in progress (one example shown below). Note: If there is some action that needs to be taken by a user in order to cause the trigger condition occur, the capture dialog box will indicate that. This is shown in the following screen shot. Page 276 February 7, 2013
277 The results are shown in the Data Analysis panel in the main window of the 980 Manager. A sample is shown below. Page 277 February 7, 2013

278 Page 278 February 7, 2013

279 11 Loading and Importing Capture files This chapter describes how to use access captured files taken from other 980 HDMI Protocol Analyzer systems and how to transferred capture files taken through the embedded 980 GUI Manager Loading an existing captures with the 980 HDMI Protocol Analyzer You can load a decoded file that had been captured previously for analysis Loading an existing capture Use the following procedures to load a capture that you have listed in the 980 GUI Manager for the 980 HDMI Protocol Analyzer. You can load a file in one of three ways: Double clicking on the captured file in the Captures panel Accessing the Open option from the right-click menu of a selected capture in the Data pull-down menu Clicking on the Open icon in the area near the top of the Data panel The procedures below show you how to load the capture from the right click menu. To Load a captured data file: 1. Load a capture for analysis by right clicking on it and then select the Open item on the list. Page 279 February 7, 2013
280 A dialog box will display indicating the progress in loading the capture (sample shown below). Once the data is fully loaded it is displayed through the 980 GUI Manager in both the Event Plot and Data Decode panels Importing Capture Files from other 980 Systems This subsection provides procedures on loading a previously captured file and also procedures for importing captured files taken from another 980 HDMI Protocol Analyzer. The captured data from the 980 HDMI Protocol Analyzer is portable. You can open up captured files that have been taken by any other 980 HDMI Protocol Analyzer at any other location. You do not need a 980 HDMI Protocol Analyzer to examine captured files taken elsewhere; you just need the 980 GUI Manager. For example, you may wish to send a set of captured files to a colleague at a different location and this colleague may not have a 980 Protocol Analyzer. In that case, the colleague can simply download the 980 GUI Manager from the Quantum Data website to view the captured files that you sent them. Of course it may be the case that your colleague is sending you a set of captured files as well. Typically, the file would be posted on an FTP site as a zip file. You would then need to download the file, unzip it and then access it by browsing utilities provided in the 980 GUI Manager. In some cases you may wish to put a series of captured files in a 980 GUI Manager local directory for easy access. In this case move these files to the proper 980 GUI Manager directory. Procedures for this are provided below as well Importing Capture files Use the following procedures to import a capture. The first procedure describes how to install the 980 GUI Manager on your PC. The second procedure describes how to import the capture. To Install the 980 GUI Manager on your PC: 1. Download the 980 GUI Manager from the Quantum Data downloads page to your PC. The link to the downloads page is: 2. Start the installation by double-clicking on your downloaded *.msi file. The Setup Wizard will launch. Page 280 February 7, 2013
281 3. Select the installation folder. We recommend installation in the default folder. 4. After installation completes, run the new 980 GUI Manager. It should be available in the Start Menu under All Programs Quantum Data, and also from an icon on your Desktop. 5. Verify that the version number in the title bar matches the version on the website. Importing capture files 1. Download the captures zip file from your FTP site, save it and unzip it on your PC that now has the 980 GUI Manager installed. 2. Import a previous capture using the Import utility available from the File menu. (See below.) Page 281 February 7, 2013
 you want to import.")
282 3. Select Import. A dialog box will appear enabling you to select which data type (EDID, Capture, etc) you want to import. In this example, you want to import a capture. Select Capture and click Ok (see below). Page 282 February 7, 2013
283 You will be asked to browse for a file through a standard Windows dialog. Once you select the file you will see a progress dialog box as shown below: Page 283 February 7, 2013


284 The imported file will then appear in the Data directory of the 980 Navigator panel as shown below. The captured file is loaded automatically and has an asterisk in front of it to indicate that this capture is the one that is loaded: Relocating capture files to the 980 GUI Manager directory If you receive a capture file from a colleague for analysis, you will need to be able to access it on your 980 GUI Manager. To do this you will need to place the file in a directory that the 980 GUI Manager will be able to access it. Use the following procedures. 1. Download the captured zip file from your FTP site, save it and unzip it on your PC that now has the 980 GUI Manager installed. Page 284 February 7, 2013

285 2. Launch the 980 GUI Manager. 3. Locate the 980 GUI Manager captures directory by right clicking on an existing capture in the Navigator/Data panel and then selecting Browse (below). A Windows Explorer window will appear at the captured file. From there you can determine the location of the captures directory. 4. Transfer the capture directory (from the file you unzipped) to the 980 GUI Manager captures directory using standard Windows methods. The screen example below shows the resulting files stored in the captures directory. Page 285 February 7, 2013

286 When you relaunch the 980 GUI Manager you will see all the capture files that you transferred to the captures directory. Page 286 February 7, 2013

287 12 Transferring Capture Files from the 980 Protocol Analyzer to a PC The 980 HDMI Protocol Analyzer offers portability of data. You can disseminate captured files or even compliance tests to other locations for analysis by other colleagues. When you make a capture using the embedded GUI the captured files are retained on the 980 test instrument. Note: The procedures provided in this chapter show how to transfer ACA traces, captures playback files but you can transfer EDIDs, ImageLists, or any other type of data type under the Navigator tab. If you want to disseminate these captured files to others you will have to transfer these capture files to your PC. You can transfer files from the 980 HDMI Protocol Analyzer to your host PC in three ways: 1) Data Transfer GUI utility, 2) USB drive, 3) command line FTP Transferring Capture Files using the Data Transfer Utility You can transfer files easily using the 980 GUI Manager s Data Transfer utility. Follow the procedures below. To transfer ACA files from the 980 to your PC using the Data Transfer utility: 1. Through the external 980 GUI Manager, access the Generator/Port Control panel either through the View pull-down menu or the Generator button located on the top of the interface. Refer to the screen shots below. Note: This procedures shows examples of transferring ACA traces, capture files and Playback files but you can transfer EDIDs, ImageLists, or any other type of data type under the Navigator tab. 2. Access the Data Transfer utility by double clicking on the Transfer Data icon on one of the data sets in the Navigator window. The Data Transfer: ACA Data dialog box appears (below) enabling you to select the 980 HDMI Protocol Analyzer that you want to transfer data from. Select the desired 980 HDMI Protocol Analyzer and click OK. The Data Transfer: ACA Data panel will appear. Page 287 February 7, 2013
288 The Data Transfer panel appears in context with the ACA files on the 980 (Instrument) under the Instrument Files available as shown below. 3. Highlight a directory on the Local Files side (host PC) and then initiate a Copy or Move. The file appears on the PC host Local Files (below). Page 288 February 7, 2013
289 To transfer Playback files from the 980 to your PC using the Data Transfer utility: 1. Through the external 980 GUI Manager, access the Generator/Port Control panel either through the View pull-down menu or the Generator button located on the top of the interface. Refer to the screen shots below. Note: This procedures shows examples of transferring ACA traces, capture files and Playback files but you can transfer EDIDs, ImageLists, or any other type of data type under the Navigator tab. 2. Access the Data Transfer utility by double clicking on the Transfer Data icon on one of the data sets in the Navigator window. Page 289 February 7, 2013

290 The Data Transfer: Playback dialog box appears (below) enabling you to select the 980 HDMI Protocol Analyzer that you want to transfer data from. Select the desired 980 HDMI Protocol Analyzer and click OK. The Data Transfer: Playback panel will appear. The Data Transfer panel appears in context with the ACA files on the 980 (Instrument) under the Instrument Files available as shown below. Page 290 February 7, 2013
291 3. Highlight a directory on the Local Files side (host PC) and then initiate a Copy or Move. The file appears on the PC host Local Files (below). To transfer Capture files from the 980 to your PC using the Data Transfer utility: 1. Through the external 980 GUI Manager, access the Generator/Port Control panel either through the View pull-down menu or the Generator button located on the top of the interface. Refer to the screen shots below. 2. Access the Data Transfer utility by double clicking on the Transfer Data icon on one of the data sets in the Navigator window. Page 291 February 7, 2013
292 The Data Transfer: Capture Data dialog box appears (below) enabling you to select the 980 HDMI Protocol Analyzer that you want to transfer data from. Select the desired 980 HDMI Protocol Analyzer and click OK. The Data Transfer: Capture Data panel will appear. The Data Transfer panel appears in context with the Capture files on the 980 (Instrument) under the Instrument Files available as shown below. Page 292 February 7, 2013

293 3. Highlight a directory on the Local Files side (host PC) and then initiate a Copy or Move. The file appears on the PC host Local Files Transferring Capture Files using the command line If you have initiated captures through the embedded 980 GUI Manager through the built-in touch screen, you can transfer these capture files to your PC where the external 980 GUI Manager is installed. This enables you to view the captured data on the external 980 GUI Manager and to disseminate these captures to other colleagues for additional analysis. There are three ways you can transfer files from the 980 to the PC. 1) using an FTP utility, 2) using the FTP command, or 3) saving the files to a USB drive connected to the 980. Instructions for transferring files using the command line FTP and saving to a USB are provided. Procedures for transferring the captured files using an FTP utility such as FileZilla are not provided. Please refer to the user documentation provided with FileZilla. You can download FileZilla at: You will need to use the username of qd and the password of qd to login to the 980 in each case. To transfer capture files using the FTP command: 1. Open up the DOS utility window on your PC. 2. Enter the following command at the prompt: ftp // where is the IP address of the 980 Page 293 February 7, 2013
294 You will then be prompted for a login. Enter qd and qd for the username and password as shown below. User ( :(none)): qd Password required for qd 3. Change directories to the specific workspace directory using the DIR and CD commands. ftp> dir ftp> cd workspace ftp> cd captures ftp> cd 2010_07_14_01_37_01 4. Use the binary mode for the FTP transfer. ftp> bin 5. Initiate the FTP get command on the pdecode.log file. ftp> get pdecode.log 6. Repeat the FTP GET command for the other files you wish to view through the external 980 GUI Manager. You will want to transfer the.log files at a minimum. You may also want to transfer the.img files for the video thumbnails. 7. Exit the FTP command line with the following command: ftp> bye 8. Recreate the directory with an appropriate name in the 980 GUI Manager s working directories: quantumdata/980manager/980mgr/workspace/captures/. 9. Move the pdecode.log file and other files that you transferred to your PC into the new directory. You will now be able to view the files through the 980 GUI Manager Transferring Capture Files using USB drives If you have initiated captures through the embedded 980 GUI Manager through the built-in touch screen, you can transfer these capture files to a PC using a USB drive. To transfer capture files using a USB drive: 1. Connect a USB thumb drive on the back of the 980. Page 294 February 7, 2013
295 Rev D configuration Rev C configuration 2. Minimize or close the embedded GUI by touch selecting the Quantumdata 980 Manager icon on the bottom status panel of the GUI. 3. Touch the workspace icon on the touch screen desktop. A navigation directory window appears. 4. Browse and locate the capture files in /home/qd/workspace/captures/ 5. Touch select and highlight the captures directory 6. Touch select the top level Edit pulldown menu and select Copy. 7. Touch select the lower left button just above the Start button to change the left panel view. You should see qd, Desktop, USB flash disk, and 2 GB Volume if you touched the correct button on lower left). 8. Touch select the USB flash disk to change the right panel view to show the USB thumb drive's contents. 9. Touch any white space on the right panel to focus it. 10. Touch select Edit at top and then touch Paste to copy the capture directory to your USB drive. 11. You can now place the USB drive in your PC and move the files over to the 980 Manager s working directories: quantumdata/980manager/980mgr/workspace/captures/. Page 295 February 7, 2013
 The 980 can emulate an ARC Tx device in order to test an ARC-capable HDMI source device s (ARC Rx) response")
296 13 Audio Return Channel (HEAC) Testing This chapter describes how to use the 980 to test the Audio Return Channel (ARC) on HDMI 1.4a source and sink devices. The 980 supports the following ARC related tests: Test ARC on an HDMI A/V receiver (ARC Rx) The 980 can emulate an ARC Tx device in order to test an ARC-capable HDMI source device s (ARC Rx) response to an ARC stream. Test ARC on an HDMI sink (ARC Tx) The 980 can analyze the audio from an ARC Tx device by emulating an ARC Rx device. The 980 s HEAC control panel is shown in the screen example below: You may first have to enable viewing of the HEAC window. You do this through the View pull-down menu as shown below: Page 296 February 7, 2013
297 When configuring the HEAC functions, you click on the activation buttons within the panel. The status of each selection is indicated on the simulated LED indicators to the left of the activation button. Green indicates that the function associated with the activation button is active. Page 297 February 7, 2013
298 The following table describes the information on the HEAC Control panel. Panel Section Control Button Description RX HEAC Control HEAC Mode ARC Source MB Audio CDC HPD Disables HEAC mode on the 980 HDMI Rx port. Enables HEC without enabling ARC on the 980 HDMI Protocol Analyzer Rx port. Enables ARC in Single Mode without enabling HEC on the 980 HDMI Protocol Analyzer Rx port. Enables ARC in Common Mode without enabling HEC on the 980 HDMI Protocol Analyzer Rx port. Enables both HEC and ARC in Common Mode on the 980 HDMI Protocol Analyzer Rx port. Specifies that the source of the audio for the ARC channel is from an external source connected to the SPDIF In port on the 980 HDMI Protocol Analyzer. Specifies that the source of the audio for the ARC channel is from the internal audio source on the 980 main board. Turns off the audio from the main board that is used as the ARC source. Turns on the audio from the main board that is used as the ARC source. Specifies that the hot plug indication is the physical hot plug voltage specified in HDMI 1.3 specification. Specifies that the logical hot plug indication specified in HDMI 1.4 specification is used. TX HEAC Control HEAC Mode Disables HEAC on 980 HDMI Protocol Analyzer Tx port. Enables HEC on 980 HDMI Protocol Analyzer Tx port. Enables ARC in Single Mode on the 980 Tx port. Emulates an ARC Rx. Enables both HEC and ARC in Common Mode on the 980 HDMI Protocol Analyzer Tx port. Emulates an ARC Rx. Page 298 February 7, 2013
 The procedures below describe how to use the 980 to emulate an ARC Tx device (HDMI sink).")

299 Panel Section Control Button Description Enables both HEC and ARC in Common Mode on the 980 HDMI Protocol Analyzer Tx port. Emulates an ARC Rx Test ARC on an HDMI source (ARC Rx) The procedures below describe how to use the 980 to emulate an ARC Tx device (HDMI sink). The 980 can use audio from its internal source or you can feed an external SPDIF source into the 980 HDMI Protocol Analyzer and have the 980 HDMI Protocol Analyzer inject the SPDIF audio onto the Audio Return Channel on its HDMI Rx port. The ability to emulate an ARC Tx device enables you to determine if your HDMI source device (typically an A/V receiver) can properly handle an audio return channel stream. Refer to the diagram below for a depiction of the general test setup. To test the ARC handling by an HDMI source (ARC Rx): 1. Connect an HDMI 1.4a cable from the HDMI 1.4a A/V receiver to the 980 HDMI Protocol Analyzer Rx port. 2. Determine the HEAC mode for ARC that you wish to test with and then activate that mode by clicking on the appropriate activation button. For example if you wish to test ARC in the Single Mode you would select the appropriate button in the RX HEAC Control HEAC Mode subpanel as shown below. 3. Determine what SPDIF source you wish to use: 1) from the SPDIF source on the 980 HDMI Protocol Analyzer, or 2) from an external SPDIF source. Select the appropriate activation button in the ARC Source subpanel. Page 299 February 7, 2013

300 4. When using the 980 HDMI Protocol Analyzer s internal SPDIF source, select the appropriate button in the RX HEAC Control ARC Source subpanel as shown below. You will also have to enable audio on the 980 Main Board as shown below: 5. When using an external SPDIF source, select the appropriate button in the RX HEAC Control ARC Source subpanel as shown below. Page 300 February 7, 2013
301 You will need to connect your external SPDIF source to the SPDIF In RCA connector on the rear of the 980 as indicated in the image below: Rev D configuration Rev C configuration 13.2 Test ARC on an HDMI sink (ARC Tx) The procedures below describe how to use the 980 HDMI Protocol Analyzer to emulate an ARC Rx device (HDMI A/V Receiver) in order to test an HDMI sink (ARC Tx). The 980 can parse SPDIF audio from an incoming ARC stream. The 980 HDMI Protocol Analyzer displays basic information about the SPDIF audio is provided in the SPDIF Analysis tab. Refer to the diagram below for a depiction of the general test setup. Page 301 February 7, 2013

302 To test the ARC stream from an HDMI sink (ARC Tx): 1. Connect an HDMI 1.4a cable from the HDMI 1.4a ARC-capable sink to the 980 Tx port. 2. Determine the HEAC mode for ARC that you wish to test with and then activate that mode by clicking on the appropriate activation button. For example if you wish to test ARC in the Single Mode you would select the appropriate button in the TX HEAC Control HEAC Mode subpanel as shown below. 3. View the audio parameters from the SPDIF Analysis Panel as shown below. The detected sampling rate is shown and the Channel Status bits. Page 302 February 7, 2013
303 4. (Optional) Connect a SPDIF audio analyzer to the SPDIF Out RCA connector on the rear of the 980 as indicated in the image below: Rev D Protocol Analyzer module configuration Rev C Protocol Analyzer module configuration Page 303 February 7, 2013
304 14 Viewing Decoded EDIDs This chapter describes the Generator EDID functions of the 980 HDMI Protocol Analyzer. There are two primary functions currently supported by the Generator function: Reading and displaying EDIDs from a connected sink device. Playback captured files to test sink devices Reading an EDID from an HDMI or MHL display or sink device. The procedures below describe how to read the EDID of an HDMI sink device. To make the physical connections for an HDMI display: 1. Connect the HDMI-to-HDMI cable provided from your HDMI sink device under test to the bottommost HDMI connector on the back of the 980 HDMI Protocol Analyzer. Refer to the picture below. Connection for HDMI sink testing (Rev D Protocol Analyzer module) Connection for HDMI sink testing (Rev C Protocol Analyzer module) Page 304 February 7, 2013
305 To make the physical connections for an MHL 1.2 display: 1. Connect an HDMI cable provided from the bottommost HDMI connector on the back of the 980 HDMI Protocol Analyzer to the TPA-MHL-8R Test Point Adapter. Make the connection on the TPA at the connector labeled 882 CONNECTIONS, SINK DUT, HDMI IN. Refer to the illustration below. 2. Connect an MHL cable from the TPA-MHL-8R Test Point Adapter to the MHL sink device. Make the connection on the TPA at the connector labeled 882 CONNECTIONS, SINK DUT, MHL OUT. Refer to the illustration below. Connection for MHL 1.2 sink testing (Rev C Protocol Analyzer module) Page 305 February 7, 2013
306 Connection for MHL 1.2 sink testing (Rev D Protocol Analyzer module) To make the physical connections for an MHL 2.0 display: Note: This application applies only to MHL Normal Mode; it does not apply to Packed Pixel mode 1. Connect an HDMI cable provided from the bottommost HDMI connector on the back of the 980 HDMI Protocol Analyzer to the TPA-MHL2-8R Test Point Adapter. Make the connection on the TPA at the connector labeled HDMI MHL SINK DUT - HDMI IN. Refer to the illustration below. 2. Connect an MHL cable from the TPA-MHL2-8R Test Point Adapter to the MHL sink device. Make the connection on the TPA at the connector labeled HDMI MHL SINK DUT - MHL OUT TO DUT. Refer to the illustration below. Page 306 February 7, 2013
307 Connection for MHL 2.0 sink testing (Rev C Protocol Analyzer module) Connection for MHL 2.0 sink testing (Rev D Protocol Analyzer module) Page 307 February 7, 2013
308 To read an EDID from a connected HDMI or MHL display or sink device: 1. Through the external 980 GUI Manager, access the Generator/Port Control panel either through the View pulldown menu or the Generator button located on the top of the interface. Refer to the screen shots below. Page 308 February 7, 2013
309 The Generator panel appears as shown below: 2. Establish a connection between the 980 GUI Manager and the 980 using the Connect button identified above. Page 309 February 7, 2013
310 3. Click on the EDID Decode button on the left to access the EDID utility. Refer to the screen example below. 4. Click on the Read button to display the EDID of the connected display or sink. Refer to the screen example below. Page 310 February 7, 2013
311 5. Navigate through the EDID by Block or Page using the arrow elements at the bottom of the panel. Resize the panel if desired by the square area on the lower right. Refer to the screen example below: 6. If necessary, refresh the EDID display with the Refresh button. This is useful if you have connected a different display. Page 311 February 7, 2013
312 7. (Optional) Save the EDID to a file on your host PC using the Save button on the top of the panel. The Save dialog box will appear enabling you to assign a name and directory to store the file. Refer to the screen example below. Page 312 February 7, 2013

313 To load an EDID from a file stored on your host PC: 1. Through the external 980 GUI Manager, access the Generator panel either through the View pull-down menu or the Generator button located on the top of the interface. Refer to the screen shots below. Page 313 February 7, 2013
314 The Generator panel appears as shown below: 2. (Optional) Establish a connection between the 980 GUI Manager and the 980 HDMI Protocol Analyzer using the Connect button identified above. Page 314 February 7, 2013
315 3. Click on the Load button on the top of the panel. The Load EDID dialog box appears as shown below. 4. Select the EDID you wish to view and then select OK. 5. Navigate through the EDID by Block or Page using the arrow elements at the bottom of the panel. Resize the panel if desired by the square area on the lower right. Refer to the screen example below: Page 315 February 7, 2013
316 Page 316 February 7, 2013
317 15 HDMI Generator Playback Function This chapter describes the Generator Playback function of the 980 HDMI Protocol Analyzer. The 980 HDMI Protocol Analyzer enables you to capture a file and play it back to a sink device under test. This enables you to reuse captures from source devices in a consistent way. In some cases you might encounter a source device that you have limited access to that behaves in a peculiar or interesting way and you wish to re-test your sink device against this behavior. You can use the playback function either through the 980 GUI Manager (external or embedded) or you can use the Playback function through the command line. Procedures through the GUI and the command line are provided. The Playback panel is shown below: Page 317 February 7, 2013
318 15.1 Generator Playback function The Playback function enables you to make a capture from any HDMI or MHL source device and play it back to an HDMI or MHL sink device under test. The captured file will play back the captured video and audio and metadata in a loop. At this time we do not recommend capturing and playing back compressed audio. It is possible but the results may not be consistent. Playing back LPCM will work reliably but care has to be taken to ensure that the number of frames captured and saved is consistent with the frame rate. Examples are provided in the procedures below. Note: If the content is encrypted with HDCP you cannot play the capture back. Quantum Data provides a command line interface and a set of utilities that enable you to modify a captured file to make anomalous files for robustness testing. This feature is not documented in this User Guide but is available through application engineering and customer support Using the Playback Function through the 980 GUI Manager The procedures below describe how to use the 980 HDMI Protocol Analyzer to playback a stored capture file. You first need to make a capture and store the file. You then can play that back to a sink device Workflow for the Playback Function The high level workflow for the playback function is provided below. Use a source device whose HDMI or MHL stream characteristics you wish to capture and connect it to the 980 HDMI Protocol Analyzer Rx port. Put the source into the proper mode. Capture a file from an HDMI or MHL source device. Store the file on the 980 HDMI Protocol Analyzer. Connect a sink device under test to the 980 HDMI Protocol Analyzer Tx port. Playback a stored capture file Playback procedures HDMI or MHL Source and Sinks Use the procedures below to capture a file and play it back to a sink device. To make the physical connections for playing back HDMI capture files: 1. Connect the HDMI-to-HDMI cable provided from your HDMI source device under test to the topmost HDMI connector on the back of the 980 HDMI Protocol Analyzer. Refer to the illustration below. Note: For capturing a file you do not have to connect your HDMI sink device. Page 318 February 7, 2013
319 Connection for HDMI Capture-Playback testing (Rev D Protocol Analyzer module) Connection for HDMI Capture-Playback testing (Rev C Protocol Analyzer module) 2. Set the HDMI source device into the proper mode. To capture a file for playback: Page 319 February 7, 2013
320 1. Access the Playback panel. You access the HDMI Generator Playback function through the main screen Generator icon as indicated below: You can also access the Generator Playback function through the View pull-down menu: The Generator panel is shown below: Page 320 February 7, 2013
321 2. Connect to the 980 HDMI Protocol Analyzer using the Connect icon and button as indicated above. The 980 HDMI Protocol Analyzer will read its directories and present the list of captured files in the window under the Playback tab as shown below. If there are no files the area will be blank. Page 321 February 7, 2013

322 Page 322 February 7, 2013

323 3. Make a capture by clicking on the Capture button indicated above. A dialog box appears asking you to assign a name to the capture file. This is depicted on the screen shot below: 4. Enter a name for the capture file in the Name entry field. Ensure that the path where the file is stored is correct. If not click on the path icon to change it. A dialog box will appear as shown below: 5. Set the Buffer Size and Field Count in the fields provided as shown in the screen shot below. Page 323 February 7, 2013

324 The following are some helpful tips on setting the Buffer Size and the Field Count: Determine the number of fields (frames) you wish to playback. The number of frames that you playback will primarily be determined by the audio that you are capturing. Your captured audio will play back without an audible glitch if the Field Count is an integer multiple of the audio sampling rate. For example, if the LPCM audio sampling rate is 48kHz, and you set the Field Count to 8, there would be no glitch because 48,000 divided by 8 is an integer (6000). Set the Buffer Size to a value that will enable you to capture and save the number of fields (frames) that you specified in the Field Count entry field. The recommended minimum Buffer Size settings necessary can be determined from the following table. Format Resolution used LPCM Audio Sampling Rate used Field Count settings (number of frames to save) Suggested Minimum Buffer Size setting 480p60 32kHz 16 3% 32 5% 64 10% 48kHz 16 3% 32 5% 64 10% 96kHz 16 3% 32 5% 64 10% 720p60 32kHz 16 7% 32 10% 64 20% 48kHz 16 7% Page 324 February 7, 2013
325 Format Resolution used LPCM Audio Sampling Rate used Field Count settings (number of frames to save) Suggested Minimum Buffer Size setting 32 10% 64 20% 96kHz 16 5% 32 10% 64 20% 1080i30 32kHz 16 7% 32 10% 64 20% 48kHz 16 7% 32 10% 64 20% 96kHz 16 7% 32 10% 64 20% 1080p60 32kHz 8 7% 16 15% 32 25% 48kHz 8 7% 16 15% 32 25% 96kHz 8 7% 16 15% 32 25% 6. Click OK on the Playback Capture Name and Settings dialog box to initiate the capture. A progress window appears indicating the status of the capture as shown below: Page 325 February 7, 2013
326 The captured file appears in the Playback window as shown below. 7. Enter a description of the capture in the Playback Description Editor window. You access this window using the Edit icon on the lower right of the Generator dialog box (indicated above). A dialog box appears enabling you to enter a description of the capture. Refer to the screen example below. You can import a description from a file stored on your PC using the Import button. Page 326 February 7, 2013


327 To make physical connections for HDMI playback: 1. Connect the HDMI-to-HDMI cable provided from your HDMI sink device under test to the bottommost HDMI connector on the back of the 980 HDMI Protocol Analyzer. Refer to the illustration below. Connection for HDMI Capture-Playback testing (Rev D Protocol Analyzer module) To make physical connections for MHL 1.2 playback: 1. Connect an HDMI cable provided from the bottommost HDMI connector on the back of the 980 HDMI Protocol Analyzer to the TPA-MHL2-8R Test Point Adapter. Make the connection on the TPA at the connector labeled 882 CONNECTIONS, SINK DUT, HDMI IN. Refer to the illustration below. 2. Connect an MHL cable from the TPA-MHL2-8R Test Point Adapter to the MHL 1.2 sink device. Make the connection on the TPA at the connector labeled 882 CONNECTIONS, SINK DUT, MHL OUT. Refer to the illustration below. UPDATE WITH NEW 980 PSCOPE MODULE Page 327 February 7, 2013
328 Connection for MHL 1.2 Capture-Playback testing (Rev C Protocol Analyzer module) To make physical connections for MHL 2.0 playback: 1. Connect an HDMI cable provided from the bottommost HDMI connector on the back of the 980 HDMI Protocol Analyzer to the TPA-MHL2-8R Test Point Adapter. Make the connection on the TPA at the connector labeled HDMI IN on the block labeled HDMI MHL MHL SINK DUT. Refer to the illustration below. 2. Connect an MHL cable from the TPA-MHL2-8R Test Point Adapter to the MHL 2.0 sink device. Make the connection on the TPA at the connector labeled MHL OUT on the block labeled HDMI MHL MHL SINK DUT. Refer to the illustration below. Page 328 February 7, 2013
329 Connection for MHL 2.0 Capture-Playback testing (Rev C Protocol Analyzer module) Connection for MHL 2.0 Capture-Playback testing (Rev C Protocol Analyzer module) Page 329 February 7, 2013
330 To playback a captured file to an HDMI display: 1. Power up the 980 HDMI Protocol Analyzer using the power rocker switch on the back. Then press the power on button on the front panel. 2. Access the Playback panel. You access the Generator Playback function through the main screen Generator icon as indicated below: You can also access the Generator Playback function through the View pull-down menu: The Generator panel is shown below: Page 330 February 7, 2013
331 3. Connect to the 980 HDMI Protocol Analyzer using the Connect icon and button as indicated above. The 980 will read its directories and present the list of captured files in the window under the Playback tab as shown below. If there are no files the area will be blank. Note: You may have to refresh the view using the global refresh button on the upper right or the local refresh button on the lower right. Page 331 February 7, 2013
332 4. Select the file you wish to playback and click on the Play button as indicated above. Monitor your sink device for the proper response. 5. Stop the playback at anytime by pressing the Stop button Using the Playback Function through the Command Line The procedures below describe how to use the 980 HDMI Protocol Playback function through the command line. The table below lists the commands related to the playback function. List of Commands Related to Playback Note: Commands are lower case. Command Description Syntax Command Example pcap size Defines the capture buffer size in percent of total (2GB). pcap size < size > Where <size> can be 0 to 100 percent. To set the capture buffer size to 30% of the total buffer capacity: >pcap size 30 Captures data up to 30% of the capacity of the buffer. Page 332 February 7, 2013
333 List of Commands Related to Playback Note: Commands are lower case. Command Description Syntax Command Example pcap mode pcap start pcap save Defines the data that is captured. Playback function requires that all tmds characters be captured. Initiates the capture of video stream. Saves the captured file for playback. pcap mode <data> Where <data> can be: tmds raw protocol data pcap start pcap save <frames> <file> where: frames is the number of frames you wish to save for the replaying of the file. file is the name of the playback file play Plays the captured file. Play <file> where: file is the name of the playback file you wish to play back. play stop play pause play resume Stops the playing of a playback file. Pauses the playing back of a playback file. Resumes the playing back of a playback file. play stop play pause play resume To set the mode: >pcap mode tmds Captures raw tmds characters which is required for playback To initiate a capture: > pcap start To save a capture: > pcap save 10 mycap.pb Saves the file for reuse. To play a playback file: > play mycap.pb To stop the playing of a playback file: > play stop To pause the playing of a playback file: > play pause To resume the playing of a playback file: > play resume Creating a Playback file through the command line This subsection describes how you can create a playback file through the command line. This procedure below uses the Console application window as part of the 980 GUI Manager. However you can use your own telnet utility such as Putty. To establish a command line session with the 980: 1. From the Main window of the 980 GUI Manager, select access the Console panel. If the Console panel is not available as a tab, use the View pull-down menu to activate it as shown below. Page 333 February 7, 2013

334 2. You will first have to connect to the 980 HDMI Protocol Analyzer that you are using. You do this through the Connect button on the top right of the Console panel as shown below. Note that the IP address of the device is shown on the left. 3. You will first have to connect to the 980 HDMI Protocol Analyzer that you are using. You do this through the Connect button on the top right of the Console panel as shown below. Note that the IP address of the device is shown on the left. When you click on the Connect button you will see an indication that you are connected along with the pscope prompt as shown below. Page 334 February 7, 2013

335 To create a playback file through the command line: 1. From the pscope prompt in the 980 GUI Manager Console, enter the following command to set the capture mode. In this case you will be using the tmds mode which captures all raw TMDS characters. Note: You enter commands in the Command field near the top of the Console panel. #p-scope>pcap mode tmds 2. From the pscope prompt enter the command to set the capture buffer size in percent. Typically 20 to 40 percent is plenty large enough. #p-scope>pcap size From the pscope prompt enter the command to start the capture. #p-scope>pcap start Page 335 February 7, 2013
336 4. From the pscope prompt enter the command to stop and save the file for playback. Ten (10) frames are saved in the example below. #p-scope>pcap save 10 MyCap1.pb Note: When you save a playback file using these Console commands the files are saved in the /qd directory not the /workspace/playback/ as the playback files created through the GUI are saved. Therefore you will not be able to see these playback files through the GUI. Similarly you will have to navigate through the file system to access playback files created through the 980 GUI Manager if you wish to use them on the command line. You can locate files using the following command: #p-scope>exec ls /qd/*.pb Replaying a Playback file through the command line This subsection describes how you can replay a playback file through the command line. To replay a playback file through the command line: 1. From the pscope prompt in the 980 GUI Manager Console, enter the following command to replay the playback file. Note: You enter commands in the Command field near the top of the Console panel. #p-scope>play MyCap1.pb 2. To pause the playback of a file, use the following command. #p-scope>play pause 3. To resume the playback of a paused file, use the following command. #p-scope>play resume 4. To stop the playback use the following command. #p-scope>play stop 15.3 Custom Playback lists Use the following procedures to create a custom playback list. The Playback List Editor can be used either on the embedded 980 GUI Manager or the external 980 GUI Manager. The examples in this procedure use the external 980 GUI Manager Creating a custom playback list This subsection describes how you can create a playback list. To create a playback list: 1. From the Main window of the 980 GUI Manager, select Playback List Editor from the View menu as shown below. Page 336 February 7, 2013
337 2. Select the Playback List Editor. The Playback List Editor appears as shown below: Page 337 February 7, 2013

338 3. Click on the Source button on the lower left under Local Files (indicated in the diagram above). The Data Source dialog box will appear enabling you to select between using files on your PC or using files on the 980 HDMI Video Protocol Analyzer module to create your custom list. Note: This dialog box also enables you to select the particular 980 (if there are more than one on the network). However in order to select a 980 you will have to deselect the Local Files checkbox. Local Files when using the external 980 GUI Manager means that you are using the files stored locally on your host PC. If you deselect Local Files on the dialog box below you are viewing files on the 980 file system. 4. Click OK to continue. The left side window of the Playback List Editor will display the playback files on the 980 HDMI Protocol Analyzer module in the User directory. The panel on the right (Data List) is a list of playback files in your custom list. Page 338 February 7, 2013
339 There are two buttons in the middle between the two windows that enable you to configure the test patterns in your Pattern List. These are defined as follows: Append Add a new test pattern to the end of your list. Insert Insert a new test pattern into your accumulating list above the test pattern that is highlighted in the Data List on the right. There are five buttons along the bottom of the Data List panel (lower right side). These are defined as follows: Add Enables you to create a playlist if you do not have access to the files. For example if you are working through the external GUI Manager but not able to connect to a 980 and wanted to create a playback list from files that you knew existed on a 980, you could use the Add button to create a record under the Data List and specify a name and path for the location of the playback file. Edit Opens up a dialog box enabling you to change the name and storage location of the playback file selected in the Data List. Delete Deletes or remove a playback file from the Data List. Up Moves a playback file up in the Data List. Down Moves a playback file down in the Data List. 5. Click on the Save activation button when you are done configuring your custom list. You will be asked to enter a name for your new Pattern List. Use the Name field provided (below). Page 339 February 7, 2013
340 You will then see the new playback list in the 980 GUI Navigator window under Playback Applying a Custom Playback List This subsection describes how you can apply a custom playback list that you have created. Often you will have created the pattern list on your host PC but you may wish to apply it on the 980 instrument itself. In order to do this you will have to transfer the playback list from your host PC to the 980 prior to using it. The procedure below describes these steps. Page 340 February 7, 2013

341 To apply an existing Playback List: 1. Navigate to the Navigate/Images tab. 2. Transfer the Pattern List from your Host PC to the 980 by invoking the transfer icon indicated below. Page 341 February 7, 2013
342 The Data Transfer panel appears as shown below: Page 342 February 7, 2013

343 3. Transfer the playback list from the Local Files on the left side to the Instrument files using the Copy or Move button. Note that you will have to highlight a directory on the Instrument Files panel in order to enable the Copy or Move button. In this case since you are using the external 980 GUI Manager, the Local Files are the files stored on the Host PC. The following screen shows the result: Page 343 February 7, 2013
.")
344 4. Navigate to the Playback Tab on the Generator panel and select your list using the Playback List icon on the bottom status panel as shown below. The result is that there will be a list of Playback files available and displayed in the Playback tab window (below). The Path icon on the bottom status panel will display that new list. Page 344 February 7, 2013

345 Page 345 February 7, 2013

346 Viewing and modifying a custom Playback List This subsection describes how you can view a custom playback list that you have created. To view and modify an existing Playback List: 1. View the new Image List through the Navigator panel. Select the Playback List folder. 2. The Playback Lists will appear under User directory as shown above. 3. Right click on the desired pattern list and select the Open icon to open up the viewing window. The Playback List will appear in the panel as shown below: Page 346 February 7, 2013

347 You can now modify the playback list using the buttons. There are two buttons in the middle between the two windows that enable you to configure the test patterns in your Pattern List. These are defined as follows: Append Add a new test pattern to the end of your list. Insert Insert a new test pattern into your accumulating list above the test pattern that is highlighted in the Data List on the right. There are five buttons along the bottom of the Data List panel (lower right side). These are defined as follows: Add Enables you to create a playlist if you do not have access to the files. For example if you are working through the external GUI Manager but not able to connect to a 980 and wanted to create a playback list from files that you knew existed on a 980, you could use the Add button to create a record under the Data List and specify a name and path for the location of the playback file. Edit Opens up a dialog box enabling you to change the name and storage location of the playback file selected in the Data List. Delete Deletes or remove a playback file from the Data List. Up Moves a playback file up in the Data List. Down Moves a playback file down in the Data List. 2. Click on the Save activation button when you are done configuring your custom list. You will be asked to enter a name for your new Pattern List. Use the Name field provided (below). Page 347 February 7, 2013

348 Page 348 February 7, 2013
349 16 Upgrading the 980 Manager and 980 This Chapter provides information about upgrading your 980 and 980 GUI Manager. Detailed procedures are not provided in this document. Please be sure to refer to the Release Notes for a specific release for detailed upgrade instructions. Quantum Data periodically provides maintenance release of software and firmware. The most recent versions are available on the downloads page of the Quantum Data website. Two software packages are available for upgrading the 980: 1. Embedded firmware and gateware package for the 980 instrument. This is a Debian software package for installation in the Linux-based instrument. (The file extension is.deb.) This package also includes the embedded Graphical User Interface that will be installed for the Touch Screen User Interface. The 980 software package includes the firmware and gateware for all available modules. 2. Graphical User Interface for Windows PCs. This is the 980 Manager GUI that can be used to control all 980 instruments from a Windows PC. Notes: Page 349 February 7, 2013
350 1. If the Windows-based 980 Manager GUI and the embedded firmware are both being upgraded, you will need to upgrade the 980 Manager first, and then upgrade the embedded firmware. 2. Be sure to check the release notes associated with the download files. Any special installation instructions will be noted in the release notes. 3. In some cases if your 980 is not at the most recent version, you may have to first upgrade to the most current version and then to the new version Workflow for Upgrading 980 Firmware/Gateware This section describes the workflow of the upgrade process. It is not intended to be a detailed procedure. Please refer to the Release Notes for detailed upgrade procedures. Please note that you have to upgrade the 980 GUI Manager before using the GUI Manager to upgrade the 980 firmware and gateware. 1. Download the GUI Manager and 980 Firmware/Gateware files from the Quantum Data website downloads page: 2. Upgrade the 980 GUI Manager and restart. Note: You may receive the following error indicating that you must update the 980 firmware/gateware. Page 350 February 7, 2013
351 3. Connect to the 980 that you wish to upgrade. Access the Upgrade Firmware/Gateware option from the Instrument pull-down. 4. Update the 980 Firmware/Gateware. Browse to the Deb file and select it. Follow the on-screen prompts. Page 351 February 7, 2013

352 Page 352 February 7, 2013
Figure 1: Media Director source and rendering device. Media Director Enabled Rendering Device (HDTV)
") application Note - Testing Media Director Source and Sink Devices THX has developed a technology for ensuring that the creative intent for content presentation is preserved through production and distribution
application Note - Testing Media Director Source and Sink Devices THX has developed a technology for ensuring that the creative intent for content presentation is preserved through production and distribution
T3 Mux M13 Multiplexer
 T3 Mux M13 Multiplexer User Manual [Type the abstract of the document here. The abstract is typically a short summary of the contents of the document. Type the abstract of the document here. The abstract
Ethernet Radio Configuration Guide
 Ethernet Radio Configuration Guide for Gateway, Endpoint, and Repeater Radio Units April 20, 2015 Customer Service 1-866-294-5847 Baseline Inc. www.baselinesystems.com Phone 208-323-1634 FAX 208-323-1834
3.5 EXTERNAL NETWORK HDD. User s Manual
 3.5 EXTERNAL NETWORK HDD User s Manual Table of Content Before You Use Key Features H/W Installation Illustration of Product LED Definition NETWORK HDD Assembly Setup the Network HDD Home Disk Utility
Additional Requirements for ARES-G2 / RSA-G2. One Ethernet 10 Base T/100 Base TX network card required for communication with the instrument.
 TA Instruments TRIOS Software Installation Instructions Installation Requirements Your TRIOS Instrument Control software includes all the components necessary to install or update the TRIOS software, as
Ultra Thin Client TC-401 TC-402. Users s Guide
 Ultra Thin Client TC-401 TC-402 Users s Guide CONTENT 1. OVERVIEW... 3 1.1 HARDWARE SPECIFICATION... 3 1.2 SOFTWARE OVERVIEW... 4 1.3 HARDWARE OVERVIEW...5 1.4 NETWORK CONNECTION... 7 2. INSTALLING THE
ACU-1000 Manual Addendum Replacement of CPM-2 with CPM-4
 ACU-1000 Manual Addendum Replacement of CPM-2 with CPM-4 1 PURPOSE:... 1 2 CPM-4/CPM-2 COMPATIBILITY... 2 2.1 NETWORK CABLES... 2 2.2 FACTORY DEFAULT SETTINGS... 2 2.3 CHANGING THE RS-232 SERIAL PORT BAUD
8/16-Port IP KVM Switch IKVM-8010 / IKVM-16010. Quick Installation Guide
 8/16-Port IP KVM Switch IKVM-8010 / IKVM-16010 Quick Installation Guide Table Of Contents Chapter 1 Introduction... 3 1.1 Features... 3 1.2 Package Contents... 4 1.3 Technical Specifications... 4 Chapter
USER MANUAL GUIMGR Graphical User Interface Manager for FRM301/FRM401 Media Racks
 USER MANUAL GUIMGR Graphical User Interface Manager for FRM301/FRM401 Media Racks CTC Union Technologies Co., Ltd. Far Eastern Vienna Technology Center (Neihu Technology Park) 8F, No. 60 Zhouzi St. Neihu,
Chapter 1 Installing the Gateway
 Chapter 1 Installing the Gateway This chapter describes how to set up the wireless voice gateway on your Local Area Network (LAN), connect to the Internet, and perform basic configuration. For information
OPERATION MANUAL. MV-410RGB Layout Editor. Version 2.1- higher
 OPERATION MANUAL MV-410RGB Layout Editor Version 2.1- higher Table of Contents 1. Setup... 1 1-1. Overview... 1 1-2. System Requirements... 1 1-3. Operation Flow... 1 1-4. Installing MV-410RGB Layout
CS 326e F2002 Lab 1. Basic Network Setup & Ethereal Time: 2 hrs
 CS 326e F2002 Lab 1. Basic Network Setup & Ethereal Time: 2 hrs Tasks: 1 (10 min) Verify that TCP/IP is installed on each of the computers 2 (10 min) Connect the computers together via a switch 3 (10 min)
Quick Start Guide NVR DS-7104NI-SL/W NVR. www.hikvision.com. First Choice For Security Professionals
 Quick Start Guide NVR DS-7104NI-SL/W NVR NOTE: For more detailed information, refer to the User s Manual on the CD-ROM. You must use your PC or MAC to access the files. www.hikvision.com Quick Start 1.
Procedure: You can find the problem sheet on Drive D: of the lab PCs. Part 1: Router & Switch
 University of Jordan Faculty of Engineering & Technology Computer Engineering Department Computer Networks Laboratory 907528 Lab. 2 Network Devices & Packet Tracer Objectives 1. To become familiar with
Cisco 831 Router and Cisco SOHO 91 Router Cabling and Setup Quick Start Guide
 English CHAPTER 1 Cisco 831 Router and Cisco SOHO 91 Router Cabling and Setup Quick Start Guide Cisco One-Year Limited Hardware Warranty Terms Easy Installation: Try These Steps First! (CRWS Users) Overview
AVer EVC. Quick Installation Guide. Package Contents. 8. Mini Din 8 pin MIC Cable. 1. Main System. 9. HDMI Cable. 2. Camera. 10.
 AVer EVC Quick Installation Guide Package Contents 1 2 3 4 5 6 7 8 9 10 11 12 13 14 15 2013 AVer Information Inc. All Rights Reserved. 1. Main System 2. Camera 3. Microphone 4. Remote Control 5. Power
aseries DVR04/DVR08 DIGITAL VIDEO RECORDER Quick Operations Guide
 aseries DVR04/DVR08 DIGITAL VIDEO RECORDER Quick Operations Guide UD.7L0202B1365B01 Thank you for purchasing our product. If there is any question or request, please do not hesitate to contact dealer.
Stand Alone Type. Digital Video Recorder USER S MANUAL. (Real time recording 8 & 16 CH DVR) Revision Date : 2010. 6. 30.
 Revision Date : 2010. 6. 30.") Stand Alone Type Digital Video Recorder USER S MANUAL (Real time recording 8 & 16 CH DVR) Revision Date : 2010. 6. 30. INDEX 1. Front Panel - - - - - - - - - - - - - - - - - - - - - - - - - - - - - - -
Stand Alone Type Digital Video Recorder USER S MANUAL (Real time recording 8 & 16 CH DVR) Revision Date : 2010. 6. 30. INDEX 1. Front Panel - - - - - - - - - - - - - - - - - - - - - - - - - - - - - - -
Connecting to the Internet. LAN Hardware Requirements. Computer Requirements. LAN Configuration Requirements
 Connecting to the Internet LAN Hardware Requirements Computer Requirements LAN Configuration Requirements Installation Performed by Time Warner Cable Technician Connecting via Ethernet Connecting via USB
Network Projector Operation Guide
 Network Projector Operation Guide Table of contents Preparation...3 Connecting the projector with your computer...3 Wired connection... 3 Wireless connection (for selective models)... 4 QPresenter...7
ShareLink 200 Setup Guide
 ShareLink 00 Setup Guide This guide provides instructions for installing and connecting the Extron ShareLink 00. The ShareLink USB 00 Wireless Collaboration Gateway allows anyone to present content from
Firewall VPN Router. Quick Installation Guide M73-APO09-380
 Firewall VPN Router Quick Installation Guide M73-APO09-380 Firewall VPN Router Overview The Firewall VPN Router provides three 10/100Mbit Ethernet network interface ports which are the Internal/LAN, External/WAN,
Multi-Homing Dual WAN Firewall Router
 Multi-Homing Dual WAN Firewall Router Quick Installation Guide M73-APO09-400 Multi-Homing Dual WAN Firewall Router Overview The Multi-Homing Dual WAN Firewall Router provides three 10/100Mbit Ethernet
LAN / WAN Connection Of Instruments with Serial Interface By Using a Terminal Server
 Products: EFA with EFA Scan, DVRM and DVMD with Realtime Monitor or Stream Explorer DVMD-B1 LAN / WAN Connection Of Instruments with Serial Interface By Using a Terminal Server Remote control of test and
Broadband Phone Gateway BPG510 Technical Users Guide
 Broadband Phone Gateway BPG510 Technical Users Guide (Firmware version 0.14.1 and later) Revision 1.0 2006, 8x8 Inc. Table of Contents About your Broadband Phone Gateway (BPG510)... 4 Opening the BPG510's
Dominion KX II-101-V2
 Dominion KX II-101-V2 Quick Setup Guide Thank you for your purchase of the Dominion KX II-101-V2, the economical, full-featured, single-port digital KVM-over-IP device. For details on using the KX II-101-V2,
StarMOBILE Network Configuration Guide. A guide to configuring your StarMOBILE system for networking
 StarMOBILE Network Configuration Guide A guide to configuring your StarMOBILE system for networking INTRODUCTION... 3 BEFORE YOU BEGIN... 3 1) CONFIRM YOU HAVE THE LATEST SOFTWARE... 3 2) INSTALL THE STARMOBILE
Table of Contents. Chapter1. Introduction...1. 1.1 Before Installation... 1 1.2 System Requirements... 1
 Table of Contents Chapter1. Introduction...1 1.1 Before Installation... 1 1.2 System Requirements... 1 Chapter2. IVS-110 1-Channel Internet Video Server...2 2.1 Package Content... 2 2.2 Physical Installation...
Link Link sys E3000 sys RE1000
 User Guide High Performance Extender Wireless-N Router Linksys Linksys RE1000 E3000Wireless-N Table of Contents Contents Chapter 1: Product Overview 1 Front 1 Top 1 Bottom 1 Back 2 Chapter 2: Advanced
V.I.P. Kit. Video Insight Pilot Kit. (Video Insight Pilot Kit).
.") V.I.P. Kit (Video Insight Pilot Kit). Video Insight Pilot Kit Please follow these instructions and everything should go very smoothly. Before you begin, you will need to establish (or obtain from your
V.I.P. Kit (Video Insight Pilot Kit). Video Insight Pilot Kit Please follow these instructions and everything should go very smoothly. Before you begin, you will need to establish (or obtain from your
ON HOLD ANNOUNCER. Once you receive your audio announcer, check the packaging to ensure that all of the following items are enclosed:
 ON HOLD ANNOUNCER The is a high quality digital on-hold announcer. It is designed to be attached to a 100BASE-T Ethernet network to receive audio production updates via the Internet. These instructions
Lab 8.4.2 Configuring Access Policies and DMZ Settings
 Lab 8.4.2 Configuring Access Policies and DMZ Settings Objectives Log in to a multi-function device and view security settings. Set up Internet access policies based on IP address and application. Set
Networking. General networking. Networking overview. Common home network configurations. Wired network example. Wireless network examples
 Networking General networking Networking overview A network is a collection of devices such as computers, printers, Ethernet hubs, wireless access points, and routers connected together for communication
SecureLinx Spider Duo Quick Start Guide
 SecureLinx Spider Duo Quick Start Guide SecureLinx Spider Duo Quick Start Guide SecureLinx Spider Duo QUICK START GUIDE CONTENTS Overview... 2 What s In The Box... 3 Installation and Network Settings...
Wireless VoIP Phone User s Manual
 Wireless VoIP Phone User s Manual Table of Contents Chapter 1 Overview of the WiFi phone... 5 1.1 Front Panel and Keypad...5 1.2 Removing and Installing the Battery...7 1.3 Charging the WIFI PHONE...8
UBIQUITI BRIDGE CONFIGURATION PROCEDURE (PowerStation & NanoStation Units ONLY)
") UBIQUITI BRIDGE CONFIGURATION PROCEDURE (PowerStation & NanoStation Units ONLY) Hardware Installation 1. Initial placement for programming and configuration purposes should be performed in an indoor environment.
UBIQUITI BRIDGE CONFIGURATION PROCEDURE (PowerStation & NanoStation Units ONLY) Hardware Installation 1. Initial placement for programming and configuration purposes should be performed in an indoor environment.
Network & Internet Installation & Information Guide Fall 2004 Edition. Campus Ethernet For PCs using Windows 2000 & XP
 Network & Internet Installation & Information Guide Fall 2004 Edition Campus Ethernet For PCs using Windows 2000 & XP Table of Contents Overview... 2 Requirements... 2 Physically connect your computer
ebus Player Quick Start Guide
 ebus Player Quick Start Guide This guide provides you with the information you need to efficiently set up and start using the ebus Player software application to control your GigE Vision or USB3 Vision
Quick Installation Guide Network Management Card
 Rev.1.1 www.cyberpowersystems.com Quick Installation Guide Network Management Card Intelligent Network Management Card allows UPS to be managed, monitored, and configured via SNMP Card Configuration Tool
Amcrest 960H DVR Quick Start Guide
 Amcrest 960H DVR Quick Start Guide Welcome Thank you for purchasing our Amcrest 960H DVR! This quick start guide will help you become familiar with our DVR in a very short time. Before installation and
Movie Cube. User s Guide to Wireless Function
 Movie Cube User s Guide to Wireless Function Table of Contents 1. WLAN USB Adapter Connection...3 2. Wireless Setup...4 2.1 Infrastructure (AP)...5 2.2 Peer to Peer (Ad Hoc)...7 2.3 Settings for PC...8
INTELLECT TM Software Package
 AxxonSoft INTELLECT TM Software Package Quick Start Guide Version 1.0.0 Moscow 2010 1 Contents CONTENTS... 2 1 INTRODUCTION... 3 1.1 Document purpose... 3 1.2 Purpose of the Intellect software package...
DVR-4TL/8TL/16TL Setup Guide
 Package Content DVR-4TL/8TL/16TL Setup Guide Inspect the DVR s packaging. Make sure that the DVR-4TL/8TL/16TL is packed properly. Remove all items from the box and make sure it contains the following items.
DSL Installation Guide
 DSL Installation Guide Thank you for choosing Integra Telecom s DSL service! Introduction This guide will walk you through the DSL installation process and will help you configure a computer to access
Quick Installation Guide DAP-1360. Wireless N 300 Access Point & Router
 DAP-1360 Wireless N 300 Access Point & Router BEFORE YOU BEGIN Delivery Package Access point DAP-1360 Power adapter DC 12V Ethernet cable (CAT 5E) (brochure). If any of the items are missing, please contact
EDGE FX Network configuration
 Page 1 of 16 TITLE: Category: EDGE FX Network configuration GERBER EDGE Document Number: 4280 Supplied by: Gerber Service Last Modified: April 14, 2011 Summary: In order to connect an EDGE FX to your PC
Network Setup Guide. 1 Glossary. 2 Operation. 1.1 Static IP. 1.2 Point-to-Point Protocol over Ethernet (PPPoE)
") Network Setup Guide 1 Glossary 1.1 Static IP Computers are communicated and recognized by their own unique IP addresses over the Internet. Static IP provided by your ISP (Internet Service Provider) means
Network Setup Guide 1 Glossary 1.1 Static IP Computers are communicated and recognized by their own unique IP addresses over the Internet. Static IP provided by your ISP (Internet Service Provider) means
1. Hardware Installation
 4 Port 10/100M Internet Broadband Router with USB Printer server Quick Installation Guide #4824904AXZZ0 1. Hardware Installation A. System Requirement Before you getting started, make sure that you meet
R&S AFQ100A, R&S AFQ100B I/Q Modulation Generator Supplement
 I/Q Modulation Generator Supplement The following description relates to the Operating Manuals, version 03 of R&S AFQ100A, and version 01 of R&S AFQ100B. It encloses the following topics: LXI features,
Broadband Router ESG-103. User s Guide
 Broadband Router ESG-103 User s Guide FCC Warning This equipment has been tested and found to comply with the limits for Class A & Class B digital device, pursuant to Part 15 of the FCC rules. These limits
4. Rear View. Function Switches 1. Fixed IP 2. DHCP Floating IP 3. Auto IRIS (DC Driver LENS) 4. Fixed LENS (AES)
 4. Fixed LENS (AES)") 4. Rear View 5 1.STATIC IP 2.DHCP 3.DC IRIS Mini USB 1 2 3 4 5 6 1. ALM-RST 2. ALM-IN 3. ALM-OUT 4. GND 5. RS485-6. RS485 + 1 2 3 4 5 6 7 DC Power Input: DC Jackψ2.1, DC12V---0.5A or higher. LAN/WAN Network
4. Rear View 5 1.STATIC IP 2.DHCP 3.DC IRIS Mini USB 1 2 3 4 5 6 1. ALM-RST 2. ALM-IN 3. ALM-OUT 4. GND 5. RS485-6. RS485 + 1 2 3 4 5 6 7 DC Power Input: DC Jackψ2.1, DC12V---0.5A or higher. LAN/WAN Network
2 Setting Up the Hardware for a Wired Ethernet Network... 13. 3 Setting Up the Software for an Ethernet Network... 21
 Contents 1 Networking Basics............................................... 1 Selecting a network connection........................................ 2 Wired Ethernet network...........................................
R&S AFQ100A, R&S AFQ100B I/Q Modulation Generator Supplement
 I/Q Modulation Generator Supplement The following description relates to the Operating Manuals, version 03 of R&S AFQ100A, and version 01 of R&S AFQ100B. It encloses the following topics: LXI features,
Moxa Device Manager 2.0 User s Guide
 First Edition, March 2009 www.moxa.com/product 2009 Moxa Inc. All rights reserved. Reproduction without permission is prohibited. Moxa Device Manager 2.0 User Guide The software described in this manual
PRV-LX1 Importing Menu Backgrounds Importing Edit Decision Lists Importing Using a Network
 PRV-LX1 Importing Menu Backgrounds Importing Edit Decision Lists Importing Using a Network Version 1.1 created January 9, 2004 Table of Contents 1.0 IMPORT A MENU BACKGROUND FROM CD/DVD...2 1.1 SELECT
Operating Instructions
 Operating Instructions (For Setting up the Printer Driver and the Panasonic Document Management System) Digital Imaging Systems Model No. DP-800P / 800E / 806P Installation Table of Contents Installation
Gauge Drawing Tool... 8. Slider Drawing Tool... 8. Toggle Button Drawing Tool... 8. One-Way List Drawing Tool... 8
 v. 20120510 Table of Contents RTiPanel Overview and Requirements... 3 Software Requirements:... 3 Hardware Requirements:... 3 Network Requirements:... 3 Licensing Requirements:... 4 Basic Integration Designer
Cisco 837 Router and Cisco SOHO 97 Router Cabling and Setup
 English CHAPTER 1 Cisco 837 Router and Cisco SOHO 97 Router Cabling and Setup Cisco One-Year Limited Hardware Warranty Terms Easy Installation: Try These Steps First! (CRWS Users) Overview Parts List Verify
MJPEG Camera Client User Manual
 MJPEG Camera Client User Manual CONTENTS User Manual 1 WELCOME... 3 1.1Features... 3 1.2Installation Requirements... 3 1.3 Software Installation... 3 2 Software Operation... 5 2.1 Tab bar... 6 2.2 Device
이 기기는 업무용 급 으로 전자파적합등록을 한 기기이오니 판매자 또는 사용자는 이점을 주의하시기 바라며 가정 외의 지역에서 사용하는 것을 목적으로 합니다
 020-101186-01 020-101186-01 이 기기는 업무용 급 으로 전자파적합등록을 한 기기이오니 판매자 또는 사용자는 이점을 주의하시기 바라며 가정 외의 지역에서 사용하는 것을 목적으로 합니다 Table of Contents About this Document... 1 Document Conventions... 1 Audience... 1 Related
IntraVUE Plug Scanner/Recorder Installation and Start-Up
 IntraVUE Plug Scanner/Recorder Installation and Start-Up The IntraVUE Plug is a complete IntraVUE Hardware/Software solution that can plug directly into any network to continually scan and record details
Multi-Profile CMOS Infrared Network Camera
 Multi-Profile CMOS Infrared Network Camera Quick Start Guide About multi-profile Multi-profile stands for simultaneously video stream. The Network Camera and Video Server can generate MPEG4 and MJPEG streaming
Building Microsoft Windows Server 2012 Clusters on the Dell PowerEdge VRTX
 Building Microsoft Windows Server 2012 Clusters on the Dell PowerEdge VRTX Startup Guide Paul Marquardt Contents Introduction... 4 Requirements... 4 Chassis setup... 6 Chassis placement and CMC cabling...
SNMP Manager User s Manual
 SNMP Manager User s Manual Table of Contents 1. Introduction...2 2. SNMP Manager Install, Quick Start and Uninstall...2 2.1. Software Installation...2 2.2. Software Quick Start...2 2.3. Software Uninstall...2
Coolmax CN-590 Network Storage Solution
 Coolmax CN-590 Network Storage Solution Model Name Controller hip CPU OS Memory Interface CN-590 S2892 150MHz RTOS 8MB SDRAM / 1MB NOR Flash LAN Standard 10/100Base-TX Auto MDI/MDI-X Connector Type RJ-45
1. Central Monitoring System Software
 1. Central Monitoring System Software 1-1. General information CMS program is an application with which users not only watch and control remote DVRs, but also receive video/audio data or alarm signals
Operating Instructions
 Operating Instructions (For Setting Up) Digital Imaging Systems Installation Overview Model No. DP-8060 / 8045 / 8035 Table of Contents Setting Your Machine Installation Overview General Installation Overview...
Connecting the DG-102S VoIP Gateway to your network
 Contents of Package: DG-102S VoIP Station Gateway Power adapter CD-ROM, including User s Manual Quick Install Guide Requirements: RS-232 Console Cable Two RJ-45 CAT-5 Straight-Through Cables For more information
AXIS Camera Station Quick Installation Guide
 AXIS Camera Station Quick Installation Guide Copyright Axis Communications AB April 2005 Rev. 3.5 Part Number 23997 1 Table of Contents Regulatory Information.................................. 3 AXIS Camera
AW-HE60 Firmware Upgrade Procedure
 AW-HE60 Firmware Upgrade Procedure Please be sure to read this first. AW-HE60 Upgrade Procedure February 2015 The update of AW-HE60 camera is performed via a network from Web setting screen on
WiPG Presentation Gateway
 WiPG Presentation Gateway Deployment Guide For more information www.wepresentwifi.com Sales: sales@wepresentwifi.com Support: help@wepresentwifi.com wepresent 2015 Contents Introduction 1 User Experience
Prestige 202H Plus. Quick Start Guide. ISDN Internet Access Router. Version 3.40 12/2004
 Prestige 202H Plus ISDN Internet Access Router Quick Start Guide Version 3.40 12/2004 Table of Contents 1 Introducing the Prestige...3 2 Hardware Installation...4 2.1 Rear Panel...4 2.2 The Front Panel
Quick Installation Card
 POWER TRIUMPH BOARD Video Conferencing System VC1 Package Contents POWER 1. 2. 4. 5. 6. 7. 8. 9. 10. 11. 12. 13. 14. 15. 3. 1. Main System 8. Mini Din 8 pin MIC Cable 2. Camera 9. HDMI Cable 3. Microphone
Installation Steps Follow these steps to install the network camera on your local network (LAN):
:") 1. Description The Network Camera supports the network service for a sensor image with progressive scan, which can be monitored on a real-time screen regardless of distances and locations. By using its
1. Description The Network Camera supports the network service for a sensor image with progressive scan, which can be monitored on a real-time screen regardless of distances and locations. By using its
TECHNICAL BULLETIN. Configuring Wireless Settings in an i-stat 1 Wireless Analyzer
 i-stat TECHNICAL BULLETIN Configuring Wireless Settings in an i-stat 1 Wireless Analyzer Before configuring wireless settings, please enable the wireless functionality by referring to the Technical Bulletin
Quick Start Guide. DVR DS-7200HWI-SH Series DVR. www.hikvision.com. First Choice For Security Professionals
 Quick Start Guide DVR DS-7300HWI-SH Series DVR DS-7200HWI-SH Series DVR NOTE: For more detailed information, refer to the User s Manual on the CD-ROM. You must use your PC or MAC to access the files. www.hikvision.com
USING THE XPERT2 / 9210B ON A TCP/IP NETWORK
 1 USING THE XPERT2 / 9210B ON A TCP/IP NETWORK Prepared by: R&D January, 2009 Sutron Corporation 21300 Ridgetop Circle Sterling, Virginia 20166 TEL: (703) 406-2800 FAX: (703) 406-2801 WEB: http://www.sutron.com/
vspace Server Management Console
 vspace Server Management Console User Manual TABLE OF CONTENTS 1.0 Getting Started... 3 1.1 Installing vspace... 3 1.2 Registering vspace... 3 1.3 Connecting Your Devices... 3 2.0 NComputing vspace...
FI8910W Quick Installation Guide. Indoor MJPEG Pan/Tilt Wireless IP Camera
 Model: FI8910W Quick Installation Guide (For Windows OS) (For MAC OS please go to page 17) Indoor MJPEG Pan/Tilt Wireless IP Camera Black White Package Contents IP Camera FI8910W with IR-Cut.x 1 DC Power
Integration of DTV Recorder Generator DVRG into a TCP/IP Network
 Product: DVRG Integration of DTV Recorder Generator DVRG into a TCP/IP Network The DTV recorder generator DVRG is a useful tool for recording and replaying MPEG2 transport streams in addition to uncompressed
Configuring the WT-4 for ftp (Ad-hoc Mode)
") En Configuring the WT-4 for ftp (Ad-hoc Mode) Mac OS X Introduction This document provides basic instructions on configuring the WT-4 wireless transmitter and a Mac OS X (10.5.2) ftp server for transmission
En Configuring the WT-4 for ftp (Ad-hoc Mode) Mac OS X Introduction This document provides basic instructions on configuring the WT-4 wireless transmitter and a Mac OS X (10.5.2) ftp server for transmission
Kramer Electronics, Ltd. Site-CTRL and Web Access Online User Guide (Documentation Revision 2)
") Kramer Electronics, Ltd. Site-CTRL and Web Access Online User Guide (Documentation Revision 2) Software Version 1.9. 2902 To check that you have the latest version, go to the DOWNLOADS section of our Web
Kramer Electronics, Ltd. Site-CTRL and Web Access Online User Guide (Documentation Revision 2) Software Version 1.9. 2902 To check that you have the latest version, go to the DOWNLOADS section of our Web
Assign a static IP address 192.168.1.100 for your computer. Please refer to the T3 in Troubleshooting guide if you need assistance.
 Assign a static IP address 192.168.1.100 for your computer. Please refer to the T3 in Troubleshooting guide if you need assistance. Connect to the Access Point with the Ethernet cable or via wireless.the
Quick Start Guide. WRV210 Wireless-G VPN Router with RangeBooster. Cisco Small Business
 Quick Start Guide Cisco Small Business WRV210 Wireless-G VPN Router with RangeBooster Package Contents WRV210 Router Ethernet Cable Power Adapter Product CD-ROM Quick Start Guide Welcome Thank you for
QOS 8 High-Speed RAID System Guide
 QOS 8 High-Speed RAID System Guide Not for Redistribution 1 Introduction The QOS is a standalone storage array, part of a file- based workflow involving numerous users sharing the same files in real time.
Lenovo IdeaCentre Q180 Series
 Machine type: 10087/3110 Lenovo IdeaCentre Q180 Series User Guide Version 1.0 2011.09 31500665 Important Safety Information Before using this manual, it is important that you read and understand all of
Deploying Windows Streaming Media Servers NLB Cluster and metasan
 Deploying Windows Streaming Media Servers NLB Cluster and metasan Introduction...................................................... 2 Objectives.......................................................
Session Viewer. User Guide. 20-06512 Rev F
 Session Viewer User Guide 20-06512 Rev F Contents 1 Introduction... 3 2 Cautions and warnings... 3 3 Technical requirements and installing the software... 3 3.1 Starting Session Viewer... 4 4 Functions
Quick Start Using DASYLab with your Measurement Computing USB device
 Quick Start Using DASYLab with your Measurement Computing USB device Thank you for purchasing a USB data acquisition device from Measurement Computing Corporation (MCC). This Quick Start document contains
Setting up a Local Interconnect Network (LIN) using dspace MicroAutoBox 1401/1501 Simulink Blocks
 using dspace MicroAutoBox 1401/1501 Simulink Blocks") Setting up a Local Interconnect Network (LIN) using dspace MicroAutoBox 1401/1501 Simulink Blocks Guiseppe Ferro Design Team 4 3/22/13 Executive Summary Learn how to setup and properly use the Real- Time
Setting up a Local Interconnect Network (LIN) using dspace MicroAutoBox 1401/1501 Simulink Blocks Guiseppe Ferro Design Team 4 3/22/13 Executive Summary Learn how to setup and properly use the Real- Time
ENGLISH. Matrox DualHead2Go and TripleHead2Go
 ENGLISH Matrox DualHead2Go and TripleHead2Go DualHead2Go Digital Edition DualHead2Go DP Edition DualHead2Go Digital ME TripleHead2Go Digital Edition TripleHead2Go DP Edition TripleHead2Go Digital SE User
Setup Manual and Programming Reference. RGA Ethernet Adapter. Stanford Research Systems. Revision 1.05 (11/2010)
") Setup Manual and Programming Reference Stanford Research Systems Revision 1.05 (11/2010) Certification Stanford Research Systems certifies that this product met its published specifications at the time
Setup Manual and Programming Reference Stanford Research Systems Revision 1.05 (11/2010) Certification Stanford Research Systems certifies that this product met its published specifications at the time
Network Attached Storage User Manual
 http://www.icybox.de IB-NAS902 Network Attached Storage User Manual Content Content... 2 Introduction... 3 SMB... 3 FTP... 3 DHCP... 3 More than a NAS... 3 Package content... 4 Take a look at the IB-NAS902...
Chapter 3 Management. Remote Management
 Chapter 3 Management This chapter describes how to use the management features of your ProSafe 802.11a/g Dual Band Wireless Access Point WAG102. To access these features, connect to the WAG102 as described
Quick Installation Card
 Power Display 2 (VGA) Display 2 (HDMI) Display 1 Speaker Audio In PC / Laptop PC / Laptop Rev.: By: yyyy/mm/dd Apprv d Part #: Mic Camera 01 Ivy Z 圖 面 繪 製 201/0/17 Calvin Description: Artwork, V2C1E AVer
1. Central Monitoring System Software
 1. Central Monitoring System Software 1-1. General information CMS program is an application with which users not only watch and control remote DVRs, but also receive video/audio data or alarm signals
Debugging Network Communications. 1 Check the Network Cabling
 Debugging Network Communications Situation: you have a computer and your NetBurner device on a network, but you cannot communicate between the two. This application note provides a set of debugging steps
Quick Installation Guide
 V48.01 Model: FI8919W Quick Installation Guide Outdoor Pan/Tilt Wireless IP Camera For Windows OS ------- Page 1 For MAC OS ------- Page 15 ShenZhen Foscam Intelligent Technology Co., Ltd Quick Installation
SOHO 6 Wireless Installation Procedure Windows 95/98/ME with Internet Explorer 5.x & 6.0
 SOHO 6 Wireless Installation Procedure Windows 95/98/ME with Internet Explorer 5.x & 6.0 Before You Begin Before you install the SOHO 6 Wireless, you must have: A computer with a 10/100BaseT Ethernet card
1 Serial RS232 to Ethernet Adapter Installation Guide
 Installation Guide 10/100 Mbps LED (amber color ) Link/Activity LED (green color ) 1. Introduction Thank you for purchasing this 1-port RS232 to Ethernet Adapter (hereinafter referred to as Adapter ).