Predicting whether users view dynamic content on the World Wide Web.
|
|
|
- Laurence Perry
- 8 years ago
- Views:
Transcription
1 Predicting whether users view dynamic content on the World Wide Web. Caroline Jay, Andy Brown and Simon Harper University of Manchester, UK Dynamic micro-content interactive or updating widgets and features is now widely used on the Web, but there is little understanding of how people allocate attention to it. In this paper we present the results of an eye tracking investigation examining how the nature of dynamic microcontent influences whether or not the user views it. We propose and validate the Dynamic Update Viewing-likelihood (DUV) model, a Chi-Squared Automatic Interaction Detector (CHAID) model that predicts with around 80% accuracy whether users view dynamic updates as a function of how they are initiated, their size and their duration. The model is constructed with data from live websites and does not rely on knowledge of the user s task to make its predictions, giving it a high-level of external validity. We discuss one example of its application: informing how dynamic content should be presented in audio via assistive technology for people with visual impairments. Categories and Subject Descriptors: H.1.2 [Models and Principles]: User/ Machine Systems human factors, human information processing; H.5.4 [Information Interfaces and Presentation]: Hypertext/ Hypermedia user issues, navigation; K.4.2 [Computers and Society]: Social Issues assistive technologies for persons with disabilities General Terms: Human Factors, Experimentation Additional Key Words and Phrases: Web 2.0, AJAX, Visual Disability, Eye Tracking, Visual Attention. 1. INTRODUCTION One of the major technological changes behind Web 2.0 is AJAX (Asynchronous Javascript and XML (Extensible Markup Language)), which enables parts of a Web page to change in isolation without needing to refresh the whole page. This allows pages to become more interactive, to the extent of appearing and behaving like traditional desktop programs. In addition to AJAX there are more traditional scripting technologies, which can also alter the appearance of a page. Together these provide the Web designer with a number of ways to change sections of a page without changing the URL. We call these sections dynamic micro-content, and the changes dynamic updates. Examples of dynamic micro-content, which includes auto-suggest lists, tickers, slideshows, updating tables, tabs and search fa- Author s address: Human Centred Web Lab, University of Manchester, UK Permission to make digital/hard copy of all or part of this material without fee for personal or classroom use provided that the copies are not made or distributed for profit or commercial advantage, the ACM copyright/server notice, the title of the publication, and its date appear, and notice is given that copying is by permission of the ACM, Inc. To copy otherwise, to republish, to post on servers, or to redistribute to lists requires prior specific permission and/or a fee. c 20YY ACM /20YY/ $5.00 ACM Journal Name, Vol. V, No. N, Month 20YY, Pages 1 0??.

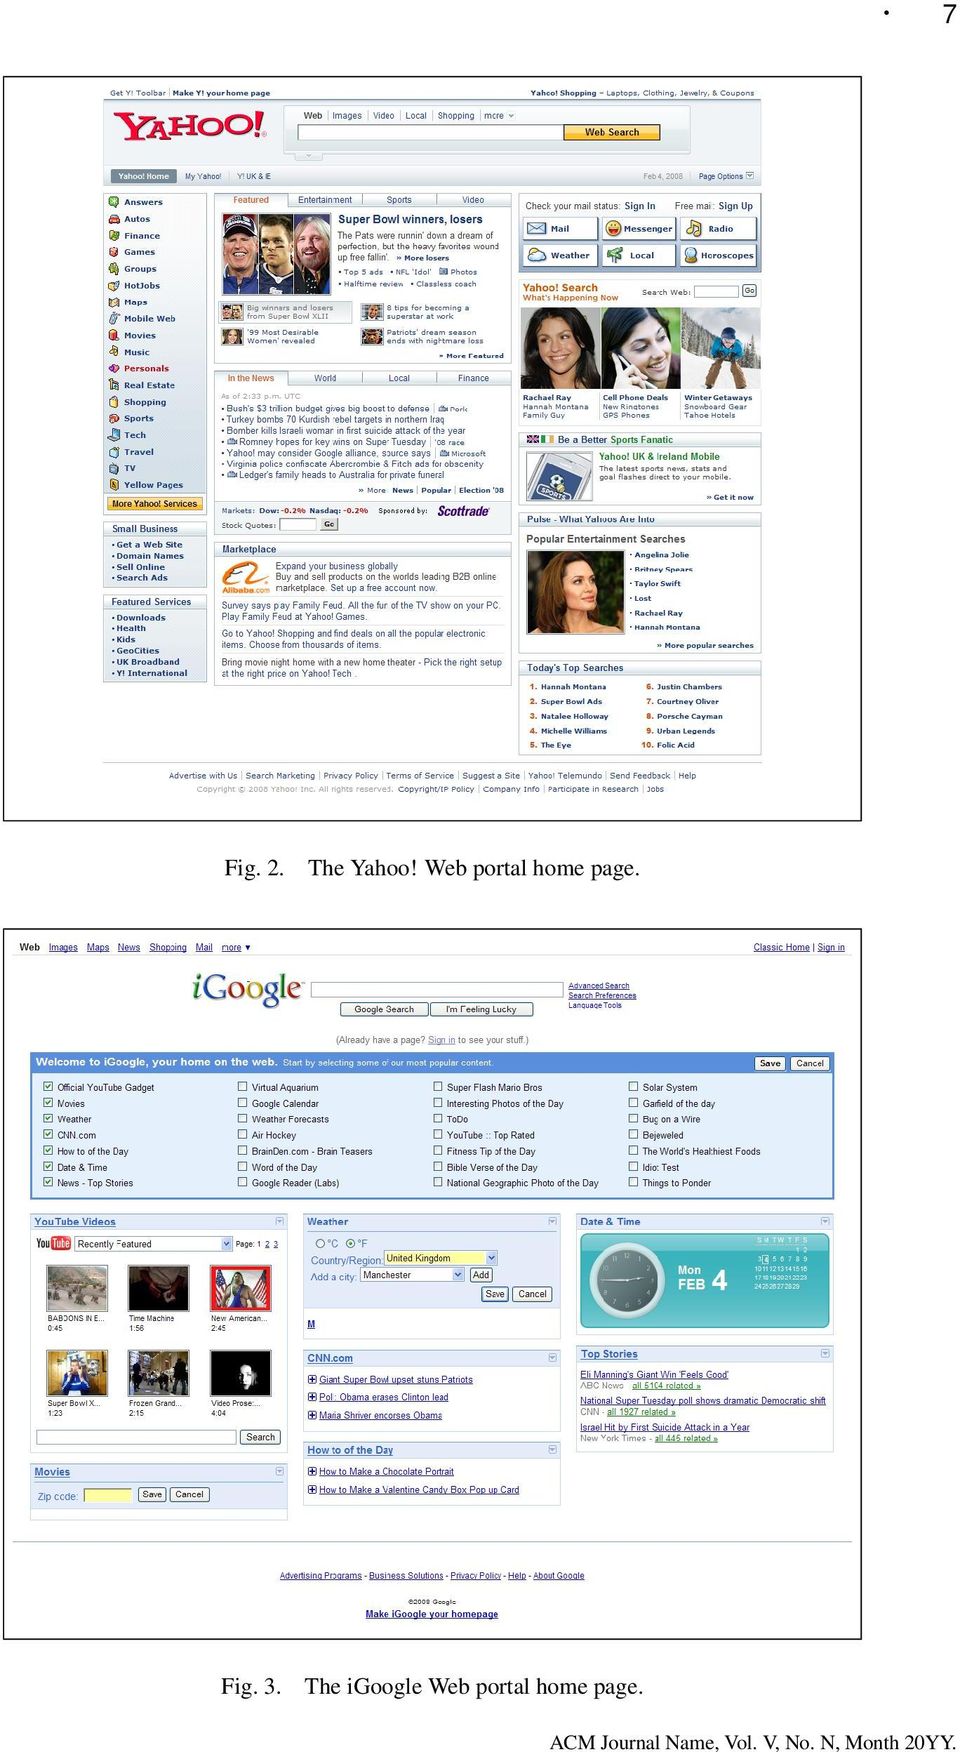
2 2 cilities, can be seen on pages such as the Yahoo! 1, and igoogle 2 Web portals (see Figures 2 and 3). Dynamic micro-content is now used very widely: of the 500 most popular websites worldwide, over 90% utilise Web technologies that can generate updates (Brown et al., 2010). Despite this prevalence, little is known about how people allocate attention to dynamic updates, particularly on live websites in a naturalistic setting. This paper presents the Dynamic Update Viewing-likelihood (DUV) model predicting whether or not users view dynamic updates with a high degree of accuracy. The model is the culmination of a detailed eye tracking investigation that examined people interacting with a wide variety of dynamic micro-content on live websites. More than 2000 dynamic updates were recorded across all the experimental sessions, and these were categorized according to a number of factors, before being analysed with a CHAID decision tree algorithm. The analysis showed that the manner in which an update is initiated is the most important predictor of whether it is viewed, with click-activated updates most likely to be viewed, and automatic updates least likely. The size of click-activated updates, and the duration of automatic and hover, enter key or keystroke-activated updates also significantly predicts whether or not they are viewed. Section 2 describes previous work looking at how people allocate attention to animated or updating content on Web pages. Section 3 describes the initial data collection and model creation process, and Section 4 explains how the model was validated. Section 5 discusses why the model takes the form it does, and what it says about how users interact with dynamic micro-content, and Section 6 describes an application of the model informing the presentation of dynamic updates in audio for users with visual impairments and considers how it compares to other models predicting user behaviour on the Web. Finally, Section 7 summarizes the contribution and limitations of the investigation, and outlines directions for future research. 2. BACKGROUND AND RELATED WORK Psychological studies indicate that both the appearance of new objects (Hillstrom and Yantis, 1994) and the movement of existing ones (Franconeri and Simons, 2003) are good at capturing attention, but the extent to which observers allocate their attention to dynamic data sources depends upon many factors, including colour and movement direction (Saenz and Buracas, 2003) and the presence of competing dynamic events within the display (Miller, 1989). Although movement appears to have a greater bottom up salience than other visual cues (Carmi and Itti, 2006), it is not clear that it truly captures attention in a stimulus-driven fashion, so whether or not someone views a moving or changing object is affected by top down processes, such as the task they are performing at the time, and their anticipation of the change (Jingling and Yeh, 2007; Pinto et al., 2008). When people are viewing Web pages, it is implicit they have a task in mind (even if it is simply finding something interesting to look at), as well as numerous expectations of a page based on their previous experience of the Web (Habuchi et al., 2006), so there are many factors that may influence the allocation of attention in this visually complex medium
 model predicting whether or not users view dynamic updates with a high degree of accuracy.")
3 3 A number of controlled studies have examined the effects of changing or moving Web content on task performance. Zhang (1999) found that animations were detrimental to performance in an information-seeking task, particularly if the task was simple and the animations were brightly coloured, qualitatively similar to the information sought, and repeatedly flashed on and off. By contrast, Diaper and Waelend (2000), who criticized Zhang s tasks for lacking external validity (participants searched for random strings or words amongst other random strings or words), found that unrelated graphics, whether animated or not, had little impact on participants ability to search for an answer in a block of text. Similarly, van Schaik and Ling (2004) found that in an information retrieval task, peripheral animations did not affect performance, although they were reported to be more distracting than static graphics. Maglio and Campbell (2000) examined the extent to which scrolling displays (tickers) either distracted participants, or helped to provide them with desired information. Discrete motion displays, where a line of text appears and remains still, were preferable to continuous scrolling displays for two reasons: they were less likely to distract someone from his or her primary task (in this case, editing a block of text); and the start-stop motion helped to alert participants to the arrival of new information, enabling them to schedule their glance to just after it appears, rather than forcing them to constantly monitor the ticker. Bartram et al. (2003) examined various types of display update, and found motion was more effective in a notification system than either colour or shape change, and that different types of moticon (moving icon) varied in their ability to attract the participant s attention. Blinking moticons were the least distracting, followed by moticons that moved up in a sinusoidal motion then jumped back to their starting place, then moticons that zoomed smoothly to twice their starting size. Travelling moticons, which moved from side to side, or up and down, were the most distracting. When it came to the ease with which participants could detect different moticon notifications, however, the task they were doing had a significant impact: it appeared easier to detect movements that were different to those that occurred in their current task. McCrickard et al. (2003) investigated the effect of various notification systems (tickers and alerts) on different types of task, finding that tickering text is best for supporting deeper comprehension, and fading best facilitates reaction. In line with Diaper and Waelend (2000) and van Schaik and Ling (2004), they also found that animated displays did not disrupt performance of the primary task, in this case, browsing. In a study investigating how to present help documentation on a secondary monitor, participants spent 18% of the time viewing ambient updating help when employed in an open-ended non-timecritical task, but only 3% of the time when doing something highly focused and timecritical (Matejka et al., 2011). Experiments examining the phenomenon of banner blindness (failure to attend to salient blocks of content, usually advertisements) have found that animation fails to improve either recognition or recall of such content (Bayles, 2002), although memory for animated banners is better when users are browsing, rather than performing goal directed tasks (Pagendarm and Schaumburg, 2001). Burke et al. (2005) found that the presence of animated banners does not impair performance in a visual search task (although people do report the task to be harder than when banners are static), and used eye tracking to show that people are no more likely to look at animated banner ads than static ones. It is possible to draw some high-level conclusions from the collective results of these
, who criticized Zhang s tasks for lacking external validity (participants searched for random strings or words amongst other random strings or words), found")
4 4 studies: people do appear to notice changes to Web pages, but can ignore them if they need to, and the extent to which they attract attention depends on both the nature of the change, and the task the user is performing. One issue affecting the studies reported above is that they all used specifically constructed, rather than wild Web pages. This is necessary when running a controlled study examining task performance, but it is at the expense of ecological validity it is impossible to be sure that the results would apply to other kinds of Web use. The investigation reported here addresses this issue, by studying people undertaking a variety of complex tasks on live websites. To keep interaction as naturalistic as possible, people were not constrained in the way they used and viewed the sites (beyond being asked to complete some high-level tasks), and were not asked to comment on whether they noticed page updates, or found them useful or distracting. Instead, their gaze was monitored with an eye tracker, to determine if and when they viewed a change. Eye tracking has been used to investigate allocation of visual attention to Web stimuli in numerous situations (e.g. Djamasbi et al. (2010); Granka et al. (2004, 2006)), but with the exception of Burke et al. (2005), it has not yet been used systematically to ascertain the circumstances under which people view updating content. Tracking eye movements is not a perfect way of determining where someone has directed his or her attention: fixated objects do not always register in conscious attention, and objects that are not fixated may still be attended to covertly (Beanland and Pammer, 2010). Nevertheless, its ability to reveal where a person is focusing, coupled with its unintrusive nature, makes eye tracking an excellent tool for answering the question of whether people view dynamic updates when they are using the Web. 3. EXPERIMENT 1 Previous studies have shown that the ability of certain types of animations, moticons and tickers to attract, or distract, the user changes according to their visual characteristics, and the user s task. These studies were all conducted in highly controlled environments however, so the extent to which their results apply beyond the study setting is not clear. The goal of the experiment 1 was to ascertain whether it is possible to predict the likelihood that an update will be viewed in real world Web interaction. There are potentially many factors that may affect whether or not an update is viewed, particularly those relating to its salience, such as the colours or levels of contrast it contains. Although salience maps have been produced for Web pages (Zheng et al., 2009; Jay et al., 2007), these apply only to static pages, and do not consider changes to content over time. Whether the change is an isolated instance or occurs over a longer period, and the proportion of the content within the HTML element that changes may also impact on whether a user views it. These variables are difficult to accurately categorize, however, and as such were not considered in the study as independent variables. The relevance of the update to the user s task is also likely to affect whether it is viewed, but as the semantic nature of a task or goal is not known during real world Web interaction, this was not considered as a factor either. Instead the study examined: The action used to trigger the update (none/hover/keystroke/enter key/click). The area of the HTML element containing the update in cm 2. Whether the update replaced or added to the existing content on the page. The duration of the update in seconds.

5 5 The study aim was to develop a predictive model of viewing behaviour with a high level of external validity, so rather than systematically controlling the updates that appeared, users were set a series of tasks on live websites that were broadly designed to prompt them to interact with dynamic micro-content. Each update that occurred was then classified on a post hoc basis, and CHAID analysis was used to determine the parameters for categorising each of the factors. The hypotheses of the study can be summarized as follows: H1: The user will view updates s/he has initiated. It is not possible to predict the user s task in real world Web interaction, but it is reasonable to assume that if the user triggers an update it is likely to be relevant to what s/he is doing, and s/he will view it. H2: The user will not view automatic updates. Previous research shows that users are not likely to view animated banners any more than static ones, so they may not view the majority of automatic updates. H3: The user is equally likely to fixate content that has been added to the page and content that replaces existing information on the page. As both types of update contain new information, it is not clear that one type of update would be more useful to the user than the other. H4: The larger an update region is, the more likely it is to be viewed. There is a greater probability that a fixation will land on a large region than a small one simply by chance, and changes to large areas may also be more salient, and therefore more likely to be fixated. H5: The longer an update lasts, the more likely it is to be viewed. The longer an update remains on the screen, the greater the probability the user may get round to reading it, or fixate it by chance. Section 3.1 below describes the procedure used for collecting the data, and Section 3.2 describes the process of data analysis. 3.1 Method Participants started each task on a live Web page that was rich in dynamic micro-content, and it was anticipated that they may use some of this content in the process of completing it. To ensure external validity, people were free to approach the tasks however they wished. In addition, participants spent several minutes browsing, with no specific instructions. Participants eye movements were recorded as they completed the tasks. The recordings were then reviewed, and every update encountered by a participant logged and categorised. A CHAID decision tree algorithm was used to ascertain which features of a dynamic update reliably predict whether it is fixated by a user Stimuli. The full range and scope of dynamic micro-content usage is currently unknown. In the experiment, we wished to document interaction with popular, live websites that contained a significant amount of dynamically updating content. Participants completed tasks on, or starting from, the home pages of the following sites: Kayak (Figure 1): a travel site incorporating a flight search engine. Yahoo! (Figure 2): a Web portal that contains links to news and information from Yahoo! and other sources.

6 6 Fig. 1. The Kayak travel site home page. igoogle (Figure 3): a Web portal that contains links to news and information from Google and other sources. Google Suggest (Figure 4): a Google search page that provides an auto-suggest list for the term you type in the search box, based on common searches. In all cases, interaction was documented with live websites, which meant that every participant experienced slightly different content Tasks. As the aim of the study was to investigate how people allocate attention to dynamic updates, the directed tasks used in the experiment were designed to prompt interaction with various items of dynamic micro-content. People were not obliged to use this content, however; they were simply asked to achieve a goal, and were free to accomplish this however they chose. Participants also completed two browsing tasks, where no particular goal was specified, and they were free to interact (or not interact) with dynamic micro-content as they wished. The instructions given to participants for each task are listed below, with the dynamic micro-content they might be expected to use in italics: Task Kayak Search: Search for a flight for one person from Manchester to New York, leaving on <date> and returning a week later. When the user types in the From and To text fields, a list of suggestions (auto-suggest list) matching his/her input appears (see Figure 5 3 ). A calendar appears when the focus enters the date input boxes, showing a month formatted as a table, and allowing users to click on a date to select it (See Figure 6). After submitting the search form, a new page is loaded, which presents results as they appear. A progress bar in the top left of the page indicates how much of the process has completed, below which is an updating list of the airlines that have been searched so far. Initially the centre of the page contains a message telling 3 In figures 5 to 15, the red dots indicate user fixations, and the lines saccades.


7 7 Fig. 2. The Yahoo! Web portal home page. Fig. 3. The igoogle Web portal home page.
8 8 Fig. 4. The Google Suggest home page. the user that a search is in progress; after a few seconds this is replaced with a table of flights, which updates as results are received (see Figure 7). Task Kayak Cheapest: What is the cheapest flight available? The results table may be re-ordered dynamically by clicking on the headings, e.g., clicking the Price column heading reorders the rows according to price. A box containing the message Sorting results... appears while the rows are being reordered (see Figure 8). Task Kayak Latest: When does the last flight of the day leave? Users may encounter the reordering table, as in task Kayak Cheapest. Task Yahoo! Headlines: Could you browse the headlines in the centre of the page, and find one about a story that interests you? When you have found a headline, could you read it out? The Yahoo! page has news stories arranged by category into tabs. The default view is In the News ; clicking one of the other tabs ( World, Local, or Finance ), replaces the headlines with a set relevant to that particular category (See Figure 9). Task Yahoo! Weather: What will the weather be like in New York today? The topright area of the Yahoo! page has six buttons ( Mail, Messenger, Radio, Weather, Local, Horoscopes ). When the mouse pointer hovers over one of these, an area below it expands to show relevant content, e.g., a search box for defining a weather forecast location (see Figure 10). Task Yahoo! Radio: Could you locate a link to a radio station that interests you? The hover-initiated Radio button expands in the same way as the Weather button, revealing an image and brief description of a radio station. Arrows to the left and right of this description allow the user to dynamically change the information to scroll backwards or forwards through a set of different radio stations (see Figure 11). This type of content is often known as a slideshow or carousel

9 9 Fig. 5. A participant views the auto-suggest list when selecting the destination airport in task Kayak Search. Task Yahoo! Sports-Entertainment: Find a sports or entertainment story that interests you, and read out the first sentence. Sports and Entertainment stories are presented in tabs, as described in task Yahoo! Headlines. (See Figure 12(a)). Task igoogle CNN: There is a section on the page that contains stories from CNN.com. Could you take a look at these, and read out the one you find most interesting? The igoogle page has a section with three news headlines from CNN. To the left of each is a + sign, which, if clicked, causes an area below it to expand, revealing more detail about the story (see Figure 13). Task igoogle How To: There is a section on the page entitled How To of the day. Could you take a look at this, and read out the How To you are most interested in? The How To section has headlines which may be expanded, in the same way as the CNN headlines. Task igoogle Weather: What will the weather be like in Manchester today and tomorrow? The Weather section on igoogle offers a search box for users to enter a destination for weather forecasts. When the search has completed, the search box is replaced with text and images giving the forecast (Figure 14). Task Google Suggest Manchester/Browse: Search for the University of Manchester/anything you wish. These tasks start from the Google Suggest page, which contains a search box. Suggestions are presented below the input box in an auto-suggest list, updating (but not necessarily changing) after each keystroke (see Figure 15). Task Yahoo!/iGoogle Browse: Starting on the Yahoo!/iGoogle home page, look at whatever you wish. You will be browsing for two minutes: the investigator will tell you when the time is up. These tasks are unstructured and the user may encounter a wide variety of dynamic-micro content Participants. 17 male and 13 female volunteers, aged between 18 and 34, took part in the study. All participants used the internet on a daily basis. Participants were recruited through the University of Manchester research volunteering notice board 5, and as such were either staff or students at the University, or friends of staff or students. 5

10 10 Fig. 6. A participant selects the departure date from the calendar in task Kayak Search. The calendar appears when the participant edits the date field, or clicks the symbol to the right of the date field. Fig. 7. A participant s gaze switches between the progress bar and the updating table of flights as the search progresses in task Kayak Search. Fig. 8. A participant views the Sorting results... box after clicking the Depart column heading, when asked to name the last flight of the day in task Kayak Latest.

11 11 Fig. 9. A participant views the headlines in the centre section of the Yahoo! page in task Yahoo! Headlines. Fig. 10. A participant views the search box produced by the Weather button in task Yahoo! Weather. Fig. 11. A participant views the carousel produced by the Radio button in task Yahoo! Radio.

12 12 (a) The participant clicks the Entertainment tab and views the new content. (b) The participant clicks on a summary. (c) The summary replaces the main content. Fig. 12. A participant uses the tab facility to find a story in task Yahoo! Sports-Entertainment Procedure. Participants sat in front of a 17 monitor with a built in Tobii 1750 eye tracker. The page data and eye movements were recorded on a SONY VAIO VGN- FS315S laptop using Tobii Studio Professional Edition software. Participants started the experiment on an index page, which contained links to the sites. They visited the websites in a random order, but performed all of the tasks on the site (again, in a random order, with the exception of the Kayak tasks, which were completed in sequence due to the stepwise

 The participant views the weather. Fig. 14.")
13 13 Fig. 13. A participant clicks on the + sign to view a summary in task igoogle CNN. (a) The participant searches for Manchester. (b) The participant views the weather. Fig. 14. A participant uses the search box in the Weather section to find the forecast for Manchester in task igoogle Weather.
 The participant views the weather. Fig. 14.")
14 14 Fig. 15. A participant views the auto-suggest list in task Google Suggest Manchester. nature of the interaction required by the site) before moving on to the next. They completed the directed tasks first, and then the browsing tasks, finally completing a short questionnaire asking how frequently they used the Web and whether they had encountered the sites used in the evaluation previously. All the experimental materials (consent form, information sheet and questionnaire) are contained in the Web Ergonomics Lab eprints data repository, along with a detailed description of how people completed the tasks, the Tobii Studio Project file containing the eye tracking data, and an SPSS file containing the data entered into the analysis (Jay and Brown, 2008). 3.2 Results The questionnaire results showed that 22 participants had previously used at least one of the websites featured in the study (or a similar site). All participants, including the 8 who had not encountered the sites before, used the internet on a daily basis, however, and as such are highly likely to have encountered dynamic micro content previously (Brown et al., 2010). Observation of gaze replays showed that all participants were indeed able to fully engage in their tasks using the dynamic micro-content. Participants completed the tasks in a wide variety of ways, encountering various types of dynamic content. As the focus of this paper is understanding whether people view dynamic updates as a function of their characteristics, but irrespective of user task, a detailed qualitative description of how people completed the tasks is not provided here, but can be found in the study s technical report (Jay and Brown, 2008). The sections that follow describe the procedure (3.2.1) and results (3.2.2) of the decision tree analysis used to determine the factors that affect whether or not a user views a dynamic update Analysis procedure. There is no software presently available that can automatically map gaze data to updates occurring on Web pages, so instances of dynamic content were logged manually. Each Web page containing dynamic micro-content was defined as a scene in Tobii Studio, and each item of dynamic micro-content within that page as an area of interest (AOI), with its boundaries determined by the outside edge of the HTML element in which the change occurred. An update was defined as any visible change 6 that 6 Changes caused by manipulating the view in the browser such as scrolling or resizing the page were not categorized as updates.
 are contained in the Web Ergonomics Lab eprints data repository, along with a detailed description of how people")
15 15 occurred on a Web page, regardless of the underlying technology that caused it. The start and end times of every update were identified by watching the gaze replay slowed down by a factor of 5 (the lowest setting) and pausing it and recording the time stamp at the relevant points. As this was done manually, the recorded time is slightly later than the actual time (comparing the investigator s response to events such as mouse clicks with the time recorded in the Tobii log file suggests the delay is in the region of ms), but we have not applied any adjustment as the precise fixation time is not crucial to the current study, and we did not wish to add further noise to the data. The start time was logged as the instant at which the update started to occur visibly. An update was said to end due to one of the following occurrences: the user navigated to a new page; the user scrolled the page; the dynamic micro-content was otherwise moved or replaced (usually by another update). A script was used to compare the update instances with the gaze data log files, and calculate the time and duration of fixations for each update. Whether the content was viewed (yes/no) constituted the dependent variable in the analysis. A single fixation occurring at any point during the lifetime of the content resulted in a yes classification, as it was assumed this would provide sufficient information to either dismiss the content, or focus on it further. The independent variables were: the action used to trigger the update (none/hover/keystroke/enter key/click); the area of the HTML element containing the update in cm 2 ; whether the update replaced or added to the existing content on the page; and the duration of the update in seconds. As participants experienced varying types and numbers of dynamic updates, and it is possible that some people are more likely to view updates than others, an identifier for the participant who encountered the update was also entered as an independent variable. Website was not used as a predictor, as sites were live and their content and layout varied over time. Action, whether or not content was replaced or added to and participant identifier were entered as categorical variables and duration and area were entered as continuous variables. To confirm the existence of a relationship between the characteristics of the update, and the likelihood that it was viewed, the data were analyzed in SPSS 15.0 using the Chi- Squared Automatic Interaction Detector (CHAID) classification tree procedure. CHAID was chosen for analysis of the data set due to its ability to automatically detect and clearly illustrate interactions between variables. It takes both categorical and continuous variables as input, and produces a tree illustrating the relative contribution of each variable in predicting a particular outcome. Whilst categorical variables are treated as discrete groups, continuous variables are partitioned as part of the CHAID analysis process into optimally predictive categories. This is useful for defining the parameters at which to classify an update as viewed or not viewed. 7 The procedure was first carried out using filtered eye tracking data that only included fixations occurring within a 40 degree radius for at least 100 ms. This was chosen as a threshold because people are known to be able to formulate an impression of a scene in this time (Potter and Levy, 1969) and it is recommended by Tobii as the appropriate threshold to use when people are viewing mixed content (i.e. text and images) 8. As responses to dynamic updates on Web pages have not previously been studied, and it is therefore unclear precisely where the parameters for a meaningful fixation should be set, the anal- 7 The raw data used for the analysis are available at 49/. 8

16 16 Content Type Keystroke Click Enter Hover None Additional form field Animated advertisement Animation Auto-suggest list Button text change Calendar Carousel Description Drop-down list Drop-down menu Expansion box Interactive advertisement List box Message box Interactive content Pop-up box Pop-up box/animation Progress bar Reordered table Search results Slideshow Status text Tabbed content Text field selection Ticker Updating list Video Video replacement Total Table I. The instances of dynamic micro-content encountered by participants during the study, categorised according to content type and action that triggered them. ysis was repeated with the raw data, which includes all fixations that are greater than 20 ms. This process, reported in Appendix A, confirmed that the filter applied to the data was appropriate. The results of the analysis conducted with the filtered data are reported in the following section Analysis results updates were documented, of which 364 occurred automatically and 1122 occurred in response to a user action. Automatic updates included animations, movies and tickers. User-initiated updates included auto-suggest lists, tabbed content, tables, movies, progress bars, pop-up boxes and drop-down menus. Some types of dynamic micro-content, such as slideshows, were both automatic and user-initiated. Table I categorises the instances of dynamic micro-content that appeared on the websites, as a function of how their type and how they were initiated. The results of the analysis are shown in Figure 16. The model is able to predict whether or not an update is viewed with 78% accuracy (see Table II). Participant was not a significant predictor in the model, indicating that the likelihood that a dynamic update was viewed did not vary according to the individual who encountered it. Whether the update

17 17 Fig. 16. The CHAID model showing the likelihood an update was viewed as a function of the action that triggered it, its duration in seconds and its area in cm 2.

18 18 Observed (Predicted) % Correct Viewed 507 (710) 84% Not Viewed 653 (776) 71% Overall 1160 (1486) 78% Table II. Classification table for the CHAID model. added to or replaced content on the page did not affect whether it was viewed either 9. The most important predictor was the way that the update was initiated. 77% of updates activated by a click were viewed, followed by 41% of hover, enter key or keystrokeactivated updates (which were entered into the analysis separately, but were not significantly different) and 20% of automatic updates (χ 2 (2, n = 1486) = 292, p < 0.001). The duration of an automatic update significantly affected the likelihood it would be viewed. Only 6% of updates shorter than 2.8 sec were viewed, compared with 20% of updates that lasted between 2.8 and 6.2 sec, and 30% of updates longer than 6.2 sec (χ 2 (2, n = 363) = 23.1, p < 0.001). Duration also affected how likely hover, enter key or keystroke-activated updates were to be viewed. Only 16% of updates shorter than 0.6 sec were viewed, followed by 41% of those between 0.6 and 1.2 sec, 59% of those between 1.2 and 2.8 sec, and 81% of those longer than 2.8 sec (χ 2 (3, n = 619) = 157, p < 0.001). Size, rather than duration, affected the likelihood that click-activated updates would be viewed. 39% of those smaller than 1.1 cm 2 were viewed, 71% of those between 1 and 7.8 cm 2, 90% of those between 7.8 and 32.9 cm 2, and 99% of those greater than 32.9 cm 2 (χ 2 (3, n = 504) = 133.4, p < 0.001). 3.3 Discussion of Experiment 1 The experiment was designed to explore how people allocate attention to dynamic updates that appear in the course of normal Web use. Participants completed a number of highlevel tasks on live websites, and experienced a large number of updates (50 per participant on average). These updates were categorized according to key, measurable features, and a CHAID decision tree procedure was used to ascertain whether it is possible to predict whether an update is viewed as a function of these features. The resulting model is able to predict whether or not an update is viewed with 78% accuracy. How an update is initiated is by far the best predictor of whether it is viewed: 75% of click-activated updates, 39% hover/enter key/keystroke-activated updates, and just 20% of automatic updates were viewed overall. Area is the best predictor of whether clickactivated updates are viewed, and duration is the best predictor for automatic, keystroke, enter key or hover-activated updates. Although the model appears to provide a good fit, additional data are necessary to validate it. The original input data were collected under circumstances designed to produce naturalistic Web interaction, to ensure the model had external validity. As the participants were still instructed to perform particular tasks, however, it cannot be assumed the model will apply to other types of Web use. To confirm the model s validity, it is necessary to collect further data from different people using different websites in different ways. 9 Figure 16 shows the model providing the best fit. Models considering only action and duration, or action and area, also predicted whether updates were viewed, albeit less accurately. These models are shown in Appendices B and C respectively.
 and 20% of automatic updates (χ 2 (2, n = 1486) = 292, p < 0.001). The duration of an automatic update significantly affected the likelihood it would be viewed.")
19 19 Fig. 17. The BBC Get Cooking home page. 4. EXPERIMENT 2: EVALUATING THE MODEL A second study was carried out approximately 2 years later, specifically to collect data with which to validate the model. 4.1 Method Experiment 2 was designed to determine the external validity of the model. Data were collected and analysed as described in Participants. Five female and 7 male participants aged between 18 and 34 were recruited through the University of Manchester research volunteering notice board. All participants used the internet on a daily basis. None had participated in Experiment Procedure. As the aim of the study was to validate the model with data that were as close to normal Web use as possible, participants were not required to complete any particular tasks in the evaluation study. They spent three minutes on each of the following sites, chosen because they had a large amount of dynamic content: BBC Get Cooking 10 (see Figure 17); GMTV 11 (see Figure 18) and Expedia 12 (see Figure 19). They also spent 5 minutes visiting whichever sites they wished, starting from the Google home page. Participants were free to browse and use the sites however they wanted. The order in which they visited the sites varied according to a Latin square. 10 Now offline. 11 cms.gm.tv 12

, so")
20 20 Fig. 18. The GMTV home page. Fig. 19. The Expedia home page. 4.2 Results Inadequate data was obtained from two of the participants (both were wearing glasses, and it appeared that the lens type prevented the eye tracker from adequately picking up their gaze), so the results are described for data from 10 participants (4 female and 6 male). The data were logged and categorized as specified in Section 3.2.2, and were entered into the CHAID procedure as test data, with which to validate the existing model. Data were
. The data were logged and categorized as specified in Section 3.2.")
21 21 Content type Keystroke Click Enter Hover None Animated advertisement Animation Auto-suggest list Calendar Slideshow Drop-down menu Expansion box Pop-up box Status text Carousel Progress bar Search results Slideshow advertisement Tabbed content Text field selection Ticker Video Total Table III. The instances of dynamic micro-content encountered by participants during the evaluation study, categorised according to content type and action that triggered them. Observed (Predicted) % Correct Viewed 128 (202) 63% Not Viewed 358 (383) 94% Overall 486 (585) 83% Table IV. Classification table for the validation data CHAID model. recorded for 246 automatic and 339 user-activated updates. Table III provides a summary of the main types of update participants experienced. The validation data fit the model slightly better than the training data, with whether or not 83% of updates were fixated being accurately predicted, compared to 78% (see Table IV). Fewer updates of all types were fixated 11% of automatic, 31% of hover/enter key/keystroke-activated and 68% of click-activated (χ 2 (2, n = 585) = 292, p < 0.001) but the relative proportions of updates fixated in each category are very similar to those seen with the training data. Of the automatic updates, 7% of those shorter than 2.8 s, 9% of those between 2.8 and 6.2 s and 19% of those longer than 6.2 s were viewed (χ 2 (2, n = 246) = 23.1, p < 0.001). Of click-activated updates, 25% of those smaller than 1.1 cm 2, 83% of those between 1.1 and 7.8 cm 2, 79% of those between 7.8 and 32.9 cm 2, and 100% of those larger than 32.9 cm 2 were viewed (χ 2 (3, n = 158) = 162.7, p < 0.001). Of hover/enter key/keystroke-activated updates, 20% of those less than 0.6 s, 35% of those between 0.6 and 1.2 s, 78% of those between 1.2 and 2.8 s and 64% of those longer than 2.8 s were fixated (χ 2 (3, n = 181) = 157, p < 0.001). 4.3 Discussion of Experiment 2 The model provides an excellent fit to the validation data, accurately predicting whether or not 83% of updates are viewed. The model may be a better fit to this data set because it
22 22 Fig. 20. The CHAID model created with the validation data, showing the likelihood an update was viewed as a function of the action that triggered it, its duration in seconds and its area in cm 2.
23 23 is more likely to correctly predict when an update is not viewed than when it is, and the validation data contained a greater proportion of automatic updates. It should also be noted that participants were from the same demographic group (young, English-speaking adults recruited through the University research volunteer notice board) in both studies, and data from other participants for example, older users may produce different results. 5. DISCUSSION Previous studies have shown that updating Web content can distract or aid users performing particular tasks on artificially constructed Web pages, but so far none has investigated how users respond to the rich and complex dynamic micro-content frequently encountered during normal Web use. This investigation had the aim of understanding how people allocate attention to dynamic updates on real Web pages. Although there are potentially many factors that may influence this process, the results of a CHAID analysis show that it is possible to predict the likelihood that someone will view a dynamic update with an accuracy of around 80%, by considering a few measurable characteristics of the update. The best predictor of whether an update is viewed is the way in which it is triggered, with participants most likely to view click-activated updates and least likely to view automatic updates. H2: The user will not view automatic updates is supported by the data, as only 20% of automatic updates are fixated. H1: The user will view updates s/he has initiated is only partially supported, however. Whilst people view 77% of updates initiated by a click, they view only 41% of those activated by a mouse hover or keystroke. Clicking is an accepted means of requesting information and previous research shows that eye and mouse movements are often co-ordinated (Rodden et al., 2008). For example, when a user clicks the Go button after entering a location in the weather section of the Yahoo! website, he or she is specifically asking for a summary of the weather, and is therefore likely to view the resulting content. An interesting question with regard to click-activated updates may be why participants do not fixate all of them. The answer may lie in the fact that although many such updates will be crucial to the task at hand, a number will not be. The weather summary is a key item of information essential to the task of finding out the weather forecast, and as such is anticipated by the user. It is not the only update activated by the click, however: a small rotating arrow icon also appears on the right of the text field after the request has been submitted. This indicates that the request has gone to the server, and a response should be expected shortly. It informs the user that something is happening, but it does not provide information that is essential to the task. The fact that the proportion of click-activated updates viewed increases with size indicates that salience plays a role in whether such updates are fixated: only 39% of those smaller than 1.1 cm 2 are viewed, compared to 71% of those greater than 1.1 cm 2. Why are the majority of mouse hover, enter key or keystroke-activated updates not viewed, even when they have been initiated by the user? In the case of hover-activated updates, it may be because they were not initiated deliberately. Whereas a click is a decisive action, hovering occurs continually, and as such hover-activated updates sometimes appear when the user does not intend them to. If this happens while the mouse is moving from one location to another, the relevant information (such as a menu or tool tip ) will appear only fleetingly. If it is unexpected and irrelevant to the user s current activity, such an update is unlikely to be viewed. Longer updates are more likely to result from an intentional hover: the user is requesting the information, and as such is more likely to view
24 24 it. This explanation is supported by the model: only 16% of hover and keystroke-activated updates shorter than 0.6 are viewed, but this proportion rises considerably as duration increases, to 41% of those between 0.6 and 1.2 s, 59% of those between 1.2 and 2.8 s, and 81% of those longer than 2.8 s. This relationship between duration and user intention may apply to keystroke-activated updates too, which occur almost entirely during the use of auto-suggest lists. Although participants do not look at every change to the list (it is usually updated with each keystroke and many people look at the keyboard to type), suggestion lists are glanced at and selected from by the majority of participants at some point during their lifetime (Brown et al., 2009). The longer duration of a keystroke-activated update may therefore arise as the user pauses typing in order to view the list. Although pressing the enter key is in one sense a keystroke, it performs a different function to other keystrokes activating a control rather than entering text. As it often has the same role as a click, it is perhaps surprising that they are not classified in the same way by the model. Whilst the click requires visual attention, however, the enter keystroke does not. Updates caused by pressing a button often appear close to that button, and this may be why they are more likely to be viewed when the user has clicked the co-located control, rather than pressed enter. H3: The user is equally likely to fixate content that has been added to the page and content that replaces existing information on the page is supported by the data, as whether the update replaced or added to the content on the page did not predict whether it was fixated. H4: The larger an update region is, the more likely it is to be viewed and H5: The longer an update lasts, the more likely it is to be viewed are only partially supported, however, as duration is not a significant predictor of whether a click-activated update is fixated, and size does not affect the likelihood that automatic, hover, enter key or keystrokeactivated updates are fixated. The reason that the duration of click-activated updates does not affect the likelihood they are viewed may be because they are generally relevant to the current activity in the user s workflow, and are therefore attended to quickly if at all. That size does not predict the likelihood that automatic, keystroke or hover-activated updates are viewed is interesting, as this provides evidence that larger and potentially more salient updates are no better at attracting attention than smaller ones when they are irrelevant to the user s task. 6. APPLICATIONS OF THE MODEL The DUV model has potential applications in a number of domains. It has value from a design perspective showing, for example that automatic updates never have more that a 30% chance of being viewed, however long they remain on the screen, and that whilst salience (as indicated by size) affects the likelihood that click-activated, task-relevant updates are viewed, it has no impact for any other type of update. The model also describes how one could expect the user to behave on the average Web page containing dynamic content. This would be useful in a usability context, as a benchmark for determining whether people are viewing updates more or less frequently than expected. Below, two further contributions are discussed in detail: how the DUV model can be used to guide the design of screen reading assistive technology; and how it adds to the domain of modelling Web-based interaction.
25 6.1 User Agent Design Recommendations 25 The DUV model provides a means of predicting how likely an update is to be viewed, and illuminating how users interact with different categories of dynamic micro-content. A greater understanding of what causes a user to attend to or ignore an update would be of particular value when dealing with situations where bandwidth is limited, and decisions must be made about how and when to present updating information to the user. This issue arises with small-screen or mobile devices, where only part of a Web page can be viewed at one time, but is perhaps most pertinent to screen reading assistive technology devices (used by people with visual impairments), which present Web pages in a serial audio stream. As only a single item of information can be presented at once, knowing whether to relay an update potentially interrupting the information flow and causing confusion is crucial. The following recommendations show how the model may be applied to improve screen reader presentation of dynamic updates, but several would also apply to presentation via mobile or screen magnification devices. Often, Web pages contain competing streams of content, where updates occur either simultaneously, or in quick succession. In this situation, the challenge is to present the right content to the user at the right time. According to the model, participants view the majority of click-activated updates larger than 1.1 cm 2, so presenting these should be a priority. Although those smaller than 1.1 cm 2 are only fixated 39% of the time, they are still viewed more frequently than even the longest automatic updates. As it is likely they bear some relevance to the task, they may be useful to the user. The appropriate rule may therefore be: Attempt to present all click-activated updates, prioritizing the largest. The longer a hover update is, the more likely it is to be fixated. This may be because shorter updates are activated by mistake (due to the mouse passing over it while the user completes another task); the longer duration of a hover-activated update is a signal the user intends to view the information it contains. Similarly, the longer duration of a keystroke-activated update occurs when the user pauses typing to view an auto-suggest list. The majority of hover or keystroke-activated updates lasting longer than 1.2 s are viewed by users, so this could be viewed as the threshold after which to present them. Waiting to see whether the updates reach this length before presenting them may cause an irritating delay, however. A better rule for this type of update may therefore be: Present hover-activated updates when there is a pause in mouse movement 13, and keystroke-activated updates when there is a pause in typing. What exactly constitutes a pause is open to debate, but as an example, if a user with visual impairments is typing in in a search field, the screen reader should start reading suggestions whenever it has finished echoing the last key the user has pressed. Automatic updates are only ever viewed the minority of the time, regardless of how big they are or how long they last. For this reason, presenting them should not be a priority. The fact that they are fixated some of the time means they are not completely ignored by users, however, and there may be times when they are interesting or useful. For this reason, 13 Not all users with visual impairments use a mouse (although many do with the ZoomText screen reader), but screen readers such as JAWS have a hover keystroke function instead
Tailored presentation of dynamic Web content for audio browsers.
 Tailored presentation of dynamic Web content for audio browsers. Andy Brown a,, Caroline Jay a, Simon Harper a a School of Computer Science, University of Manchester, Kilburn Building, Oxford Road, Manchester.
Frequently Asked Questions for the USA TODAY e-newspaper
 Frequently Asked Questions for the USA TODAY e-newspaper Navigating the USA TODAY e-newspaper A look at the toolbar Toolbar Functions, Buttons, and Descriptions The tab marked Contents will take the e-reader
A) What Web Browser do I need? B) Why I cannot view the most updated content? C) What can we find on the school website? Index Page Layout:
 What Web Browser do I need? B) Why I cannot view the most updated content? C) What can we find on the school website? Index Page Layout:") A) What Web Browser do I need? - Window 7 / Window 8.1 => Internet Explorer Version 9 or above (Best in Version 11+) Download Link: http://windows.microsoft.com/zh-hk/internet-explorer/download-ie - Window
A) What Web Browser do I need? - Window 7 / Window 8.1 => Internet Explorer Version 9 or above (Best in Version 11+) Download Link: http://windows.microsoft.com/zh-hk/internet-explorer/download-ie - Window
UNIVERSITY OF CALGARY Information Technologies WEBFORMS DRUPAL 7 WEB CONTENT MANAGEMENT
 UNIVERSITY OF CALGARY Information Technologies WEBFORMS DRUPAL 7 WEB CONTENT MANAGEMENT Table of Contents Creating a Webform First Steps... 1 Form Components... 2 Component Types.......4 Conditionals...
GAZETRACKERrM: SOFTWARE DESIGNED TO FACILITATE EYE MOVEMENT ANALYSIS
 GAZETRACKERrM: SOFTWARE DESIGNED TO FACILITATE EYE MOVEMENT ANALYSIS Chris kankford Dept. of Systems Engineering Olsson Hall, University of Virginia Charlottesville, VA 22903 804-296-3846 cpl2b@virginia.edu
User Manual for Web. Help Desk Authority 9.0
 User Manual for Web Help Desk Authority 9.0 2011ScriptLogic Corporation ALL RIGHTS RESERVED. ScriptLogic, the ScriptLogic logo and Point,Click,Done! are trademarks and registered trademarks of ScriptLogic
Google Analytics Basics
 Google Analytics Basics Contents Google Analytics: An Introduction...3 Google Analytics Features... 3 Google Analytics Interface... Changing the Date Range... 8 Graphs... 9 Put Stats into Context... 10
Presentation Reporting Quick Start
 Presentation Reporting Quick Start Topic 50430 Presentation Reporting Quick Start Websense Web Security Solutions Updated 19-Sep-2013 Applies to: Web Filter, Web Security, Web Security Gateway, and Web
Infoview XIR3. User Guide. 1 of 20
 Infoview XIR3 User Guide 1 of 20 1. WHAT IS INFOVIEW?...3 2. LOGGING IN TO INFOVIEW...4 3. NAVIGATING THE INFOVIEW ENVIRONMENT...5 3.1. Home Page... 5 3.2. The Header Panel... 5 3.3. Workspace Panel...
NewsEdge.com User Guide
 NewsEdge.com User Guide November 2013 Table of Contents Accessing NewsEdge.com... 5 NewsEdge.com: Front Page... 6 Saved Search View... 7 Free Text Search Box... 7 Company Watchlist... 9 Weather...12 NewsEdge.com:
The Portal. Quick Start Guide
 The Portal Quick Start Guide Quick Start Guide The Portal Confidential to CoreLogic The recipient of this document agrees that at all times and notwithstanding any other agreement or understanding, it
Creating a website using Voice: Beginners Course. Participant course notes
 Creating a website using Voice: Beginners Course Topic Page number Introduction to Voice 2 Logging onto your website and setting passwords 4 Moving around your site 5 Adding and editing text 7 Adding an
MEDIAplus administration interface
 MEDIAplus administration interface 1. MEDIAplus administration interface... 5 2. Basics of MEDIAplus administration... 8 2.1. Domains and administrators... 8 2.2. Programmes, modules and topics... 10 2.3.
InfoView User s Guide. BusinessObjects Enterprise XI Release 2
 BusinessObjects Enterprise XI Release 2 InfoView User s Guide BusinessObjects Enterprise XI Release 2 Patents Trademarks Copyright Third-party contributors Business Objects owns the following U.S. patents,
EXPRESSPATH PROVIDER PORTAL USER GUIDE AUGUST 2013
 EXPRESSPATH PROVIDER PORTAL USER GUIDE AUGUST 2013 2013-2020 Express Scripts, Inc. All rights reserved. No part of this publication may be reproduced or transmitted in any form or by any means, electronic
VALUE LINE INVESTMENT SURVEY ONLINE USER S GUIDE VALUE LINE INVESTMENT SURVEY ONLINE. User s Guide
 VALUE LINE INVESTMENT SURVEY ONLINE User s Guide Welcome to Value Line Investment Survey Online. This user guide will show you everything you need to know to access and utilize the wealth of information
Course Exercises for the Content Management System. Grazyna Whalley, Laurence Cornford June 2014 AP-CMS2.0. University of Sheffield
 Course Exercises for the Content Management System. Grazyna Whalley, Laurence Cornford June 2014 AP-CMS2.0 University of Sheffield PART 1 1.1 Getting Started 1. Log on to the computer with your usual username
Hosted VoIP Phone System. Admin Portal User Guide for. Call Center Administration
 Hosted VoIP Phone System Admin Portal User Guide for Call Center Administration Contents Table of Figures... 4 1 About this Guide... 6 2 Accessing the Hosted VoIP Phone System Administration Portal...
Writer Guide. Chapter 15 Using Forms in Writer
 Writer Guide Chapter 15 Using Forms in Writer Copyright This document is Copyright 2005 2008 by its contributors as listed in the section titled Authors. You may distribute it and/or modify it under the
Value Line Investment Survey Online
 Value Line Investment Survey Online User s Guide Welcome to Value Line Investment Survey Online. This user guide will show you everything you need to know to access and utilize the wealth of information
Chapter 15 Using Forms in Writer
 Writer Guide Chapter 15 Using Forms in Writer OpenOffice.org Copyright This document is Copyright 2005 2006 by its contributors as listed in the section titled Authors. You can distribute it and/or modify
Triggers & Actions 10
 Triggers & Actions 10 CHAPTER Introduction Triggers and actions are the building blocks that you can use to create interactivity and custom features. Once you understand how these building blocks work,
Webmail Instruction Guide
 Webmail Instruction Guide This document is setup to guide your through the use of the many features of our Webmail system. You may either visit www.safeaccess.com or webmail.safeaccess.com to login with
Email access via the Internet. Outlook Web Access
 Email access via the Internet Outlook Web Access SiX Document Title/ Search Keyword(s): Email access via the Internet Outlook Web Access Service Group: E-Learning & Information Management Contact Details:
Chapter 14: Links. Types of Links. 1 Chapter 14: Links
 1 Unlike a word processor, the pages that you create for a website do not really have any order. You can create as many pages as you like, in any order that you like. The way your website is arranged and
BusinessObjects Enterprise InfoView User's Guide
 BusinessObjects Enterprise InfoView User's Guide BusinessObjects Enterprise XI 3.1 Copyright 2009 SAP BusinessObjects. All rights reserved. SAP BusinessObjects and its logos, BusinessObjects, Crystal Reports,
SolarTrak Users Guide GPS Satellites
 SolarTrak Users Guide GPS Satellites Your PC or Smartphone How SolarTrak Works 1. GPS signal received from the Satellite Cell Tower SolarTrak Tracker installed on Equipment 2. Communication is established
New! Internet Courses
 Banner Blindness: Web Searchers Often Miss "Obvious" Links Jan Panero Benway David M. Lane Rice University Houston, Texas Suppose you are designing a web page where one particular link among many is likely
SCC Online Web Edition
 THE SUREST WAY TO LEGAL RESEARCH SCC Online Web Edition User Guide Welcome to SCC Online Make your legal research easier, quicker, and more effective Thank you for choosing SCC Online Web Edition as your
Search help. More on Office.com: images templates
 Page 1 of 14 Access 2010 Home > Access 2010 Help and How-to > Getting started Search help More on Office.com: images templates Access 2010: database tasks Here are some basic database tasks that you can
Outlook 2013 Tips and Tricks Contents
 Outlook 2013 Tips and Tricks Contents 1. Keyboard shortcuts... 2 2. Navigate the Folders Via Shortcut Keys... 2 3. Sort and Find a Message from a Specific Person at High Speed... 3 4. Edit Subject Text...
SONA SYSTEMS RESEARCHER DOCUMENTATION
 SONA SYSTEMS RESEARCHER DOCUMENTATION Introduction Sona Systems is used for the scheduling and management of research participants and the studies they participate in. Participants, researchers, principal
Using the SimNet Course Manager
 Using the SimNet Course Manager Using the SimNet Course Manager Contents Overview...3 Requirements...3 Navigation...3 Action Menus...3 Sorting Lists...4 Expanding and Collapsing Sections...4 Instructor
Module One: Getting Started... 6. Opening Outlook... 6. Setting Up Outlook for the First Time... 7. Understanding the Interface...
 2 CONTENTS Module One: Getting Started... 6 Opening Outlook... 6 Setting Up Outlook for the First Time... 7 Understanding the Interface...12 Using Backstage View...14 Viewing Your Inbox...15 Closing Outlook...17
Call Logging Quick Reference User Guide
 Call Logging provides companywide call records, comparison and analytical tools for tracking and improving the efficiency and effectiveness of business communications. An intuitive, feature rich interface
WCAG 2.0 Checklist. Perceivable Web content is made available to the senses - sight, hearing, and/or touch. Recommendations
 WCAG 2.0 Checklist Perceivable Web content is made available to the senses - sight, hearing, and/or touch Guideline 1.1 Text Alternatives: Provide text alternatives for any non-text content Success Criteria
JOOMLA 2.5 MANUAL WEBSITEDESIGN.CO.ZA
 JOOMLA 2.5 MANUAL WEBSITEDESIGN.CO.ZA All information presented in the document has been acquired from http://docs.joomla.org to assist you with your website 1 JOOMLA 2.5 MANUAL WEBSITEDESIGN.CO.ZA BACK
Intellect Platform - The Workflow Engine Basic HelpDesk Troubleticket System - A102
 Intellect Platform - The Workflow Engine Basic HelpDesk Troubleticket System - A102 Interneer, Inc. Updated on 2/22/2012 Created by Erika Keresztyen Fahey 2 Workflow - A102 - Basic HelpDesk Ticketing System
Guidelines for Using the Retrospective Think Aloud Protocol with Eye Tracking
 Guidelines for Using the Retrospective Think Aloud Protocol with Eye Tracking September, 2009 Short paper by Tobii Technology Not sure of how to design your eye tracking study? This document aims to provide
SAS BI Dashboard 4.3. User's Guide. SAS Documentation
 SAS BI Dashboard 4.3 User's Guide SAS Documentation The correct bibliographic citation for this manual is as follows: SAS Institute Inc. 2010. SAS BI Dashboard 4.3: User s Guide. Cary, NC: SAS Institute
General Product Questions... 3. Q. What is the Bell Personal Vault Vault?...4. Q. What is Bell Personal Vault Backup Manager?...4
 Frequently Asked Questions to be posted at: /faqs/ Table of Contents General Product Questions... 3 Q. What is the Bell Personal Vault Vault?...4 Q. What is Bell Personal Vault Backup Manager?...4 Q. What
WebFOCUS BI Portal: S.I.M.P.L.E. as can be
 WebFOCUS BI Portal: S.I.M.P.L.E. as can be Author: Matthew Lerner Company: Information Builders Presentation Abstract: This hands-on session will introduce attendees to the new WebFOCUS BI Portal. We will
Best Practice in Web Design
 Best Practice in Web Design Irrespective of whether you are intending to use a flat 'brochureware' website or an interactive e- commerce site, the overall look and feel of your website will play an important
Digital Cable TV. User Guide
 Digital Cable TV User Guide T a b l e o f C o n T e n T s DVR and Set-Top Box Basics............... 2 Remote Playback Controls................ 4 What s on TV.......................... 6 Using the OK Button..................
13 Managing Devices. Your computer is an assembly of many components from different manufacturers. LESSON OBJECTIVES
 LESSON 13 Managing Devices OBJECTIVES After completing this lesson, you will be able to: 1. Open System Properties. 2. Use Device Manager. 3. Understand hardware profiles. 4. Set performance options. Estimated
WebEx Meeting Center User's Guide
 WebEx Meeting Center User's Guide Table of Contents Accessing WebEx... 3 Choosing the scheduler that works for you... 6 About the Quick Scheduler Page... 6 About the Advanced Scheduler... 8 Editing a scheduled
The Intelligence Engine.
 The Intelligence Engine. Simple Search Simple Search offers a straightforward approach to searching, allowing you to target by source or date for high-quality relevant results. Key Word Searching Use the
Chronicle USER MANUAL
 Chronicle USER MANUAL 1st Edition 2 IN THIS MANUAL Part One The Chronicle Interface The Overview Screen The Bill Detail Screen Part Two Creating, Editing and Viewing Bills Creating Your First Bill Editing
ADOBE ACROBAT CONNECT PRO MOBILE VISUAL QUICK START GUIDE
 ADOBE ACROBAT CONNECT PRO MOBILE VISUAL QUICK START GUIDE GETTING STARTED WITH ADOBE ACROBAT CONNECT PRO MOBILE FOR IPHONE AND IPOD TOUCH Overview Attend Acrobat Connect Pro meetings using your iphone
Easy Manage Helpdesk Guide version 5.4
 Easy Manage Helpdesk Guide version 5.4 Restricted Rights Legend COPYRIGHT Copyright 2011 by EZManage B.V. All rights reserved. No part of this publication or software may be reproduced, transmitted, stored
WebEx Meeting Center User Guide
 WebEx Meeting Center User Guide For Hosts, Presenters, and Attendees 8.17 Copyright 1997 2010 Cisco and/or its affiliates. All rights reserved. WEBEX, CISCO, Cisco WebEx, the CISCO logo, and the Cisco
Finance Reporting. Millennium FAST. User Guide Version 4.0. Memorial University of Newfoundland. September 2013
 Millennium FAST Finance Reporting Memorial University of Newfoundland September 2013 User Guide Version 4.0 FAST Finance User Guide Page i Contents Introducing FAST Finance Reporting 4.0... 2 What is FAST
Online Testing Engine
 Online Testing Engine Table of Contents Considerations...2 Minimum System Rquirements...3 School Test Leaders... 4 Teachers Administering Tests...5 Online Testing Functionality...7 Online Data Entry for
PORTAL ADMINISTRATION
 1 Portal Administration User s Guide PORTAL ADMINISTRATION GUIDE Page 1 2 Portal Administration User s Guide Table of Contents Introduction...5 Core Portal Framework Concepts...5 Key Items...5 Layouts...5
Using Outlook 2010 for Email
 Using Outlook 2010 for Email Workbook Edition 1 June 2013 Document Reference: 3774 Contents Using Outlook 2010 for Email 1. Introduction Microsoft Outlook... 1 Outlook Basics... 1 2. The Ribbon Mail, Contacts
Making Your Computer Work for You Tips for Windows 7, Laptops, Internet Explorer, MS Office and Adobe Acrobat
 Making Your Computer Work for You Tips for Windows 7, Laptops, Internet Explorer, MS Office and Adobe Acrobat By Drew Kottke Bureau of Technical Services Division of Transportation Systems Development
Table of Contents. Creating a Newsletter. Loading a Video or Slideshow. Distributing a Newsletter through Exact Target
 Indiana University Copenhagen Publishing System University Communications Newsletter User Manual Last Updated: March 1, 2009 vpurit@indiana.edu Table of Contents Creating a Newsletter Loading a Video or
BusinessObjects: General Report Writing for Version 5
 BusinessObjects: General Report Writing for Version 5 Contents 1 INTRODUCTION...3 1.1 PURPOSE OF COURSE...3 1.2 LEVEL OF EXPERIENCE REQUIRED...3 1.3 TERMINOLOGY...3 1.3.1 Universes...3 1.3.2 Objects...4
AJAX: Highly Interactive Web Applications. Jason Giglio. jgiglio@netmar.com
 AJAX 1 Running head: AJAX AJAX: Highly Interactive Web Applications Jason Giglio jgiglio@netmar.com AJAX 2 Abstract AJAX stands for Asynchronous JavaScript and XML. AJAX has recently been gaining attention
Microsoft Outlook 2010. Reference Guide for Lotus Notes Users
 Microsoft Outlook 2010 Reference Guide for Lotus Notes Users ContentsWelcome to Office Outlook 2010... 2 Mail... 3 Viewing Messages... 4 Working with Messages... 7 Responding to Messages... 11 Organizing
Mac Built-in Accessibility (10.7 - Lion) - Quick Start Guide
 - Quick Start Guide") Mac Built-in Accessibility (10.7 - Lion) - Quick Start Guide Overview The Mac operating system has many helpful features to help users with a wide range of abilities access their computer. This Quickstart
Mac Built-in Accessibility (10.7 - Lion) - Quick Start Guide Overview The Mac operating system has many helpful features to help users with a wide range of abilities access their computer. This Quickstart
ithenticate User Manual
 ithenticate User Manual Version: 2.0.2 Updated March 16, 2012 Contents Introduction 4 New Users 4 Logging In 4 Resetting Your Password 5 Changing Your Password or Username 6 The ithenticate Account Homepage
Your No-Nonsense Guide to Facebook Ads
 Your No-Nonsense Guide to Facebook Ads If you are in business, Facebook can play an important role in your marketing your business. It helps you connect and build relationships through updated posts. In
WIX: Building a Website with a Template. Choosing a Template First you will need to choose a template from the Create section of the Wix website.
 WIX: Building a Website with a Template Choosing a Template First you will need to choose a template from the Create section of the Wix website. To choose a template: 1. Go to wix.com. 2. From the top
TxDMV RTS Training Guide for Working with Cognos Reports
 TxDMV RTS Training Guide for Working with Cognos Reports April, 2015 About This Guide This Training Guide introduces the implementation of the Cognos enterprise reporting tool for the TxDMV Registration
Rochester Institute of Technology. Finance and Administration. Drupal 7 Training Documentation
 Rochester Institute of Technology Finance and Administration Drupal 7 Training Documentation Written by: Enterprise Web Applications Team CONTENTS Workflow... 4 Example of how the workflow works... 4 Login
Chapter 9 Slide Shows
 Impress Guide Chapter 9 Slide Shows Transitions, animations, and more Copyright This document is Copyright 2007 2013 by its contributors as listed below. You may distribute it and/or modify it under the
Set up your first free website
 How to Set up your first free website There are many websites available across the web that allow you to create a whole website for free, without any knowledge of scripts or coding. Think that sounds too
Outlook Tips & Tricks. Training For Current & New Employees
 Outlook Tips & Tricks Training For Current & New Employees The workshop will help build the necessary skills needed to begin using Microsoft Outlook 2010. The participant will learn how to create e-mail
Web Mail Guide... Error! Bookmark not defined. 1 Introduction to Web Mail... 4. 2 Your Web Mail Home Page... 5. 3 Using the Inbox...
 Powered by Table of Contents Web Mail Guide... Error! Bookmark not defined. 1 Introduction to Web Mail... 4 1.1 Requirements... 4 1.2 Recommendations for using Web Mail... 4 1.3 Accessing your Web Mail...
ELOQUA INSIGHT Reporter User Guide
 ELOQUA INSIGHT Reporter User Guide Copyright 2012 Eloqua Corporation. All rights reserved. July 2012 revision. Table of Contents Preface... 5 Introduction toeloqua Insight Business Intelligence... 6 Introduction
Common Online Advertising Terms Provided by ZEDO, Inc.
 3rd Party Ad Tag 3rd Party Redirect Action Action Tracking Tag Activity Ad Dimension Ad Hoc Report Ad Network Ad Tag Advanced Report Advertiser Advertiser Summary Report Advertiser Type Allocate per Ad
Lync 2013 Quick Reference Lync Meetings. Join a Lync Meeting. Schedule a Lync Meeting. Do I need a PIN, work number or extension? Set meeting options
 Join a Lync Meeting 1. In the meeting request, click Join Lync Meeting or click Join Online in the meeting reminder. 2. On the Join Meeting Audio window, select one of the options: Use Lync (full audio
User Guide. Chapter 6. Teacher Pages
 User Guide Chapter 6 s Table of Contents 1. Introduction... 4 I. Enhancements... 5 II. Tips... 6 2. Key Information... 7 3. How to Add a... 8 4. How to Edit... 10 I. SharpSchool s WYSIWYG Editor... 11
Appspace 5.X Reference Guide (Digital Signage) Updated on February 9, 2015
 Updated on February 9, 2015") Appspace 5.X Reference Guide (Digital Signage) Updated on February 9, 2015 1 TABLE OF CONTENTS 2 What is Appspace For Digital Signage... 4 3 Access Appspace... 4 4 Best Practices and Notes... 4 5 Appspace
Appspace 5.X Reference Guide (Digital Signage) Updated on February 9, 2015 1 TABLE OF CONTENTS 2 What is Appspace For Digital Signage... 4 3 Access Appspace... 4 4 Best Practices and Notes... 4 5 Appspace
Totally Internet Based Software. Getting Started. Strategy Systems, Inc. PO Box 2136 Rogers, AR 72757 (479) 271-7400
 271-7400") Totally Internet Based Software Getting Started Strategy Systems, Inc. PO Box 2136 Rogers, AR 72757 (479) 271-7400 System Requirements... 1 User Login... 1 Basic Navigation... 2 Hover Menus... 2 Dropdown
Totally Internet Based Software Getting Started Strategy Systems, Inc. PO Box 2136 Rogers, AR 72757 (479) 271-7400 System Requirements... 1 User Login... 1 Basic Navigation... 2 Hover Menus... 2 Dropdown
Magenta CMS Training: RAF Station/ RAF Sport websites
 Magenta CMS Training: RAF Station/ RAF Sport websites ktownsend@binaryvision.com 0207 490 1010 Introduction What is a website content management system? The content management system, or CMS, is software
Computing and Communications Services (CCS) - LimeSurvey Quick Start Guide Version 2.2 1
 - LimeSurvey Quick Start Guide Version 2.2 1") LimeSurvey Quick Start Guide: Version 2.2 Computing and Communications Services (CCS) - LimeSurvey Quick Start Guide Version 2.2 1 Table of Contents Contents Table of Contents... 2 Introduction:... 3 1.
LimeSurvey Quick Start Guide: Version 2.2 Computing and Communications Services (CCS) - LimeSurvey Quick Start Guide Version 2.2 1 Table of Contents Contents Table of Contents... 2 Introduction:... 3 1.
INTRODUCTION... 4 1. PARKING REPORTING: OVERVIEW... 5 2. PARKING REPORTING: STATISTICS... 6 3. MY DOMAINS: PARKING OPTIMIZATIONS...
 PARKING MANUAL 2 Table of contents INTRODUCTION... 4 1. PARKING REPORTING: OVERVIEW... 5 1.1. FUNCTIONS AND ACCESS... 5 2. PARKING REPORTING: STATISTICS... 6 2.1. QUICK VIEWS... 7 2.2. PERFORM A BASIC
Sage CRM. 7.2 Mobile Guide
 Sage CRM 7.2 Mobile Guide Copyright 2013 Sage Technologies Limited, publisher of this work. All rights reserved. No part of this documentation may be copied, photocopied, reproduced, translated, microfilmed,
Sending Email on Blue Hornet
 Sending Email on Blue Hornet STEP 1 Gathering Your Data A. For existing data from Advance or Outlook, pull email address, first name, last name, and any other variable data you would like to use in the
How To Create A Campaign On Facebook.Com
 Seriously powerful email marketing, made easy Table of Contents DOTMAILER QUICK START GUIDE... 3 Main Screen... 4 Getting Started... 6 STEP 1: CAMPAIGN SETTINGS... 7 STEP 2: CAMPAIGN CONTENT... 8 Editing
CREATING YOUR ONLINE PRESENCE
 CREATING YOUR ONLINE PRESENCE Congratulations on signing up for your webhosting package, you ve just completed the first and most important step in establishing your online presence. There are just a few
Acrobat 9: Forms. 56 Pages. Acrobat 9: Forms v2.0.0. Windows
 Acrobat 9: Forms Windows Acrobat 9: Forms v2.0.0 2009 56 Pages About IT Training & Education The University Information Technology Services (UITS) IT Training & Education program at Indiana University
User Guide Package Exception Management
 User Guide Package Exception Management 70-3262-4.6 PRECISION Applications 2012 September 2012 2012 Precision Software, a division of QAD Inc. Precision Software products are copyrighted and all rights
Payco, Inc. Evolution and Employee Portal. Payco Services, Inc.., 2013. 1 Home
 Payco, Inc. Evolution and Employee Portal Payco Services, Inc.., 2013 1 Table of Contents Payco Services, Inc.., 2013 Table of Contents Installing Evolution... 4 Commonly Used Buttons... 5 Employee Information...
How To Write A Cq5 Authoring Manual On An Ubuntu Cq 5.2.2 (Windows) (Windows 5) (Mac) (Apple) (Amd) (Powerbook) (Html) (Web) (Font
 (Windows 5) (Mac) (Apple) (Amd) (Powerbook) (Html) (Web) (Font") Adobe CQ5 Authoring Basics Print Manual SFU s Content Management System SFU IT Services CMS Team ABSTRACT A summary of CQ5 Authoring Basics including: Setup and Login, CQ Interface Tour, Versioning, Uploading
Adobe CQ5 Authoring Basics Print Manual SFU s Content Management System SFU IT Services CMS Team ABSTRACT A summary of CQ5 Authoring Basics including: Setup and Login, CQ Interface Tour, Versioning, Uploading
Avigilon Control Center Web Client User Guide
 Avigilon Control Center Web Client User Guide Version: 4.12 Enterprise OLH-WEBCLIENT-E-E-Rev2 Copyright 2013 Avigilon. All rights reserved. The information presented is subject to change without notice.
Chapter 15: Forms. User Guide. 1 P a g e
 User Guide Chapter 15 Forms Engine 1 P a g e Table of Contents Introduction... 3 Form Building Basics... 4 1) About Form Templates... 4 2) About Form Instances... 4 Key Information... 4 Accessing the Form
How to Develop Accessible Linux Applications
 Sharon Snider Copyright 2002 by IBM Corporation v1.1, 2002 05 03 Revision History Revision v1.1 2002 05 03 Revised by: sds Converted to DocBook XML and updated broken links. Revision v1.0 2002 01 28 Revised
INTRODUCTION TO THE WEB
 INTRODUCTION TO THE WEB A beginner s guide to understanding and using the web 3 September 2013 Version 1.2 Contents Contents 2 Introduction 3 Skill Level 3 Terminology 3 Video Tutorials 3 How Does the
Click a topic in the Table of Contents to jump to a topic and use Ctrl + Home to return to this page.
 Table of Contents Click a topic in the Table of Contents to jump to a topic and use Ctrl + Home to return to this page. RECRUITING WORKFLOW... 1 CREATE JOB OPENING... 2 TEMPORARY JOB OPENING... 2 POSITION
Hosted Thin Receptionist R20. Document Date: 11/06/14 Document Version: 1.0d 1-800-942-4700 masergy.com
 Hosted Thin Receptionist R20 Document Date: 11/06/14 Document Version: 1.0d Manage Calls Dial Contact 1. In the Contacts pane, click the target directory tab. 2. Click the contact and then click CALL
SmallBiz Dynamic Theme User Guide
 SmallBiz Dynamic Theme User Guide Table of Contents Introduction... 3 Create Your Website in Just 5 Minutes... 3 Before Your Installation Begins... 4 Installing the Small Biz Theme... 4 Customizing the
Paper 10-27 Designing Web Applications: Lessons from SAS User Interface Analysts Todd Barlow, SAS Institute Inc., Cary, NC
 Paper 10-27 Designing Web Applications: Lessons from SAS User Interface Analysts Todd Barlow, SAS Institute Inc., Cary, NC ABSTRACT Web application user interfaces combine aspects of non-web GUI design
EMC ViPR SRM. Alerting Guide. Version 3.7.1.0 302-002-455 01
 EMC ViPR SRM Version 3.7.1.0 Alerting Guide 302-002-455 01 Copyright 2015-2016 EMC Corporation. All rights reserved. Published in the USA. Published February, 2016 EMC believes the information in this
BreezingForms Guide. 18 Forms: BreezingForms
 BreezingForms 8/3/2009 1 BreezingForms Guide GOOGLE TRANSLATE FROM: http://openbook.galileocomputing.de/joomla15/jooml a_18_formulare_neu_001.htm#t2t32 18.1 BreezingForms 18.1.1 Installation and configuration
Nonprofit Technology Collaboration. Web Analytics
 Web Analytics Contents What is Web Analytics?... 2 Why is Web Analytics Important?... 2 Google Analytics... 3 Using Major Metrics in Google Analytics... 6 Traffic Sources... 6 Visitor Loyalty... 9 Top
Creating Interactive PDF Forms
 Creating Interactive PDF Forms Using Adobe Acrobat X Pro Information Technology Services Outreach and Distance Learning Technologies Copyright 2012 KSU Department of Information Technology Services This
Voluntary Product Accessibility Template Blackboard Learn Release 9.1 April 2014 (Published April 30, 2014)
") Voluntary Product Accessibility Template Blackboard Learn Release 9.1 April 2014 (Published April 30, 2014) Contents: Introduction Key Improvements VPAT Section 1194.21: Software Applications and Operating
Voluntary Product Accessibility Template Blackboard Learn Release 9.1 April 2014 (Published April 30, 2014) Contents: Introduction Key Improvements VPAT Section 1194.21: Software Applications and Operating