Context selection for volume forecast
|
|
|
- Evelyn Nash
- 8 years ago
- Views:
Transcription
1 Prediction of time series and non stationary time series, 10 february 2012 Context selection for volume forecast The influence of news on traded volume Nathanaël Mayo

2 Outlook 1 Events Definition Combining events Notations 2 Descriptive approach with factor models 3 Traded volumes forecast State of the art How to evaluate performance? 4 Ranking procedure and forecast Algorithm Results 5 Multivariate perspective

3 Outlook 1 Events Definition Combining events Notations 2 Descriptive approach with factor models 3 Traded volumes forecast State of the art How to evaluate performance? 4 Ranking procedure and forecast Algorithm Results 5 Multivariate perspective


4 Definition News and events News definition Macroeconomic number publication and special market conditions Context list, from 03.Jan.2007 to 29.Jun Total= 1274 observations Goals Study the strong heterogeneity of volume profiles when event occur Select prevalent contexts amongst rare events with important cooccurence Notations for news e k j : indicatrix variable of news k on day j e j = (e 1 j,..., ek j ) : set of news We only use the indicatrix variable of news occurrences We do not use time of publication or published information

5 Definition Exemple of volume curves

6 Definition Contextualization of location model Location model Usual setting to forecast iid data X j Location parameter θ : X j = θ + ɛ j Using external information in forecast Conditionnal location model X j = θ(e j ) + ɛ j θ(e) is the best theoretical forecast when e j = e occurs θ(e) is the average of X when e j = e occurs, and could be estimated as such The full contextualization is irrelevant in practice Most general case : e j = (e 1 j,..., e K j ) Every combination of news can be a context Huge parameter set (2 K dim(θ)) Most combinations (e 1,..., e K ) are never or rarely observed We need constrain e θ
 Every combination of news can be a context Huge parameter set (2 K dim(θ)) Most combinations (e 1,.")
7 Combining events Constraining θ Mixing : All occuring news have an impact Events have mixed impacts when they occur simultaneously θ(e j ) = mean k Nj (θ(ej k )) (average over contexts occuring today) Impacts decrease with number of events N j = k ek j Estimation of θ(e k ) is based on the full sample of rawdata (all occurrences of e k ) Equivalent to linear regression model of X j on 1 N j e k j Multicolinearity due to cooccurence effect Ranking : Some news mask other There is one prevailing event amongst occuring contexts θ(e j ) = θ(ej k ) (k is the prevailing context occuring today) Prevailance can be defined using rankings : e k < e k if rank(e k ) < rank(e k ) Leads to successive orthogonalization of contexts O(e k ) = 1 e k = 1 and e k = 0 for better news (e k < e k ) Multicolinearity is partly adressed with orthogonalization Estimation of θ(e k ) is based on a robust subsample
 < rank(e k ) Leads to successive orthogonalization of contexts O(e k ) = 1 e k = 1 and e k = 0 for better news (e k < e k )")
![Notations Notations Indexing variables j = 1,..., J days (most often implicit) t [0, T ] time of the day (possibly binned : t = 1,.](/docs-images/29/13713015/images/8-0.png ".., T ) Volume V t,j : volume process (cumulated traded volume up to time t on day j) V T,j : daily volume v t,j = V t,j V T,j : relative volume process (intraday repartition, grows from 0 to 1) X")
8 Notations Notations Indexing variables j = 1,..., J days (most often implicit) t [0, T ] time of the day (possibly binned : t = 1,..., T ) Volume V t,j : volume process (cumulated traded volume up to time t on day j) V T,j : daily volume v t,j = V t,j V T,j : relative volume process (intraday repartition, grows from 0 to 1) X T,j = V t,j : instantaneous volume x T,j = v t,j : instantaneous relative volume Price Market price P t,j, volatility σ t,j ω t,j : Volume Weighted Average Price (VWAP) Forecast : Z : realized random variable Z f : forecast value
 Forecast : Z : realized random variable Z f :")
9 Outlook 1 Events Definition Combining events Notations 2 Descriptive approach with factor models 3 Traded volumes forecast State of the art How to evaluate performance? 4 Ranking procedure and forecast Algorithm Results 5 Multivariate perspective

10 Principle 1 Estimate extreme volume profiles Non-negative Matrix Factorization is fitted to positive data x Extract generating vertices of a cone. Matrix low-rank decomposition x F.B = p F p B p Positive factors F = (F 1,..., F P ) and positive weights B = (B 1,..., B P ) L 1 distance to obtain sparse representations Arbitrary extract 10 factors Normalize B p to 1 extreme volume profiles 2 Match factors expression with news Matching between factor F p and event e k m p,k := 1 E[F p ] E[F p e k = 1] For readability reason, we plot min(m p,k, 2.0)

 Factors usually located where variance is higher (NMF depends on")
11 NMF of volume B 1 : Close effect B 8 : Derivative expiry (12 : 00) B 10 : US Employment Situation (14 : 45) Factors usually located where variance is higher (NMF depends on scale)


12 Matching of news
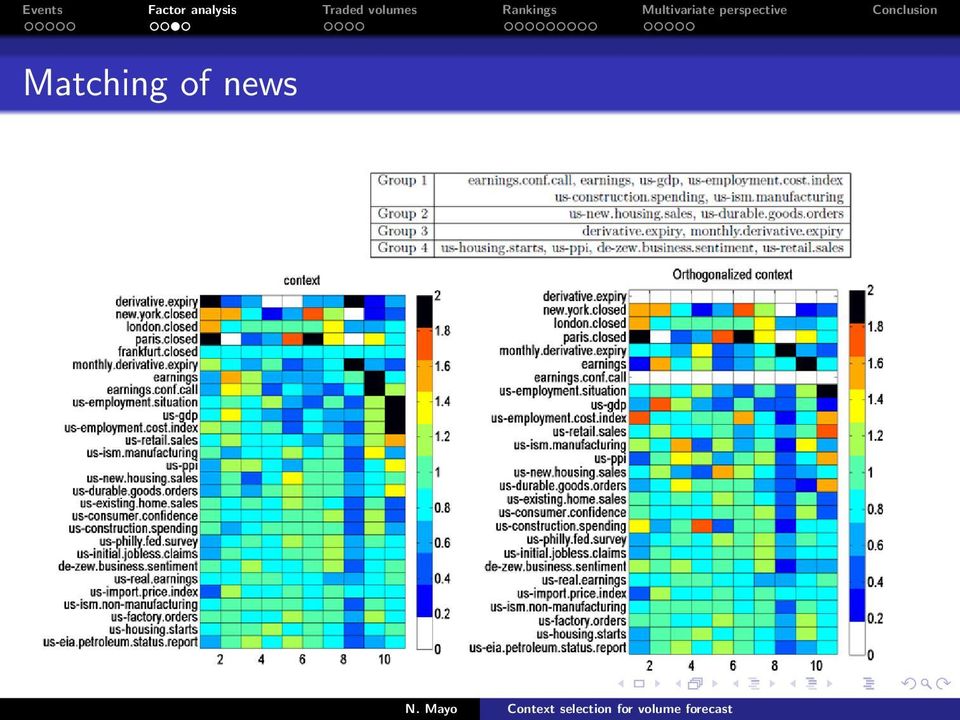
13 Identifiability issues Smart news orthogonalization Full orthogonalization is irrelevant Most news occur simultaneously Not enough observations for news occuring alone Partial orthogonalization procedure Detect cooccurent news clusters with MCA These groups raise acute identifiability issues Orthogonalize news relatively to their cluster only Conclusions Important volume features are caused by events Cooccurences biaises the analysis Some effects appear or disappear when filtering events We use rankings and orthogonalization

14 Outlook 1 Events Definition Combining events Notations 2 Descriptive approach with factor models 3 Traded volumes forecast State of the art How to evaluate performance? 4 Ranking procedure and forecast Algorithm Results 5 Multivariate perspective

15 State of the art Volume forecast, what for? VWAP contracts (Volume Weighted Average Price) The instantaneous volume available for sell or buy is limited, and trading a large quantity at once is costly Solution : dispatch the order through some time period I = [0, T ] VWAP ω = 1 V T T 0 Pt dvt is the usual benchmark P geometric diffusion (e.g GBM) V doubly stochastic point process (e.g Cox) Theoretical objective : VWAP replication (from [1, McCulloch&al,2009] ) [ 1 ] 2 min IE [ω w] 2 = min IE P t (dv t dν ν ν t) 0 Depends only on relative volume v t = Vt V T, adapted in G t = σ(f t, V T ) Projection (G t-adapted process F t-adapted process) risk= IE 1 0 (vt νt)2 d P t ν = IE v t when P V Improving forecast of v t reduces the risk
![order through some time period I = [0, T ] VWAP ω = 1 V T T 0 Pt dvt is the usual benchmark P geometric diffusion (e.g GBM) V doubly stochastic point process (e.](/docs-images/51/13713015/images/page_15.jpg "g Cox) Theoretical objective : VWAP replication (from [1, McCulloch&al,2009] ) [ 1 ] 2 min IE [ω w] 2 = min IE P t (dv t dν ν ν t) 0 Depends only on relative volume v t = Vt V T,")
16 State of the art Volume forecast : state of the art Static forecast Use the historical average of x (i.i.d location model with x and V T independent) Estimation issues : estimator choice, bin size, taking logarithm... Improve forecast using auxiliary information Corr(x t, σ t) impact the optimal profile : ν = IE(Xt σ2 t ) (see [5, Konishi,2008]) IE(σ t 2) Autocorrelations of volumes (Dynamic forecast model) IE((V t,..., V T ) V 1,..., V s) Multistock. Uses strong correlations across stocks volumes to improve forecast ([2, Bialkowsky&al,2008]) Estimation issues in high dimension : filtering covariance matrices [3, Mayo,2010] Events affect usual procedures Creates dependance between x and V T (e.g expiries) Strongly affects autocorrelation. Explains part of stock cross-dependance (most news are shared by all stocks)
 Estimation issues in high dimension : filtering covariance matrices [3, Mayo,2010] Events affect usual")
17 How to evaluate performance? Performance evaluation (1 :usual indicators) Volume forecast quality L 2 = (x t xt f ) 2 dt L 1 = x t xt f dt L KS = sup X t Xt f Operationnal criteria C (VWAP cash slippage) VWAP replication error for an execution spreading over the entire day IE ω j ω f j Absolute value allways on the worst side (buy or sell) Evaluated on 1 min bins C = t (x j,t x f j,t) ω j,t Intrinsic risk R (from [1, McCulloch and al,2009]) Upper bound on IE(ω t ω f t ) 2 under strong assumptions : Independance between P and V No microstructure Best forecast of x is the historical mean R = Var(X t) σ 2 t p 2 t dt For constant volatility, R L 2 distance on volumes
 ω j,t Intrinsic risk R (from [1, McCulloch and al,2009]) Upper bound on IE(ω t ω f t ) 2 under strong assumptions : Independance between P")
18 How to evaluate performance? Performance evaluation (2 :Multiscale slippage) Problems with uniscale C Full sample error= j t (x j,t x f j,t) ω j,t Assumes executions spread over the entire day Involves deviation at timescale > day, and biais at timescale < day Corr(L 2, C) is low Improving volume forecast does not necessarily improves C Usual volume predictors have poor aggregative properties (The median has usually lowest L 2 error, but highest L KS error, while C is aggregated over the day) Solution : multiscale C Involve risk at timescale < day Take absolute values more often Computation : Define C dt as C on a subinterval dt of the day Compute (C k ) for randomly generated subintervals (dt k ) k...k Define multiscale C as a weighted average k w kc k Weights use discretized control variables Z from historical contract values Likely weights regarding time open, time end, duration, use open and use close
 Solution : multiscale C Involve risk at timescale < day Take absolute values more often Computation : Define C dt as C on a")
19 Outlook 1 Events Definition Combining events Notations 2 Descriptive approach with factor models 3 Traded volumes forecast State of the art How to evaluate performance? 4 Ranking procedure and forecast Algorithm Results 5 Multivariate perspective

20 Algorithm Algorithm (1 : learning) 1/ Initial rankings Maximize some distance between x e k = 1 and x e k = 0 Distance between occurrence sample and non occurrence sample Successive minima of φ(x e k = 1, x e k = 0), 2-sample distance function Orthogonalization (remove ranked news from the sample) min φ(x O(e k ) = 1; x e k = 0) Parameters φ : try various 2-sample functions Nb.occurence : remove contexts with too few (orthogonalized) occurrences Threshold : ignore context if φ(x O(e k ) = 1; x e k = 0) threshold bin size : we use 15 min aggregated volume 2 sample function Explanation Formula φ std (x, y) std ratio t std(x t ) t std(y t ) φ mpv (x, y) Single MANOVA pvalue(one-way [H0] : both sample have same mean multivariate analysis of variance) φ pv (x, y) Quantile 10% ANOVA s pv on bin t
 std ratio t std(x t ) t std(y t ) φ mpv (x, y) Single MANOVA pvalue(one-way [H0] : both sample have same mean multivariate analysis of variance) φ pv (x, y) Quantile")
21 Algorithm Algorithm (2 : validation) 2/ Backtest Use jacknife (leave-one-out anticipative backtest) Tries various estimator (mean, median) NB : only estimators are jacknifed, not the full ranking procedure 3/ Inhibition Chaotic contexts := good initial rankings, but poor backtest C Initial rankings use only volumes while C uses price information φ detect only some perturbation of the distribution (time varying event) Inhibition : since θ(e k ) is a poor predictor, use a noncontextual predictor instead Thanks to orthogonalization This does not affect other contexts No need to backtest inhibition (would lead to the same results) Inhibition acts as filtering of extreme news, since occurrences are removed of the following contexts
22 Algorithm Algorithm (3 : Model selection) 4/ Model competition and selection Proceed steps 1 3 for various models Model parameter = (φ, estimator, threshold, nb.occurence) Select the model having lowest operationnal criteria C on the full sample C is computed on 1min bin, using constant rate interpolation 5/ Usual days forecast Usual Days := no ranked context occur Various non anticipative models are backtested using sliding windows Usual day context contains enough observations for classical backtest The best model is selected using lowest C Parameters of usual day forecast models Estimator(mean, median, EWMA, threemean) Historical sample length Removes ranked context occurrences or not
23 Results Exemple of volume curves
24 Results A few volume curves (2)
25 Results Global performance
 Allmost never removes occurences of ranked")
26 Results Selected parameters Figure: Parameters in contexts (top) and in Usual days (bottom) Mostly selects median estimator On short historic length (<50 days) Allmost never removes occurences of ranked news

27 Results Main contexts : rankings

28 Results Performance in contexts
29 Outlook 1 Events Definition Combining events Notations 2 Descriptive approach with factor models 3 Traded volumes forecast State of the art How to evaluate performance? 4 Ranking procedure and forecast Algorithm Results 5 Multivariate perspective
30 Intrinsic risk and illiquidity Intrinsic risk R underevaluates risk by 20% Illiquidity cost Penalize bins where traded volume > available volume on market Minimalistic market impact t (x f t x t) + spread t
31 Clustering NMF factors across stocks
32 Portfolio volume error (15min) L 2 forecast errors are correlated across stocks News and events account for 30% of the correlation over the CAC40
33 Portfolio execution risk (1min) C are correlated across stocks Under normal market condition (contradicts [5, Konishi,2008]) Events have no influence on correlations? Non syncronization biais non treated
34 Conclusion Events Events strongly affect the repartition of traded volume Rankings is a possible solution to identifiability issues (cooccurrences) Theoretical issues Why are volume errors, operationnal risk and intrinsic risk so different? Include microstructure effects Extensions Include events in usual approaches (autocorrelations, multistock) More events smart news orthogonalization in high dimension Real time news Impact on other variables (volatility, price)
35 J.Mc Culloch and V.Kazakov, Optimal VWAP Trading Strategy and Relative Volume, Draft January, J.Bialkowsky, S.Darolles and G.Le Fol : Improving VWAP strategies : A dynamic volume approach, Journal of Banking and Finance, 32, (2008), N.Mayo : Les modèles à variables cachées et leurs applications en Finance : risque systématique, détection d arbitrage et prévision des volumes., Chapter 5, (2010). Available at samm.univ-paris1 J.Mc Culloch : Relative Volume as a Doubly Stochastic Binomial Point Process, (2004). Available at ssrn. H. Konishi : Optimal slice of a VWAP trade, Journal of Banking and Finance, 32, (2008), D.D.Lee and H.S.Seung : Algorithms for Non-negative Matrix Factorization,NIPS (2000). Available at citeseer.
Contents. List of Figures. List of Tables. List of Examples. Preface to Volume IV
 Contents List of Figures List of Tables List of Examples Foreword Preface to Volume IV xiii xvi xxi xxv xxix IV.1 Value at Risk and Other Risk Metrics 1 IV.1.1 Introduction 1 IV.1.2 An Overview of Market
Hedging Illiquid FX Options: An Empirical Analysis of Alternative Hedging Strategies
 Hedging Illiquid FX Options: An Empirical Analysis of Alternative Hedging Strategies Drazen Pesjak Supervised by A.A. Tsvetkov 1, D. Posthuma 2 and S.A. Borovkova 3 MSc. Thesis Finance HONOURS TRACK Quantitative
Java Modules for Time Series Analysis
 Java Modules for Time Series Analysis Agenda Clustering Non-normal distributions Multifactor modeling Implied ratings Time series prediction 1. Clustering + Cluster 1 Synthetic Clustering + Time series
Semi-Markov model for market microstructure and HF trading
 Semi-Markov model for market microstructure and HF trading LPMA, University Paris Diderot and JVN Institute, VNU, Ho-Chi-Minh City NUS-UTokyo Workshop on Quantitative Finance Singapore, 26-27 september
Detecting Network Anomalies. Anant Shah
 Detecting Network Anomalies using Traffic Modeling Anant Shah Anomaly Detection Anomalies are deviations from established behavior In most cases anomalies are indications of problems The science of extracting
Statistics in Retail Finance. Chapter 6: Behavioural models
 Statistics in Retail Finance 1 Overview > So far we have focussed mainly on application scorecards. In this chapter we shall look at behavioural models. We shall cover the following topics:- Behavioural
How to assess the risk of a large portfolio? How to estimate a large covariance matrix?
 Chapter 3 Sparse Portfolio Allocation This chapter touches some practical aspects of portfolio allocation and risk assessment from a large pool of financial assets (e.g. stocks) How to assess the risk
OPTIMIZATION AND FORECASTING WITH FINANCIAL TIME SERIES
 OPTIMIZATION AND FORECASTING WITH FINANCIAL TIME SERIES Allan Din Geneva Research Collaboration Notes from seminar at CERN, June 25, 2002 General scope of GRC research activities Econophysics paradigm
Understanding the Impact of Weights Constraints in Portfolio Theory
 Understanding the Impact of Weights Constraints in Portfolio Theory Thierry Roncalli Research & Development Lyxor Asset Management, Paris thierry.roncalli@lyxor.com January 2010 Abstract In this article,
Target Strategy: a practical application to ETFs and ETCs
 Target Strategy: a practical application to ETFs and ETCs Abstract During the last 20 years, many asset/fund managers proposed different absolute return strategies to gain a positive return in any financial
Financial Market Efficiency and Its Implications
 Financial Market Efficiency: The Efficient Market Hypothesis (EMH) Financial Market Efficiency and Its Implications Financial markets are efficient if current asset prices fully reflect all currently available
Machine Learning in Statistical Arbitrage
 Machine Learning in Statistical Arbitrage Xing Fu, Avinash Patra December 11, 2009 Abstract We apply machine learning methods to obtain an index arbitrage strategy. In particular, we employ linear regression
Hedging Barriers. Liuren Wu. Zicklin School of Business, Baruch College (http://faculty.baruch.cuny.edu/lwu/)
") Hedging Barriers Liuren Wu Zicklin School of Business, Baruch College (http://faculty.baruch.cuny.edu/lwu/) Based on joint work with Peter Carr (Bloomberg) Modeling and Hedging Using FX Options, March
Hedging Barriers Liuren Wu Zicklin School of Business, Baruch College (http://faculty.baruch.cuny.edu/lwu/) Based on joint work with Peter Carr (Bloomberg) Modeling and Hedging Using FX Options, March
VI. Real Business Cycles Models
 VI. Real Business Cycles Models Introduction Business cycle research studies the causes and consequences of the recurrent expansions and contractions in aggregate economic activity that occur in most industrialized
Option Properties. Liuren Wu. Zicklin School of Business, Baruch College. Options Markets. (Hull chapter: 9)
") Option Properties Liuren Wu Zicklin School of Business, Baruch College Options Markets (Hull chapter: 9) Liuren Wu (Baruch) Option Properties Options Markets 1 / 17 Notation c: European call option price.
Option Properties Liuren Wu Zicklin School of Business, Baruch College Options Markets (Hull chapter: 9) Liuren Wu (Baruch) Option Properties Options Markets 1 / 17 Notation c: European call option price.
Online Appendix for Demand for Crash Insurance, Intermediary Constraints, and Risk Premia in Financial Markets
 Online Appendix for Demand for Crash Insurance, Intermediary Constraints, and Risk Premia in Financial Markets Hui Chen Scott Joslin Sophie Ni August 3, 2015 1 An Extension of the Dynamic Model Our model
The Cost of Financial Frictions for Life Insurers
 The Cost of Financial Frictions for Life Insurers Ralph S. J. Koijen Motohiro Yogo University of Chicago and NBER Federal Reserve Bank of Minneapolis 1 1 The views expressed herein are not necessarily
Volatility modeling in financial markets
 Volatility modeling in financial markets Master Thesis Sergiy Ladokhin Supervisors: Dr. Sandjai Bhulai, VU University Amsterdam Brian Doelkahar, Fortis Bank Nederland VU University Amsterdam Faculty of
A Regime-Switching Model for Electricity Spot Prices. Gero Schindlmayr EnBW Trading GmbH g.schindlmayr@enbw.com
 A Regime-Switching Model for Electricity Spot Prices Gero Schindlmayr EnBW Trading GmbH g.schindlmayr@enbw.com May 31, 25 A Regime-Switching Model for Electricity Spot Prices Abstract Electricity markets
Risk and return (1) Class 9 Financial Management, 15.414
 Class 9 Financial Management, 15.414") Risk and return (1) Class 9 Financial Management, 15.414 Today Risk and return Statistics review Introduction to stock price behavior Reading Brealey and Myers, Chapter 7, p. 153 165 Road map Part 1. Valuation
Risk and return (1) Class 9 Financial Management, 15.414 Today Risk and return Statistics review Introduction to stock price behavior Reading Brealey and Myers, Chapter 7, p. 153 165 Road map Part 1. Valuation
Non Linear Dependence Structures: a Copula Opinion Approach in Portfolio Optimization
 Non Linear Dependence Structures: a Copula Opinion Approach in Portfolio Optimization Jean- Damien Villiers ESSEC Business School Master of Sciences in Management Grande Ecole September 2013 1 Non Linear
Overview of Violations of the Basic Assumptions in the Classical Normal Linear Regression Model
 Overview of Violations of the Basic Assumptions in the Classical Normal Linear Regression Model 1 September 004 A. Introduction and assumptions The classical normal linear regression model can be written
Simple Linear Regression Inference
 Simple Linear Regression Inference 1 Inference requirements The Normality assumption of the stochastic term e is needed for inference even if it is not a OLS requirement. Therefore we have: Interpretation
9 Hedging the Risk of an Energy Futures Portfolio UNCORRECTED PROOFS. Carol Alexander 9.1 MAPPING PORTFOLIOS TO CONSTANT MATURITY FUTURES 12 T 1)
") Helyette Geman c0.tex V - 0//0 :00 P.M. Page Hedging the Risk of an Energy Futures Portfolio Carol Alexander This chapter considers a hedging problem for a trader in futures on crude oil, heating oil and
Helyette Geman c0.tex V - 0//0 :00 P.M. Page Hedging the Risk of an Energy Futures Portfolio Carol Alexander This chapter considers a hedging problem for a trader in futures on crude oil, heating oil and
Optimization: Continuous Portfolio Allocation
 Optimization: Continuous Portfolio Allocation Short Examples Series using Risk Simulator For more information please visit: www.realoptionsvaluation.com or contact us at: admin@realoptionsvaluation.com
The Monte Carlo Framework, Examples from Finance and Generating Correlated Random Variables
 Monte Carlo Simulation: IEOR E4703 Fall 2004 c 2004 by Martin Haugh The Monte Carlo Framework, Examples from Finance and Generating Correlated Random Variables 1 The Monte Carlo Framework Suppose we wish
How To Model Volume On A Stock With A Trading Model
 AUTHORS Benjamin Polidore Managing Director Head of Algorithmic Trading benjamin.polidore@itg.com Lin Jiang Assistant Vice President ITG Algorithms lin.jiang@itg.com Yichu Li Analyst ITG Algorithms yichu.li@itg.com
7: The CRR Market Model
 Ben Goldys and Marek Rutkowski School of Mathematics and Statistics University of Sydney MATH3075/3975 Financial Mathematics Semester 2, 2015 Outline We will examine the following issues: 1 The Cox-Ross-Rubinstein
A Simple Model for Intra-day Trading
 A Simple Model for Intra-day Trading Anton Golub 1 1 Marie Curie Fellow, Manchester Business School April 15, 2011 Abstract Since currency market is an OTC market, there is no information about orders,
Measuring downside risk of stock returns with time-dependent volatility (Downside-Risikomessung für Aktien mit zeitabhängigen Volatilitäten)
") Topic 1: Measuring downside risk of stock returns with time-dependent volatility (Downside-Risikomessung für Aktien mit zeitabhängigen Volatilitäten) One of the principal objectives of financial risk management
Topic 1: Measuring downside risk of stock returns with time-dependent volatility (Downside-Risikomessung für Aktien mit zeitabhängigen Volatilitäten) One of the principal objectives of financial risk management
Total Credits: 30 credits are required for master s program graduates and 51 credits for undergraduate program.
 Middle East Technical University Graduate School of Social Sciences Doctor of Philosophy in Business Administration In the Field of Accounting-Finance Aims: The aim of Doctor of Philosphy in Business Administration
DECEMBER 2014 STOXX REFERENCE CALCULATIONS GUIDE
 DECEMBER 2014 STOXX REFERENCE CALCULATIONS GUIDE CONTENTS 2/14 4.3. SECURITY AVERAGE DAILY TRADED VALUE (ADTV) 13 1. INTRODUCTION TO THE STOXX INDEX GUIDES 3 4.4. TURNOVER 13 2. CHANGES TO THE GUIDE BOOK
Risk/Arbitrage Strategies: An Application to Stock Option Portfolio Management
 Risk/Arbitrage Strategies: An Application to Stock Option Portfolio Management Vincenzo Bochicchio, Niklaus Bühlmann, Stephane Junod and Hans-Fredo List Swiss Reinsurance Company Mythenquai 50/60, CH-8022
From Sparse Approximation to Forecast of Intraday Load Curves
 From Sparse Approximation to Forecast of Intraday Load Curves Mathilde Mougeot Joint work with D. Picard, K. Tribouley (P7)& V. Lefieux, L. Teyssier-Maillard (RTE) 1/43 Electrical Consumption Time series
Option Valuation. Chapter 21
 Option Valuation Chapter 21 Intrinsic and Time Value intrinsic value of in-the-money options = the payoff that could be obtained from the immediate exercise of the option for a call option: stock price
Computer Handholders Investment Software Research Paper Series TAILORING ASSET ALLOCATION TO THE INDIVIDUAL INVESTOR
 Computer Handholders Investment Software Research Paper Series TAILORING ASSET ALLOCATION TO THE INDIVIDUAL INVESTOR David N. Nawrocki -- Villanova University ABSTRACT Asset allocation has typically used
Variance Reduction. Pricing American Options. Monte Carlo Option Pricing. Delta and Common Random Numbers
 Variance Reduction The statistical efficiency of Monte Carlo simulation can be measured by the variance of its output If this variance can be lowered without changing the expected value, fewer replications
A Primer on Mathematical Statistics and Univariate Distributions; The Normal Distribution; The GLM with the Normal Distribution
 A Primer on Mathematical Statistics and Univariate Distributions; The Normal Distribution; The GLM with the Normal Distribution PSYC 943 (930): Fundamentals of Multivariate Modeling Lecture 4: September
Forecasting methods applied to engineering management
 Forecasting methods applied to engineering management Áron Szász-Gábor Abstract. This paper presents arguments for the usefulness of a simple forecasting application package for sustaining operational
Market Risk Analysis. Quantitative Methods in Finance. Volume I. The Wiley Finance Series
 Brochure More information from http://www.researchandmarkets.com/reports/2220051/ Market Risk Analysis. Quantitative Methods in Finance. Volume I. The Wiley Finance Series Description: Written by leading
Summary of Formulas and Concepts. Descriptive Statistics (Ch. 1-4)
") Summary of Formulas and Concepts Descriptive Statistics (Ch. 1-4) Definitions Population: The complete set of numerical information on a particular quantity in which an investigator is interested. We assume
Summary of Formulas and Concepts Descriptive Statistics (Ch. 1-4) Definitions Population: The complete set of numerical information on a particular quantity in which an investigator is interested. We assume
Options 1 OPTIONS. Introduction
 Options 1 OPTIONS Introduction A derivative is a financial instrument whose value is derived from the value of some underlying asset. A call option gives one the right to buy an asset at the exercise or
Mathematics within the Psychology Curriculum
 Mathematics within the Psychology Curriculum Statistical Theory and Data Handling Statistical theory and data handling as studied on the GCSE Mathematics syllabus You may have learnt about statistics and
amleague PROFESSIONAL PERFORMANCE DATA
 amleague PROFESSIONAL PERFORMANCE DATA APPENDIX 2 amleague Performance Ratios Definition Contents This document aims at describing the performance ratios calculated by amleague: 1. Standard Deviation 2.
HOW TO EXTEND MODERN PORTFOLIO THEORY TO MAKE MONEY FROM TRADING EQUITY OPTIONS
 Ta t i a n a L o z o v a i a a n d H e l e n H i z h n i a k o v a HOW TO EXTEND MODERN PORTFOLIO THEORY TO MAKE MONEY FROM TRADING EQUITY OPTIONS HOW TO READ DISPERSION NUMBERS, OR MARKET IS THE BIGGEST
Part 2: Analysis of Relationship Between Two Variables
 Part 2: Analysis of Relationship Between Two Variables Linear Regression Linear correlation Significance Tests Multiple regression Linear Regression Y = a X + b Dependent Variable Independent Variable
Using Microsoft Excel to build Efficient Frontiers via the Mean Variance Optimization Method
 Using Microsoft Excel to build Efficient Frontiers via the Mean Variance Optimization Method Submitted by John Alexander McNair ID #: 0061216 Date: April 14, 2003 The Optimal Portfolio Problem Consider
Investment Statistics: Definitions & Formulas
 Investment Statistics: Definitions & Formulas The following are brief descriptions and formulas for the various statistics and calculations available within the ease Analytics system. Unless stated otherwise,
Numerical methods for American options
 Lecture 9 Numerical methods for American options Lecture Notes by Andrzej Palczewski Computational Finance p. 1 American options The holder of an American option has the right to exercise it at any moment
MVO has Eaten my Alpha
 Dear Investor: MVO has Eaten my Alpha Sebastian Ceria, CEO Axioma, Inc. January 28 th, 2013 Columbia University Copyright 2013 Axioma The Mean Variance Optimization Model Expected Return - Alpha Holdings
Linear Threshold Units
 Linear Threshold Units w x hx (... w n x n w We assume that each feature x j and each weight w j is a real number (we will relax this later) We will study three different algorithms for learning linear
5. Linear Regression
 5. Linear Regression Outline.................................................................... 2 Simple linear regression 3 Linear model............................................................. 4
SPSS TRAINING SESSION 3 ADVANCED TOPICS (PASW STATISTICS 17.0) Sun Li Centre for Academic Computing lsun@smu.edu.sg
 Sun Li Centre for Academic Computing lsun@smu.edu.sg") SPSS TRAINING SESSION 3 ADVANCED TOPICS (PASW STATISTICS 17.0) Sun Li Centre for Academic Computing lsun@smu.edu.sg IN SPSS SESSION 2, WE HAVE LEARNT: Elementary Data Analysis Group Comparison & One-way
SPSS TRAINING SESSION 3 ADVANCED TOPICS (PASW STATISTICS 17.0) Sun Li Centre for Academic Computing lsun@smu.edu.sg IN SPSS SESSION 2, WE HAVE LEARNT: Elementary Data Analysis Group Comparison & One-way
Gamma Distribution Fitting
 Chapter 552 Gamma Distribution Fitting Introduction This module fits the gamma probability distributions to a complete or censored set of individual or grouped data values. It outputs various statistics
Call and Put. Options. American and European Options. Option Terminology. Payoffs of European Options. Different Types of Options
 Call and Put Options A call option gives its holder the right to purchase an asset for a specified price, called the strike price, on or before some specified expiration date. A put option gives its holder
Modelling Electricity Spot Prices A Regime-Switching Approach
 Modelling Electricity Spot Prices A Regime-Switching Approach Dr. Gero Schindlmayr EnBW Trading GmbH Financial Modelling Workshop Ulm September 2005 Energie braucht Impulse Agenda Model Overview Daily
QUALITY ENGINEERING PROGRAM
 QUALITY ENGINEERING PROGRAM Production engineering deals with the practical engineering problems that occur in manufacturing planning, manufacturing processes and in the integration of the facilities and
Advanced Fixed Income Analytics Lecture 1
 Advanced Fixed Income Analytics Lecture 1 Backus & Zin/April 1, 1999 Vasicek: The Fixed Income Benchmark 1. Prospectus 2. Models and their uses 3. Spot rates and their properties 4. Fundamental theorem
MATH BOOK OF PROBLEMS SERIES. New from Pearson Custom Publishing!
 MATH BOOK OF PROBLEMS SERIES New from Pearson Custom Publishing! The Math Book of Problems Series is a database of math problems for the following courses: Pre-algebra Algebra Pre-calculus Calculus Statistics
Option Portfolio Modeling
 Value of Option (Total=Intrinsic+Time Euro) Option Portfolio Modeling Harry van Breen www.besttheindex.com E-mail: h.j.vanbreen@besttheindex.com Introduction The goal of this white paper is to provide
Option Pricing Methods for Estimating Capacity Shortages
 Option Pricing Methods for Estimating Capacity Shortages Dohyun Pak and Sarah M. Ryan Department of Industrial and Manufacturing Systems Engineering Iowa State University Ames, IA 500-64, USA Abstract
Lean Six Sigma Analyze Phase Introduction. TECH 50800 QUALITY and PRODUCTIVITY in INDUSTRY and TECHNOLOGY
 TECH 50800 QUALITY and PRODUCTIVITY in INDUSTRY and TECHNOLOGY Before we begin: Turn on the sound on your computer. There is audio to accompany this presentation. Audio will accompany most of the online
Chapter 21 Valuing Options
 Chapter 21 Valuing Options Multiple Choice Questions 1. Relative to the underlying stock, a call option always has: A) A higher beta and a higher standard deviation of return B) A lower beta and a higher
Intraday Trading Invariance. E-Mini S&P 500 Futures Market
 in the E-Mini S&P 500 Futures Market University of Illinois at Chicago Joint with Torben G. Andersen, Pete Kyle, and Anna Obizhaeva R/Finance 2015 Conference University of Illinois at Chicago May 29-30,
Hedging. An Undergraduate Introduction to Financial Mathematics. J. Robert Buchanan. J. Robert Buchanan Hedging
 Hedging An Undergraduate Introduction to Financial Mathematics J. Robert Buchanan 2010 Introduction Definition Hedging is the practice of making a portfolio of investments less sensitive to changes in
Pattern Recognition and Prediction in Equity Market
 Pattern Recognition and Prediction in Equity Market Lang Lang, Kai Wang 1. Introduction In finance, technical analysis is a security analysis discipline used for forecasting the direction of prices through
How to Win the Stock Market Game
 How to Win the Stock Market Game 1 Developing Short-Term Stock Trading Strategies by Vladimir Daragan PART 1 Table of Contents 1. Introduction 2. Comparison of trading strategies 3. Return per trade 4.
Estimating an ARMA Process
 Statistics 910, #12 1 Overview Estimating an ARMA Process 1. Main ideas 2. Fitting autoregressions 3. Fitting with moving average components 4. Standard errors 5. Examples 6. Appendix: Simple estimators
Geostatistics Exploratory Analysis
 Instituto Superior de Estatística e Gestão de Informação Universidade Nova de Lisboa Master of Science in Geospatial Technologies Geostatistics Exploratory Analysis Carlos Alberto Felgueiras cfelgueiras@isegi.unl.pt
Lecture 1: Asset pricing and the equity premium puzzle
 Lecture 1: Asset pricing and the equity premium puzzle Simon Gilchrist Boston Univerity and NBER EC 745 Fall, 2013 Overview Some basic facts. Study the asset pricing implications of household portfolio
The Voices of Influence iijournals.com
 W W W. I I J O T. C O M OT S U M M E R 2 0 1 4 V O L U M E 9 N U M B E R 3 The Voices of Influence iijournals.com Predicting Intraday Trading Volume and Volume Percentages VENKATESH SATISH, ABHAY SAXENA,
Market Risk Management for Hedge Funds
 Market Risk Management for Hedge Funds Foundations of the Style and Implicit Value-at-Risk Francois Due and Yann Schorderet WILEY A John Wiley & Sons, Ltd., Publication Acknowledgements xv 1 Introduction
Chapter 2: Binomial Methods and the Black-Scholes Formula
 Chapter 2: Binomial Methods and the Black-Scholes Formula 2.1 Binomial Trees We consider a financial market consisting of a bond B t = B(t), a stock S t = S(t), and a call-option C t = C(t), where the
CFA Examination PORTFOLIO MANAGEMENT Page 1 of 6
 PORTFOLIO MANAGEMENT A. INTRODUCTION RETURN AS A RANDOM VARIABLE E(R) = the return around which the probability distribution is centered: the expected value or mean of the probability distribution of possible
Sales forecasting # 2
 Sales forecasting # 2 Arthur Charpentier arthur.charpentier@univ-rennes1.fr 1 Agenda Qualitative and quantitative methods, a very general introduction Series decomposition Short versus long term forecasting
Predictive modelling around the world 28.11.13
 Predictive modelling around the world 28.11.13 Agenda Why this presentation is really interesting Introduction to predictive modelling Case studies Conclusions Why this presentation is really interesting
11. Time series and dynamic linear models
 11. Time series and dynamic linear models Objective To introduce the Bayesian approach to the modeling and forecasting of time series. Recommended reading West, M. and Harrison, J. (1997). models, (2 nd
DOWNSIDE RISK IMPLICATIONS FOR FINANCIAL MANAGEMENT ROBERT ENGLE PRAGUE MARCH 2005
 DOWNSIDE RISK IMPLICATIONS FOR FINANCIAL MANAGEMENT ROBERT ENGLE PRAGUE MARCH 2005 RISK AND RETURN THE TRADE-OFF BETWEEN RISK AND RETURN IS THE CENTRAL PARADIGM OF FINANCE. HOW MUCH RISK AM I TAKING? HOW
Financial Market Microstructure Theory
 The Microstructure of Financial Markets, de Jong and Rindi (2009) Financial Market Microstructure Theory Based on de Jong and Rindi, Chapters 2 5 Frank de Jong Tilburg University 1 Determinants of the
BINOMIAL OPTIONS PRICING MODEL. Mark Ioffe. Abstract
 BINOMIAL OPTIONS PRICING MODEL Mark Ioffe Abstract Binomial option pricing model is a widespread numerical method of calculating price of American options. In terms of applied mathematics this is simple
Recent Developments of Statistical Application in. Finance. Ruey S. Tsay. Graduate School of Business. The University of Chicago
 Recent Developments of Statistical Application in Finance Ruey S. Tsay Graduate School of Business The University of Chicago Guanghua Conference, June 2004 Summary Focus on two parts: Applications in Finance:
Sensitivity analysis of utility based prices and risk-tolerance wealth processes
 Sensitivity analysis of utility based prices and risk-tolerance wealth processes Dmitry Kramkov, Carnegie Mellon University Based on a paper with Mihai Sirbu from Columbia University Math Finance Seminar,
MISSING DATA TECHNIQUES WITH SAS. IDRE Statistical Consulting Group
 MISSING DATA TECHNIQUES WITH SAS IDRE Statistical Consulting Group ROAD MAP FOR TODAY To discuss: 1. Commonly used techniques for handling missing data, focusing on multiple imputation 2. Issues that could
FIN-40008 FINANCIAL INSTRUMENTS SPRING 2008
 FIN-40008 FINANCIAL INSTRUMENTS SPRING 2008 Options These notes consider the way put and call options and the underlying can be combined to create hedges, spreads and combinations. We will consider the
The Data Mining Process
 Sequence for Determining Necessary Data. Wrong: Catalog everything you have, and decide what data is important. Right: Work backward from the solution, define the problem explicitly, and map out the data
Introduction to General and Generalized Linear Models
 Introduction to General and Generalized Linear Models General Linear Models - part I Henrik Madsen Poul Thyregod Informatics and Mathematical Modelling Technical University of Denmark DK-2800 Kgs. Lyngby
VOLATILITY AND DEVIATION OF DISTRIBUTED SOLAR
 VOLATILITY AND DEVIATION OF DISTRIBUTED SOLAR Andrew Goldstein Yale University 68 High Street New Haven, CT 06511 andrew.goldstein@yale.edu Alexander Thornton Shawn Kerrigan Locus Energy 657 Mission St.
Stochastic Inventory Control
 Chapter 3 Stochastic Inventory Control 1 In this chapter, we consider in much greater details certain dynamic inventory control problems of the type already encountered in section 1.3. In addition to the
Options/1. Prof. Ian Giddy
 Options/1 New York University Stern School of Business Options Prof. Ian Giddy New York University Options Puts and Calls Put-Call Parity Combinations and Trading Strategies Valuation Hedging Options2
Autocorrelation in Daily Stock Returns
 Autocorrelation in Daily Stock Returns ANÓNIO CERQUEIRA ABSRAC his paper examines the roles of spread and gradual incorporation of common information in the explanation of the autocorrelation in daily
Unrealized Gains in Stocks from the Viewpoint of Investment Risk Management
 Unrealized Gains in Stocks from the Viewpoint of Investment Risk Management Naoki Matsuyama Investment Administration Department, The Neiji Mutual Life Insurance Company, 1-1 Marunouchi, 2-chome, Chiyoda-ku,
Chapter 6 The Tradeoff Between Risk and Return
 Chapter 6 The Tradeoff Between Risk and Return MULTIPLE CHOICE 1. Which of the following is an example of systematic risk? a. IBM posts lower than expected earnings. b. Intel announces record earnings.
Risk Decomposition of Investment Portfolios. Dan dibartolomeo Northfield Webinar January 2014
 Risk Decomposition of Investment Portfolios Dan dibartolomeo Northfield Webinar January 2014 Main Concepts for Today Investment practitioners rely on a decomposition of portfolio risk into factors to guide
Statistical Machine Learning
 Statistical Machine Learning UoC Stats 37700, Winter quarter Lecture 4: classical linear and quadratic discriminants. 1 / 25 Linear separation For two classes in R d : simple idea: separate the classes
How To Use Statgraphics Centurion Xvii (Version 17) On A Computer Or A Computer (For Free)
 On A Computer Or A Computer (For Free)") Statgraphics Centurion XVII (currently in beta test) is a major upgrade to Statpoint's flagship data analysis and visualization product. It contains 32 new statistical procedures and significant upgrades
Statgraphics Centurion XVII (currently in beta test) is a major upgrade to Statpoint's flagship data analysis and visualization product. It contains 32 new statistical procedures and significant upgrades
Optimal trading? In what sense?
 Optimal trading? In what sense? Market Microstructure in Practice 3/3 Charles-Albert Lehalle Senior Research Advisor, Capital Fund Management, Paris April 2015, Printed the April 13, 2015 CA Lehalle 1
Lecture 3. Linear Programming. 3B1B Optimization Michaelmas 2015 A. Zisserman. Extreme solutions. Simplex method. Interior point method
 Lecture 3 3B1B Optimization Michaelmas 2015 A. Zisserman Linear Programming Extreme solutions Simplex method Interior point method Integer programming and relaxation The Optimization Tree Linear Programming
8.1 Summary and conclusions 8.2 Implications
 Conclusion and Implication V{tÑàxÜ CONCLUSION AND IMPLICATION 8 Contents 8.1 Summary and conclusions 8.2 Implications Having done the selection of macroeconomic variables, forecasting the series and construction