Ejemplos de evaluación de riesgo
|
|
|
- Lauren Bates
- 8 years ago
- Views:
Transcription
1 Ejemplos de evaluación de riesgo RISK ASSESSMENT RISK = HAZARD * VULNERABILITY * AMOUNT Hazard= PROBABILITY of event with a certain magnitude Vulnerability = Degree of damage. Function of: magnitude of event, and type of elements at risk Amount = Quantification of the elements at risk e.g. Replacement costs of buildings, infrastructure etc. Loss of function or economic activities Number of people

2 Firework explosion Enschede 13 May tons Explosive Size of the disaster area Number of inhabitants in most affected zone Number of completely destroyed houses Number of completely damaged business and industrial buildings Number of houses declared inhabitable Number of damaged houses outside mostly affected zone Number of persons killed Number of persons injured Number of homeless persons Number of persons that had to be evacuated Total mate rial damage 40 ha ± ca ± billion guilders Pre-disaster airphoto 1998 Outer-ring Inner-ring Firework storage

3 Grolsch brewery S.E.F. RISK ASSESSMENT RISK = HAZARD * VULNERABILITY * AMOUNT Hazard= PROBABILITY of event with a certain magnitude Vulnerability = Degree of damage. Function of: magnitude of event, and type of elements at risk Amount = Quantification of the elements at risk e.g. Replacement costs of buildings, infrastructure etc. Loss of function or economic activities Number of people

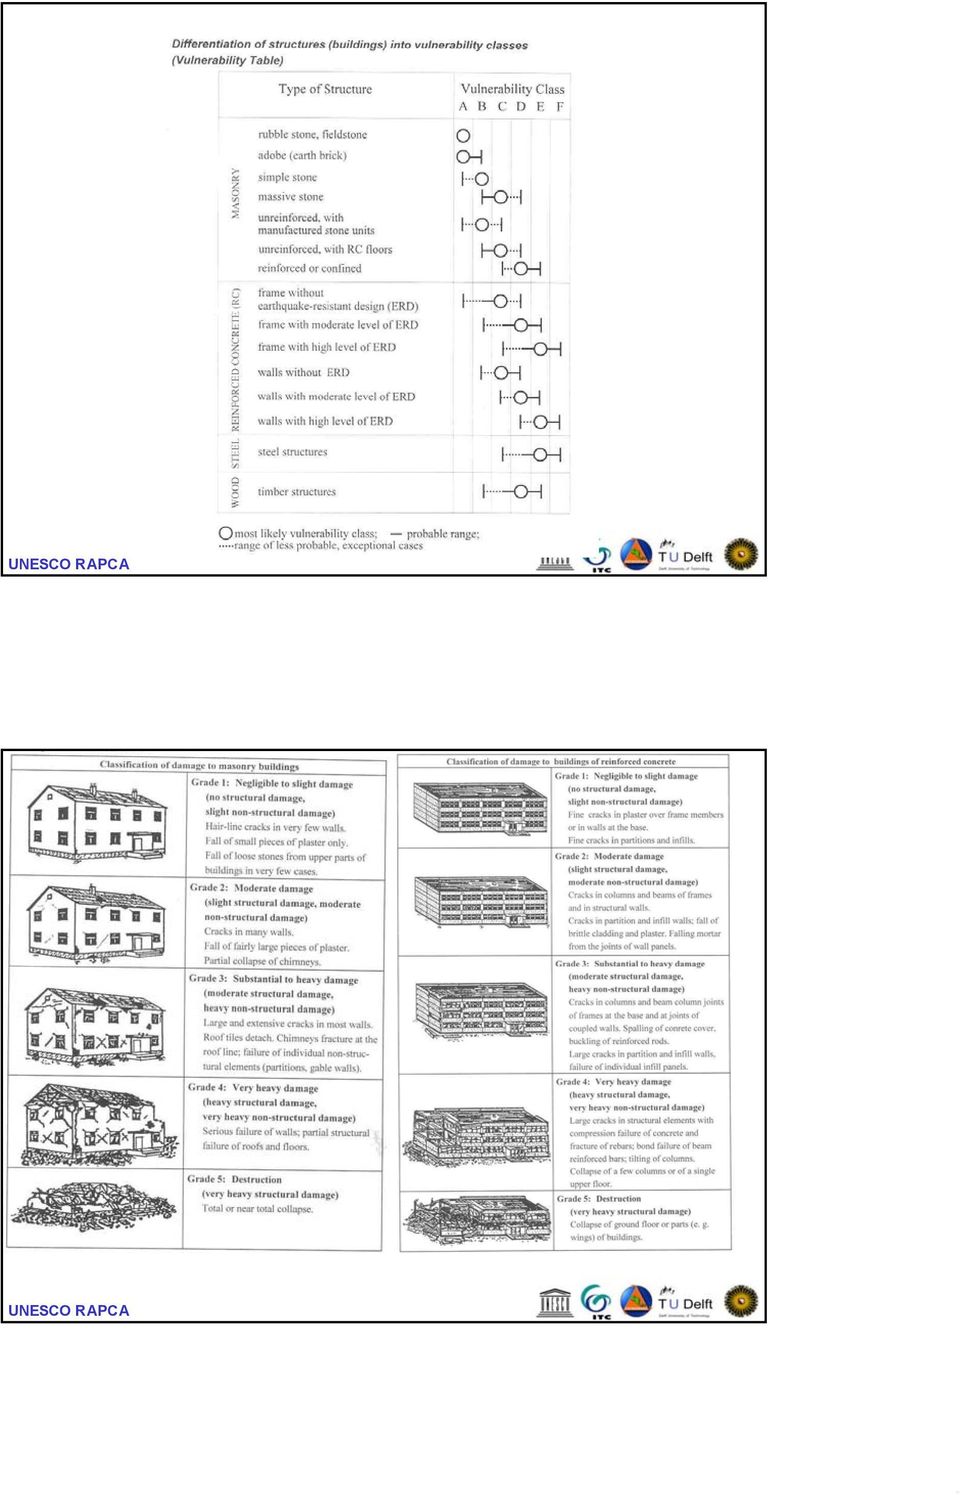
4 Vulnerability Degree of loss to a given type of elements at risk resulting from the occurrence of a damaging phenomena. Normally expressed on a scale between 0 (no damage) and 1 (complete damage) Determined: Using existing damage reports Using analytical methods What do we normally use: Data from literature Educated guesses Foreign damage datasets: handle with care!

5
6
7 POPULATION VULNERABILITY At home 20:30 08:30 14:30-17:30 At work 9:00 14:00 17:00 20:00 Commuting 8:30 9:00 14:00 14:30 16:30 17:00 20:00 20:30 DENSITY CHANGES (average ITC staff) At home 18:00-8:30 am At work 9:00-17:30 Commuting 8:30-9:00 17:30-18:00 Distribution of People in Census Tract Basic Group 2:00 a.m. 2:00 p.m. 5:00 p.m. Residential 0.99(NRES) 0.80(DRES) 0.95(DRES) Commercial 0.02(COMW) 0.98(COMW) (COMW) 0.15(DRES) (AGE_16) Industrial 0.10(INDW) 0.80(INDW) 0.50(INDW) Commuting 0.01(POP) 0.05(POP) 0.05(DRES) + 1.0(COMM) where: POP is the census tract population taken from census data DRES is the daytime residential population inferred from census data NRES is the nighttime residential population inferred from census data COMM is the number of people commuting inferred from census data COMW is the number of people employed in the commercial sector INDW is the number of people employed in the industrial sector. UNESCO AGE_16 RAPCA is the number of people 16 years of age and under inferred from
 where: POP is the census tract population taken from census data DRES is the daytime residential population inferred from census data NRES is the nighttime residential population inferred")
8 POPULATION VULNERABILITY POPULATION DISTRIBUTION Table 13.2 INVENTORY VULNERABILITY CASUALTY Table 13.4 Table 13.3 Table 13.5 CASUALTY Table 13.6 Table 13.7 Level 1 Level 1 Residential Population Commercial Population Industrial Population B ldg. Type 1 Damage State 1 Damage State 2 Damage State 3 Damage State 4 Level 2 Level 3 Level 4 No Collapse With Collapse Level 2 Level 3 Level 4 CASUALTY Level 1 Commuting Population Bldg. Type 36 Level 2 Level 3 Bridge 1 Damage State 4 CASUALTY Level 4 Level 1 Bridge 4 Damage State 4 Level 2 Level 3 Level 4 Cost estimation

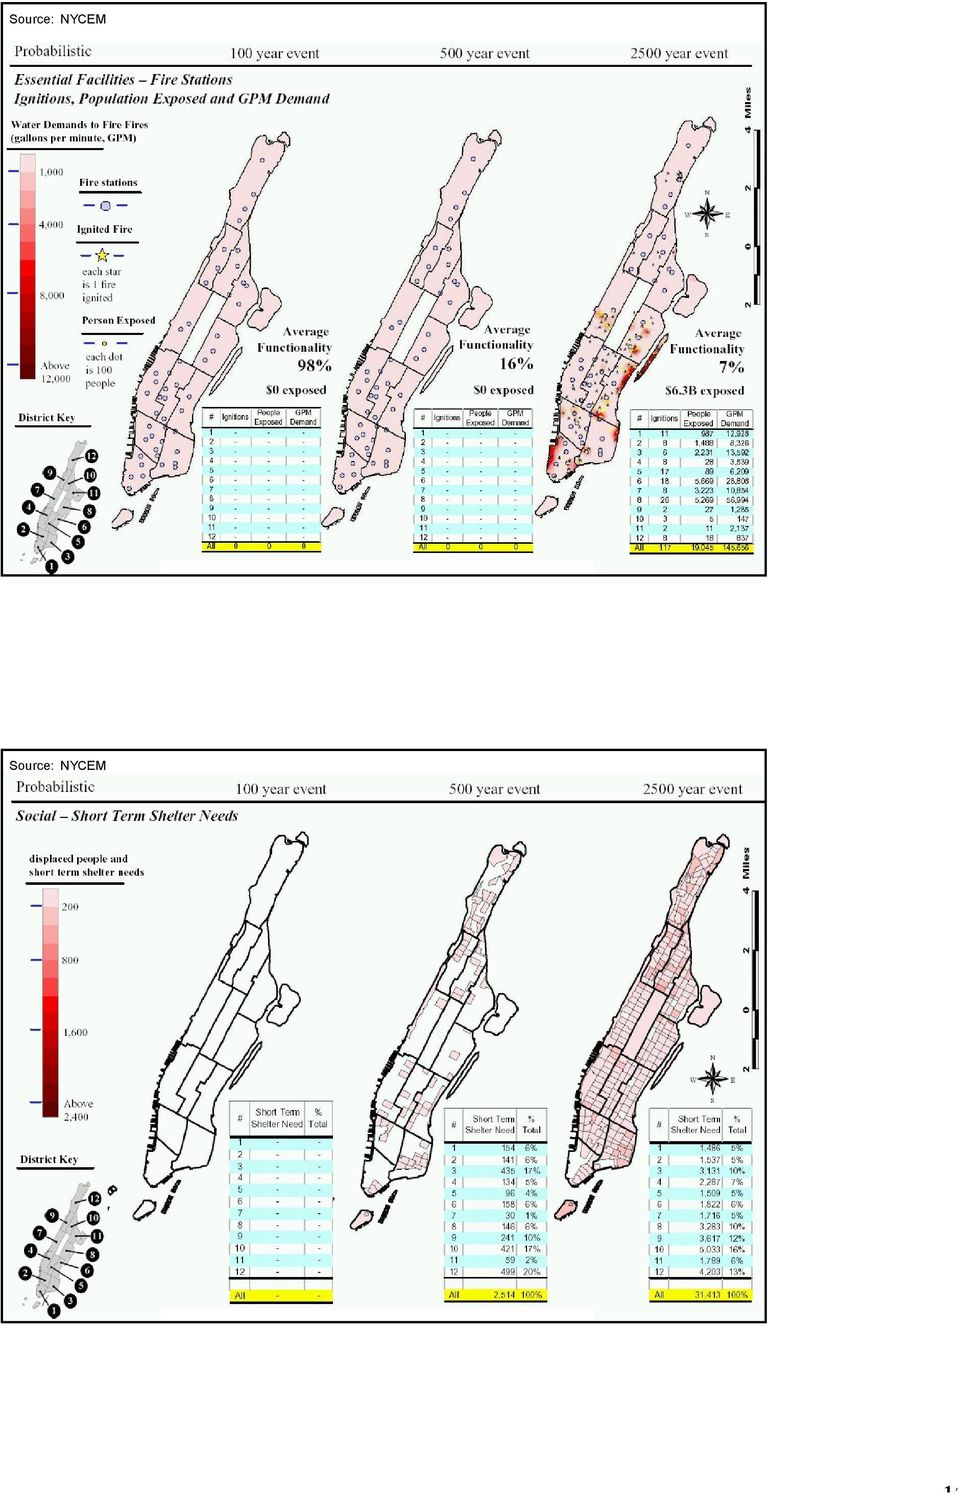
9 Which costs? Real-estate agencies Market price real Cadastres in most developing countries Ratable price fictitious Engineering societies Construction price replacement With renovation/good maintenance Price m2 Depreciation factor Inflation without renovation/good maintenance Age Source: NYCEM

10 Source: NYCEM Deterministic (Fixed Location) Casualties 2pm earthquake Casualties 4 (Instant Death) # of People CAS 4 or CAS 3 5.0M 6.0M 7.0M At least 24 District Key CAS 4 District Instant # Death 2pm CAS 4 District Instant Death # 2pm % % % % % % % % % < 1% % % % CAS 4 District Instant Death # 2pm % % % % % % % % % % % % % All - All % All %

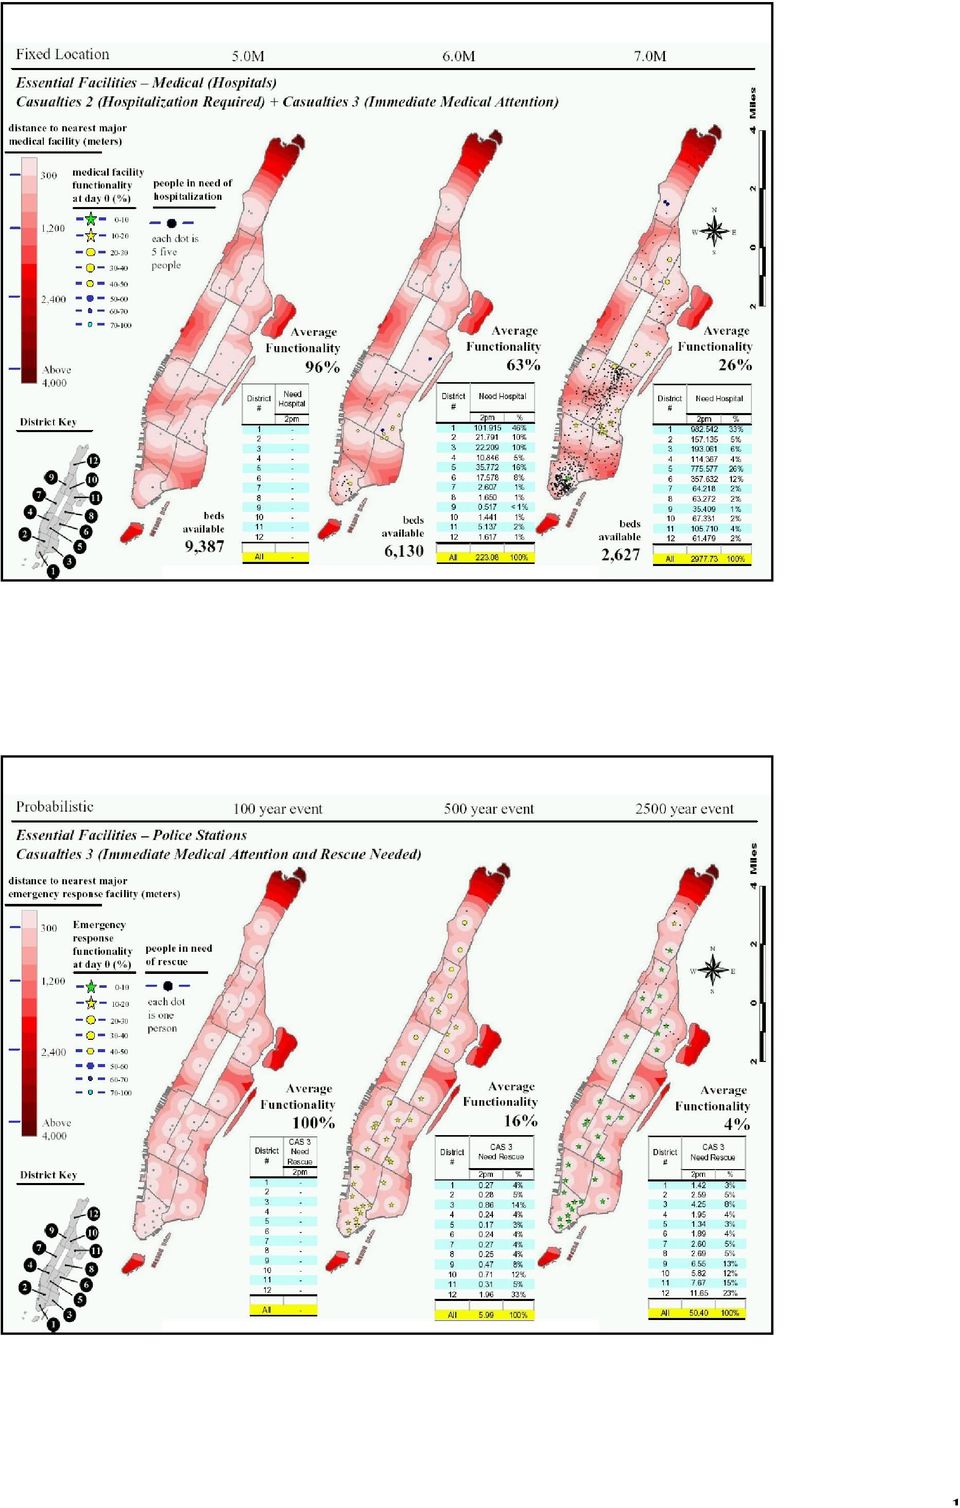
11 Deterministic (Fixed Location) medical facility functionality people in need of at day 0 (%) hospitalization 5.0M 6.0M 7.0M Essential Facilities Medical Casualties 2 (Hospitalization Required) + Casualties 3 (Immediate Medical Attention) distance to nearest maj or medical facility (meters) 300 1, each dot is 5 five people , Above 4,000 District Key beds av ailable 9,387 Average Functionality 96% Need District Hospital # 2pm All - beds av ailable 6,130 Average Functionality 63% District Need Hospital # 2pm % % % % % % % % % < 1% % % % All % beds av ailable 2,627 Average Functionality 26% District Need Hospital # 2pm % % % % % % % % % % % % % All % Source: NYCEM

12 Source: NYCEM Source: NYCEM
13
14 14
15 Case study Kathmandu Building Damage Ratio in 1934

16 Actual Damage in 1934 From Images of Century Building Damage in 1934

17 Death Toll in 1934 Comparison of Results Damaged Houses Casualties (Death) Actual Calculated Actual Calculated 38,055 35,592 4,296 3,814

18 Building Damage (Number) 1934 EQ (in present) 1934 EQ (actual) Death Toll 1934 EQ (in present) 1934 EQ (actual) 18
 18")
19 Comparison of Results Damaged Houses Casualties (Death) Actual in 1934 Calculated in present Actual in 1934 Calculated in present 38, ,474 4,296 19,523 Vulnerability increased! Basic Unit for Analysis

20 Seismic Intensity Map I. Mid Nepal Earthquake Seismic Intensity Map II.North Bagmati Earthquake

21 Seismic Intensity Map III. KV Local Earthquake Liquefaction Potential I. Mid Nepal Earthquake
22 Fragility Curve for this Study Damage(%) PGA ~Intensity Damage is different at each building type!! A++ B B++ K5 K3 A++: ST, AD B: BM B++: BMW, BC K5: (RC5) K3: (RC3) Building Damage Ratio I. Mid Nepal Earthquake
23 Case study Tegucigalpa Digital Elevation Models
24 Digital Elevation Models LIght Detection And Ranging Position of the aircraft + Attitude of the aircraft + Distance between the aircraft and the ground + Angle under which the distance has been measured Digital Elevation Models
25 Lidar can be used to measure building height Lidar and Geometric corrections
26 View 3-D using analgyph image Mapping buildings
27 Mapping damage
28 Case study Turrialba Within: UNESCO programme on Capacity Building for Natural Disaster Reduction, regional action programme Central America. Test site in Turrialba, Costa Rica Objective: provide municipality information on expected losses due to natural disaster, as a basis for risk mitigation Relatively small municipality with limited resources Solution: use of low cost, easy to use system No digital urban data available Solution: use of orthophoto and extensive field campaign using graduate students No detailed hazard information available Solution: use of historical information on events and intensities, through questionnaires Data Input Orthophoto with segments of parcels Point map Seismic events soil map scarps map Field Survey and polygon conversion create table with vulnerability data per building type" Cadastral data join table Link to table with information on each parcel using field observations Attenuation relation relation between distance from epicentrum,magnitude and PGA value PGA values for return period 25,50,100 and 200 years PGA map with soil and topographic amplification Convert to mmi raster maps Soil amplification factors Cadastral map Topographic amplification factors Flowchart Seismic risk Assessment Add information on construction cost for different building types Calculate population densityboth during daytime and nighttime Add information on: minor injuries majo rinjuriesand casualties estimation of market price Apply age depretion factor join table calculate replacement cost by multipliying building area * constructuion cost * damage ratel Specific risk cross map, produce table: mmicomplete (every return period) Esitmation off: * Damage rate * Minor injuriesl * Major injuries * Casualtiesl Legend
29 Stored data Field questionnaires on flood depth Cadastral map Geomorphological map table with building cost informationt Survey on contents costs for buildings Segment map of main river interpolate Flood depth maps for 25, 50 and 75 years return period Link with vulnerability table maximum flood map content cost map Building cost recognize residential content value rasterize distance map Assign classes with probability Flowchart Flood risk Assessment Vulnerability map for each return period maximum flood damage map Lateral damage map damage maps 25,50,75 return period annual exceedance probability legend input data Process Risk analysis * 25,50,75 return period * lateral erosion * maximum flood Elements at risk database
30 Flood vulnerability assessment Flood vulnerability maps for different return periods Flood depth map = flood scenarios of different return periods Map of elements at risk: attribute landuse Degree of loss Vulnerability functions for each landuse Floodwater depths (m) Cost calculation Cost for contents of buildings Size of building Landuse class Social class Number of floors Cost for structure of buildings material type Size Percentage built-up area per plot
31 Cost maps Risk assessment: Probability*vulnerability*cost Risk = probability * vulnerability * cost Generation of risk curves for each hazard type Combine risk curves Information can be derived for: entire city Building block landuse types Public or private losses
32 Case study: San Sebastian, Retalhuleu, Guatemala
33 Growth of San Sebastian City block mapping 33
34 Data collection Damage assessment
35 Stage damage curves Vulnerability map
36 Risk map Vulnerability assessment Loss-Probability Curve Annual Risk Analysis Curve Ris Event k (Annual damages( loss In in million million US$) US$) Exceedence Probability Exceedence Probability Landuse landuse Infra Infrastructure structure Total Total
37 Case study: flood risk assessment objectives Assessing the risk of different flood scenarios for a polder area in the Netherlands due to slow rising due to rainfall or snowmelt (not flash floods). Comparison of the expected losses regarding the land use type and flood magnitude Death by drowning Direct property losses (crops, buildings, main roads/railroads) Determination of the overall annual risk STUDY AREA: Area subject to riverine floods (not coastal floods). Population of approximately 106,000 Amsterdam Population density of 296 /km2. Grassland: 60%, orchards 9%, forest 4%, agriculture 8%, urban areas 5% of the area. BELGIUM 0 100km GERMANY
38 AVAILABLE SPATIAL DATA Digital Elevation Model (DEM), based on the Topographic Map 1: updated using terrestrial measurements Land-use, based on a classification of a Landsat-TM image (1992) and updated for urban land-use Municipality boundaries and population data METHODOLOGY Based on flood depth maps (several scenarios), vulnerability functions, a landuse map, the losses per scenario will be developed Each scenario will be transformed into annual losses (through probability data) in order to produce a final map depicting the total annual losses due to the flood hazard. Annual losses per hazard allow to compare all the hazards and decide which one should be given priority.
39 OVERVIEW OF METHODOLOGY Flood Extent E Hx Landuse consists of Landuse Classes Ly Flood level Z Hx Neighbourhood Funtion Subtraction Flood Depth D Hx Calculation Vulnerability functions F Ly(D) Hazards Hx (x=returnperiod) DEM Vulnerability V Hx Additional Data Exceed. probability P Hx Multiplication Multiplication Total Loss L Hx Loss L Hx Value of Elements at Risk A Annual Risk = * * R Hx Hx Hx Hx FLOOD SCENARIOS G A MAX. DEPTH (cm) 175 RETUR N PERIOD 5 PROBABILITY 0.2 A F B C B E D E C D F G
40 VULNERABILITY FUNCTIONS Scale between 0 (no destruction) and 1(complete destruction) according to the depth of the water. Other flood characteristics, such as duration of the flood, its velocity and sediment load of the water are not considered in this study. Vulnerability Houses Source: S tandar d M ethod (Vrisou van Eck et. al. 1999) Water depth (m) AGRICULTURE AND RECREATION Steeply rising up to 50 cms, with max. at around 4ms Vulnerability Water depth (m) IFF (D<350 MIN (D/ *D/
41 BEETS AND POTATOES Reaches 1 at water depth of 40cm. At 20cm, half of the crop is destroyed Vulnerability Water depth (m) GREENHOUSES Damage increases constantly up to complete destruction at aprox. 1.8m Vulnerability Water depth (m)
42 FOREST Low waters do not have a strong impact on trees. Maximum damage is reached at 3m Vulnerability Water depth (m) ROADS Relatively steep gradient up to 1m, with maximum damage at 5m Vulnerability Water depth (m)
43 HOUSES Little damage until 2 meters, steep raise until around 5 m Vulnerability Water depth (m) HOUSEHOLD GOODS High damage at low depths. Little extra damage between 1 and 2 m there is hardly any increase in vulnerability. From 2 mts onwards, increase in damage Vulnerability Water depth (m)
44 DEATH BY DROWNING Moderate damage up to 1m, high damage from 2 to 6.5m Drown factor Water depth (m) COMBINING VULNERABILTY MAPS landuse map landuse class function In two steps: VulXXXL2 = IFF ((landvul)="va", vulagric(fldxxx), IFF ((landvul)="vg", vulglass(fldxxx), IFF ((landvul)="vf", vulfor(fldxxx), IFF ((landvul)="vr", vulroads(fldxxx), 0)))) Where: XXX refers to the flood level of a flooding scenario. flood depth map The map landvul (based on the land use map) indicates which vulnerability function has to be applied on a land use class. vulagric, vulglass and vulfor are abbreviations for the vulnerability functions. fldxxx is the flood depth layer in each flood scenario. The command finds out for every raster cell in the map landvul the appropriate function to use, applies this function on the flood depth map and the writes the calculated value into the output file VulXXXL2. Values range from 0 to 1.
45 COSTS OF ELEMENTS AT RISK The cost data has to be converted from values per hectare to values (pixel of 936,4m 2 ). Roads: 500,000 Nlg per kilometer. This value is divided by the length of the pixel cell (30.6) leading to 15,300 per cell It will be assumed that the villages are 100% residential. OVERALL ANNUAL RISK The resulting maps are divided by the return period to create the annual losses per scenario. All the annual loss scenarios are added together to obtain the overall annual risk for flooding Event damgages (Mio. NLG) Total damage Urban damage Road damage Agricultural damage 0 0,05 0,1 0,15 0,2 Exceedence probability [1/r]
Contents. Specific and total risk. Definition of risk. How to express risk? Multi-hazard Risk Assessment. Risk types
 Contents Multi-hazard Risk Assessment Cees van Westen United Nations University ITC School for Disaster Geo- Information Management International Institute for Geo-Information Science and Earth Observation
VULNERABILITY ANALYSIS AND RISK ASSESSMENT FOR SEISMIC AND FLOOD HAZARD IN TURIALBA CITY, COSTA RICA
 VULNERABILITY ANALYSIS AND RISK ASSESSMENT FOR SEISMIC AND FLOOD HAZARD IN TURIALBA CITY, COSTA RICA Figure 5.4. Damage maps for By Muh Aris Marfai Jacob Kamwaria Njagih International Institute for Geo-information
Probabilistic Risk Assessment Studies in Yemen
 Probabilistic Risk Assessment Studies in Yemen The catastrophic risk analysis quantifies the risks of hazard, exposure, vulnerability, and loss, thus providing the decision maker with the necessary information
Martine Jak 1 and Matthijs Kok 2
 A DATABASE OF HISTORICAL FLOOD EVENTS IN THE NETHERLANDS Martine Jak 1 and Matthijs Kok 2 1 Department of Transport, Public works and Water Management Road and Hydraulic Engineering Division P.O. Box 5044
Understanding Raster Data
 Introduction The following document is intended to provide a basic understanding of raster data. Raster data layers (commonly referred to as grids) are the essential data layers used in all tools developed
Vulnerability analysis
 Chapter 5 Vulnerability analysis Vulnerability is the degree of loss to a given element or set of elements at risk resulting from the occurrence of a natural phenomenon of a given magnitude. It is expressed
River Flood Damage Assessment using IKONOS images, Segmentation Algorithms & Flood Simulation Models
 River Flood Damage Assessment using IKONOS images, Segmentation Algorithms & Flood Simulation Models Steven M. de Jong & Raymond Sluiter Utrecht University Corné van der Sande Netherlands Earth Observation
Remote Sensing and GIS Application In Change Detection Study In Urban Zone Using Multi Temporal Satellite
 Remote Sensing and GIS Application In Change Detection Study In Urban Zone Using Multi Temporal Satellite R.Manonmani, G.Mary Divya Suganya Institute of Remote Sensing, Anna University, Chennai 600 025
Spatial data analysis: retrieval, (re)classification and measurement operations
classification and measurement operations") CHAPTER 7 Spatial data analysis: retrieval, (re)classification and measurement operations In chapter 5 you used a number of table window operations, such as calculations, aggregations, and table joining,
CHAPTER 7 Spatial data analysis: retrieval, (re)classification and measurement operations In chapter 5 you used a number of table window operations, such as calculations, aggregations, and table joining,
PACIFIC CATASTROPHE RISK ASSESSMENT AND FINANCING INITIATIVE
 PACIFIC CATASTROPHE RISK ASSESSMENT AND FINANCING INITIATIVE NIUE SEPTEMBER 11 COUNTRY RISK PROFILE: NIUE Niue is expected to incur, on average,.9 million USD per year in losses due to earthquakes and
A disaster occurs at the point of contact between social activities and a natural phenomenon of unusual scale.
 Hazard Mapping and Vulnerability Assessment Mr. Toshiaki Udono Senior Project Manager, Kansai Division, PASCO Corporation, Japan Mr. Awadh Kishor Sah Project Manager, Project Implementation Department,
Applying GIS in seismic hazard assessment and data integration for disaster management
 Applying GIS in seismic hazard assessment and data integration for disaster management Rumiana Vatseva, Dimcho Solakov, Emilia Tcherkezova, Stela Simeonova, Petya Trifonova National Institute of Geophysics,
WP 7: Build prototype software
 Systemic Seismic Vulnerability and Risk Analysis for Buildings, Lifeline Networks and Infrastructures Safety Gain WP 7: Build prototype software D. Schäfer, VCE A. Bosi, VCE T. Gruber, VCE H. Wenzel, VCE
MULTI-HAZARD RISK ASSESSMENT USING GIS IN URBAN AREAS: A CASE STUDY FOR THE CITY OF TURRIALBA, COSTA RICA
 MULTI-HAZARD RISK ASSESSMENT USING GIS IN URBAN AREAS: A CASE STUDY FOR THE CITY OF TURRIALBA, COSTA RICA Cees J. van Westen, Lorena Montoya, Luc Boerboom, International Institute for Geoinformation Science
Role of GIS for Flood Risk Assessment in Muzaffarabad City, Kashmir, Pakistan
 Role of GIS for Flood Risk Assessment in Muzaffarabad City, Kashmir, Pakistan Mr. Falak Nawaz, Research Associate Dr. Syed Hamidullah, Professor & Director National Centre of Excellence in Geology, University
Pacific Catastrophe Risk Assessment and Financing Initiative. Better Information for Smarter Investments
 Pacific Catastrophe Risk Assessment and Financing Initiative Better Information for Smarter Investments Main Outputs Pacific disaster risk assessment Probabilistic assessment of major perils Pacific Risk
4.14 Netherlands. Interactive flood risk map of a part of the province of Gelderland in the Netherlands. Atlas of Flood Maps
 4.14 Netherlands The Netherlands is flood prone for about 60% of its surface. 95 so-called dike-rings protect the polders from being flooded from the North Sea, rivers or lakes. The protection level has
Keynote 2: What is Landslide Hazard? Inventory Maps, Uncertainty, and an Approach to Meeting Insurance Industry Needs
 Keynote 2: What is Landslide Hazard? Inventory Maps, Uncertainty, and an Approach to Meeting Insurance Industry Needs Jeffrey R Keaton Richard J Roth, Jr Amec Foster Wheeler Los Angeles, USA Consulting
Plan Plus Volume 1 No 1 2002 (117-123)
") Plan Plus Volume 1 No 1 2002 (117-123) APPLICATION OF GIS (GEOGRAPHIC INFORMATION SYSTEM) FOR LANDSLIDE HAZARD ZONATION AND MAPPING DISASTER PRONE AREA: A STUDY OF KULEKHANI WATERSHED, NEPAL Purna Chandra
Plan Plus Volume 1 No 1 2002 (117-123) APPLICATION OF GIS (GEOGRAPHIC INFORMATION SYSTEM) FOR LANDSLIDE HAZARD ZONATION AND MAPPING DISASTER PRONE AREA: A STUDY OF KULEKHANI WATERSHED, NEPAL Purna Chandra
Introduction to GIS (Basics, Data, Analysis) & Case Studies. 13 th May 2004. Content. What is GIS?
 & Case Studies. 13 th May 2004. Content. What is GIS?") Introduction to GIS (Basics, Data, Analysis) & Case Studies 13 th May 2004 Content Introduction to GIS Data concepts Data input Analysis Applications selected examples What is GIS? Geographic Information
Introduction to GIS (Basics, Data, Analysis) & Case Studies 13 th May 2004 Content Introduction to GIS Data concepts Data input Analysis Applications selected examples What is GIS? Geographic Information
Building a Spatial Database for Earthquake Risk Assessment and Management in the Caribbean
 Building a Spatial Database for Earthquake Risk Assessment and Management in the Caribbean Jacob Opadeyi and Rehanna Jadoo Department of Geomatics Engineering and Land Management, The University of the
Government 98dn Mapping Social and Environmental Space
 Government 98dn Mapping Social and Environmental Space LAB EXERCISE 5: The Analysis of Fields Objectives of this lab: Visualizing raster data Using Spatial Analyst functions to create new data Analysis
Disaster Risk Management: prevention and urgent repair procedures for infrastructure and facilities
 Disaster Risk Management: prevention and urgent repair procedures for infrastructure and facilities Jacob Greenstein Ph.D, PE, EGAT/ I&E EGAT workshop-december 2009 1 Natural disasters-new trends Natural
DECISION PROCESS AND OPTIMIZATION RULES FOR SEISMIC RETROFIT PROGRAMS. T. Zikas 1 and F. Gehbauer 2
 International Symposium on Strong Vrancea Earthquakes and Risk Mitigation Oct. 4-6, 2007, Bucharest, Romania DECISION PROCESS AND OPTIMIZATION RULES FOR SEISMIC RETROFIT PROGRAMS T. Zikas 1 and F. Gehbauer
Chincha and Cañete, Peru, Based
 Reconstruction of Ica, Pisco, Chincha and Cañete, Peru, Based on Updated Hazard Maps Julio Kuroiwa Professor emeritus National University of Engineering and UNDP Reconstruction Program/Sustainable Cities.
METHODOLOGY FOR LANDSLIDE SUSCEPTIBILITY AND HAZARD MAPPING USING GIS AND SDI
 The 8th International Conference on Geo-information for Disaster Management Intelligent Systems for Crisis Management METHODOLOGY FOR LANDSLIDE SUSCEPTIBILITY AND HAZARD MAPPING USING GIS AND SDI T. Fernández
Seismic Risk Assessment Procedures for a System consisting of Distributed Facilities -Part three- Insurance Portfolio Analysis
 Seismic Risk Assessment Procedures for a System consisting of Distributed Facilities -Part three- Insurance Portfolio Analysis M. Achiwa & M. Sato Yasuda Risk Engineering Co., Ltd., Tokyo, Japan M. Mizutani
Client: Nederlandse Aardolie Maatschappij Arup Project Title: Groningen 2013 Seismic Risk Study - Earthquake Scenario-Based Risk Assessment
 Client: Nederlandse Aardolie Maatschappij Arup Project Title: Groningen 2013 Seismic Risk Study - Earthquake Scenario-Based Risk Assessment REP/229746/SR001 Issue 29 November 2013 This report was prepared
Flood damage assessment and estimation of flood resilience indexes
 Flood damage assessment and estimation of flood resilience indexes Barcelona case study Marc Velasco CETaqua Workshop CORFU Barcelona Flood resilience in urban areas the CORFU project Cornellà de Llobregat,
Toma Danila Dragos. National Institute for Earth Physics Romania
 Toma Danila Dragos National Institute for Earth Physics Romania Before: evaluate the hazard and risk, be prepared for worst case scenario Natural or antropic disaster After: quickly evaluate the situation
3D Model of the City Using LiDAR and Visualization of Flood in Three-Dimension
 3D Model of the City Using LiDAR and Visualization of Flood in Three-Dimension R.Queen Suraajini, Department of Civil Engineering, College of Engineering Guindy, Anna University, India, suraa12@gmail.com
How To Understand And Understand The Flood Risk Of Hoang Long River In Phuon Vietnam
 FLOOD HAZARD AND RISK ASSESSMENT OF HOANG LONG RIVER BASIN, VIETNAM VU Thanh Tu 1, Tawatchai TINGSANCHALI 2 1 Water Resources University, Assistant Professor, 175 Tay Son Street, Dong Da District, Hanoi,
Appendix A Flood Damages Assessment
 Appendix A Flood Damages Assessment 106 GHD Report for Bundaberg Regional Council - Floodplain Action Plan, 41/26909 10. Flood Damages Assessment Methodology An important part of assessing flooding impact
Flood Zone Investigation by using Satellite and Aerial Imagery
 Flood Zone Investigation by using Satellite and Aerial Imagery Younes Daneshbod Islamic Azad University-Arsanjan branch Daneshgah Boulevard, Islamid Azad University, Arsnjan, Iran Email: daneshbod@gmail.com
SESSION 8: GEOGRAPHIC INFORMATION SYSTEMS AND MAP PROJECTIONS
 SESSION 8: GEOGRAPHIC INFORMATION SYSTEMS AND MAP PROJECTIONS KEY CONCEPTS: In this session we will look at: Geographic information systems and Map projections. Content that needs to be covered for examination
Flood Damage Assessment in Taipei City, Taiwan
 Flood Damage Assessment in Taipei City, Taiwan Ming-Hsi Hsu 1, Meng-Yuan Tsai, Yi-Chieh Lin 3, Albert S. Chen 4, Michael J. Hammond 5, Slobodan Djordjević 6 & David Butler 7 1 National Taiwan University,
ANALYSIS 3 - RASTER What kinds of analysis can we do with GIS?
 ANALYSIS 3 - RASTER What kinds of analysis can we do with GIS? 1. Measurements 2. Layer statistics 3. Queries 4. Buffering (vector); Proximity (raster) 5. Filtering (raster) 6. Map overlay (layer on layer
HAZARD RISK ASSESSMENT, MONITORING, MAINTENANCE AND MANAGEMENT SYSTEM (HAMMS) FOR LANDSLIDE AND FLOOD. Mohd. Nor Desa, Rohayu and Lariyah, UNITEN
 FOR LANDSLIDE AND FLOOD. Mohd. Nor Desa, Rohayu and Lariyah, UNITEN") HAZARD RISK ASSESSMENT, MONITORING, MAINTENANCE AND MANAGEMENT SYSTEM (HAMMS) FOR LANDSLIDE AND FLOOD Mohd. Nor Desa, Rohayu and Lariyah, UNITEN WHAT WE HAVE IN MIND AND FROM OUR PREVIOUS PROJECT CONTRIBUTION
HAZARD RISK ASSESSMENT, MONITORING, MAINTENANCE AND MANAGEMENT SYSTEM (HAMMS) FOR LANDSLIDE AND FLOOD Mohd. Nor Desa, Rohayu and Lariyah, UNITEN WHAT WE HAVE IN MIND AND FROM OUR PREVIOUS PROJECT CONTRIBUTION
San Francisco Bay Margin Conservation Decision Support System (DSS)
") San Francisco Bay Margin Conservation Decision Support System (DSS) Presented by Brian Fulfrost1, MS David Thomson2, MS 1 Brian Fulfrost and Associates 2 San Francisco Bay Bird Observatory Transitional
San Francisco Bay Margin Conservation Decision Support System (DSS) Presented by Brian Fulfrost1, MS David Thomson2, MS 1 Brian Fulfrost and Associates 2 San Francisco Bay Bird Observatory Transitional
Earthquake hazard mapping for community resilience in Japan
 Earthquake hazard mapping for community resilience in Japan -the role of the government- Understanding Risk Forum Focus day session Let s shake your community earthquake hazard mapping approach for community
Integrated Earthquake Risk Assessment
 Socio- Vulnerability Index for Risk Analysis Mohsen Ghafory-Ashtiany Affiliated Faculty: Disaster Management Research Institute of Shakhes Pajooh Professor: International Institute of Earthquake Engineering
EARTHQUAKE DISASTER GIS AND SPATIAL-TEMPORAL PATTERN OF EARTHQUAKE DISASTERS IN CHINA1
 EARTHQUAKE DISASTER GIS AND SPATIAL-TEMPORAL PATTERN OF EARTHQUAKE DISASTERS IN CHINA1 Mao Feng 1 and Ma Jin feng 2 and Zhou Wen sheng 3 1 Professor,School of Architecture,Tsinghua University, BeiJing.
Natural Disaster Impact on Business and Communities in Taiwan. Dr. Chung-Sheng Lee. NCDR Chinese Taipei
 Natural Disaster Impact on Business and Communities in Taiwan Dr. Chung-Sheng Lee NCDR Chinese Taipei 1 Brief Introduction of NCDR 2 Organizational Chart of NCDR NDPPC: National Disaster Preparation and
The correct answers are given below. Some talking points have been added for the teachers use.
 Natural Resources Canada 2011: Lesson Plan Grades 11 and 12 Landslide activity 5b: Landslides in Canada quiz Description: This is an independent study activity for grades 11 and 12. Students will read
DRAFT HAZARD MITIGATION PLAN TOOLKIT: MASTER TABLE
 DRAFT HAZARD MITIGATION PAN TOOKIT: MASTER TABE Steps Requirements Addressed Click to Overview slide presentation on "Getting Started Developing a Hazard Mitigation Plan" Plan Development Overview Introductory
2015 Global Risk Assessment. Sahar Safaie Program Officer, UNISDR Risk Knowledge Section
 2015 Global Risk Assessment Sahar Safaie Program Officer, UNISDR Risk Knowledge Section Outline Global Assessment Report (GAR) evolution Global Risk Assessment for GAR15 Objective Scope Audience/Users
Appendix F Benefit-Cost Analysis of Flood Protection Measures
 Appendix F Benefit-Cost Analysis of Flood Protection Measures Acronyms used in Appendix F: AA B AA C AA D BC BFE EAD FEMA NED O&M PV RED USACE Average Annual Benefits Average Annual Cost Average Annual
The Terms of reference (ToR) for conducting Rapid EIA study for the proposed project is described below:
 for conducting Rapid EIA study for the proposed project is described below:") Proposed Terms of Reference for EIA Study Objective: In order to identify the environmental impacts due to construction and operation of the proposed project and associated facilities, a study will be
Proposed Terms of Reference for EIA Study Objective: In order to identify the environmental impacts due to construction and operation of the proposed project and associated facilities, a study will be
Using GIS for Assessing Earthquake Hazards of San Francisco Bay, California, USA
 Using GIS for Assessing Earthquake Hazards of San Francisco Bay, California, USA Marzieh Zeinali Department of Resource Analysis, Saint Mary s University of Minnesota, Minneapolis, MN 55404 Keywords: San
SEISMIC DAMAGE ESTIMATION PROCEDURE FOR WATER SUPPLY PIPELINES
 SEISMIC DAMAGE ESTIMATION PROCEDURE FOR WATER SUPPLY PIPELINES Ryoji ISOYAMA 1, Eisuke ISHIDA 2, Kiyoji YUNE 3 And Toru SHIROZU 4 SUMMARY This paper presents a practical procedure for estimating damage
Development of an Impervious-Surface Database for the Little Blackwater River Watershed, Dorchester County, Maryland
 Development of an Impervious-Surface Database for the Little Blackwater River Watershed, Dorchester County, Maryland By Lesley E. Milheim, John W. Jones, and Roger A. Barlow Open-File Report 2007 1308
Operational methodology to assess flood damages in Europe
 IIASA-DPRI 2008 Operational methodology to assess flood damages in Europe Contributors: Nicola Lugeri, Carlo Lavalle, Elisabetta Genovese 1 Focus of ADAM work on extremes Types Floods, Heat-wave, Drought
Guideline for Stress Testing the Climate Resilience of Urban Areas
 Netherlands Ministry of Infrastructure and Environment Delta Programme Urban Development and Reconstruction Guideline for Stress Testing the Climate Resilience of Urban Areas Extended summary Version 1.0
Part 4: Seismic hazard assessment
 GIS CASE STUDY Application of GIS for earthquake hazard and risk assessment: Kathmandu, Nepal Part 4: Seismic hazard assessment Cees van Westen (E-mail : westen@itc.nl) Siefko Slob (E-mail: Slob@itc.nl)
The Caribbean Disaster Mitigation Project: Supporting Sustainable Responses to Natural Hazards
 The Caribbean Disaster Mitigation Project: Supporting Sustainable Responses to Natural Hazards Steven Stichter Caribbean Disaster Mitigation Project (CDMP) Unit of Sustainable Development and Environment
Predicting Seismic Vulnerable Zones using GIS. Outline of the presentation. Objectives. Risk Mapping Overview Factor Maps. Three levels of Zonation
 Predicting Seismic Vulnerable Zones using GIS by K.S.A. Dinesh Kumar Research Scholar, Anna University & Lecturer in Civil Engineering Dept. National Institute of Technical Teachers Training & Research
CityGML goes to Broadway
 CityGML goes to Broadway Thomas H. Kolbe, Barbara Burger, Berit Cantzler Chair of Geoinformatics thomas.kolbe@tum.de September 11, 2015 Photogrammetric Week 2015, Stuttgart The New York City Open Data
RISK ANALYSIS MODULE 3, READING 2. Flood Vulnerability Analysis By Dr. Heiko Apel
 RISK ANALYSIS MODULE 3, READING 2 Flood Vulnerability Analysis By Dr. Heiko Apel This document is meant to supplement the contents of session 2 Flood Vulnerability Analysis of the Flood Risk Analysis module.
Flood risk assessment through a detailed 1D/2D coupled model
 CORFU Project Barcelona Case Study Final Workshop 19 th of May 2014 Flood risk assessment through a detailed 1D/2D coupled model Beniamino Russo Aqualogy Urban Drainage Direction Introduction and general
NORSAR/International Center of Geohazards (ICG) Kjeller, Norway. International Conference on Open Risk Analysis Cambridge, UK 12-13 June 2009
 Kjeller, Norway. International Conference on Open Risk Analysis Cambridge, UK 12-13 June 2009") The SELENA RISe Open Risk Package D.H. Lang, S. Molina, V. Gutiérrez, C.D. Lindholm, and F. Lingvall NORSAR/International Center of Geohazards (ICG) Kjeller, Norway International Conference on Open Risk
The SELENA RISe Open Risk Package D.H. Lang, S. Molina, V. Gutiérrez, C.D. Lindholm, and F. Lingvall NORSAR/International Center of Geohazards (ICG) Kjeller, Norway International Conference on Open Risk
Open Spaces Inventory and Analysis for Planning of Earthquake Emergencies for Safe Evacuation Sites in Kathmandu Valley
 USMCA2015 The 14 th International Symposium on New Technologies for Urban Safety of Mega Cities in Asia Open Spaces Inventory and Analysis for Planning of Earthquake Emergencies for Safe Evacuation Sites
DISASTER DISASTER MANAGEMENT CRISIS INFORMATICS GIS IN DIFFEERENT STAGES OF DISASTER MANAGEMENT
 APPLICATION OF GIS AND REMOTE SENSING IN DISASTER PRONE AREAS: A CASE STUDY IN COASTAL KERALA DISASTER Disaster is an unpleasant event than occurs with little or no warning which results in economic disruption,
PRESENTERS: BACHELOR OF ARTS- PSYCHOLOGY
 KIBET J. NELLY PRESENTERS: MAGAI N. DORCAS BACHELOR OF ARTS- PSYCHOLOGY DISASTER? A serious disruption of the functioning of a community or society causing widespread human, material, economic or environmental
HAZUS 2014. 7 th Annual Conference
 HAZUS 2014 7 th Annual Conference HAZUS Comparison of Storm Surge Levels from Different Hurricanes to the Newest SLOSH Models for Berkeley, Charleston, & Dorchester Counties Along the SC Coastline. Charlie
UNISDR - Global Risk Assessment: Towards a high-performance environment
 1 UNISDR - Global Risk Assessment: Towards a high-performance environment WCDRR, Sendai 15 March, 2015 Sahar Safaie, Julio Serje Global Assessment Report Team United Nations Office for Disaster Risk Reduction
Customer and Data Services (CDS) Hazus Release 3.0. User Release Notes
 Hazus Release 3.0. User Release Notes") Customer and Data Services (CDS) Hazus Release 3.0 User Release Notes Version 0.4 November 13, 2015 Document Management History Revision History Version Number Date Summary of Changes Team/Author 0.1 10/05/15
Customer and Data Services (CDS) Hazus Release 3.0 User Release Notes Version 0.4 November 13, 2015 Document Management History Revision History Version Number Date Summary of Changes Team/Author 0.1 10/05/15
Seismic Risk Prioritization of RC Public Buildings
 Seismic Risk Prioritization of RC Public Buildings In Turkey H. Sucuoğlu & A. Yakut Middle East Technical University, Ankara, Turkey J. Kubin & A. Özmen Prota Inc, Ankara, Turkey SUMMARY Over the past
reviewed paper Modelling Day and Night Time Population using a 3D Urban Model Monika Kuffer, Richard Sliuzas
 reviewed paper Modelling Day and Night Time Population using a 3D Urban Model Monika Kuffer, Richard Sliuzas (Dipl.-Geogr. Monika Kuffer, ITC, University of Twente, P.O. Box 217,7500 AE Enschede, The Netherlands,
The following was presented at DMT 14 (June 1-4, 2014, Newark, DE).
.") DMT 2014 The following was presented at DMT 14 (June 1-4, 2014, Newark, DE). The contents are provisional and will be superseded by a paper in the DMT 14 Proceedings. See also presentations and Proceedings
DMT 2014 The following was presented at DMT 14 (June 1-4, 2014, Newark, DE). The contents are provisional and will be superseded by a paper in the DMT 14 Proceedings. See also presentations and Proceedings
 Using HAZUS for a Statewide Flood Risk Assessment Steve Cowdin, CA DWR Ken Leep, Cal EMA Problem We frequently receive requests for statewide flood data Who s at risk? What s at risk? Where is at risk?
13 th World Conference on Earthquake Engineering Vancouver, B.C., Canada August 1-6, 2004 Paper No. 2256
 13 th World Conference on Earthquake Engineering Vancouver, B.C., Canada August 1-6, 2004 Paper No. 2256 DEVELOPMENT OF PARTICIPATORY SEISMIC RISK ASSESSMENT PROCEDURE THAT REFLECTS COMMUNITY NEEDS: A
Best Practice of Flood Hazard Map in Japan
 Best Practice of Flood Hazard Map in Japan 1. Hazard map in Japan There are about 1,500 municipalities in Japan, which need to prepare flood hazard map. 510 municipalities have already made and disclosed
ART Vulnerability and Risk Assessment Report September 2012 Appendix C. ART GIS Exposure Analysis
 Adapting to Rising Tides GIS Exposure Analysis The aim of this appendix is to familiarize the reader with the data and methodology that was used to conduct an analysis of shoreline and community asset
Small Dam Hazard Assessment Inventory
 Small Dam Hazard Assessment Inventory What would happen if your dam were to fail? This is a question that most dam owners hope they will never have to answer. However it is a question you, as a responsible
Using Location Information For Better Planning and Decision Support: Integrating Big Data, Official Statistics, Geo-information
 Using Location Information For Better Planning and Decision Support: Integrating Big Data, Official Statistics, Geo-information Rapid Information for Public Policy Increasing demand for information in
Disaster Risk Assessment:
 Disaster Risk Assessment: Disaster Risk Mapping Dr. Jianping Yan Disaster Risk Assessment Specialist Session Outline Essentials on Risk Mapping Map scale, grid size, aggregation unit Requirements for Risk
Creating a File Geodatabase
 Creating a File Geodatabase Updated by Thomas Stieve January 06, 2012 This exercise demonstrates how to create a file geodatabase in ArcGIS 10; how to import existing data into the geodatabase, and how
Guidance for Flood Risk Analysis and Mapping. Changes Since Last FIRM
 Guidance for Flood Risk Analysis and Mapping Changes Since Last FIRM May 2014 This guidance document supports effective and efficient implementation of flood risk analysis and mapping standards codified
AFAD DEPREM DAİRESİ BAŞKANLIĞI TÜRKİYE KUVVETLİ YER HAREKETİ ve ÖN HASAR TAHMİN SİSTEMLERİ ÇALIŞMA GRUBU. (Rapid Estimation Damage)
") (Rapid Estimation Damage) AFAD-RED SYSTEM The technological advances in seismic instrumentation and telecommunication permit the development of rapid estimation of earthquake losses in order to enhance
(Rapid Estimation Damage) AFAD-RED SYSTEM The technological advances in seismic instrumentation and telecommunication permit the development of rapid estimation of earthquake losses in order to enhance
Numerical Modeling and Simulation of Extreme Flood Inundation to Assess Vulnerability of Transportation Infrastructure Assets
 Numerical Modeling and Simulation of Extreme Flood Inundation to Assess Vulnerability of Transportation Infrastructure Assets 2015 University Transportation Center (UTC) Conference for the Southeastern
Cibodas: analysing the fuelwood demand
 CHAPTER 22 Cibodas: analysing the fuelwood demand By: A.G.Toxopeus Department Land Resource and Urban Sciences, International Institute for Aerospace Survey and Earth Sciences (ITC), P.O.Box 6, 7500 AA
How To Manage A Flood In Mozambique
 Flood Risk Management in Mozambique and Sub-regional Trans-boundary Issues UNFCCC regional expert meeting on loss and damage in Addis Ababa, Ethiopia from 13 to 15 June 2012 Ron Cadribo, UNISDR DRR Advisor,
Appendix C: Geographic Information Systems (GIS) Sources, Technical Notes and Additional Maps
 Sources, Technical Notes and Additional Maps") Appendix C: Geographic Information Systems (GIS) Sources, Technical Notes and Additional Maps Geographic Information Systems (GIS) The maps and three-dimensional representations contained in this report
Appendix C: Geographic Information Systems (GIS) Sources, Technical Notes and Additional Maps Geographic Information Systems (GIS) The maps and three-dimensional representations contained in this report
Natural Hazard Risk Assessment in the Australasian Region: Informing Disaster Risk Reduction and Building Community Resilience.
 Natural Hazard Risk Assessment in the Australasian Region: Informing Disaster Risk Reduction and Building Community Resilience Jane Sexton Australia and Disaster Risk Reduction Australian Context Understanding
How can we defend ourselves from the hazard of Nature in the modern society?
 How can we defend ourselves from the hazard of Nature in the modern society?, University of Bologna President of the EGU Division of Natural Hazards Email: stefano.tinti@unibo.it nh@egu.eu GIFT 2013 Natural
Why should communities invest in resiliency? What are the steps communities can take to become more resilient?
 Community Preparedness for Flood Resiliency Nina Peek, AICP New York Planning Federation Board of Directors Senior Technical Director AKRF, Inc. Focus of Today s Presentation Why should communities invest
Advanced tools in water management in The Netherlands
 Advanced tools in water management in The Netherlands Modelling for system knowledge, effective operational management, and policy making Gé van den Eertwegh Rivierenland Water Board The Netherlands PR
CORRELATIONS BETWEEN RAINFALL DATA AND INSURANCE DAMAGE DATA ON PLUVIAL FLOODING IN THE NETHERLANDS
 10 th International Conference on Hydroinformatics HIC 2012, Hamburg, GERMANY CORRELATIONS BETWEEN RAINFALL DATA AND INSURANCE DAMAGE DATA ON PLUVIAL FLOODING IN THE NETHERLANDS SPEKKERS, M.H. (1), TEN
From : Başpınar & Partners Law Firm. Date : 27.06.2014. Subject : Communiqué on Spatial Planning Preparation I. INTRODUCTION
 From : Başpınar & Partners Law Firm Date : 27.06.2014 Subject : Communiqué on Spatial Planning Preparation I. INTRODUCTION Communiqué on Spatial Planning Preparation ( Communiqué ) which is prepared by
Modelling floods and damage assessment using GIS
 HydroGIS 96: Application of Geographic Information Systems in Hydrology and Water Resources Management (Proceedings of the Vienna Conference, April 1996). IAHS Publ. no. 235, 1996. 299 Modelling floods
Track-Risk-Impact-Policy (TRIP) Modeling for the Agricultural Sector
 Modeling for the Agricultural Sector") Track-Risk-Impact-Policy (TRIP) Modeling for the Agricultural Sector Glenn S. Banaguas Environmental and Climate Change Research Institute De La Salle Araneta University Manila Observatory Ateneo De Manila
Track-Risk-Impact-Policy (TRIP) Modeling for the Agricultural Sector Glenn S. Banaguas Environmental and Climate Change Research Institute De La Salle Araneta University Manila Observatory Ateneo De Manila
Flood Risk Assessment in the Netherlands: A Case Study for Dike Ring South Holland
 Risk Analysis, Vol. 28, No. 5, 2008 DOI: 10.1111/j.1539-6924.2008.01103.x Flood Risk Assessment in the Netherlands: A Case Study for Dike Ring South Holland Sebastiaan N. Jonkman, 1,2 Matthijs Kok, 1,3
Disaster Preparedness Training Programme
 Participant resource & learning module Situation Report Disaster Needs Assessment Report Disaster Preparedness Programme Report Disproin.doc June 2000 2/27 Table of Contents BACKGROUND AND USES... 3 THE
Rural Flooding: The Potential Role of Forestry
 Rural Flooding: The Potential Role of Forestry Nadeem Shah, Tom Nisbet, & Huw Thomas Centre for Forestry and Climate Change Structure Background Woodland and Flood Alleviation The Theory. Studies on Woodland
Flooding Hazards, Prediction & Human Intervention
 Page 1 of 10 EENS 3050 Tulane University Natural Disasters Prof. Stephen A. Nelson Flooding Hazards, Prediction & Human Intervention This page last updated on 19-Oct-2015 Hazards Associated with Flooding
GEOENGINE MSc in Geomatics Engineering (Master Thesis) Anamelechi, Falasy Ebere
 Anamelechi, Falasy Ebere") Master s Thesis: ANAMELECHI, FALASY EBERE Analysis of a Raster DEM Creation for a Farm Management Information System based on GNSS and Total Station Coordinates Duration of the Thesis: 6 Months Completion
Master s Thesis: ANAMELECHI, FALASY EBERE Analysis of a Raster DEM Creation for a Farm Management Information System based on GNSS and Total Station Coordinates Duration of the Thesis: 6 Months Completion
Utah State General Records Retention Schedule SCHEDULE 1 GEOSPATIAL DATA SETS
 Utah State General Records Retention Schedule SCHEDULE 1 BIOTA RECORDS (Item 1-26) These are geospatial records that depict wildlife use areas in the state of Utah as determined by wildlife biologists
ISTANBUL EARTHQUAKE RISK AND MITIGATION STUDIES
 ISTANBUL EARTHQUAKE RISK AND MITIGATION STUDIES O. Metin Ilkisik, M. Nilay Ergenc and Murat T. Turk Disaster Coordination Center, Istanbul Metropolitan Municipality, Istanbul, Turkey e-mail: omilkisik@hotmail.com
Minnesota State Plan Review Level 2 Hazus-MH 2.1 County Model for Flooding Dakota County Evaluation
 Overview Minnesota State Plan Review Level 2 Hazus-MH 2.1 County Model for Flooding Dakota County Evaluation Minnesota Homeland Security and Emergency Management (HSEM) is responsible for supporting activities
The development of a flood damage assessment tool for urban areas
 The development of a flood damage assessment tool for urban areas Michael Hammond, A. S. Chen, S. Djordjević, D. Butler, D. M. Khan, S. M. M. Rahman, A. K. E. Haque, O. Mark Urban Drainage Modelling Conference,