Developing a conceptual framework for visually-enabled geocollaboration
|
|
|
- Jack French
- 8 years ago
- Views:
Transcription
1 Developing a conceptual framework for visually-enabled geocollaboration Alan M. MacEachren and Isaac Brewer GeoVISTA Center Department of Geography 302 Walker Penn State University University Park, PA maceachren@psu.edu; isaacbrewer@psu.edu; forthcoming in the International Journal of Geographical Information Science Geocollaboration forthcoming in IJGIS (final version submitted March 2003) 1

2 Developing a conceptual framework for visually-enabled geocollaboration Alan M. MacEachren and Isaac Brewer GeoVISTA Center, Department of Geography, Penn State University maceachren@psu.edu; isaacbrewer@psu.edu; ABSTRACT Most work with geospatial data, whether for scientific analysis, urban and environmental planning, or business decision making is carried out by groups. In contrast, geographic information technologies have been built and assessed only for use by individuals. In this paper we argue that, to support collaboration with geospatial information, specific attention must be given to tools that mediate understanding and support negotiation among participants. In addition, we contend that visual representations have a particularly important role to play as mediators of geocollaborative activities. With these contentions as a starting point, we present a framework for study of visually-enabled collaboration with geospatial information and for development, implementation, and assessment of geoinformation technologies that support that collaboration. The paper concludes with a brief description of two prototype geocollaborative environments that illustrate the use of the framework developed and provide the basis for discussing goals for futher research. 1 Introduction Recent conceptual and technical developments in information technology have the potential to enable a dramatic change in the role of technology in human-human interaction. (Fischer, 2002; Roschelle & Pea, 2002; Varian et al., 1998). Similarly, developments in geographic information science (GIScience), e.g., (Kraak & MacEachren, 1999; MacEachren & Kraak, 2001; Mark, 1999), and in computer graphics/visualization. e.g., (Brown et al., 1999), suggest that we are also on the cusp of a substantial increase in the role of maps, images, and computer Geocollaboration forthcoming in IJGIS (final version submitted March 2003) 2

3 graphics as mediators of collaboration in a range of contexts including scientific inquiry, environmental and urban planning, resource management, and education. In spite of this potential, we have a limited conceptual basis from which to develop or study the use of visuallyenabled collaboration (using geospatial or other information). The primary objectives of this paper are: to outline a conceptual framework for visuallyenabled collaboration with geospatial information through geospatial technologies (an activity that we label geocollaboration) and to demonstrate application of this framework to a pair of case studies from our ongoing research. The goal of the framework developed is to delineate important technological, social, and cognitive parameters that must be considered as we extend, or reinvent, geoinformation technologies to support work by groups. The framework is also intended to provide a structure for understanding the interrelationships among the parameters that define geocollaborative environments, for organizing a systematic program of research in geocollaboration, and for developing approaches to multi-user systems that support rather than impede group work. Particular attention in the framework is given to visual representation as a mediator of group work and we outline an approach to such shared representations grounded in semiotics and theories of boundary objects. We illustrate use of the framework through case studies with two visually-enabled geocollaboration prototypes developed in prior work. One focuses on collaborative visualization and the other on group work using geo-virtual environments (GeoVE). 2 Background Like Roschelle and Teasley (1995) and Jankowski and Nyerges (2001a), we consider collaborative systems to be a subset of the systems used for computer-supported cooperative Geocollaboration forthcoming in IJGIS (final version submitted March 2003) 3
 and to demonstrate application of this framework to a pair of case studies from our ongoing research.")
4 work (CSCW). Cooperation can involve any sharing of information, perhaps by individuals performing very different tasks (e.g., an individual using information visualization to find structure in patterns of web activity cooperating with another developing a marketing plan for web advertising). Collaboration is used here to identify those cooperative activities in which two or more individuals work together on a single task or closely related subtasks, constructing and maintaining a shared problem conception. Thus, we consider computer-supported geocollaboration to involve a committed effort on the part of two or more people to use geospatial information technologies to collectively frame and address a task involving geospatial information. Our approach to geocollaboration draws upon a diverse literature dealing with group (multiparticipant) work. That literature considers collaboration from the perspectives of human sciences, computing, and their integration. For general reviews, see (Horrocks et al., 1999; Kraemer & King, 1988; Mandviwalla & Oldman, 1994). Like Descortis (Descortis et al., 2000), we contend that a combination of conceptual perspectives, drawn from multiple domains, will be essential for understanding collaborative activity in a specific context or crafting an appropriate collaborative system design methodology for that context. While space does not permit a detailed discussion of the relevant literatures, we direct the reader to theoretical frameworks developed in the domains of distributed cognition (Hutchins, 1995), activity theory (Nardi, 1996), cognitive ergonomics (Descortis et al., 2000) and social aspects of groupware for CSCW (Dix et al., 1998). These perspectives, particularly if integrated, have the potential to help isolate and augment specific design issues in collaborative systems. Within GIScience, there is a growing volume of literature on group work with geospatial information; for reviews see (Jankowski & Nyerges, 2001a; MacEachren, 2000, 2001; Nyerges, Geocollaboration forthcoming in IJGIS (final version submitted March 2003) 4

5 1999). Much of the attention has focused on group spatial decision support (GSDS) (an outgrowth of earlier work in spatial decision support systems (SDSS)), with the focus on design of environments that merge GISystems with multicriteria evaluation methods and decision support tools, e.g., (Armstrong, 1993; Jankowski & Nyerges, 2001b; Nyerges et al., 1997). While substantial progress has been made in SDSS and GDSS, see particularly (Jankowski & Nyerges, 2001a), limited attention has been given to collaboration focusing on, or mediated by, visual/graphic displays. Thus the research, generally, fails to address many issues that are likely to be critical for collaboration using the standard tools of GIScience (GISystems, image analysis software, and dynamic maps). Armstrong and Densham (1995) provide one exception to the lack to attention of visual display for group work with geospatial information, detailing a prototype visual aide to geocollaboration in the context of facility location. However, there seems to have been no direct follow up to their ideas. Some work has also been carried out on development of visual tools to support multicriteria decision-making (Andrienko & Andrienko, 2001). The general lack of attention to the role of visual display as a mediator for collaborative work with geospatial information is particularly surprising, since all GISystems use visual, map-based interfaces. The conceptual framework we detail in this paper will support integration of visual displays as a mediator of group work in a range of domains for which group work with geospatial information is critical. These include science (e.g., environmental change, health-environment interactions, population dynamics), science education, situation assessment and planning for crisis response, as well as decision support for planning and environmental management (traditional application domains for SDSS and GDSS) as well as for crisis management and related strategic planning activities. Recent research in two non-giscience domains provides a Geocollaboration forthcoming in IJGIS (final version submitted March 2003) 5
, limited attention has been given to collaboration focusing on, or mediated by, visual/graphic")
6 base from which to address the potential and challenges associated with visual mediation tools to support geocollaboration in these and other contexts: collaborative visualization and collaboration in virtual environments. Each is discussed below, briefly, with an emphasis on the potential application to visually-mediated geocollaboration. 2.1 Collaborative Visualization Large, distributed multidisciplinary teams now play an important role in scientific work. In the U.S., for example, there have been calls for geography to direct more attention to big science and multidisciplinary collaborations (Wilbanks et al., 1997) and a large proportion of science funding is allocated to multi-investigator (collaborative) research projects (e.g., through initiatives dealing with human implications of global environmental change, biocomplexity, digital government, and information technology research). Visualization systems with the potential to facilitate this science have, however, been developed for use by single users. To meet the needs of interdisciplinary, multi-investigator science as well as planning and decision making, the focus of visualization research and development has begun moving towards support for groups, including distributed groups (Brodlie, in press; Brodlie et al., 1998; Brown et al., 1996; Friesen & D.Tarman, 2000; May, 1999; Rhyne, 1998; Watson, 2001). However, despite technological successes in the implementation of shared visualization tools (including ones for geospatial data visualization in the contexts of environmental management (Bajaj & Cutchin, 1999), oceanographic and meteorological studies (Pang & Fernandez, 1995), and hazards research (Padula & Rinaldi, 1999), we know very little about the impacts of shared visualization on group work or how to design effective group geovisualization tools. Geocollaboration forthcoming in IJGIS (final version submitted March 2003) 6

7 Wood, et al (1997) propose that the ideal collaborative visualization systems should support both instructor-driven collaborations (in which one individual leads a group termed chauffer-driven in the CSCW literature) and interaction among multiple independent participants. For the later, they suggest that the environment should support data exchange, shared control, dynamic interaction, ease of learning, and shared application modes. Perhaps the best-tested collaborative system mediated by visualization is the UARC/SPARC collaboratory project (Olson et al., 1998). The collaboratory (a virtual laboratory accessible from remote locations, for discussion of development of the collaboratory concept, see: (Cerf et al., 1993)) allows users to organize their data streams into hundreds of individualized displays 3D visual renderings and virtual realty rooms - that are then shared (asynchronously) with other collaborators (Olson & Olson, 2000). While the UARC/SPARC collaboratory includes collaborative visualization tools, it is designed to support research in physics (thus is not focused on geospatial information) and empirical assessment of the collaboratory tools has not yet focused on the social or cognitive impacts of the role that visualization tools serve in the collaborative process. In our own previous work (Brewer et al., 2000; MacEachren et al., 1999), we have focused specifically on development (and usability) of collaborative geovisualization tools to support group data exploration (one of several tasks that might be undertaken in a geocollaborative activity). Some of this work is discussed below as a case study application of the conceptual framework for visually-mediated geocollaboration that we present in section 3. Geocollaboration forthcoming in IJGIS (final version submitted March 2003) 7
.")
8 2.2 Collaboration in Virtual Environments Proponents of Collaborative Virtual Environments (CVEs) contend that such environments have the potential to improve both local and distributed collaborative work significantly (Pantelidis, 2000). There are several different display-interaction forms that can be lumped into the category of collaborative virtual environments; these include large screen wall displays, table-top 3D manipulable displays, CAVEs, and Immersadesks. CVEs have been developed for a wide range of applications, including: creation of collaborative gaming environments (Szalavári et al., 1998); visualization of seismic geoscientific data by co-located individuals (Lin et al., 1998); streamed geospatial imagery (Taylor, 2001); development of collaborative tools for battlefield analysis (Jones et al., 1998); and simulations to facilitate learning about complex environments (Roussos et al., 1999). Almost all CVEs rely upon visual displays as a mediator among participants and create spaces within which participants interact. Thus they all rely upon spatial metaphors whether or not they depict geospatial data. Armstrong (2001) argues that teleimmersive distributed environments for working with geospatial information represent a grand challenge that, if met, can enable productive work in many contexts. More broadly, Hindmarsh, et al (2000) suggest that high quality graphical display of real and imagined scenes could become the typical every day work medium for distributed interaction among experts. However, these authors also point out that one of the identified barriers to successful CVE implementation is our limited understanding of how people interact with objects, and with each other, in virtual displays. Research has been undertaken to improve understanding of traditional interaction with geospatial information so that the interaction can be duplicated within a multimodal CVE. For example, Cohen and colleagues (1999; McGee et al., 2000) have studied collaborative Geocollaboration forthcoming in IJGIS (final version submitted March 2003) 8

9 interaction by Marine Corps commanders with paper maps for command and control operations. The specific goal was to improve the understanding of interaction with 2D static maps, so that this understanding could guide development and design of a voice, pen, and touch-based interface to a large screen display (McGee & Cohen, 2001; McGee et al., 2001). Related work on CVEs for collaborative command and control applications (at the U.S. Air Force Research Laboratory) has resulted in a field deployable multimodal system that allows the display and manipulation of real time multimedia data on large screen displays (Jedrysik et al., 2000). The goal underlying this work is to link command center wall displays with field deployable data walls to improve collaboration among multiple commanding agencies. In an effort focused specifically on support for multiple, interacting users, May (1999) developed the Human Information Workspace (HI-SPACE). HI-SPACE is a large-screen, rear projection, table display environment that supports hands-free, multi-user, untethered interaction with an electronic information space. Two unique aspects of HI-SPACE are its support for multiple, simultaneous cursors and its ability to support integration of physical objects, known as phicons, as part of the rendered scene (Figure 1). {figure 1 about here} In contrast to research on collaborative visualization (which has emphasized software design and implementation), work on CVEs has been more human-centered, directing considerable attention to how CVEs are used and how human behavior is modified. Associated humancentered research questions that have been addressed deal with: interface design and system usability, support for multi-user representation and presence, and representation of user s individual views (Park et al., 2000) all topics that are relevant to visually mediated geocollaboration using large screen displays. Related usability and interface design research with Geocollaboration forthcoming in IJGIS (final version submitted March 2003) 9
 has resulted in a field deployable multimodal system that allows the display and manipulation of real time multimedia data on large screen displays (Jedrysik et al.")
10 CVEs has been directed to the development of 3D human-centered interfaces (Goddard & Sunderam, 1999), the use of software agents for enhanced usability (Noll et al., 1999), and the design and implementation of metaphors that reduce the cognitive load for participants (Roussos et al., 1999). Findings indicate that users within a CVE do not want to be tethered to glove-based or controller-based interaction (e.g. a wand or pointing device). Therefore, a research goal is to develop methods that make interaction with (and within) CVEs more natural. One of the real barriers to co-located multi-person collaborative work within current CVEs is that the systems often restrict control of the display to one user at a time. Similarly, differentplace collaboration within current CVEs is impeded because the nature of social interaction within a CVE differs from that of real (face-to-face) interaction, but current systems do not provide tools to address that difference (Tromp et al., 1998). For example, when collaborators are in the same location, they often use gestures to facilitate discussion about objects in the environment, however, when collaborators are in different locations, they must develop alternatives (e.g., verbal expressions or virtual gestures ) which are often less successful and can interfere with understanding each other s perspectives (Dix et al., 1998). 3 Conceptual framework In this section, we develop a conceptual framework to support visually-enabled geocollaboration. The objective of the framework is to provide a basis from which to design, implement, and understand the use of collaborative geospatial information technologies, with particular attention to dynamic visual displays as mediators for group work. The collaborative process has many dimensions. Here we identify six that we consider particularly important from the perspectives of both system design and evaluation. The overall Geocollaboration forthcoming in IJGIS (final version submitted March 2003) 10

11 approach we take is a human-centered one that puts as much emphasis on the needs of human users as on the technology necessary to meet those needs (Brown et al., 1999; Flanagan et al., 1997). The first three dimensions of our framework focus on the human components of a collaborative environment and include: problem context, collaboration tasks, and perspective commonality. The second three dimensions (while still attending to users) emphasize the computing infrastructure (e.g., networking, visualization) that can support collaboration, thus they are considered system dimensions. These system dimensions include: spatial and temporal context, interaction characteristics, and tools to mediate group work. We do not contend that these dimensions represent an exhaustive list. We do believe, however, that they are among the most important for developing geocollaboration environments, testing their usability, and understanding their use and usefulness. 3.1 Problem context Geocollaboration, as defined above, is an activity that can and should be supported in a variety of problem contexts. Here, we identify four problem contexts within which geocollaboration may be undertaken and for which the nature of that collaboration (and the necessary enabling tools) is likely to differ: knowledge construction and refinement. The focus here is on tools that facilitate collaborative extraction of information from data and meaning from that information. design. The focus here is on support for group work directed at creating an entity. Examples include designing a new regional park, designing a new map of U.S. soil productivity, or collaboratively designing a GISystem application. decision-support. Focus here is on group decisions that make use of geospatial information and its meaning to make decisions about places (e.g., decisions about facility location, distribution of personnel and supplies in a crisis, delineating the Geocollaboration forthcoming in IJGIS (final version submitted March 2003) 11

12 bounds of an ecological preserve). Decisions, of course, are also part of both knowledge construction and design. training and education. The emphasis here is on facilitating group training and learning activities. Examples range from support for earth science education to training for emergency management or military activities. 3.2 Collaboration tasks A variety of attempts have been made to develop typologies of tasks for group work, see, for example: (Horrocks et al., 1999; McGrath, 1984). While they provide a useful place to start, these typologies address the problem primarily from the context of business management, thus require modification and extensions to fit problem contexts such as scientific knowledge construction, spatial decision support, highway design, or training and education. For geocollaboration, we have developed a typology of tasks built upon a framework that relates a pair of complementary meta-task categorizations (figure 2). The first, applicable to the contexts of group decision-making and design, borrows from McGrath (1984) who, building on Hackman (1976), delineates four general components within the process of group work, to: generate (ideas and options), negotiate, choose, and execute. The second borrows from MacEachren and Kraak (1997) who, building on earlier work by DiBiase (1990), and Tukey (1977), characterize the uses of geovisualization in support of scientific research as having four stages: exploration, analysis, synthesis, and presentation. These stages complement those identified by McGrath and can be considered stages of group work in knowledge construction and refinement generally. They also are applicable to the development of tools for active, collaborative learning (Fortner, 1996). {figure 2 about here} Geocollaboration forthcoming in IJGIS (final version submitted March 2003) 12

13 3.3 Commonality of perspective The study of human-computer interaction (HCI) often considers participant characteristics that might influence tool and system success. These include physical abilities, user disabilities, cognitive and perceptual abilities, personality differences, cultural and international diversity, and age (Shneiderman, 1998) as well as user experience (Nielsen, 1993). For collaborative systems, we must consider group characteristics as well as those for individuals. For groups, perhaps the most important distinction to make involves the commonality of perspective held by group members about the problem, the choice of appropriate methods, and the desired outcomes. As McGrath (1984) discusses, group work grounded in cooperation (participants have a shared perspective) is quite different from that grounded in conflict (thus emphasizing negotiation among participants with competing perspectives). Here, we re-characterize this dichotomy as a continuum from conflict to cooperation. (figure 3). {figure 3 about here} Spatial decisions (e.g., in land use planning, environmental management, highway routing) are generally contentious. Geocollaboration methods and tools for these applications must support not only shared understanding but also resolution of disputes among competing points of view. Scientific knowledge construction by research teams working together toward a common goal is likely to be more cooperative. For such research teams, methods and tools must support innovative thinking as well as comparison and synthesis of what might initially seem to be divergent ideas. As team size grows or becomes more interdisciplinary, the likelihood for tension among competing scientific paradigms will increase, increasing the need for tools that support conflict resolution. Similarly, panels of scientists developing scienctific policy may be quite contentious, requiring tools similar to those applicable to any contentious decision-making. Geocollaboration forthcoming in IJGIS (final version submitted March 2003) 13

14 3.4 Spatial and temporal context The spatial and temporal context of group work activities fundamentally determines the nature, and potentially the success or failure, of geocollaborative work. As pointed out by Ellis and colleagues (1991) (and for geospatial information by Armstrong (1993) and Shiffer (1998)), collaboration can involve participants sharing work at the same or different place and the same or different time (figure 4). For geocollaboration generally, a dynamic visual display becomes the mediator that supports collaboration in these four meeting situations, particularly for those that are different-place. {figure 4 about here} Much of the research directed to geocollaboration has focused on same-time same-place group spatial decision support, collaborative planning, and similar applications (Armstrong, 1993). Nyerges and colleagues (Jankowski & Nyerges, 2001a; Nyerges, 1999) have pursued a systematic program of research focused on GIS-supported, same-time same-place collaborative decision making, design and implementation of group systems, and development and application of methods for evaluating these systems. Recent advances in geospatial information technology that support large distributed databases and on-line GIS have lead to several prototypes that facilitate different-place collaboration e.g., (Churcher & Churcher, 1999; Jones et al., 1997). Such efforts in GIScience toward different-place collaboration are quite limited and have emphasized using web-based groupware integrated with webgis (through use of tools such as electronic whiteboards for sketching on maps, see: (Churcher & Churcher, 1999; Rinner, 2001). 3.5 Interaction characteristics Interaction among participants within a geocollaborative environment involves (at least) three interrelated factors. First, is group size and aggregation (how many participants are Geocollaboration forthcoming in IJGIS (final version submitted March 2003) 14

15 collaborating and what if any subgroups are they organized into?). Second, is the topology of connections among group members or subgroups (who is connected to whom?). Connection types include situations with every participant connected to every other (e.g., how might a group of students using multi-participant chat and electronic whiteboard tools conduct a class project on regional landuse change), hierarchical networks (a military command hierarchy where communication between units goes through the unit leader), and many others. Third, are constraints on form and flow of information among participants (what promotes or impedes information dissemination crucial to collaboration?) (figure 5). While partly a technological issue, these constraints are often the result of group social structures. For example, different modes of social and cultural organization will impose rules or guidelines that control or constrain information exchange. A democratic collaboration is likely to dictate two-way communication along all links without directional preferences. On the other hand, military hierarchies and other command-and-control applications will give preference to unidirectional communication. For example, communications from a crisis management command center may contain both information and directives but flows back to the command center from the field may be restricted only to information. {figure 5 about here} Social Network Analysis (Wasserman and Faust, 1994) provides a formalized approach to support the study and characterization of the relationships, interdependencies, and structure and linkages of individual nodes in a network. Social networks use explanations of the concepts, definitions and processes of how individual social units are linked to one another to identify patterns among relationships, and gain an understanding of the underlying network structure (Wasserman and Faust, 1994). Another important aspect of the connections among participants Geocollaboration forthcoming in IJGIS (final version submitted March 2003) 15
 (figure 5).")
16 is the degree of anonymity allowed or imposed. For related ideas in the context of groupware and multi-user interface design, see: (Mandviwalla & Oldman, 1994; Prates et al., 1997). Within same-time (synchronous) collaboration (whether same- or different-place) the form and flow of information can be further categorized temporally. Possible categories are: (1) sequential interaction, one participant at a time talking and/or manipulating system parameters, (2) simultaneous interaction, multiple participants talking and/or manipulating system parameters at the same time, (3) mixed participation, where one individual controls the display but all can communicate verbally. These categories are conceptually similar to ones proposed, by Oviatt et al. (Oviatt et al., 1997), for integrating modes of interaction (e.g., speech and gesture) with single-user multimodal systems. 3.6 Tools to mediate group work Considerable attention has been given to development of tools that mediate and facilitate group work; the literature of CSCW is replete with examples, see: (Grudin, 1990; Mandviwalla & Oldman, 1994) for overviews. CSCW technologies, often called groupware, can be characterized as information technology that allows people to work together more effectively, with an emphasis on sharing tasks and decision-making (Ackerman, 1994). Many of these technologies are generic ones, such as those for Internet chat and video conferencing. Others are targeted to the four problem contexts delineated above: knowledge construction, design, decision-making, and training/learning. We address each below, briefly Knowledge construction: Research on groupware to enable knowledge construction has focused on methods and tools that support information sharing, group problem conceptualization, and joint knowledge Geocollaboration forthcoming in IJGIS (final version submitted March 2003) 16
 mixed participation, where one individual controls the display but all can communicate verbally.")
17 development strategies, e.g., development of diagrammatic reasoning methods for structuring work (Shum et al., 1997). The OASIS system is among the few efforts thus far to develop groupware for geospatial knowledge construction (Mesrobian, 1996). OASIS provides a flexible, extensible object oriented environment for visualization-enabled cooperative work. The project, however, focuses primarily on tools that mediate among heterogeneous software applications rather than on tools that mediate among human collaborators. Our own collaborative visualization efforts also address visual mediation of knowledge construction (and are discussed in more detail in section 5 below) (Brewer et al., 2000) Design: Most design work today (e.g., in software engineering or urban development) requires the contributions of multiple individuals with interdisciplinary expertise. Research, however, has just begun to address the role of technology in supporting design teams. Patel et al. (1997), in one example, focused on collaborative software design, analyzing the functional and nonfunctional requirements necessary for virtual teams to undertake different-place design activities. Their findings indicate that tools - created to help groups develop and understand both task structure as well as the role of collaborators in meeting overall group objectives - assist the process of asynchronous collaborative design and rapid system development. In work focusing on same-place, synchronous design, Arias et al. (2000) have developed a virtual workbench to display map-based information that supports collaborative participatory design of neighborhood transportation systems and bus stop location. Their research focuses on facilitating shared understanding among co-located design teams by analyzing the social and technical aspects of design teams at work on real world geographic problems. They focus particularly on the role of boundary objects (see section 4.1 for discussion of boundary objects) Geocollaboration forthcoming in IJGIS (final version submitted March 2003) 17

18 and physical externalizations that promote team discussion and collaborative thought development Decision-making: Multiple (often conflicting) criteria, diverse participants, and vague problem specifications characterize decision-making situations that involve geospatial information (Xiang et al., 1992). A common approach to dealing with these factors is to integrate multicriteria evaluation (MCE) methods and electronic voting tools with GISystems (Jankowski et al., 1997). The basic aim of MCE is to integrate multiple, often conflicting, objectives comprising multiple criteria, to indicate decision makers' preferences, and to allow testing of ranked and weighted alternatives (Carver, 1991; Jankowski & Richard, 1994). While MCE was integrated with GIS in the 1990s (Carver, 1991) (note: much of the follow up work in this vein appears under the label SDSS), limited attention has been directed to the role of visual displays as a mediator for the GISenabled MCE process specifically or in SDSS or GDSS research, more generally. There is also a clear need for methods that account for mixed information (qualitative and quantitative) in decision-making (Munda, 1994). Visual display may be particularly useful as a mechanism through which qualitative information can be integrated into the process Training/Learning: Work in computer supported collaborative learning (CSCL) has been implemented to support multiple educational levels. In the earth sciences, specifically, Fortner and Mayer (1996) focused on K-12 collaborative learning activities that make use of satellite images to support study of global environmental change. These authors characterized collaborative learning as processes that are engaging and that promote exploration, concept development, elaboration, Geocollaboration forthcoming in IJGIS (final version submitted March 2003) 18

19 direct application and assessment (Fortner, 1996). Collaborative learning tools and online discussion forums to promote distance education are being developed and deployed to educate non-traditional professional students who cannot spend substantial amounts of time away from work (DiBiase, 2000; Janicki & Liegle, 2001). The supporting tools focus on asynchronous activities and (thus far) typically rely on for instructor-student collaboration and threaded discussions for student-student collaboration. 4 Visual mediation for geocollaboration As noted above, the role of visualization (or visual representations more generally) as a mediator of group work has been given very little attention. Below, we distinguish between visual, mediating representations that depict the objects of collaboration (information and perspectives on that information) and those representations that depict the activity of collaboration (collaborators and their actions). In section 4.1, we consider the use of visual representations as devices through which perspectives can be shared and information meaning rationalized. Next, in section 4.2, we consider problems of representing participants and their actions in ways that enable group work (e.g., that facilitate dialogue among participants) while not interfering with the information representations around which collaboration is taking place. 4.1 Representing information Visual representations of geospatial information have the potential to provide a display space (frame of reference) within which participants can share and integrate information, compare perspectives, and negotiate approaches and solutions to problems. More specifically, visual displays can be used as: shared objects to talk about: to depict selected information, provide geo-context, and enable information integration; Geocollaboration forthcoming in IJGIS (final version submitted March 2003) 19
 typically rely on e-mail for instructor-student collaboration and threaded discussions for student-student collaboration.")
20 shared objects to think with: to develop, clarify, and support structuring of arguments; shared objects to coordinate perspectives and actions: to compare perspectives, mediate among knowledge domains of participants, link perspectives across scales, and enable joint activity. This categorization extends one first proposed by Arias and colleague between objects to talk about and think with (Arias et al., 2000). Elsewhere, MacEachren (submitted) focused on geovisualization more specifically as the object of collaboration, a device to support dialogue, and a device to support coordinated work. Armstrong and Densham (1995) present some initial ideas about the role of cartographic representations as mediators for geocollaboration, in the context of group decision-making specifically. They propose a set of new map types designed to facilitate the process of making comparisons among alternative facility location scenarios, thus map types that act as shared objects to coordinate perspectives (and perhaps subsequent actions). In what may be the only study thus far to investigate empirically the use of maps and related graphics as mediators for group work with geospatial data, Jankowski and Nyerges (2001b) found that maps were used primarily in the analytic-integration phase of a simulated decisionmaking process (thus as shared objects to talk about, or perhaps to think with). As the authors point out, the limited role found for maps and graphics in the exploratory-structuring phase of the process may have been due to the particular software configuration used in their study. The configuration grafted their Spatial Group Choice software tools onto a commercial GISystem (ArcView 2.1 ). It included no extensions (to the ArcView visual display methods and tools), thus, it lacked specific support for group dialogue or for coordinating perspectives or actions. That their results found only limited use of standard GISystem-based mapping tools in a Geocollaboration forthcoming in IJGIS (final version submitted March 2003) 20
 focused on geovisualization more specifically as the object of collaboration, a device to support dialogue, and a device to support coordinated work.")
21 collaborative setting reinforces our point that while groups can adapt to, and use tools built for individual work, such tools will not support group work effectively. In one of the few attempts to develop visual tools intended specifically to facilitate group work with geospatial information, Rinner (1997; 1999) focuses attention on how to graphically mediate geo-referenced discussions within a planning context (thus on shared objects to think with and, potentially, to coordinate perspectives and actions). He considers geo-referenced discussions to have two primary components: (1) arguments (contained in messages) and (2) geographical objects (e.g. houses, parcels, roads). Rinner s approach to enabling discussion incorporates map-based graphics within a moderated discussion format that uses maps as vehicles for sharing as well as storing information. The prototype system allows users to access map locations to which arguments refer, attach a geographical reference to each new argument, access discussion messages through map symbols that signify geographical objects, and attach new messages to a map object or region. The dialogues through which groups solve problems or reach consensus with Rinner s environment, or ones like it, are grounded in the meanings attached to both geographical objects and arguments in the dialogue. The meanings, in turn, are constructed, shaped, and changed by the interaction of people with each other and with systems that encode the information. To facilitate geocollaboration, attention must be directed to enriching the connections between visual and database representations and between both of these and the meanings (i.e., interpretations) that each user brings to the group situation. Semiotics, the science of signs (i.e., signification) and sign systems, offers one approach to creating a semantic framework through which the meanings associated with geospatial information in collaborative situations can be understood and managed. A fundamental concept Geocollaboration forthcoming in IJGIS (final version submitted March 2003) 21
22 in semiotics is the semiotic triangle (Pierce, 1955) which itself signifies the three components making up a sign, the referent, sign-vehicle, and interpretant (figure 6). The referent is the entity being represented (e.g., a particular object such as a lake or an abstraction such as a land use category). The sign-vehicle stands for the referent; where blue text labels might stand for a specific lake and the color red might stand for the category urban seen anywhere on the display. The interpretant is the meaning or interpretation derived by a user from the sign-vehicle about the referent. For a comprehensive discussion of the semiotic triangle and of semiotics relevant to visual representation of geospatial information, see: MacEachren (MacEachren, 1995). {figure 6 about here} In a collaborative environment, maps and components of maps (e.g., a line depicting a highway on an urban master plan or an isosurface depicting a severe precipitation event in a scientific visualization environment) act as sign-vehicles standing for objects in the world that can serve as the focus of a dialogue. In Rinner s (1997) environment, discussed above, the dynamic link between map objects and arguments provides an explicit connection between the sign-vehicle (the map or map object) and a wider semantic framework within which the intepretant is instantiated. This connection, in turn, increases the potential for map objects (or other visual display elements) to serve as effective external representations of boundary objects. Boundary objects are constructs (partially shared meaning relationships interpretants in semiotic terms) that provide a meeting ground among perspectives held by different participants in a collaborative activity (Star, 1989). They are objects that all parties in a collaborative situation share some understanding of - but often only partially. Thus, they provide an anchor/hook for building greater shared understanding. In the case of Armstrong and Denshem s Geocollaboration forthcoming in IJGIS (final version submitted March 2003) 22
23 (1995) cartographic mediators for geocollaboration discussed above, their demand and supply maps are likely to serve as external representations of boundary objects through which participants can structure discussion. All participants have some understanding of the concepts of, and components in, supply and demand and the map depictions anchor those concepts in the characteristics of particular places. By jointly interacting with the map, participants can begin to understand where their conceptions coincide and differ. Precipitation represents another concept (relevant to our case studies below) that can serve as a boundary object, for example in a dialogue between a climatologist and a hydrologist. The interpretant generated by the sign-vehicle of precipitation (whether spoken, instantiated as text, or instantiated as a colored region on a map) is similar but not identical for the two individuals. The boundary object can provide a portal from one perspective to the other (Harvey & Chrisman, 1998) and can thus facilitate resolution of conflict. For the example posed above, the common understanding of precipitation provides an initial basis for dialogue while the differences that become apparent as the dialogue progresses help to articulate the differences in perspective that might go well beyond this one concept. In this case, the initial display elements instantiate boundary objects to talk about. Perhaps more challenging is the design and implementation of visual tools that instantiate boundary objects to think with and/or to coordinate perspectives, particularly in cases of conflict. A goal for visual tools designed to support coordination of perspective is to provide such boundary objects within an environment that enables identification of differences in interpretants for any sign relationship and (for some applications) reconciliation of those differences (Figure 7). One example is use of manipulable visual tools as an interface to parameters of a simulation model, allowing collaborators to iteratively work toward a common Geocollaboration forthcoming in IJGIS (final version submitted March 2003) 23
24 understanding of the impact of factors on a process (e.g., the downstream impact of different flood control devices). {figure 7 about here} For digital geospatial data, the sign relationship is often an indirect one, with the real-world referent signified in the database through some abstract construct and the visual sign-vehicle treating that database sign vehicle as the referent of a second linked sign. Since current geospatial databases (at least non-experimental ones) provide no mechanism to encode meaning, important information (the interpretant of the database sign relationship) is lost. As a result, the display s human user must rely on a combination of their own prior knowledge, knowledge of their collaborators, and characteristics of the display itself to provide a context for generating an interpretant. Linking map-based sign-vehicles to arguments in a collaborative setting provides a mechanism through which meaning might be captured and encoded in the database for subsequent use. 4.2 Representing participants and their actions When individuals collaborate in the same-place, without the assistance of technology, they are able to observe each other s actions. This interpersonal contact provides important, often unspoken, information about attitudes, intentions, motivations, and strategies that can facilitate the process of dialogue among the participants. These unspoken cues (shrugs, grimaces, ums and uhs ) are termed backchannel feedback (Dix et al., 1998). Collaborators use such cues to indicate that they are ready to interject, take control, or speak. Dix et al (1998) provide an indepth discussion of the role of back channel feedback in conversations and its incorporation in system design. When technology intervenes, these aspects of normal dialogue are often missing. Geocollaboration forthcoming in IJGIS (final version submitted March 2003) 24
25 This absence is obvious for different-place collaboration, where participants might be represented only by an avatar or text ID and their actions represented only by outcomes, with the process of achieving outcomes often hidden. Even in same-place collaboration, technology designed to enhance the experience in some ways can interfere with normal dialogue (e.g., the stereo goggles typically used in an immersive virtual environment restrict the participant s view of anything other than the display screen for details, see section 5.2 below). Taking full advantage of visual tools designed to facilitate geocollaboration, then, will require attention to the representation of participants and their actions. Such representations must be integrated with displays of the information that collaboration is about, in ways that do not impede participants abilities to use that information. These representations of participants must provide mechanisms to depict, for each participant: their own presence in the environment (providing context against which to judge the location, viewpoint, and perspectives of other participants); their own actions on objects in the environment and toward other participants; other participant s presence in the environment; other participant s deictic actions toward objects, each other, and the user. Potential representations of participants and actions can take two general forms, representations embedded within the information display (e.g., the avatars and light beam pointers described below for collaborative GeoVirtual Environments) or representations separate from the primary information display. The advantage of the former is that the user s attention can remain on the information display at all times. The disadvantages are that the display is more complex and that some actions cannot be represented effectively within the constraints of the information display. A separate representation of participants and their actions, that can be visible or hidden at the discretion of each participant, is more flexible and can usually encode Geocollaboration forthcoming in IJGIS (final version submitted March 2003) 25
26 more information but may distract participants from the primary information display. One example of a minimal representation that limits the potential for distraction from the primary task of group activity is Erickson and Kellogg s (2000) social proxy graph, an abstract depiction of users, their presence, and their activity; the social proxy graph is visible to all users and represents the relative activity of each in a conversation over time. For group work with geospatial information, there is a need to represent not only who is participating at what level, but also which representations of data they are using and what they are doing with those representations. We have implemented an initial prototype participant watcher designed to support representation and analysis of participants and their actions. The prototype watcher is designed to track the use of a multi-window geovisualization display (specifically a map, scatter plot, and parallel coordinate plot - PCP) used in knowledge construction activities (figure 8). {figure 8 about here} We are now working on a plan for usability assessment of this and alternative representations of participants and their actions. As with our initial implementation, one anticipated use of the display is for post-session analysis of collaborative work. Our efforts thus far have focused on representing who is interacting, when each participant is interacting, and what each participant is doing. A more challenging task for future research is to represent how the visible user activities relate to user goals within the problem/task context. 5 Case studies In this section, we present case studies of two visually-enabled geocollaboration prototypes, one building on prior work in collaborative visualization, the other on prior work in GeoVE. The Geocollaboration forthcoming in IJGIS (final version submitted March 2003) 26
27 case studies illustrate application of the conceptual framework outlined in section three. In addition, they serve to begin addressing some issues raised in section four concerning how to develop visual mediation methods and tools that support geocollaboration effectively. Both case studies focus on understanding multi-dimensional space-time environmental data in an effort to achieve new insights concerning environmental processes and to predict (and perhaps mitigate) environmental change. While the prototypes share a focus on group work (by scientists) with spatiotemporal environmental data, they differ in the kinds of technology used (desktop versus semi-immersive large-screen), in the kinds of visual representations used to mediate collaboration (2.5D animation versus 3D integrated space-time views), and in the spatial-temporal context for collaboration (emphasis on different-place same- and different-time compared to same- and different-place same-time). Our goal in this section is not to provide a comprehensive discussion of the research projects highlighted (related discussion appears elsewhere, relevant citations are below). Instead, we use the projects (each of which influenced development of the conceptual framework outlined above) as a vehicle for demonstrating the use and usefulness of the conceptual framework presented and for identifying research questions. 5.1 Same-time different-place collaborative geovisualization Our first case study focuses on a prototype, desktop, different-place geovisualization environment developed to support collaboration by a team of multidisciplinary scientists as they explore complex spatiotemporal data. The environment consists of a suite of integrated software components designed specifically to facilitate collaboration among users who are exploring time series of climatic data and enable them to share knowledge as they identify patterns and Geocollaboration forthcoming in IJGIS (final version submitted March 2003) 27
28 processes (figure 9). The system allows multiple users to control parameters of temporal database queries and subsequent time series animation, see (Brewer et al., 2000; MacEachren et al., 2001) for details. Actions (zoom, rotate, classify) performed on one machine are passed to other connected machines through a server-client system. Sections below apply the 6-part framework presented above to discussion of this collaborative geovisualization prototype. {figure 9 about here} Problem context: For this case study, two similar applications were targeted: understanding time series temperature and precipitation regimes for the Susquehanna River basin of Pennsylvania, New York and Maryland and understanding monthly temperature patterns for Mediterranean Europe. For both, the scientists with whom we were collaborating were interested in identifying topographical and spatial factors that may affect regional (and global) climate regimes. In relation to the conceptual framework outlined above, this collaborative prototype was designed to support knowledge construction, but extensions have been considered that support risk assessment and decision-making applications as well as science education Collaboration tasks: During in-depth individual and group interviews with six participating scientists, we elicited responses regarding what types of tasks the scientists would attempt to accomplish when using a distributed map-based data exploration and analysis system. A detailed account of our interview methods and the initial findings is reported in (Brewer et al., 2000). Here, we reexamine findings in relation to the four kinds of collaboration tasks detailed above for knowledge construction: explore, analyze, synthesize, and present. Geocollaboration forthcoming in IJGIS (final version submitted March 2003) 28
29 For collaborative exploration, one participant discussed the role of maps in the task of brainstorming, or posing what if scenarios. Other participants emphasized specific manipulation capabilities needed to support exploration (e.g., dynamically selecting which data to depict, focusing on subsets of data) and specific mechanisms that support sharing of ideas (e.g., the ability to highlight features or otherwise draw attention to them). For collaborative analysis, the participants saw map-based computer displays serving as a mediator between different data sources and scales of analysis that would help place all users on the same page during collaborative discussions. In addition, split screen views were discussed as a way to support comparison (and coordination) of perspectives. For different-place collaboration, the ability to know what others are doing was seen as important by most participants as was the ability to use voice communication to discuss perspectives. For collaborative synthesis (group work to coordinate perspectives, develop an understanding of differences among perspectives and, where practical, develop a common perspective), substantial differences in typical map/display use across disciplines were noted. Among the more important were the different spatial and temporal scales that disciplines emphasize and the need for collaborative environments to support tools for relating scales. Display format was also an issue discussed. Most users felt that a table-top display would have advantages over a wall display for generating active participation among participants (and active participation should lead to more effective and useful synthesis). Few (if any) existing tools support group synthesis activities, making development of such tools a particular challenge. For collaborative presentation, one participant indicated that we can t communicate (spatial characteristics) without a map. Three participants noted that maps were important for representing temporal (as well as spatial) information (in time series analysis, query by season, Geocollaboration forthcoming in IJGIS (final version submitted March 2003) 29
30 or finding cycles and trends). In relation to display format, large screen displays were seen as useful for presentation to groups (with wall displays better than table-top displays for this purpose). Beyond these four tasks, there was consistency across the group in a view that multivariate, multiscale map displays that depict change over time are important prompts for collaborative work in environmental science. Overall, a common idea was that maps help to provide the contextual reference information (boundaries, roads, etc.) to allow interdisciplinary idea sharing. In addition, one participant noted that physical scientists often treat maps as an input to process modeling while social scientists consider maps to be presentational devices (emphasis added). Thus, disciplinary conventions may have an impact on the mediating role of visual display and the stages of group work where it is most successful Commonality of perspective: Individual interviews addressed the potential for a distributed collaborative system (derived from the prototype) to support group work on activities that require integrating multiple scientific perspectives. Following from discussion of analysis scales at which different disciplines focus, a key capability for collaboratively exploring environmental processes is to support representation of connections among processes across scales. A second issue raised was the need to support both individual work (allowing individuals to develop their ideas in a private display space before sharing them with the group) and comparison of perspectives (e.g., thus the ability to broadcast that display to the entire group for discussion and possible synthesis). Geocollaboration forthcoming in IJGIS (final version submitted March 2003) 30
31 5.1.3 Spatial and temporal context: As noted above, the focus of this case study was on same-time different-place collaboration. Interview results, however, also indicated that participants could envision using the system for a range of collaborative situations. Situations discussed included same-time same-place planning and decision-making (particularly as enabled by large screen displays) and different-time (both same- and different-place) joint work on meeting preparation (particularly in support of environmental planning). Since planning processes often involve multiple meetings and discussions, the system could be used to build and retrieve a record of activities leading to a decision (given tools to create annotated histories) Interaction characteristics: The prototype system provides a variety of topological connection possibilities. The client server system can support a relatively large number of connections (>10). With the current implementation, there is no built-in method for establishing user control. Thus, the first user to initiate an action controls all functions, until they release the mouse. Collaboration among three or more users would probably be somewhat chaotic unless an etiquette for shared control could be achieved (we have only tested the system with pairs of users). The system does have a function that allows one operator (a moderator) to control every other operator s access privileges. The moderator can make participants active or inactive. During our interviews, participants indicated that it was essential for users of a distributed system to know who has control and that there be a formal method for gaining and relinquishing system control, so that single individuals cannot dominate the collaboration. We suggest that, until mechanisms and affordances are developed to support practical shared control of a distributed collaborative system, co-equal interaction will be most practical for Geocollaboration forthcoming in IJGIS (final version submitted March 2003) 31
32 groups of three or less. The number of participants could increase substantially, however, for instructor-led collaboration. For example, if the system described here were used for same-time same-place collaboration in which every participant had his or her own display, an instructor, team leader, or moderator could use the make active / inactive function to allow one participant at a time to manipulate the system for shared questions and discussion. Another possibility is to let the natural flow of conversation dictate who has control by maximizing back channel feedback in small group settings. The integration of more natural conversational practices and norms into the interface design could potentially improve collaborative work Tools to mediate understanding: The results of our interviews made it clear that several necessary tools for mediating understanding were missing from the prototype. In addition to the need for an indication of who was in control and a mechanism for sharing control (both mentioned above and implemented in the prototype participant watcher discussed in section 4.2), participants also requested a suite of drawing and selection tools. To facilitate effective member-to-member communication, participants also asked for integration of video conferencing, telephone, and online chats and message boards. Tools for attracting group attention were also suggested to be extremely important. Moreover, participants asked for domain specific representations (and a way to compare them), so that collaborators with different backgrounds could bring themselves, or the group, up to speed on concepts and terminology. Particular attention was placed on the ways in which individual users could direct or attract attention of the entire group. The need to represent individual participants and their actions was discussed by most participants. While avatar representations were an option considered, most participants advocated some form of simpler color-coding as the desired mode for representing individual users. Geocollaboration forthcoming in IJGIS (final version submitted March 2003) 32
33 5.2 Same-time same- and different-place collaborative GeoVE Our second case study focuses on the use of large-screen immersive VE technology (specifically an ImmersaDesk, IDesk for short) to facilitate group discussion about environmental processes. We had the opportunity to test this environment for both same-place and different-place group work focused on exploratory analysis of times series geospatial data. For more details on the conceptual approach to GeoVE developed, see: (MacEachren et al., 1999). The different-place collaboration was achieved through assistance of environmental and computer scientists at Old Dominion University (Cathy Lascara, Glen Wheless, and their staff) who developed Cave5D, the software environment used (Wheless et al., 1996). Using high speed internet connections, two separate tests were conducted, one linking our IDesk with another IDesk at Old Dominion and a second linking our IDesk with one at the University of Iowa (working with Marc Armstrong, Judy Brown, and their students/staff) (figure 10). As we did for the first case study, we apply the conceptual framework presented above to identify a set of key issues to consider for geocollaboration supported by VE technologies. {figure 10 about here} Problem context: The problem context for this case study was, as above, knowledge construction and refinement. The application domain was regional climate processes, specifically spatiotemporal relationships between temperature and precipitation. Data used included daily temperature and precipitation values (from May through July, 1972), again for the Susquehanna River basin. An issue of particular interest to the scientists with whom we were collaborating was the precipitation-temperature relationships associated with Hurricane Agnes as it impacted the basin Geocollaboration forthcoming in IJGIS (final version submitted March 2003) 33
34 and comparison of these relationships to those for smaller scale (ordinary) storms associated with mid-latitude cyclones moving across the region. The functionality provided by an IDesk using Cave5D as the software development environment imposed substantial limits on the ability of collaborating individuals to work on a simulated knowledge construction task primarily due to the interaction characteristics of the environment (see below). Our conclusion here is that the IDesk environment, as tested, is better suited to instructor-led situations than to those with multiple independent participants (thus to training and education or command and control applications rather than scientific exploration applications). This conclusion will be elaborated in sections below Collaboration tasks: The initial methods and tools implemented were ones intended to support same-place dialogue related to knowledge construction, thus dialogue focused on data exploration. The primary exploration goals in our case study were to understand the space-time relationships of each attribute and the interrelationships between attributes over time. The Cave5D software used supports a rather small range of display and interaction forms. Using the available 3D display capabilities, terrain was mapped to an x-y-z extruded surface (using only a small portion of the z-dimension of the view). Above this terrain depiction, x and y continued to represent latitude and longitude while time was mapped to the remainder of the z dimension (figure 11). In this space-time portion of the display space, the olive green clouds are space-time precipitation isosurfaces (regions in space-time with precipitation above a threshold value). Hurricane Agnes is the largest event, spatially covering the entire Susquehanna River basin and lasting for several days (a regional blanket of rain multiple days thick). The Geocollaboration forthcoming in IJGIS (final version submitted March 2003) 34
35 blue-yellow layer floating above the hurricane event depicts temperature, using a spectral color scheme in which blue depicts cool, yellow intermediate, and red high temperatures. {figure 11 about here} The implementation supports three kinds of exploration tasks. First, users can visually inspect the 3D information structure by rotating the display object as if the representation was a physical model being manipulated in the hand. Second, investigation of the relationships among attributes is supported by the ability to drag layers (time slices in this case) through the precipitation display. The third kind of exploration task supported is detailed investigation of spatial and temporal characteristics of space-time events, through changes to the isosurface threshold used. Our experience with simulated exploratory knowledge construction tasks in this prototype highlighted a fundamental difference between task typologies for decision-making and those to support knowledge construction. For decision-making, decades of attention have been devoted to the process of group work and we have relatively sophisticated group decision-making task typologies as a result of that effort. With knowledge construction, however, both the tools and the terminology we use to describe the process have focused on the individual scientist. While there has been research to develop typologies of tasks related to visual data exploration (Keller & Keller, 1992; Knapp, 1995; Qian et al., 1997) and to geospatial data use more generally (Albrecht, 1995), these typologies have not addressed tasks that are specific to group work, such as choosing among or synthesizing potentially contradictory explanations for an apparent relationship seen in the display. Just as efforts to isolate specific group decision-making tasks from one another have supported development of tools targeted at each group decision-making task, a similar effort to delineate knowledge construction tasks at the level of group interaction is Geocollaboration forthcoming in IJGIS (final version submitted March 2003) 35
36 essential. Such a typology, if collectively developed by the GIScience community, would help us move from geospatial technologies that support individual scientists to technologies that support scientific teams Commonality of perspective: This case study was restricted to situations in which there was a relatively high commonality of perspective among participants, specifically climatologists using a shared scientific paradigm to pursue narrow data exploration tasks. The prototype emphasized support for direct interaction with the visual display. Due to the expected high commonality of perspectives little attention was directed to tools that help to share points of view, explain what is being seen, or integrate different perspectives and interpretations. As noted above in discussion of the first case study, however, we are beginning to address the more challenging goal of visual display support for multiple scientific perspectives. Our current work addresses this issue in the context of largescreen, non-immersive GeoVE (see section 6 below) Spatial and temporal context: The prototype considered in this case study, was developed initially to support same-place same-time collaboration. The primary advantage of the IDesk environment for this application (over a standard desktop display environment) proved to be the large screen. Its size (and upright orientation) allowed multiple people to simultaneously share a similar view of the data. A disadvantage for same-place group work is that use of stereo glasses limits participant s ability to carry on a normal dialogue about what they are seeing; because they cannot take advantage of gestures and facial expressions as fully as if participants were discussing a large paper wall map. Geocollaboration forthcoming in IJGIS (final version submitted March 2003) 36
37 As noted, multiple IDesks were linked (using high-speed Internet connections) to support different-place same-time applications (in our trials, we have used only two at a time, but the technology supports more). Remote collaboration requires tools that support a dialogue. We opted initially for Internet tools that supported real-time voice communications. The latter proved to be unreliable and we often resorted to a pair of speaker telephones to communicate among multiple participants working with each display. While voice-only dialogues might at first seem to add a constraint on collaboration not faced in the same-place situation, the use of stereo glasses (as noted above) constrains same-place dialogue using an IDesk in a similar way Interaction characteristics: The IDesk and network technologies put specific constraints on interaction characteristics. For same-place use, only one individual has control of the display at a time (for convenience, referred to as the guide below) and the hand off of control from one user to another interrupts any dialog that is taking place. The guide must not only hand the control wand to another user but also switch glasses with them, since (at least with our hardware implementation) a physical wire connects the head tracking unit to one pair of glasses. The environment, thus, favors an interaction topology in which one person controls the dialog (thus an instructor-led situation). Group size is restricted to perhaps 3-5 individuals by display size and the optimal viewing position (about one meter from the display and keyed to the location of the control glasses worn by the guide). Picture quality deteriorates rather quickly from this location (with the coherence of the stereo view decreasing and the likelihood that users will become nauseous increasing proportionally). Similarly, the sense of immersion decreases with distance from the screen. For different-place collaboration, each guide can adjust their site s viewpoint independently (by zooming, panning, and rotating). In addition, each guide can control which information Geocollaboration forthcoming in IJGIS (final version submitted March 2003) 37
38 layers are visible locally as well as globally. This capability meets a need identified in previous interviews (case study 1), to provide a mechanism that supports independent work (local viewing) prior to showing that work to all collaborators (global viewing). The implementation is, however, quite limited because participants at any one site see an identical view and it is not possible to toggle between an in-progress view and the shared view, other than by turning each information layer completely on or completely off globally. Overall, for different-place group interaction, the IDesk/Cave5D environment is best suited to situations in which each group is organized with a team leader who acts as moderator for collaboration from one team to another. With a voice link, of course, any individual on one team can direct a comment or question to any individual on another team, but without control of the display the potential to answer effectively is limited Tools to mediate understanding: Although designed for computer graphics applications, an IDesk combined with Cave5D software provides limited tools to visually mediate understanding. The software was developed for use in single-user desktop display, and then ported to multi-walled Caves and to the IDesk hardware platform (still with an underlying single user structure). Even with enhancements that support multiple locations, these single user roots remain apparent and limiting. The environment provides only two specific features to support same-place collaboration. First, the screen size allows 2-5 individuals to be near enough to the screen to use ordinary pointing gestures as a means to draw each other s attention to features being discussed. Second, the guide can make use of a laser pointer-like device to pinpoint features being discussed. This pointer appears more similar to a light-saber from Star Wars than to a standard laser pointer, because it generates a long narrow light beam in 3D space. This remote pointer supports some of Geocollaboration forthcoming in IJGIS (final version submitted March 2003) 38
39 the functionality that Florence, et. al (1996) envisioned for wallboards (used at spitting distance ), but with substantial limits. Like a light-saber, its beam has a fixed length. Thus, the only way to point at a feature in the foreground is for the guide to move their hand away from the screen. It is usually easier to pierce an object of interest than to point at it. For different-place collaboration, each guide is represented by one light beam. The beam at any location will appear (to those at that location) to enter the field of view from the guide s location, thus the origin of the beam will not be visible to the local participants. For beams representing remote team guides, participants see the beam plus a small avatar. The location of the avatar represents the team guide s viewpoint and the beam represents the guide s direction of view. This rather abstract representation (based on our informal experience) seems to be quite effective in helping each team identify the perspective from which other teams are viewing the scene and (together with voice communication) in helping to arrive at a shared perspective. 6 Discussion and ongoing research The overall goal of the conceptual framework for visually-enabled geocollaboration presented here is to guide the design, implementation, and assessment of geocollaboration environments. The conceptual framework supports a structured approach to each stage of the design, implementation, and assessment process. Attention is paid to both the human components of the collaborative environment (problem context, collaboration tasks, and perspective commonality) and the system components that can support or impede collaboration (spatial and temporal context, interaction characteristics, and tools to mediate understanding). The use of the conceptual framework developed was illustrated through application to posthoc analysis of two prototypes, one focused on different-place same- and different-time Geocollaboration forthcoming in IJGIS (final version submitted March 2003) 39
40 collaborative geovisualization and the other on same-time same- and different-place collaborative GeoVE, both applied to knowledge construction. This post-hoc analysis provided the basis for discussing strengths and weaknesses of particular methods and tools applied to environmental science. More importantly, however, this exercise helps to identify a set of research and IT/HCI development challenges related to visually-enabled geocollaboration. Among the most important overarching research challenges are the following: To develop a theoretical understanding of the cognitive and social aspects of both local and remote collaboration mediated through display objects in a geospatial context; To develop approaches to multi-user system interfaces that support rather than impede group work; To understand the ways in which characteristics of methods and tools provided to support collaboration influence the outcome of group work. To initiate a parallel, concerted effort focused on integrating, implementing, and investigating the role of the visual, geospatial display in collaborative science, education, design, and group decision support (GDSS); We believe that meeting these goals will require an interdisciplinary approach that draws upon and contributes to advances in a range of domains including CSCW, CSCL, GDSS, ergonomics, cognitive system engineering, and distributed cognition. Within the overarching challenges detailed above, we also identify a series of specific visualization, HCI, and information technology objectives. If visual displays are to serve effectively as mediators for geocollaboration, it is essential to: assess the advantages and disadvantages of extending methods of interactive geographic and information visualization (developed for single users) to collaborative settings and compare such extensions with new methods designed specifically to meet the unique characteristics of group work; Geocollaboration forthcoming in IJGIS (final version submitted March 2003) 40
41 examine the role of different kinds of visual representation (realistic versus abstract, animated versus static) and related virtual environment methods and technologies in geocollaborative settings; Because available control devices and kinds of interaction supported in current visually-enabled collaborative environments rely on desktop metaphors, they impede dialogue, for example using popup dialog boxes for achieving actions such as turning display of layers on and off. More natural interfaces that allow users to direct attention to (and talk about) the information being displayed, rather than to using the system, are needed to facilitate dialogue. New interaction devices are needed that support multiple users in the same place at the same time. This is particularly necessary to support multiple co-equal collaborators (rather than instructor-led collaboration). For situations with low commonality of perspectives, interfaces must do more than help collaborators realize each others viewing location. Tools are needed to help them understand and share differing conceptual perspectives. We have begun to experiment with three environments that address the challenges identified. All use large screen display but de-emphasize immersion (by omitting the head tracking used with the IDesk display). One of these environments is the HI-SPACE Table described above (Figure 1). By allowing integration of physical objects (phicons) with the visual display and supporting multiple users at once, the HI-SPACE Table decreases some of the impediments to group work found in our early prototype tools. The HI-SPACE environment was designed for same-place collaboration and we are now working with colleagues at PNNL to extend it for different-place collaboration using linked tables. The second environment we have begun to use is a new large-screen VE constructed by our collaborators in the Center for Academic Computing at Penn State (figure 12). This new environment is not dependent on the Cave library. Instead, we can use any software capable of Geocollaboration forthcoming in IJGIS (final version submitted March 2003) 41
42 generating 3D depictions. We are now using our Java-based GeoVISTA Studio software to develop stereo applications for group work (Takatsuka & Gahegan, in press). The hardware implementation uses a pair of non-immersive, large-screen, stereo displays (driven by two pairs of rear-projection video projectors). The displays are viewed with polarized glasses. The lack of head tracking (and absence of wires between glasses and display) makes collaboration among users more balanced (i.e., the environment is useful for both instructor-led collaboration and group work among equals). Although one user is still in control (using a gyro mouse), it is much easier to trade off that control and the display is not constantly readjusting its perspective to that of one user while he or she moves around. The dual display facilitates work by larger groups and, as shown, facilitates discussion of both the visual representation of data (right screen) and the visual program used to process and display those data (left screen). The environment is also an order of magnitude less expensive than an IDesk (roughly $25,000 U.S. rather than $250,000+ U.S.). {figure 12 about here} The objective for the third environment, Dialogue-Assisted Visual Environment for Geoinformation (DAVE_G), is to provide more natural, multi-user interfaces to spatial information. The specific research goal is to develop principles for implementing and assessing natural, multimodal, multi-user dialogue-enabled interfaces to geographic information systems that make use of large-screen displays and virtual environment technology. The DAVE_G project incorporates computer vision and speech processing as a means of interpreting and integrating user input from spoken words, free hand gestures and gaze. The practical goal for this research is to support decision-making tasks by experts and the general public. For more details, see: and (Rauschert et al., 2002). Geocollaboration forthcoming in IJGIS (final version submitted March 2003) 42
43 As discussed above, past research on group work with geospatial information has not focused on the role of maps and other visual display forms. The potential of visual display to enable geocollaboration is, however, beginning to be recognized (MacEachren & Kraak, 2001); As outlined in these reports, a fundamental challenge for GIScience and related information sciences is to: (1) understand the roles for visual display and the types of display environments best suited to geocollaboration (i.e., large screen, table top, wall displays, VR), and (2) to implement and assess visually-enabled geocollaboration environments suited to a range of problem contexts and tasks. ACKNOWLEDGEMENTS This material is based upon work supported by the National Science Foundation under Grants No and No as well as by the Apoala Project (U.S. Environmental Protection Agency grant # R Our thanks go to the following colleagues for their parts in implementation of the prototypes or development of ideas: Mike Wheeler, Hadi Abdo, George Otto, Jack Gundrum, Amy Griffin, Mark Harrower, Daniel Haug, Jeremy Mennis, Diansheng Guo, Masahiro Takatsuka, Boyan Brodaric, Frank Hardisty, Erik Steiner, Craig Williams, Yannis Fermantzis, Dennis McQuerry, and three anonymous reviewers. REFERENCES Ackerman, F. (Ed.). 1994, Working Together through Groupware. Westport, CT: Praeger. Albrecht, J. 1995, Universal GIS operations: task-oriented systematization of GIS functionality. Unpublished PhD, University of Vechta, Germany. Andrienko, G. & Andrienko, N. 2001, Interactive Visual Tools to Support Spatial Multicriteria Decision Making. User Interfaces to Data Intensive Systems, Zurich, Switzerland, , pp Arias, E., Eden, H., Fischer, G., Gorman, A., & Scharff, E. 2000, Transcending the individual human mind - creating shared understanding through collaborative design. ACM Transactions on Computer-Human Interaction, 7(1), Arias, E. G. & Fischer, G. 2000, Boundary objects: Their role in articulating the task at hand and making information Relevant to It. International ICSC Symposium on Interactive & Collaborative Computing (ICC'2000), Wetaskiwin, Canada, December 2000, pp Armstrong, M. P. 1993, Perspectives on the development of group decision support systems for locational problem-solving. Geographical Systems, 1(1), Geocollaboration forthcoming in IJGIS (final version submitted March 2003) 43
44 Armstrong, M. P. 2001, The Four Way Intersection of Geospatial Information and Information Technology. White paper prepared for NRC/CSTB Workshop on Intersections between Geospatial Information and Information Technology, September 19, Armstrong, M. P. & Densham, P. J. 1995, Cartographic support for collaborative spatial decision-making. Auto Carto 12, ACSM/ASPRS Technical Papers, Vol. 4, Charlotte, NC, Feb March 2, 1995, pp Bajaj, C. & Cutchin, S. 1999, Web based collaborative visualization of distributed and parallel simulation. IEEE Parallel Visualization and Graphics Symposium, San Fransisco, CA, Oct , 1999, pp Brewer, I., MacEachren, A. M., Abdo, H., Gundrum, J., & Otto, G. 2000, Collaborative Geographic Visualization: Enabling shared understanding of environmental processes. IEEE Information Visualization Symposium, Salt Lake City Utah, Oct. 9-10, 2000, pp Brodlie, K. in press, Models of collaborative visualization. In D. Jason, Alan M. MacEachren, Menno-Jan Kraak (Ed.), Exploring Geovisualization. Brodlie, K. W., Duce, D. A., Gallop, J. R., & Wood, J. D. 1998, Distributed cooperative visualization. State of the Art Reports at Eurographics 98, pp Brown, C., Benford, S., & Snowdon, D. 1996, Collaborative visualization of large scale hypermedia databases. Proceedings of the ERCIM workshop on CSCW and the web, Sankt Augustin, Germany, February 7-9, 1996, pp. orgwis.gmd.de/projects/w4g/proceedings/visual.html. Brown, J. R., van Dam, A., Earnshaw, R., Encarnação, J., Guedj, R., Preece, J., Scheiderman, B., & Vince, J. 1999, Human-centered computing, online communities and virtual environments, special report on the First Join European Commision/National Science Foundation Advanced Research Workshop, June 1-4, 1999, Chateau de Bonas, France. Computer Graphics, 33(3), Carver, S. 1991, Integrating multi-criteria evaluation with geographical information systems. International Journal of Geographical Information Systems, 5(3), Cerf, V. G., Cameron, A. G. W., Lederberg, J., Russell, C. T., Schatz, B. R., Shames, P. M. B., Sproull, L. S., Weller, R. A., & Wulf, W. A. 1993, National Collaboratories: Applying Information Technology for Scientific Research. Churcher, C. & Churcher, N. 1999, Realtime conferencing in GIS. Transactions in Geographic Information Systems, 3(1), Cohen, P., McGee, D., Oviatt, S., Wu, L., Clow, J., King, R., Julier, S., & Rosenblum, L. 1999, Multimodal interaction for 2D and 3D environments. IEEE Computer Graphics and Applications, July/August. Descortis, F., Noirfalise, S., & Saudelli, B. 2000, Activity theory, cognitive ergonomics and distributed cognition: three views of a transport company. Int. J. Human-Computer Studies, 53, DiBiase, D. 1990, Visualization in the earth sciences. Earth and Mineral Sciences, Bulletin of the College of Earth and Mineral Sciences, Penn State University, 59(2), (also: DiBiase, D. 2000, Is distance education a Faustian bargain? Journal of Geography in Higher Education, 24(1), Dix, A. J., Finlay, J. E., Abowd, G. D., & Beale, R. 1998, Human-Computer Interaction (2nd ed.): Prentice Hall. Ellis, C. A., Gibbs, S. J., & Reln, G. L. 1991, Groupware: Some issues and experiences. Communications of the ACM, 34(1), Erickson, T. & Kellogg, W. A. 2000, Social translucence: Designing systems that support social processes. ACM Trans. Comput.-Hum. Interaction, 7(1), Geocollaboration forthcoming in IJGIS (final version submitted March 2003) 44
45 Fischer, G. 2002, External and sharable artifacts as sources for social creativity in communities of interest. Proceedings of the Fifth International Roundtable Conference: Computational and Cognitive Models of Creative Design, Heron Island, Australia, December 2001, Flanagan, J., Huang, T., Jones, P., & Kasif, S. 1997, National Science Foundation Workshop on Human- Centered Systems: Information, Interactivity, and Intelligence (July 2, 1997). Available: Florence, J., Hornsby, K., & Egenhofer, M. J. 1996, The GIS wallboard: interactions with spatial information on large-scale displays. In M. J. Kraak & M. Molenaar (Eds.), International Symposium on Spatial Data Handling (Vol. 7, pp ). Delft, The Netherlands: Taylor and Francis. Fortner, R. W. M., V.J. 1996, Constructing Earth system science learning through multidisciplinary studies of global change. Geoscience and Remote Sensing Symposium, IGARSS '96. 'Remote Sensing for a Sustainable Future.', International, May 1996, pp Friesen, J. A. & D.Tarman, T. 2000, Remote high-performance visualization and collaboration. IEEE Computer Graphics and Applications, July/August, Goddard, T. & Sunderam, V. S. 1999, Toolspace: Web based 3D collaboration. Fourth International Conference on the Virtual Reality Modeling Language and Web 3D Technologies, Paderborn, Germany, February Grudin, J. 1990, Groupware and cooperative work: Problems and prospects. In B. Laurel (Ed.), The Art of Human-Computer Interface Design (pp ). Reading, MA: Addison-Wesley. Hackman, J. R. 1976, Group influences on individuals. In M. D. Dunnettee (Ed.), Handbook of Industrial and Organizational Psychology. Chicago, IL: Rand-McNally. Harvey, F. & Chrisman, N. 1998, Boundary objects and the social construction of GIS technology. Environment and Planning A, 30(9), Hindmarsh, J., Fraser, M., Heath, C., Benford, S., & Greenhalgh, C. 2000, Object-focused interaction in collaborative virtual environments. ACM Transactions on Computer-Human Interaction, 3(4), Horrocks, S., Rahmati, N., & Robbins-Jones, T. 1999, The development and use of a framework for categorising acts of collaborative work. Proceedings of the 32nd Hawaii International Conference on System Sciences, Maui, HI, Jan. 5-8, 1999, pp. CD, 13 pp. Hutchins, E. 1995, How a cockpit remembers its speeds. Cognitive Science, 19, Janicki, T. & Liegle, J. O. 2001, Development and evaluation of a framework for creating web-based learning modules: A pedagogical and systems perspective. Journal of Asynchronous Learning Networks, 5(1). Jankowski, P. & Nyerges, T. 2001a, Geographic Information Systems for Group Decision Making: Towards a participatory, geographic information science. New York: Taylor & Francis. Jankowski, P. & Nyerges, T. 2001b, GIS-supported collaborative decision-making: Results of an Experiment. Annals of the Association of American Geographers, 91(1), Jankowski, P., Nyerges, T. L., Smith, A., Moore, T. J., & Horvath, E. 1997, Spatial group choice: A SDSS tool for collaborative spatial decision-making. International Journal of Geographical Information Science, 11(6), Jankowski, P. & Richard. 1994, Integration of GIS-based suitability analysis and multicriteria evaluation in a spatial decision support system for route selection. Environment and Planning B, 21, Jedrysik, P. A., Moore, J. A., Stedman, T. A., & Sweed, R. H. 2000, Interactive displays for command and control. Aerospace Conference Proceedings, Big Sky, Montana, March, pp Jones, P. M., Hayes, C., Wilkins, D., Bargar, R., Sniezek, J., Asaro, P., Mengshoel, O., Kessler, D., Lucenti, M., Choi, I., Tu, N., & Schlabach, M. 1998, CoRAVEN: Modelling and design of a multimedia intelligent infrastructure for collaborative intelligence analysis. Proceedings of the Geocollaboration forthcoming in IJGIS (final version submitted March 2003) 45
46 1998 IEEE International Conference on Systems, Man, and Cybernetics, San Diego CA, October 1998, pp Jones, R. M., Copas, C., V., & Edmonds, E. A. 1997, GIS support for distributed group-work in regional planning. International Journal of Geographical Information Science, 11(1), Keller, P. & Keller, M. 1992, Visual Cues: Practical Data Visualization. Los Alamitos, CA: IEEE Computer Society Press. Knapp, L. 1995, A task analysis approach to the visualization of geographic data. In T. L. Nyerges, et al. (Ed.), Cognitive Aspects of Human-Computer Interaction for Geographic Information Systems (pp ). Netherlands: Kluwer Academic Publishers. Kraak, M.-J. & MacEachren, A. M. 1999, Visualization for exploration of spatial data (editorial introduction to special issue). International Journal of Geographical Information Science, 13(4), Kraemer, K. L. & King, J. L. 1988, Computer-based systems for cooperative work and group decision making. ACM Computing Surveys, 20(2), Lin, C., Loffin, R. B., & Stark, T. 1998, Virtual reality for geosciences visualization. Proceedings of Computer Human Interaction. 3rd Asia Pacific, pp MacEachren, A. M. 1995, How Maps Work: Representation, Visualization and Design. New York: Guilford Press. MacEachren, A. M. 2000, Cartography and GIS: facilitating collaboration. Progress in Human Geography, 24(3), MacEachren, A. M. 2001, Cartography and GIS: Extending collaborative tools to support virtual teams. Progress in Human Geography, 25(3), MacEachren, A. M. submitted, Moving geovisualization toward support for group work. In D. Jason, Alan M. MacEachren, Menno-Jan Kraak (Ed.), Exploring Geovisualization: Elsevier. MacEachren, A. M., Brewer, I., & Steiner, E. 2001, Geovisualization to mediate collaborative work: tools to support different-place knowledge construction and decision-making. Proceedings, 20th International Cartographic Conference, Beijing, China, August 6-10, 2001, pp MacEachren, A. M., Edsall, R., Haug, D., Baxter, R., Otto, G., Masters, R., Fuhrmann, S., & Qian, L. 1999, Virtual environments for geographic visualization: Potential and challenges. Proceedings of the ACM Workshop on New Paradigms in Information Visualization and Manipulation, Kansas City, KS, Nov. 6, 1999 (also at: pp MacEachren, A. M. & Kraak, M.-J. 1997, Exploratory cartographic visualization: advancing the agenda. Computers & Geosciences, 23(4), MacEachren, A. M. & Kraak, M.-J. 2001, Research challenges in geovisualization. Cartography and Geographic Information Science, 28(1), Mandviwalla, M. & Oldman, L. 1994, What do groups need? A proposed set of generic groupware requirements. ACM Transactions on Computer-Human Interaction, 1(3), Mark, D. (Ed.). 1999, NSF Workshop Report -- Geographic Information Science: Critical Issues in an Emerging Cross-disciplinary Research Domain. Washington, DC: NSF. May, R. A. 1999, HI-SPACE: A Next Generation Workspace Environment. Unpublished Unpublished Masters Thesis, Washington State University, Pullman, WA. McGee, D. R. & Cohen, P. R. 2001, Creating tangible interfaces by augmenting physical objects with multimodal language. 9th International Conference on Human-Computer Interaction, New Orleans, LA. McGee, D. R., Cohen, P. R., & Wu, L. 2000, Something from nothing: Augmenting a paper based work practice via multimodal interaction. Proceedings of the ACM Designing Augmented Reality Environments DARE 2000, Helsinor, Denmark, pp Geocollaboration forthcoming in IJGIS (final version submitted March 2003) 46
47 McGee, D. R., Pavel, M., Adami, A., Wang, G., & Cohen, P. R. 2001, A visual modality for the augmentation of paper. Proceedings of the Workshop on Perceptive User Interfaces (PUI'01), Orlando, FL, Nov McGrath, J. E. 1984, Groups: Interaction and performance. Englewood Cliffs, NJ: Prentice-Hall. Mesrobian, E. M., R.; Shek, E.; Nittel, S.; LaRouche, M.; Kriguer, M. 1996, OASIS: an open architecture scientific information system. Sixth International Workshop on Research Issues in Data Engineering, Interoperability of Nontraditional Database Systems. Proceedings., Feb. 1996, pp Munda, G. P. N. P. R. 1994, Qualitative multicriteria evaluation for environmental management. Ecological Economics, 10, Nardi, B. (Ed.). 1996, Context and Consciousness: Activity Theory and Human-Computer Interaction. Cambridge, Mass: MIT Press. Nielsen, J. 1993, Usability Engineering. New York: Academic Press. Noll, S., Paul, C., Peters, R., & Schiffner, M. 1999, Autonomous agents in collaborative virtual environments. Proceedings. IEEE 8th International Workshops on Enabling Technologies: Infrastructure for Collaborative Enterprises (WET ICE '99), Stanford, CA, June 16-18, 1999, pp Nyerges, T. 1999, Progress in spatial decision making using geographic information systems. In M. Craglia & H. Onsrud (Eds.), Geographic Information Research: Trans-Atlantic Perspetives (pp ). London: Taylor & Francis, Ltd. Nyerges, T. L., Montejano, R., Oshiro, C., & Dadswell, M. 1997, Group-based geographic information systems for transportation improvement site selection. Transportation Research C, 5(6), Olson, G. M., Atkins, D. E., Clauer, R., Finholt, T. A., Jahanian, F., Killeen, T. L., Prakash, A., & Weymouth, T. 1998, The upper atmosphere research collaboratory. Interactions(May/June), Olson, G. M. & Olson, J. S. 2000, Distance Matters. Human-Computer Interaction, 15, Oviatt, S., Angeli, A. D., & Kuhn, K. 1997, Integration and synchronization of input modes during multimodal human-computer interaction. Proceedings of the Conference on Human Factors in Computing Systems (CHI'97), pp Padula, M. & Rinaldi, G. R. 1999, Mission critical web applications: A seismological case. Interactions, July-August, Pang, A. & Fernandez, D. 1995, REINAS instrumentation and visualization. Proceedings, OCEANS '95. MTS/IEEE. Challenges of Our Changing Global Environment, San Diego, Oct. 9-15, pp Pantelidis, V. S. 2000, The RAVE, CAVE, and Collaborative Virtual Environments. Greenville, North Carolina. Park, K. S., Kapoor, A., & Leigh, J. 2000, Lessons learned from employing multiple perspectives in a collaborative virtual environment for visualizing scientific data. Proceedings of the third international conference on on Collaborative virtual environments, San Francisco, Sept , 2000, pp Patel, U., D'Cruz, M. J., & Holtham, C. 1997, Collaborative design for virtual team collaboration: a case study of jostling on the web. Symposium on Designing Interactive Systems Proceedings of the conference on Designing interactive systems: processes, practices, methods, and techniques, Amsterdam, The Netherlands, pp Pierce, C. S. 1955, Logic as semiotic: The theory of signs (published first in 1891). In H. Buchler (Ed.), Philisophical Writings of Peirce (pp ). Prates, R. O., de Souza, C. S., & Garcia, A. C. B. 1997, A semiotic framework for multi-user interfaces. SIGCHI Bulletin, 29(2), Geocollaboration forthcoming in IJGIS (final version submitted March 2003) 47
48 Qian, L., Wachowicz, M., Peuquet, D., & MacEachren, A. 1997, Delineating operations for visualization and analysis of space-time data in GIS. GIS/LIS '97, Cincinnati, OCT , pp Rauschert, I., Agrawal, P., Fuhrmann, S., Brewer, I., Wang, H., Sharma, R., Cai, G., & MacEachren, A. 2002, Designing a human-centered, multimodal gis interface to support emergency management. ACM GIS'02, 10th ACM Symposium on Advances in Geographic Information Systems, Washington, DC, USA, November, 2002, pp Rhyne, T.-M. 1998, Case study #1: Collaborative geographic visualization. Course Notes: ACM SIGGRAPH '98, #35, Interactive visualization & web-based exploration in the physical and natural sciences, Orlando, pp. Rinner, C. 1997, Discussing plans via the World-Wide Web. 15th ECAADE, Vienna University of Technology. Rinner, C. 1999, Argumaps for spatial planning. Proceedings of TeleGeo'99, First International Workshop on Telegeoprocessing, Lyon, France, May 6-7, pp Rinner, C. 2001, Argumentation maps: GIS-based discussion support for online planning. Environment and Planning B-Planning & Design, 28, Roschelle, J. & Pea, R. D. 2002, A walk on the wild side: How wireless handhelds may change CSCL. To be presented at CSCL 2002: ACM Conference on Computer Supported Collaborative Learning. Roschelle, J. & Teasley, S. D. 1995, The construction of shared knowledge in collaborative problem solving. In C. O'Malley (Ed.), Computer Supported Collaborative Learning (pp ). Berlin: Springer-Verlag. Roussos, M., Johnson, A., Moher, T., Leigh, J., Vasilakis, C., & Barnes, C. 1999, Learning and building together in an immersive virtual world. Presence, 8(3), Shiffer, M. J. 1998, The evolution of public participation GIS. Cartography and Geographic Information Systems, 25(2), Shneiderman, B. 1998, Designing the User Interface - Strategies for Effective Human-Computer Interaction (3rd ed.). Reading: Addison-Wesley Longman, Inc. Shum, S. J. B., MacLean, A., Bellotti, V. M. E., & Hammond, N. V. 1997, Graphical arguementation and design cognition. Human-Computer Interaction, 12, Star, S. L. 1989, The structure of ill-structured solutions: Boundary objects and heterogeneous distributed problem solving. In M. Huhns & L. Gasser (Eds.), Readings in Distributed Aritificial Intelligence (Vol. 2, pp ). Menlo Park, CA: Morgan Kaufmann. Szalavári, Z., Echstein, E., & Gervautz, M. 1998, Collaborative gaming in augmented reality. VRST '98, Taipei, Taiwan, Nov. 2-5, 1998, pp Takatsuka, M. & Gahegan, M. in press, GeoVISTA Studio: A codeless visual programming environment for geoscientific data analysis and visualization. preprint can be downloaded from Taylor, S. R. A. 2001, Streaming Geospatial Imagery into Virtual Environments. Unpublished Unpublished PhD Dissertation, Australian National University. Tromp, J., Bullock, A., Steed, A., Sadagic, A., Slater, M., & Frécon, E. 1998, Small group behavior experiments in the Coven Project. IEEE Computer Graphics & Applications, Nov/Dec, Tukey, J. W. 1977, Exploratory Data Analysis. Reading, Mass.: Addison-Wesley. Varian, H., Allen, F., Brynjolfsson, E., Schement, J., Shenker, S., Sproull, L., & Sutch, R. 1998, Fostering Research on the Economic and Social Impacts of Information Technology: Report of a Workshop. Washington, DC: National Academy Press. Watson, V. R. 2001, Supporting scientific analysis within collaborative problem solving environments. HICSS-34 Minitrack on Collaborative Problem Solving Environments, Maui, Hawaii, January 3-6, Geocollaboration forthcoming in IJGIS (final version submitted March 2003) 48
49 Wheless, G. H., Lascara, C. M., Valle-Levinson, A., Brutzman, D. P., Hibbard, W. L., Paul, B., & Sherman, W. 1996, The Chesapeake Bay Virtual Ecosystem: Initial results from the prototypical system. International Journal of Supercomputer Applications and High Performance Computing, 10(2-3), Wilbanks, T., Adams, R., Church, M., Clark, W., desouza, A., Gilmartin, P., Graf, W., Harrington, J., Horn, S., Kates, R., MacEachren, A., Murphey, A., Rushton, G., Sheppard, E., Turner, B., & Willmott, C. 1997, Rediscovering Geography: New relevance for science and society. Washington, DC: National Academy of Sciences. Wood, J., Wright, H., & Brodlie, K. 1997, Collaborative visualization. Proceedings, IEEE Information Visualization '97, Pheoniz, Oct , 1997, pp Xiang, W. N., Gross, M., Fabos, J. G., & MacDougall, E. B. 1992, A fuzzy-group multicriteria decision making model and its application to land-use planning. Environment and Planning B, 19, Geocollaboration forthcoming in IJGIS (final version submitted March 2003) 49
50 FIGURE CAPTIONS Figure 1: Vision of HI-SPACE group interaction environment. The table display shown is on loan to the Penn State GeoVISTA Center from the Pacific Northwest National Laboratory, and is being used to facilitate joint research on collaborative visualization. Figure 2. Decision-making tasks matched with knowledge construction tasks. Figure 3. The range of perspective commonality that characterizes group work. Figure 4. Sample geovisualization applications for each of the four space-time situations. Figure 5. Three key factors in group interaction: topology of participant connections (who is connected to whom), group size and aggregations (how many groups of participants are involved and how big are the groups), and information constrints (what are the technological and social impediments to information flow among participants who share a connection). Figure 6. Following Pierce s (1955) triadic approach to signs, a sign can be defined as a relationship among three components, the semiotic triangle. First is the referent, the object being signified. Second is the sign vehicle, the object or device (e.g., a written word, a map symbol) that stands for or signifies the referent. Third is the interpretant, the meaning derived from (or perhaps read into) the relationship. Figure 7. Group semiotic triangles depicting 4 users with substantially different intepretants for the same sign vehicle-referent relationship (top view) and subsequent convergence of intepretants as a result of joint work. Figure 8. Design prototype collaboration display with activity tracking (controls at top right) and watcher tools (2 lower right panels). Created in Macromedia Flash. The prototype includes only placeholders for exploratory data analysis tools. Its purpose is to illustrate the potential of such an observation tool. The two lower right panels provide a dynamic representation of each participant and their collective actions. The bottom panel indicates who is in control and which display component they are interacting with (indicated by the shaded rectangle) as well as the relative proportion of time each participant has been in control. Here, the first participant (AMM) is in control of the display and is interacting with the map. This user has been in control of the display for about half of the session thus far (as indicated by the gray fill in the bars representing each user). The upper watcher panel provides summary information about actions over time. The top half of the panel indicates every mouse click made. For the session depicted, participants focused initial attention on the map (for nearly half of the session to this point). Then attention shifted to the scatter plot (with nearly continuous interaction). Finally, attention moved to the parallel coordinate plot (with a period of consistent interaction followed by alternating periods of inaction and action). The bottom half of the panel illustrates the zoom factor for the map over time, as a user adjusted the scale gradually, then reverted to the default scale. To the right, filled bars represent the proportion of the session during which each display component was the focus of attention. The prototype also tracks mouse movements and allows for replay of those movements. The primary intended application of this watcher tool is to support post session analysis of the collaborative session. Figure 9. Same time/same place collaboration on linked desktops. Users can manipulate orientation, scaling, and color schemes of a 2.5D animated depiction that displays, simultaneously, spatially and temporally continuous environmental data (e.g., temperature and precipitation superimposed on an extruded terrain surface). Left panel shows one frame of an animated representation of user-selected Geocollaboration forthcoming in IJGIS (final version submitted March 2003) 50
51 climate data (precipitation is shown) draped on a 2.5D terrain depiction. Upper right panel contains controls for color scheme and animation. Lower right panel contains visual query tools that allows user to select subsets of data using a combined linear-cyclic interactive legend (in this case, all days for May, 1993). Figure 10. Same-place collaboration at a large-screen ImmersaDesk Figure 11. Terrain depiction (lower portion of display) merged with space-time representation of precipitation (green isosurfaces) and temperature (yellow-blue layer), with x-y representing geographic position and z representing three months of time. The threshold value for the isosurfaces can be manipulated by the users; a tighter threshold acts to visually isolate the core precipitation regions (in space and time), thus those most likely to have generated immediate flash flooding (deep in time) and those likely to generate more sustained flooding (broad in space). The temperature layer can be moved through time by clicking and dragging. Dragging the layer up through the hurricane event easily highlights short-term evaporative cooling that follows the hurricane. What surprised our earth science colleagues about the display was that it also allowed them to visually explore the similar, but much more subtle, cooling associated with local thunderstorms (even though the data depicted are at daily temporal resolution). Figure 12. Same-place collaboration at a dual, large-screen stereo display. Geocollaboration forthcoming in IJGIS (final version submitted March 2003) 51
52
53
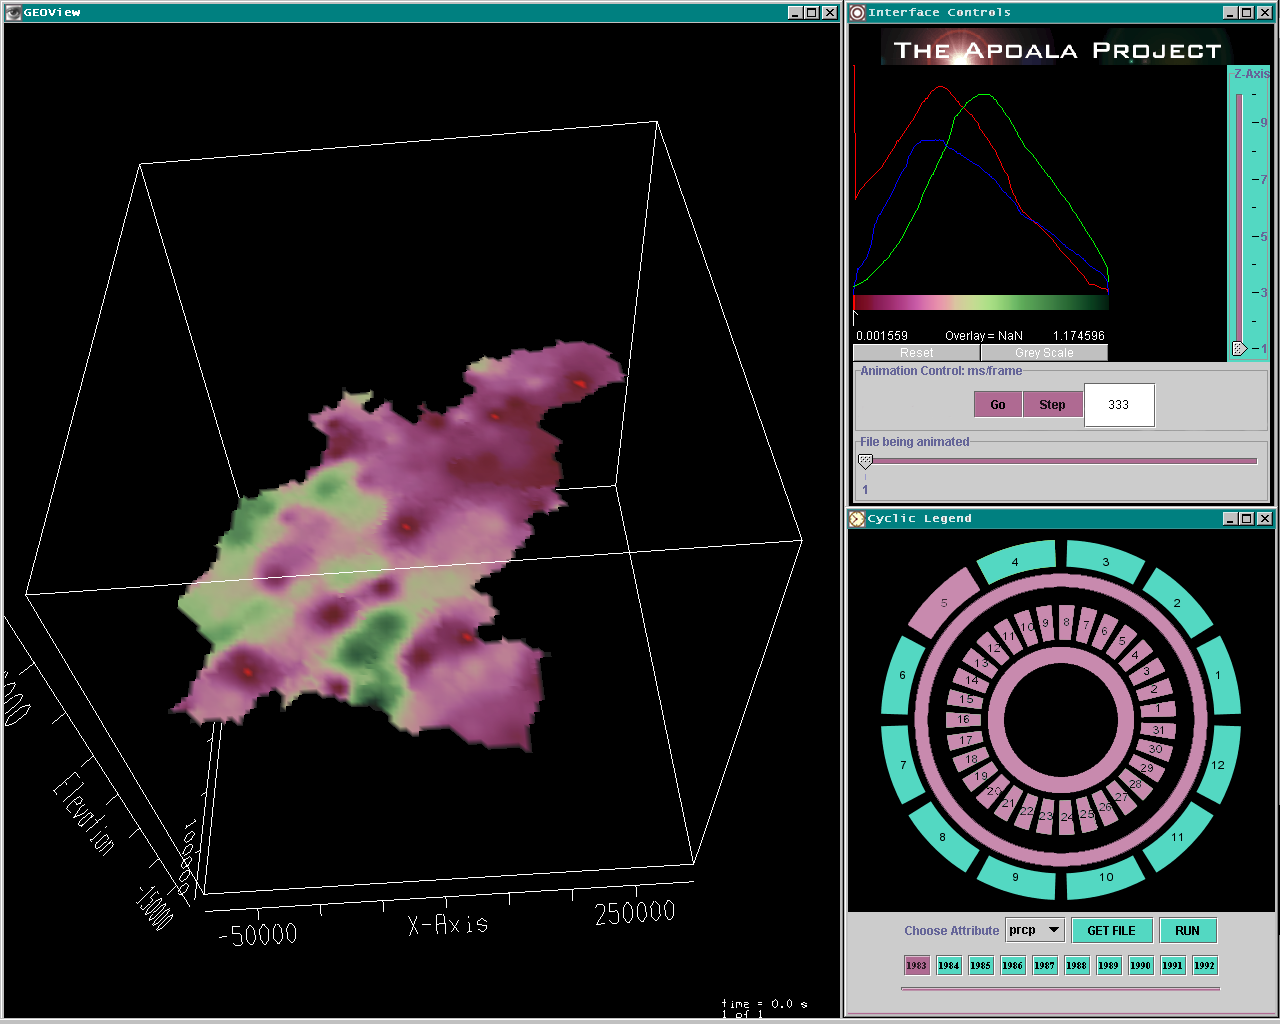
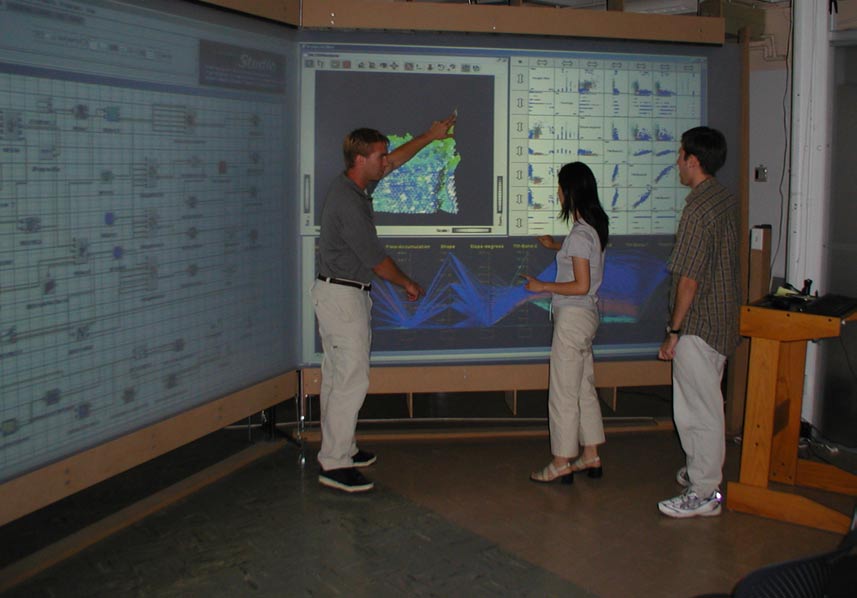
54
Geovisualization. Geovisualization, cartographic transformation, cartograms, dasymetric maps, scientific visualization (ViSC), PPGIS
, PPGIS") 13 Geovisualization OVERVIEW Using techniques of geovisualization, GIS provides a far richer and more flexible medium for portraying attribute distributions than the paper mapping which is covered in Chapter
13 Geovisualization OVERVIEW Using techniques of geovisualization, GIS provides a far richer and more flexible medium for portraying attribute distributions than the paper mapping which is covered in Chapter
USING SELF-ORGANIZING MAPS FOR INFORMATION VISUALIZATION AND KNOWLEDGE DISCOVERY IN COMPLEX GEOSPATIAL DATASETS
 USING SELF-ORGANIZING MAPS FOR INFORMATION VISUALIZATION AND KNOWLEDGE DISCOVERY IN COMPLEX GEOSPATIAL DATASETS Koua, E.L. International Institute for Geo-Information Science and Earth Observation (ITC).
What is Visualization? Information Visualization An Overview. Information Visualization. Definitions
 What is Visualization? Information Visualization An Overview Jonathan I. Maletic, Ph.D. Computer Science Kent State University Visualize/Visualization: To form a mental image or vision of [some
Information Visualization WS 2013/14 11 Visual Analytics
 1 11.1 Definitions and Motivation Lot of research and papers in this emerging field: Visual Analytics: Scope and Challenges of Keim et al. Illuminating the path of Thomas and Cook 2 11.1 Definitions and
GEOGRAPHIC INFORMATION SYSTEMS
 GEOGRAPHIC INFORMATION SYSTEMS WHAT IS A GEOGRAPHIC INFORMATION SYSTEM? A geographic information system (GIS) is a computer-based tool for mapping and analyzing spatial data. GIS technology integrates
Supporting statistical, graphic/cartographic, and domain literacy through online learning activities: MapStats for Kids
 Supporting statistical, graphic/cartographic, and domain literacy through online learning activities: MapStats for Kids Alan M. MacEachren, Mark Harrower, Bonan Li, David Howard, Roger Downs, and Mark
The Role of Computers in Synchronous Collaborative Design
 The Role of Computers in Synchronous Collaborative Design Wassim M. Jabi, The University of Michigan Theodore W. Hall, Chinese University of Hong Kong Abstract In this paper we discuss the role of computers
Integrating Databases, Objects and the World-Wide Web for Collaboration in Architectural Design
 Integrating Databases, Objects and the World-Wide Web for Collaboration in Architectural Design Wassim Jabi, Assistant Professor Department of Architecture University at Buffalo, State University of New
Broad and Integrative Knowledge. Applied and Collaborative Learning. Civic and Global Learning
 1 2 3 4 5 Specialized Knowledge Broad and Integrative Knowledge Intellectual Skills Applied and Collaborative Learning Civic and Global Learning The Degree Qualifications Profile (DQP) provides a baseline
Project-Based Cartographic Learning in an Advanced Technology Classroom. Brian P. Bailey
 Project-Based Cartographic Learning in an Advanced Technology Classroom Brian P. Bailey Department of Geography and Environmental Engineering United States Military Academy West Point, NY 10996 Tel: 845-938-4620
Collaborative Emergency Management with Multimodal GIS
 Collaborative Emergency Management with Multimodal GIS Sven Fuhrmann 1&2, Isaac Brewer 1&2, Ingmar Rauschert 1&3, Alan M. MacEachren 1&2, Guoray Cai 1&4, Rajeev Sharma 1&3, Hongmei Wang 1&4, Levent Bolelli
DATA VISUALIZATION GABRIEL PARODI STUDY MATERIAL: PRINCIPLES OF GEOGRAPHIC INFORMATION SYSTEMS AN INTRODUCTORY TEXTBOOK CHAPTER 7
 DATA VISUALIZATION GABRIEL PARODI STUDY MATERIAL: PRINCIPLES OF GEOGRAPHIC INFORMATION SYSTEMS AN INTRODUCTORY TEXTBOOK CHAPTER 7 Contents GIS and maps The visualization process Visualization and strategies
1.. This UI allows the performance of the business process, for instance, on an ecommerce system buy a book.
 * ** Today s organization increasingly prompted to integrate their business processes and to automate the largest portion possible of them. A common term used to reflect the automation of these processes
CHAPTER 1 INTRODUCTION
 1 CHAPTER 1 INTRODUCTION Exploration is a process of discovery. In the database exploration process, an analyst executes a sequence of transformations over a collection of data structures to discover useful
3D Interactive Information Visualization: Guidelines from experience and analysis of applications
 3D Interactive Information Visualization: Guidelines from experience and analysis of applications Richard Brath Visible Decisions Inc., 200 Front St. W. #2203, Toronto, Canada, rbrath@vdi.com 1. EXPERT
Stickley 11/18/2011 ONLINE TEACHING. Department of Rehabilitation Sciences Lois Stickley, PT, PhD
 ONLINE TEACHING Department of Rehabilitation Sciences Lois Stickley, PT, PhD Objectives Identify factors for successful online teaching Identify specific strategies to make online teaching successful 1
In the previous chapter, we explained that the empirical part of scientific research. Data Collection in Geography CHAPTER 3.
 03-Montello-4862.qxd 1/30/2006 12:17 PM Page 35 CHAPTER 3 Data Collection in Geography Overview Learning Objectives: What is the distinction between primary and secondary data sources? What are the five
2 AIMS: an Agent-based Intelligent Tool for Informational Support
 Aroyo, L. & Dicheva, D. (2000). Domain and user knowledge in a web-based courseware engineering course, knowledge-based software engineering. In T. Hruska, M. Hashimoto (Eds.) Joint Conference knowledge-based
The Grid Shared Desktop for CSCL
 The Grid Shared Desktop for CSCL Stefano CERRI 1, Monica CRUBEZY 2, Pascal DUGENIE 1, Clément JONQUET 1, Philippe LEMOISSON 1 1 LIRMM, CNRS & University Montpellier II, 161, rue Ada 34392 Montpellier Cedex
Evaluating Tools that Support Pair Programming in a Distributed Engineering Environment
 Evaluating Tools that Support Pair Programming in a Distributed Engineering Environment Dietmar Winkler Stefan Biffl Andreas Kaltenbach Institute of Software Technology and Interactive Systems, Vienna
Cartography and GIS: Extending collaborative tools to support virtual teams
 Cartography and GIS: Extending collaborative tools to support virtual teams Alan M. MacEachren GeoVISTA Center, Department of Geography, Penn State University, University Park, PA 16802; alan@geog.psu.edu
CITRIS Founding Corporate Members Meeting
 Massive Data Exploration Virtual Reality and Visualization Oliver Staadt, Bernd Hamann CIPIC and CS Department, UC Davis CITRIS Founding Corporate Members Meeting Thursday, February 27, 2003 University
GRADUATE CERTIFICATE PROGRAM
 GRADUATE CERTIFICATE PROGRAM GEOGRAPHIC INFORMATION SCIENCES Department of Geography University of North Carolina Chapel Hill Conghe Song, Director csong at email dot unc dot edu 919-962-6816 (voice) 919-962-1537
A Guide to Collaborative Water Planning
 Integrated Water Resources Management (Proceedings of a symposium held al Davis. California. April 2000). IAHS Publ. no. 272. 2001. 37 Collaborative planning in integrated water resources management: the
Applications of Dynamic Representation Technologies in Multimedia Electronic Map
 Applications of Dynamic Representation Technologies in Multimedia Electronic Map WU Guofeng CAI Zhongliang DU Qingyun LONG Yi (School of Resources and Environment Science, Wuhan University, Wuhan, Hubei.
Interdisciplinary Understanding: What Counts as Quality Work?
 Interdisciplinary Understanding: What Counts as Quality Work? Veronica Boix-Mansilla, Interdisciplinary Studies Project, Harvard University Interdisciplinary understanding I. Definitions Individuals demonstrate
A CULTURAL APPROACH TO STUDY CUSTOMER RELATIONSHIP MANAGEMENT (CRM) SYSTEMS
 SYSTEMS") A CULTURAL APPROACH TO STUDY CUSTOMER RELATIONSHIP MANAGEMENT (CRM) SYSTEMS Maged A. A. Ali Information Systems and Computing Department Brunel University, UK Maged.Abdelsalam@brunel.ac.uk Sarmad Alshawi
A CULTURAL APPROACH TO STUDY CUSTOMER RELATIONSHIP MANAGEMENT (CRM) SYSTEMS Maged A. A. Ali Information Systems and Computing Department Brunel University, UK Maged.Abdelsalam@brunel.ac.uk Sarmad Alshawi
Reading Questions. Lo and Yeung, 2007: 2 19. Schuurman, 2004: Chapter 1. 1. What distinguishes data from information? How are data represented?
 Reading Questions Week two Lo and Yeung, 2007: 2 19. Schuurman, 2004: Chapter 1. 1. What distinguishes data from information? How are data represented? 2. What sort of problems are GIS designed to solve?
Home Economics Education
 Subject Area Syllabus and Guidelines Home Economics Education (Part 2 of 4) Level 4 to Beyond Level 6 Note: The PDF version of this document has been split into sections for easier download. This file
Draft Martin Doerr ICS-FORTH, Heraklion, Crete Oct 4, 2001
 A comparison of the OpenGIS TM Abstract Specification with the CIDOC CRM 3.2 Draft Martin Doerr ICS-FORTH, Heraklion, Crete Oct 4, 2001 1 Introduction This Mapping has the purpose to identify, if the OpenGIS
ADVANCED GEOGRAPHIC INFORMATION SYSTEMS Vol. II - Using Ontologies for Geographic Information Intergration Frederico Torres Fonseca
 USING ONTOLOGIES FOR GEOGRAPHIC INFORMATION INTEGRATION Frederico Torres Fonseca The Pennsylvania State University, USA Keywords: ontologies, GIS, geographic information integration, interoperability Contents
THREE-DIMENSIONAL CARTOGRAPHIC REPRESENTATION AND VISUALIZATION FOR SOCIAL NETWORK SPATIAL ANALYSIS
 CO-205 THREE-DIMENSIONAL CARTOGRAPHIC REPRESENTATION AND VISUALIZATION FOR SOCIAL NETWORK SPATIAL ANALYSIS SLUTER C.R.(1), IESCHECK A.L.(2), DELAZARI L.S.(1), BRANDALIZE M.C.B.(1) (1) Universidade Federal
o Ivy Tech DESN 105- Architectural Design I DESN 113- Intermediate CAD o Vincennes University ARCH 221- Advanced Architectural Software Applications
 Indiana Department of Education Academic Course Framework ARCHITECHTURAL DRAFTING AND DESIGN II Architectural Drafting and Design II presents a history and survey of architecture and focuses on the creative
Architectural Information Management 06 Networking and Data Management
 Engineering Portals Networked Collaborative Architectural Information Management SZEWCZYK, Jaroslaw Bialystok University of Technology, Faculty of Architecture jarsz@cksr.ac.bialystok.pl Engineering projects
Virtual Environments - Basics -
 Virtual Environments - Basics - What Is Virtual Reality? A Web-Based Introduction Version 4 Draft 1, September, 1998 Jerry Isdale http://www.isdale.com/jerry/vr/whatisvr.html Virtual Environments allow
Orford, S., Dorling, D. and Harris, R. (2003) Cartography and Visualization in Rogers, A. and Viles, H.A. (eds), The Student s Companion to
 Cartography and Visualization in Rogers, A. and Viles, H.A. (eds), The Student s Companion to") Orford, S., Dorling, D. and Harris, R. (2003) Cartography and Visualization in Rogers, A. and Viles, H.A. (eds), The Student s Companion to Geography, 2nd Edition, Part III, Chapter 27, pp 151-156, Blackwell
Orford, S., Dorling, D. and Harris, R. (2003) Cartography and Visualization in Rogers, A. and Viles, H.A. (eds), The Student s Companion to Geography, 2nd Edition, Part III, Chapter 27, pp 151-156, Blackwell
Part I: Decision Support Systems
 Part I: Decision Support Systems MBA 8473 1 Cognitive Objectives 43. Identify information processing as the foundation of managerial work. 44. Identify which media are more suitable for supporting managerial
The Future of Conference Room Collaboration
 INTRODUCING MEZZANINE: The Future of Conference Room Collaboration Faster decision-making, more effective collaboration, richer communication. Oblong s Mezzanine revolutionizes your conference room, meeting
DEVELOPMENT OF AN INTERNET-BASED SYNCHRONOUS CIS FOR COLLABORATIVE SPATIAL DECISION MAKING
 DEVELOPMENT OF AN INTERNET-BASED SYNCHRONOUS CIS FOR COLLABORATIVE SPATIAL DECISION MAKING By Lijun GU B.Sc., China University of Geosciences Wuhan, P.R.China, 1994 A thesis Presented to Ryerson University
INTELLIGENT AGENTS AND SUPPORT FOR BROWSING AND NAVIGATION IN COMPLEX SHOPPING SCENARIOS
 ACTS GUIDELINE GAM-G7 INTELLIGENT AGENTS AND SUPPORT FOR BROWSING AND NAVIGATION IN COMPLEX SHOPPING SCENARIOS Editor: Martin G. Steer (martin@eurovoice.co.uk) Contributors: TeleShoppe ACTS Guideline GAM-G7
Geographical Information Systems (GIS) in Education Alexis Pang
 in Education Alexis Pang") Geographical Information Systems (GIS) in Education Alexis Pang Introduction The aim of this literature review is to provide educators with a basic understanding of Geographical Information Systems (GIS),
Geographical Information Systems (GIS) in Education Alexis Pang Introduction The aim of this literature review is to provide educators with a basic understanding of Geographical Information Systems (GIS),
Summary Bachelor of Environment Credential and Concentrations (For review prior to SFU student focus group participation) November 2012
 November 2012") Summary Bachelor of Environment Credential and Concentrations (For review prior to SFU student focus group participation) November 2012 First of all, thank you for taking the time to review this Bachelor
Summary Bachelor of Environment Credential and Concentrations (For review prior to SFU student focus group participation) November 2012 First of all, thank you for taking the time to review this Bachelor
Extraction of Satellite Image using Particle Swarm Optimization
 Extraction of Satellite Image using Particle Swarm Optimization Er.Harish Kundra Assistant Professor & Head Rayat Institute of Engineering & IT, Railmajra, Punjab,India. Dr. V.K.Panchal Director, DTRL,DRDO,
Developing and assessing light-weight data-driven exploratory geovisualization tools for the web
 Developing and assessing light-weight data-driven exploratory geovisualization tools for the web Erik B. Steiner, Alan M. MacEachren, Diansheng Guo GeoVISTA Center, Department of Geography, 302 Walker,
Morten Fjeld. Designing for Tangible Interaction. Man-Machine Interaction IHA, ETH Zurich
 Morten Fjeld Designing for Tangible Interaction Man-Machine Interaction IHA, ETH Zurich Morten Fjeld, ETH Zürich LMU München, 3. November 2003 1/23 Overview What is Tangible Interaction? Collaborative
The Scientific Data Mining Process
 Chapter 4 The Scientific Data Mining Process When I use a word, Humpty Dumpty said, in rather a scornful tone, it means just what I choose it to mean neither more nor less. Lewis Carroll [87, p. 214] In
Modeling of Mixed Decision Making Process
 International Conference on Information Technology and e-services 2012 Modeling of Mixed Decision Making Process Nesrine BEN YAHIA, Narjès BELLAMINE and Henda BEN GHEZALA RIADI-GDL laboratory National
Design and Deployment of Specialized Visualizations for Weather-Sensitive Electric Distribution Operations
 Fourth Symposium on Policy and Socio-Economic Research 4.1 Design and Deployment of Specialized Visualizations for Weather-Sensitive Electric Distribution Operations Lloyd A. Treinish IBM, Yorktown Heights,
Utilizing spatial information systems for non-spatial-data analysis
 Jointly published by Akadémiai Kiadó, Budapest Scientometrics, and Kluwer Academic Publishers, Dordrecht Vol. 51, No. 3 (2001) 563 571 Utilizing spatial information systems for non-spatial-data analysis
可 视 化 与 可 视 计 算 概 论. Introduction to Visualization and Visual Computing 袁 晓 如 北 京 大 学 2015.12.23
 可 视 化 与 可 视 计 算 概 论 Introduction to Visualization and Visual Computing 袁 晓 如 北 京 大 学 2015.12.23 2 Visual Analytics Adapted from Jim Thomas s slides 3 Visual Analytics Definition Visual Analytics is the
Models of Dissertation Research in Design
 Models of Dissertation Research in Design S. Poggenpohl Illinois Institute of Technology, USA K. Sato Illinois Institute of Technology, USA Abstract This paper is a meta-level reflection of actual experience
Exploratory Data Analysis for Ecological Modelling and Decision Support
 Exploratory Data Analysis for Ecological Modelling and Decision Support Gennady Andrienko & Natalia Andrienko Fraunhofer Institute AIS Sankt Augustin Germany http://www.ais.fraunhofer.de/and 5th ECEM conference,
Frequency, definition Modifiability, existence of multiple operations & strategies
 Human Computer Interaction Intro HCI 1 HCI's Goal Users Improve Productivity computer users Tasks software engineers Users System Cognitive models of people as information processing systems Knowledge
Interactive Multimedia Courses-1
 Interactive Multimedia Courses-1 IMM 110/Introduction to Digital Media An introduction to digital media for interactive multimedia through the study of state-of-the-art methods of creating digital media:
Digital Cadastral Maps in Land Information Systems
 LIBER QUARTERLY, ISSN 1435-5205 LIBER 1999. All rights reserved K.G. Saur, Munich. Printed in Germany Digital Cadastral Maps in Land Information Systems by PIOTR CICHOCINSKI ABSTRACT This paper presents
Standards for Certification in Early Childhood Education [26.110-26.270]
![Standards for Certification in Early Childhood Education [26.110-26.270]](/thumbs/24/3436110.jpg "Standards for Certification in Early Childhood Education [26.110-26.270]") I.B. SPECIFIC TEACHING FIELDS Standards for Certification in Early Childhood Education [26.110-26.270] STANDARD 1 Curriculum The competent early childhood teacher understands and demonstrates the central
I.B. SPECIFIC TEACHING FIELDS Standards for Certification in Early Childhood Education [26.110-26.270] STANDARD 1 Curriculum The competent early childhood teacher understands and demonstrates the central
Citizen participation has become an increasingly
 Ground Truthing Policy Using Participatory Map-Making to Connect Citizens and Decision Makers Shalini P. Vajjhala Citizen participation has become an increasingly important component of development planning
Service-Oriented Visualization of Virtual 3D City Models
 Service-Oriented Visualization of Virtual 3D City Models Authors: Jan Klimke, Jürgen Döllner Computer Graphics Systems Division Hasso-Plattner-Institut, University of Potsdam, Germany http://www.hpi3d.de
Transana 2.60 Distinguishing features and functions
 Transana 2.60 Distinguishing features and functions This document is intended to be read in conjunction with the Choosing a CAQDAS Package Working Paper which provides a more general commentary of common
Teaching Methodology for 3D Animation
 Abstract The field of 3d animation has addressed design processes and work practices in the design disciplines for in recent years. There are good reasons for considering the development of systematic
Abstract. 1. Introduction
 Abstract Usability Studies of Geovisualization Software in the Workplace Trudy A. Suchan U.S. Census Bureau, Population Division 4700 Silver Hill Road, Mail Stop 8800 Washington, DC 20233-8800 trudy.a.suchan@census.gov
DATA QUALITY AND SCALE IN CONTEXT OF EUROPEAN SPATIAL DATA HARMONISATION
 DATA QUALITY AND SCALE IN CONTEXT OF EUROPEAN SPATIAL DATA HARMONISATION Katalin Tóth, Vanda Nunes de Lima European Commission Joint Research Centre, Ispra, Italy ABSTRACT The proposal for the INSPIRE
ADVANCED GEOGRAPHIC INFORMATION SYSTEMS Vol. II - Introduction to Spatial Decision Support System Piotr Jankowski and Timothy Nyerges
 INTRODUCTION TO SPATIAL DECISION SUPPORT SYSTEM Piotr Jankowski San Diego State University, San Diego, USA Timothy Nyerges University of Washington, Seattle, USA Keywords: spatial decision support systems,
FUTURE VIEWS OF FIELD DATA COLLECTION IN STATISTICAL SURVEYS
 FUTURE VIEWS OF FIELD DATA COLLECTION IN STATISTICAL SURVEYS Sarah Nusser Department of Statistics & Statistical Laboratory Iowa State University nusser@iastate.edu Leslie Miller Department of Computer
Doctor of Philosophy (Ph.D.), Major in. Geographic Information Science. Ph.D. Program. Educational Goal. Admission Policy. Advancement to Candidacy
, Major in. Geographic Information Science. Ph.D. Program. Educational Goal. Admission Policy. Advancement to Candidacy") Texas State University 1 Doctor of Philosophy (Ph.D.), Major in Geographic Information Science Ph.D. Program The course curriculum for the doctoral degree is designed to provide depth and breadth of knowledge
Texas State University 1 Doctor of Philosophy (Ph.D.), Major in Geographic Information Science Ph.D. Program The course curriculum for the doctoral degree is designed to provide depth and breadth of knowledge
Directions in Electronic Portfolio Development
 Directions in Electronic Portfolio Development David Gibson National Institute for Community Innovations, USA Vermont Institutes, USA Helen Barrett University of Alaska Anchorage, USA International Society
FEAWEB ASP Issue: 1.0 Stakeholder Needs Issue Date: 03/29/2000. 04/07/2000 1.0 Initial Description Marco Bittencourt
 )($:(%$63 6WDNHKROGHU1HHGV,VVXH 5HYLVLRQ+LVWRU\ 'DWH,VVXH 'HVFULSWLRQ $XWKRU 04/07/2000 1.0 Initial Description Marco Bittencourt &RQILGHQWLDO DPM-FEM-UNICAMP, 2000 Page 2 7DEOHRI&RQWHQWV 1. Objectives
Geovisual Analytics Exploring and analyzing large spatial and multivariate data. Prof Mikael Jern & Civ IngTobias Åström. http://ncva.itn.liu.
 Geovisual Analytics Exploring and analyzing large spatial and multivariate data Prof Mikael Jern & Civ IngTobias Åström http://ncva.itn.liu.se/ Agenda Introduction to a Geovisual Analytics Demo Explore
Dynamism and Data Management in Distributed, Collaborative Working Environments
 Dynamism and Data Management in Distributed, Collaborative Working Environments Alexander Kipp 1, Lutz Schubert 1, Matthias Assel 1 and Terrence Fernando 2, 1 High Performance Computing Center Stuttgart,
Issues of Collaboration in a Virtual Environment
 Preface World Wide Web is becoming a utility, not unlike electricity or running water in our homes. This creates new ways of using the web, where Social media plays a particular role. This gives an unprecedented
Spatiotemporal Information Organization and Visualization on Tidal Level
 Spatiotemporal Information Organization Visualization on Tidal Level B. Huang a, *, Y. Zhang a, Y. Wang a, Q. Liu b a School of Geoscience, China University of Petroleum,QingDao 266580,China huangbhu@163.com
Spring 2014: Graphic Design
 Spring 2014: Graphic Design Graphic design is a large and growing profession in demand in the global communications world. In addition to an emphasis on traditional skills and production methods, the program
The UCC-21 cognitive skills that are listed above will be met via the following objectives.
 Master Syllabus Department of Geography GEOG 265: Introduction to Geographic Information Systems Course Description Fundamentals of geographic information systems (GIS). How to visualize geographic information
CHAPTER-24 Mining Spatial Databases
 CHAPTER-24 Mining Spatial Databases 24.1 Introduction 24.2 Spatial Data Cube Construction and Spatial OLAP 24.3 Spatial Association Analysis 24.4 Spatial Clustering Methods 24.5 Spatial Classification
Merging Tactile Sensory Input and Audio Data by Means of The Talking Tactile Tablet
 Merging Tactile Sensory Input and Audio Data by Means of The Talking Tactile Tablet Steven Landua 1 and Lesley Wells 2 1 (Touch Graphics New York) 2 (Royal National College for the Blind UK) Abstract.
School of Advanced Studies Doctor Of Management In Organizational Leadership/information Systems And Technology. DM/IST 004 Requirements
 School of Advanced Studies Doctor Of Management In Organizational Leadership/information Systems And Technology The mission of the Information Systems and Technology specialization of the Doctor of Management
etips--educational Technology Integration and Implementation Principles
 56 Dexter Chapter III etips--educational Technology Integration and Implementation Principles Sara Dexter University of Minnesota, USA WHY A SET OF PRINCIPLES TO GUIDE TEACHERS ABOUT INTEGRATING AND IMPLEMENTING
Sustaining the Benefits of Action Research in Decision Support Tools Development: Lessons from an Urban Water Utility in Africa
 Sustaining the Benefits of Action Research in Decision Support Tools Development: Lessons from an Urban Water Utility in Africa Frank Kizito * National Water and Sewerage Corporation Kampala, Uganda Extended
Interactive Data Mining and Visualization
 Interactive Data Mining and Visualization Zhitao Qiu Abstract: Interactive analysis introduces dynamic changes in Visualization. On another hand, advanced visualization can provide different perspectives
Designing Socio-Technical Systems to Support Guided Discovery-Based Learning in Students: The Case of the Globaloria Game Design Initiative
 Designing Socio-Technical Systems to Support Guided Discovery-Based Learning in Students: The Case of the Globaloria Game Design Initiative Rebecca Reynolds 1, Sean P. Goggins 2 1 Rutgers University School
BS Environmental Science (2013-2014)
") BS Environmental Science (2013-2014) Program Information Point of Contact Brian M. Morgan (brian.morgan@marshall.edu) Support for University and College Missions Marshall University is a multi-campus public
BS Environmental Science (2013-2014) Program Information Point of Contact Brian M. Morgan (brian.morgan@marshall.edu) Support for University and College Missions Marshall University is a multi-campus public
Using i for Transformational Creativity in Requirements Engineering
 Using i for Transformational Creativity in Requirements Engineering Sushma Rayasam and Nan Niu Department of EECS, University of Cincinnati Cincinnati, OH, USA 45221 rayasasa@mail.uc.edu, nan.niu@uc.edu
Worlds Without Words
 Worlds Without Words Ivan Bretan ivan@sics.se Jussi Karlgren jussi@sics.se Swedish Institute of Computer Science Box 1263, S 164 28 Kista, Stockholm, Sweden. Keywords: Natural Language Interaction, Virtual
Belmont Forum Collaborative Research Action on Mountains as Sentinels of Change
 Belmont Forum Collaborative Research Action on Mountains as Sentinels of Change 1. Background and rationale Mountains exist in many regions of the world and are home to a significant fraction of the world
Bachelor's Degree in Business Administration and Master's Degree course description
 Bachelor's Degree in Business Administration and Master's Degree course description Bachelor's Degree in Business Administration Department s Compulsory Requirements Course Description (402102) Principles
CoVitesse: A Groupware Interface for Collaborative Navigation on the WWW
 CoVitesse: A Groupware Interface for Collaborative Navigation on the WWW Yann Laurillau Laurence Nigay CLIPS-IMAG Laboratory, University of Grenoble Domaine Universitaire, BP 53, 38041 Grenoble Cedex 9,
HAZARD RISK ASSESSMENT, MONITORING, MAINTENANCE AND MANAGEMENT SYSTEM (HAMMS) FOR LANDSLIDE AND FLOOD. Mohd. Nor Desa, Rohayu and Lariyah, UNITEN
 FOR LANDSLIDE AND FLOOD. Mohd. Nor Desa, Rohayu and Lariyah, UNITEN") HAZARD RISK ASSESSMENT, MONITORING, MAINTENANCE AND MANAGEMENT SYSTEM (HAMMS) FOR LANDSLIDE AND FLOOD Mohd. Nor Desa, Rohayu and Lariyah, UNITEN WHAT WE HAVE IN MIND AND FROM OUR PREVIOUS PROJECT CONTRIBUTION
HAZARD RISK ASSESSMENT, MONITORING, MAINTENANCE AND MANAGEMENT SYSTEM (HAMMS) FOR LANDSLIDE AND FLOOD Mohd. Nor Desa, Rohayu and Lariyah, UNITEN WHAT WE HAVE IN MIND AND FROM OUR PREVIOUS PROJECT CONTRIBUTION
Master s Programme in International Administration and Global Governance
 Programme syllabus for the Master s Programme in International Administration and Global Governance 120 higher education credits Second Cycle Confirmed by the Faculty Board of Social Sciences 2015-05-11
Malay A. Dalal Madhav Erraguntla Perakath Benjamin. Knowledge Based Systems, Inc. (KBSI) College Station, TX 77840, U.S.A.
 College Station, TX 77840, U.S.A.") AN INTRODUCTION TO USING PROSIM FOR BUSINESS PROCESS SIMULATION AND ANALYSIS Malay A. Dalal Madhav Erraguntla Perakath Benjamin Knowledge Based Systems, Inc. (KBSI) College Station, TX 77840, U.S.A. ABSTRACT
AN INTRODUCTION TO USING PROSIM FOR BUSINESS PROCESS SIMULATION AND ANALYSIS Malay A. Dalal Madhav Erraguntla Perakath Benjamin Knowledge Based Systems, Inc. (KBSI) College Station, TX 77840, U.S.A. ABSTRACT
Daryl Harrison Golder Associates Ltd., Canada June 2014
 A Picture Paints a Thousand Words : The Role of Visualization in Communicating Project Design to Support Consultation and Understanding in the ESIA Process Daryl Harrison Golder Associates Ltd., Canada
Virtual Team Collaboration Glossary
 Virtual Team Collaboration Glossary Steve Prahst, Rhonda Arterberrie, and Dennis Kay Knowledge Management and Collaborative Technologies Branch NASA Glenn Research Center Introduction Most NASA projects
Digital Industries Trailblazer Apprenticeship. Software Developer - Occupational Brief
 Digital Industries Trailblazer Apprenticeship Software Developer - Occupational Brief Table of Contents Contents 1 Software Developer Trailblazer Apprenticeship Introduction... 1 2 Software Developer Trailblazer
SPATIAL DATA CLASSIFICATION AND DATA MINING
 , pp.-40-44. Available online at http://www. bioinfo. in/contents. php?id=42 SPATIAL DATA CLASSIFICATION AND DATA MINING RATHI J.B. * AND PATIL A.D. Department of Computer Science & Engineering, Jawaharlal
Narcissus: Visualising Information
 Narcissus: Visualising Information R.J.Hendley, N.S.Drew, A.M.Wood & R.Beale School of Computer Science University of Birmingham, B15 2TT, UK {R.J.Hendley, N.S.Drew, A.M.Wood, R.Beale}@cs.bham.ac.uk Abstract
Years and Curriculum Levels
 Years and Curriculum Levels This diagram shows how curriculum levels typically relate to years at school. Many students do not, however, fit this pattern. They include those with special learning needs,
Instructional Transaction Theory: An Instructional Design Model based on Knowledge Objects
 : An Instructional Design Model based on Knowledge Objects M. David Merrill and the ID 2 Research Group Department of Instructional Technology Utah State University, Logan, UT 84322-2830, USA Educational
Data Driven Discovery In the Social, Behavioral, and Economic Sciences
 Data Driven Discovery In the Social, Behavioral, and Economic Sciences Simon Appleford, Marshall Scott Poole, Kevin Franklin, Peter Bajcsy, Alan B. Craig, Institute for Computing in the Humanities, Arts,
Assessing public preferences for managing cultural heritage: tools and methodologies
 Assessing public preferences for managing cultural heritage: tools and methodologies Patrizia RIGANTI Summary It is crucial to increase citizens and stakeholders participation in all decision-makings,
WEB-BASED SIMULATION OF MANUFACTURING SYSTEMS
 ISSN 1726-4529 Int j simul model 8 (2009) 2, 102-113 Professional paper WEB-BASED SIMULATION OF MANUFACTURING SYSTEMS Kehris, E. Technological Education Institute of Serres, Terma Magnisias, 621 24 Serres,
GEO-VISUALIZATION SUPPORT FOR MULTIDIMENSIONAL CLUSTERING
 Geoinformatics 2004 Proc. 12th Int. Conf. on Geoinformatics Geospatial Information Research: Bridging the Pacific and Atlantic University of Gävle, Sweden, 7-9 June 2004 GEO-VISUALIZATION SUPPORT FOR MULTIDIMENSIONAL