Uncertainty visualization in the climate change discourse: from the IPCC reports to climate web portals
|
|
|
- Marion Madlyn Reed
- 8 years ago
- Views:
Transcription
1 Uncertainty visualization in the climate change discourse: from the IPCC reports to climate web portals New Perspectives on Global Environmental Images, Paris, October 9 th, 2014 Thomas Nocke Potsdam Institute for Climate Impact Research

2 Outline Uncertainty typology Uncertainties in IPCC climate data visualizations spatial temporal abstract Uncertainty presentation on interactive climate visualization platforms Conclusion

3 Outline Uncertainty typology Uncertainties in IPCC climate data visualizations spatial temporal abstract Uncertainty presentation on interactive climate visualization platforms Conclusion

4

5

6 Schematic diagram showing the relative importance of different uncertainties, and their evolution in time. [IPCC AR5 WG1 Ch. 1]

7 IPCC uncertainty typology (1) A depiction of evidence and agreement statements and their relationship to confidence. [IPCC AR5 WG1 TS]

8 IPCC uncertainty typology (2) IPCC uncertainty terminology [IPCC AR5 WG1 TS]

9 Uncertainty identification example (cigrasp web portal)

10

11 Outline Uncertainty typology Uncertainties in IPCC climate data visualizations spatial temporal abstract Uncertainty presentation on interactive climate visualization platforms Conclusion

12

13

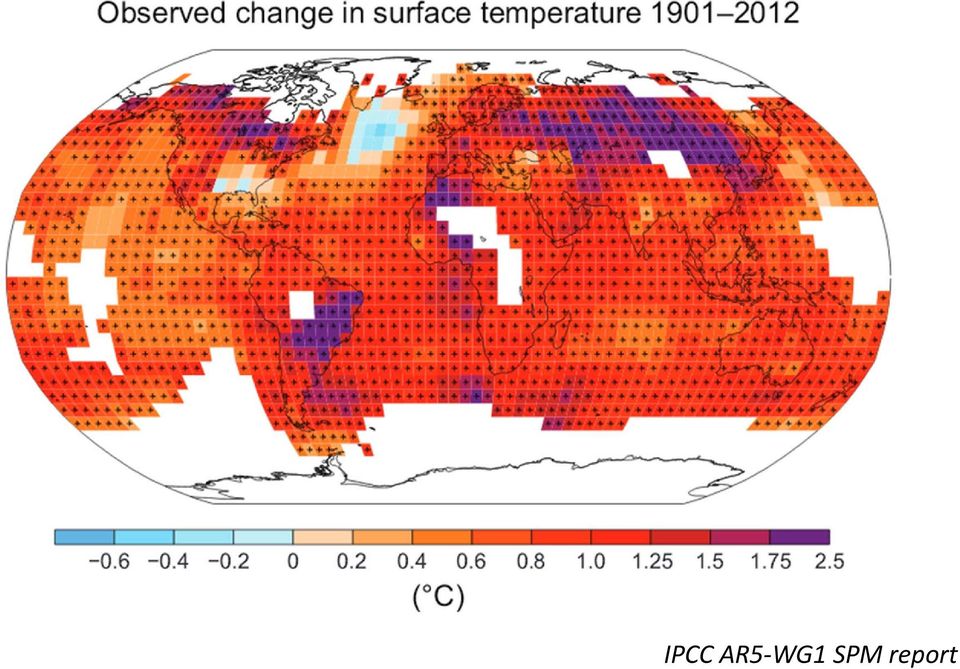
14 IPCC AR5 WG1 SPM report
15 [ ] hatching indicates regions where the multi model mean is small compared to natural internal variability (i.e., less than one standard deviation of natural internal variability in 20 year means). Stippling indicates regions where the multi model mean is large compared to natural internal variability (i.e., greater than two standard deviations of natural internal variability in 20 year means) and where at least 90% of models agree on the sign of change [ ] IPCC AR5 WG1 SPM report
 and where at least 90% of models agree on the sign of change")
16 Changes in winter (December March) precipitation corresponding to a unit deviation of the NAO index over 1900 to [ ] Stippling indicates values greater than 0.3 mm per day and hatching values less than 0.3 mm per day. IPCC AR4 WG1 Ch. 3
![to 2005. [ ] Stippling indicates values greater than 0.](/docs-images/44/13003895/images/page_16.jpg "3 mm per day and hatching values less than 0.3 mm per day. IPCC AR4 WG1 Ch.")
17 Trends in river ice cover duration in Canada. Upward pointing triangles indicate lengthening of the ice cover period while downward triangles indicate shortening of the ice cover period. Trends significant at the 99 and 90% confidence levels are marked by larger filled and hollow triangles, respectively. Smaller triangles indicate trends that are not significant at the 90% level (IPCC AR4 WG1 Ch. 4, Zhang et al., 2001).

18

19 Contour boxplots [Whitaker et al. 2013] Original spaghetti image Combination of statistical areas and outlier preservation

20 Annotation lines [Kinkeldey et al. 2013]

21 Outline Uncertainty typology Uncertainties in IPCC climate data visualizations spatial temporal abstract Uncertainty presentation on interactive climate visualization platforms Conclusion
22 Time chart spagetti und decadal bandwidth IPCC AR5 WG1 SPM report
23 Temporal bandwidth representation using area coloring [IPCC AR5 WG1]
24 [IPCC AR5 WG1 TS]
25 Temporal bandwidth representation using area coloring (multiple time series) [IPCC AR5 WG1]
26 Temporal bandwidth representation (mixed) [IPCC AR5 WG1 TS]
27 Outline Uncertainty typology Uncertainties in IPCC climate data visualizations spatial temporal abstract Uncertainty presentation on interactive climate visualization platforms Conclusion
28 Box plots [Wikipedia, 2014] Simplified box plots [IPCC AR5 SPM WGIII]
29 Uncertainties in bar charts (1) Additional whiskers at the bar charts [IPCC AR5 SPM WGI]
30 Uncertainties in bar charts (2) Uncertainties in stacked bar charts (right) [IPCC AR5 SPM WGIII]
31 Outline Uncertainty typology Uncertainties in IPCC climate data visualizations spatial temporal abstract Uncertainty presentation on interactive climate visualization platforms Conclusion
32
33 Classification of climate web portal uncertainty visualizations
34
35 German Climate Atlas by German Weather Service (DWD)
36 ClimateImpactsOnline.com web portal
37 Presentation of the model heterogeneities for a certain location (in the future) by depicting (present) climatically comparable places (Wisconsin Climate Analogs)
38 Outline Uncertainty typology Uncertainties in IPCC climate data visualizations spatial temporal abstract Uncertainty presentation on interactive climate visualization platforms Conclusion
39 Conclusion
40 Uncertainty visualization in the climate change discourse: from the IPCC reports to climate web portals Thomas Nocke potsdam.de
41 References Brodlie, Ken and Rodolfo Allendes Osorio and Adriano Lopes; A Review of Uncertainty in Data Visualization. In John Dill, Rae Earnshaw, David Kasik, John Vince and Pak Chung Wong (Eds.), Expanding the Frontiers of Visual Analytics and Visualization, Springer Verlag London, pp , Dessai S; Hulme M (2004) Does climate adaptation policy need probabilities?, Climate Policy, 4, pp Kinkeldey, C., Smith, J., Klippel, A. & Schiewe, J. : Assessing the Impact of Design Decisions on the Usability of Uncertainty Visualization: Noise Annotation Lines for the Visual Representation of Attribute Uncertainty in Maps. In: Proceedings of 26th International Cartographic Conference ICC 2013 Dresden IPCC AR4 2007: IPCC AR5 2013/2014: Reusser, D.E.; Wrobel, M.; Nocke, T.; Sterzel, T.; Förster, H.; Kropp, J.P.: Presentation of uncertainties on web platforms for climate change information, Procedia Environmental Sciences 7, (January 2011) Visser, H., A.C. Petersen, A.H.W. Beusen, P.S.C. Heuberger, P.H.M. Janssen: Guidance for uncertainty assessment and communication Checklist for uncertainty in spatial information and visualising spatial uncertainty (2006) Whitaker, R.T.; Mirzargar, M.; Kirby, R.M., "Contour Boxplots: A Method for Characterizing Uncertainty in Feature Sets from Simulation Ensembles," Visualization and Computer Graphics, IEEE Transactions on, vol.19, no.12, pp.2713,2722, Dec. 2013
Abstract. Introduction
 CODATA Prague Workshop Information Visualization, Presentation, and Design 29-31 March 2004 Abstract Goals of Analysis for Visualization and Visual Data Mining Tasks Thomas Nocke and Heidrun Schumann University
Design and Deployment of Specialized Visualizations for Weather-Sensitive Electric Distribution Operations
 Fourth Symposium on Policy and Socio-Economic Research 4.1 Design and Deployment of Specialized Visualizations for Weather-Sensitive Electric Distribution Operations Lloyd A. Treinish IBM, Yorktown Heights,
Visualization of uncertainty and ensemble data: Exploration of climate modeling and weather forecast data with integrated ViSUS-CDAT systems
 Visualization of uncertainty and ensemble data: Exploration of climate modeling and weather forecast data with integrated ViSUS-CDAT systems Kristin Potter 1, Andrew Wilson 2, Peer-Timo Bremer 3, Dean
APPLICATION OF DATA MINING TECHNIQUES FOR BUILDING SIMULATION PERFORMANCE PREDICTION ANALYSIS. email paul@esru.strath.ac.uk
 Eighth International IBPSA Conference Eindhoven, Netherlands August -4, 2003 APPLICATION OF DATA MINING TECHNIQUES FOR BUILDING SIMULATION PERFORMANCE PREDICTION Christoph Morbitzer, Paul Strachan 2 and
Applications of Dynamic Representation Technologies in Multimedia Electronic Map
 Applications of Dynamic Representation Technologies in Multimedia Electronic Map WU Guofeng CAI Zhongliang DU Qingyun LONG Yi (School of Resources and Environment Science, Wuhan University, Wuhan, Hubei.
Information visualization examples
 Information visualization examples 350102: GenICT II 37 Information visualization examples 350102: GenICT II 38 Information visualization examples 350102: GenICT II 39 Information visualization examples
Diagrams and Graphs of Statistical Data
 Diagrams and Graphs of Statistical Data One of the most effective and interesting alternative way in which a statistical data may be presented is through diagrams and graphs. There are several ways in
Climate modelling. Dr. Heike Huebener Hessian Agency for Environment and Geology Hessian Centre on Climate Change
 Hessisches Landesamt für Umwelt und Geologie Climate modelling Dr. Heike Huebener Hessian Agency for Environment and Geology Hessian Centre on Climate Change Climate: Definition Weather: momentary state
Data Exploration Data Visualization
 Data Exploration Data Visualization What is data exploration? A preliminary exploration of the data to better understand its characteristics. Key motivations of data exploration include Helping to select
Visibility optimization for data visualization: A Survey of Issues and Techniques
 Visibility optimization for data visualization: A Survey of Issues and Techniques Ch Harika, Dr.Supreethi K.P Student, M.Tech, Assistant Professor College of Engineering, Jawaharlal Nehru Technological
GIS & Spatial Modeling
 Geography 4203 / 5203 GIS & Spatial Modeling Class 2: Spatial Doing - A discourse about analysis and modeling in a spatial context Updates Class homepage at: http://www.colorado.edu/geography/class_homepages/geog_4203
A REVIEW AND COMPARISON OF DATA VISUALIZATION TECHNIQUES USED IN BUILDING DESIGN AND IN BUILDING SIMULATION
 Eleventh International IBPSA Conference Glasgow, Scotland July 27-30, 2009 A REVIEW AND COMPARISON OF DATA VISUALIZATION TECHNIQUES USED IN BUILDING DESIGN AND IN BUILDING SIMULATION Shweta Srivastav,
Schedule Risk Analysis Simulator using Beta Distribution
 Schedule Risk Analysis Simulator using Beta Distribution Isha Sharma Department of Computer Science and Applications, Kurukshetra University, Kurukshetra, Haryana (INDIA) ishasharma211@yahoo.com Dr. P.K.
DATA QUALITY AND SCALE IN CONTEXT OF EUROPEAN SPATIAL DATA HARMONISATION
 DATA QUALITY AND SCALE IN CONTEXT OF EUROPEAN SPATIAL DATA HARMONISATION Katalin Tóth, Vanda Nunes de Lima European Commission Joint Research Centre, Ispra, Italy ABSTRACT The proposal for the INSPIRE
Universidade de Aveiro Departamento de Electrónica, Telecomunicações e Informática. Introduction to Information Visualization
 Universidade de Aveiro Departamento de Electrónica, Telecomunicações e Informática Introduction to Information Visualization www.portugal-migration.info Information Visualization Beatriz Sousa Santos,
Iris Sample Data Set. Basic Visualization Techniques: Charts, Graphs and Maps. Summary Statistics. Frequency and Mode
 Iris Sample Data Set Basic Visualization Techniques: Charts, Graphs and Maps CS598 Information Visualization Spring 2010 Many of the exploratory data techniques are illustrated with the Iris Plant data
Baudouin Raoult, Iryna Rozum, Dick Dee
 ECMWF contribution to the EU funded CHARME Project: A Significant Event Viewer tool Matthew Manoussakis Baudouin Raoult, Iryna Rozum, Dick Dee 5th Workshop on the use of GIS/OGC standards in meteorology
Standardized Runoff Index (SRI)
") Standardized Runoff Index (SRI) Adolfo Mérida Abril Javier Gras Treviño Contents 1. About the SRI SRI in the world Methodology 2. Comments made in Athens on SRI factsheet 3. Last modifications of the factsheet
Standardized Runoff Index (SRI) Adolfo Mérida Abril Javier Gras Treviño Contents 1. About the SRI SRI in the world Methodology 2. Comments made in Athens on SRI factsheet 3. Last modifications of the factsheet
A Detailed Comparison of Information Visualization Tools Using a Reference Data Set
 Research Proposal A Detailed Comparison of Information Visualization Tools Using a Reference Data Set Eva Wohlfart e0125128@student.tuwien.ac.at February 2007 Contents Contents 1 Introduction 4 2 Examples
Data Visualization & Dashboard Design Best Practices and Tips
 Data Visualization & Dashboard Design Best Practices and Tips Understanding the User is the Key to Designing User-Centric Analytical Dashboards User-centric design is Catered specifically to the needs
Utilizing spatial information systems for non-spatial-data analysis
 Jointly published by Akadémiai Kiadó, Budapest Scientometrics, and Kluwer Academic Publishers, Dordrecht Vol. 51, No. 3 (2001) 563 571 Utilizing spatial information systems for non-spatial-data analysis
DATA LAYOUT AND LEVEL-OF-DETAIL CONTROL FOR FLOOD DATA VISUALIZATION
 DATA LAYOUT AND LEVEL-OF-DETAIL CONTROL FOR FLOOD DATA VISUALIZATION Sayaka Yagi Takayuki Itoh Ochanomizu University Mayumi Kurokawa Yuuichi Izu Takahisa Yoneyama Takashi Kohara Toshiba Corporation ABSTRACT
Statistical Storytelling Using HTML5 Interactive Visualization
 Statistical Storytelling Using HTML5 Interactive Visualization Mikael Jern NComVA NComVA AB, mikael.jern@ncomva.com Abstract Visual statistical storytelling is exemplified in this paper through telling
Climate, water and renewable energy in the Nordic countries
 102 Regional Hydrological Impacts of Climatic Change Hydroclimatic Variability (Proceedings of symposium S6 held during the Seventh IAHS Scientific Assembly at Foz do Iguaçu, Brazil, April 2005). IAHS
Spatial Data Management Development of e-learning Modules
 Spatial Data Management Development of e-learning Modules Antje Krüger and Thomas Brinkhoff Institute for Applied Photogrammetry and Geoinformatics (IAPG) FH Oldenburg/Ostfriesland/Wilhelmshaven (University
Risk Visualization: Presenting Data to Facilitate Better Risk Management
 Track 4: New Dimensions in Financial Risk Management Risk Visualization: Presenting Data to Facilitate Better Risk Management 1:30pm 2:20pm Presenter: Jeffrey Bohn Senior Managing Director, Head of Portfolio
BUILDING PORTFOLIO ANALYSIS SYSTEM USING ONTOLOGY-BASED INFORMATION SYSTYEM BUILDER
 BUILDING PORTFOLIO ANALYSIS SYSTEM USING ONTOLOGY-BASED INFORMATION SYSTYEM BUILDER MSC Eng. Samuil Nikolov TU-Varna, +359 52 644899, samuil@eurorisksystems.com INTRODUCTION The goal of this publication
IJSRD - International Journal for Scientific Research & Development Vol. 3, Issue 10, 2015 ISSN (online): 2321-0613
: 2321-0613") IJSRD - International Journal for Scientific Research & Development Vol. 3, Issue 10, 2015 ISSN (online): 2321-0613 Planning, Scheduling and Resource Optimization for A Villa by using Ms-Project 2010 Mr.
IJSRD - International Journal for Scientific Research & Development Vol. 3, Issue 10, 2015 ISSN (online): 2321-0613 Planning, Scheduling and Resource Optimization for A Villa by using Ms-Project 2010 Mr.
Data Visualization Basics for Students
 Data Visualization Basics for Students Dionisia de la Cerda Think about Your Message You want your audience to understand your message. This takes time. Think about your audience and plan your message.
Geographically weighted visualization interactive graphics for scale-varying exploratory analysis
 Geographically weighted visualization interactive graphics for scale-varying exploratory analysis Chris Brunsdon 1, Jason Dykes 2 1 Department of Geography Leicester University Leicester LE1 7RH cb179@leicester.ac.uk
Interactive Graphic Design Using Automatic Presentation Knowledge
 Interactive Graphic Design Using Automatic Presentation Knowledge Steven F. Roth, John Kolojejchick, Joe Mattis, Jade Goldstein School of Computer Science Carnegie Mellon University Pittsburgh, PA 15213
Estimating Potential Reduction Flood Benefits of Restored Wetlands
 Estimating Potential Reduction Flood Benefits of Restored Wetlands Kenneth W. Potter University of Wisconsin Introduction Throughout the summer of 1993 a recurring question was the impact of wetland drainage
ANALYZING SYSTEM MAINTAINABILITY USING ENTERPRISE ARCHITECTURE MODELS
 ANALYZING SYSTEM MAINTAINABILITY USING ENTERPRISE ARCHITECTURE MODELS Lagerström, Robert, Royal Institute of Technology, Osquldas väg 12, 100 44 Stockholm, Sweden, robertl@ics.kth.se Abstract A fast and
Visualizing Uncertainty: Computer Science Perspective
 Visualizing Uncertainty: Computer Science Perspective Ben Shneiderman, Univ of Maryland, College Park Alex Pang, Univ of California, Santa Cruz National Academy of Sciences Workshop, Washington, DC What
Lecture 2: Descriptive Statistics and Exploratory Data Analysis
 Lecture 2: Descriptive Statistics and Exploratory Data Analysis Further Thoughts on Experimental Design 16 Individuals (8 each from two populations) with replicates Pop 1 Pop 2 Randomly sample 4 individuals
Descriptive statistics Statistical inference statistical inference, statistical induction and inferential statistics
 Descriptive statistics is the discipline of quantitatively describing the main features of a collection of data. Descriptive statistics are distinguished from inferential statistics (or inductive statistics),
Data Visualization. or Graphical Data Presentation. Jerzy Stefanowski Instytut Informatyki
 Data Visualization or Graphical Data Presentation Jerzy Stefanowski Instytut Informatyki Data mining for SE -- 2013 Ack. Inspirations are coming from: G.Piatetsky Schapiro lectures on KDD J.Han on Data
A Visualization is Worth a Thousand Tables: How IBM Business Analytics Lets Users See Big Data
 White Paper A Visualization is Worth a Thousand Tables: How IBM Business Analytics Lets Users See Big Data Contents Executive Summary....2 Introduction....3 Too much data, not enough information....3 Only
Service-Oriented Visualization of Virtual 3D City Models
 Service-Oriented Visualization of Virtual 3D City Models Authors: Jan Klimke, Jürgen Döllner Computer Graphics Systems Division Hasso-Plattner-Institut, University of Potsdam, Germany http://www.hpi3d.de
How to Assess Visual Communication of Uncertainty? A Systematic Review of Geospatial. Uncertainty Visualisation User Studies
 The Cartographic Journal The World of Mapping ISSN: 0008-7041 (Print) 1743-2774 (Online) Journal homepage: http://www.tandfonline.com/loi/ycaj20 How to Assess Visual Communication of Uncertainty? A Systematic
How To Create An Analysis Tool For A Micro Grid
 International Workshop on Visual Analytics (2012) K. Matkovic and G. Santucci (Editors) AMPLIO VQA A Web Based Visual Query Analysis System for Micro Grid Energy Mix Planning A. Stoffel 1 and L. Zhang
ATLAS2000 Atlases of the Future in Internet
 ATLAS2000 Atlases of the Future in Internet M. Friedrich Institute for Physical Geography, University of Freiburg i.br., Germany (mafri@ipg.uni-freiburg.de) M. Melle Institute for Computer Science, University
Concept for an Ontology Based Web GIS Information System for HiMAT
 Concept for an Ontology Based Web GIS Information System for HiMAT Gerald Hiebel Klaus Hanke University of Innsbruck Surveying and Geoinformation Unit {gerald.hiebel; klaus.hanke}@uibk.ac.at Abstract The
Climate Change 2014 The recent conclusions of the IPCC. Lars Bärring Research scientist, SMHI Rossby Centre Swedish co-focal Point for IPCC
 Climate Change 2014 The recent conclusions of the IPCC Lars Bärring Research scientist, SMHI Rossby Centre Swedish co-focal Point for IPCC IPCC Fifth Assessment Report (AR5) Stockholm September 2013 1535
Visualization. Program visualization
 Visualization Program visualization Debugging programs without the aid of support tools can be extremely difficult. See My Hairest Bug War Stories, Marc Eisenstadt, Communications of the ACM, Vol 40, No
Microsoft Project 2010
 Tutorial 1: Planning a Project Microsoft Project 2010 In Tutorial Section 1.1 you will: Learn project management terminology Understand the benefits of project management Explore the Project 2010 window
Exploratory Data Analysis for Ecological Modelling and Decision Support
 Exploratory Data Analysis for Ecological Modelling and Decision Support Gennady Andrienko & Natalia Andrienko Fraunhofer Institute AIS Sankt Augustin Germany http://www.ais.fraunhofer.de/and 5th ECEM conference,
Water Quality Data Analysis & R Programming Internship Central Coast Water Quality Preservation, Inc. March 2013 February 2014
 Water Quality Data Analysis & R Programming Internship Central Coast Water Quality Preservation, Inc. March 2013 February 2014 Megan Gehrke, Graduate Student, CSU Monterey Bay Advisor: Sarah Lopez, Central
STAT355 - Probability & Statistics
 STAT355 - Probability & Statistics Instructor: Kofi Placid Adragni Fall 2011 Chap 1 - Overview and Descriptive Statistics 1.1 Populations, Samples, and Processes 1.2 Pictorial and Tabular Methods in Descriptive
Data Mining mit der JMSL Numerical Library for Java Applications
 Data Mining mit der JMSL Numerical Library for Java Applications Stefan Sineux 8. Java Forum Stuttgart 07.07.2005 Agenda Visual Numerics JMSL TM Numerical Library Neuronale Netze (Hintergrund) Demos Neuronale
BUILDING ENERGY DEMAND AGGREGATION AND SIMULATION TOOLS A DANISH CASE STUDY
 BUILDING ENERGY DEMAND AGGREGATION AND SIMULATION TOOLS A DANISH CASE STUDY P. Gianniou; A. Heller; C. Rode Department of Civil Engineering, Technical University of Denmark, Kgs. Lyngby ABSTRACT Nowadays,
A Correlation of. to the. South Carolina Data Analysis and Probability Standards
 A Correlation of to the South Carolina Data Analysis and Probability Standards INTRODUCTION This document demonstrates how Stats in Your World 2012 meets the indicators of the South Carolina Academic Standards
A GENERAL TAXONOMY FOR VISUALIZATION OF PREDICTIVE SOCIAL MEDIA ANALYTICS
 A GENERAL TAXONOMY FOR VISUALIZATION OF PREDICTIVE SOCIAL MEDIA ANALYTICS Stacey Franklin Jones, D.Sc. ProTech Global Solutions Annapolis, MD Abstract The use of Social Media as a resource to characterize
Gain insight, agility and advantage by analyzing change across time and space.
 White paper Location Intelligence Gain insight, agility and advantage by analyzing change across time and space. Spatio-temporal information analysis is a Big Data challenge. The visualization and decision
Promotional Forecast Demonstration
 Exhibit 2: Promotional Forecast Demonstration Consider the problem of forecasting for a proposed promotion that will start in December 1997 and continues beyond the forecast horizon. Assume that the promotion
ESSENTIAL COMPONENTS OF WATER-LEVEL MONITORING PROGRAMS. Selection of Observation Wells
 ESSENTIAL COMPONENTS OF WATER-LEVEL MONITORING PROGRAMS Before discussing the uses and importance of long-term water-level data, it is useful to review essential components of a water-level monitoring
Atmospheric Processes
 Atmospheric Processes Steven Sherwood Climate Change Research Centre, UNSW Yann Arthus-Bertrand / Altitude Where do atmospheric processes come into AR5 WGI? 1. The main feedbacks that control equilibrium
Visual Interfaces for Geographic Data
 Visual Interfaces for Geographic Data Robert Laurini, INSA-Lyon, http://liris.insa-lyon.fr/robert.laurini SYNONYMS Cartography, Visualizing spatial data, interactive capture, interactive layout DEFINITION
Example application (1) Telecommunication. Lecture 1: Data Mining Overview and Process. Example application (2) Health
 Telecommunication. Lecture 1: Data Mining Overview and Process. Example application (2) Health") Lecture 1: Data Mining Overview and Process What is data mining? Example applications Definitions Multi disciplinary Techniques Major challenges The data mining process History of data mining Data mining
Lecture 1: Data Mining Overview and Process What is data mining? Example applications Definitions Multi disciplinary Techniques Major challenges The data mining process History of data mining Data mining
INVESTIGATIONS INTO EFFECTIVENESS OF GAUSSIAN AND NEAREST MEAN CLASSIFIERS FOR SPAM DETECTION
 INVESTIGATIONS INTO EFFECTIVENESS OF AND CLASSIFIERS FOR SPAM DETECTION Upasna Attri C.S.E. Department, DAV Institute of Engineering and Technology, Jalandhar (India) upasnaa.8@gmail.com Harpreet Kaur
Analyse, Collaborate and Publish Statistics for Measuring Progress in our Society using Storytelling
 Analyse, Collaborate and Publish Statistics for Measuring Progress in our Society using Storytelling Prof. Mikael Jern NCVA National Center for Visual Analytics, ITN, Linkoping University, 60174 Norrköping,
visualization tool for interpretation of empirical results from climate model: Does it add value to UbuntuNet Connect Kigali, Rwanda 2013
 Development of a climate data visualization tool for interpretation of empirical results from climate model: Does it add value to different stakeholders? UbuntuNet Connect Kigali, Rwanda 2013 Co-Authors
High-Mix Low-Volume Flow Shop Manufacturing System Scheduling
 Proceedings of the 14th IAC Symposium on Information Control Problems in Manufacturing, May 23-25, 2012 High-Mix Low-Volume low Shop Manufacturing System Scheduling Juraj Svancara, Zdenka Kralova Institute
Projecting climate change in Australia s marine environment Kathleen McInnes
 Projecting climate change in Australia s marine environment Kathleen McInnes CSIRO Oceans and Atmosphere Flagship Centre for Australian Climate and Weather Research Framing of the problem IMPACTS EMISSIONS
1.3 Measuring Center & Spread, The Five Number Summary & Boxplots. Describing Quantitative Data with Numbers
 1.3 Measuring Center & Spread, The Five Number Summary & Boxplots Describing Quantitative Data with Numbers 1.3 I can n Calculate and interpret measures of center (mean, median) in context. n Calculate
Climate mitigation policy and value judgment and ethical and equity concepts in the context of sustainable development CLIMATE CHANGE 2014
 dreamstime Climate mitigation policy and value judgment and ethical and equity concepts in the context of sustainable development CLIMATE CHANGE 2014 Mitigation of Climate Change Sivan Kartha Stockholm
Analysis of Climatic and Environmental Changes Using CLEARS Web-GIS Information-Computational System: Siberia Case Study
 Analysis of Climatic and Environmental Changes Using CLEARS Web-GIS Information-Computational System: Siberia Case Study A G Titov 1,2, E P Gordov 1,2, I G Okladnikov 1,2, T M Shulgina 1 1 Institute of
Demographics of Atlanta, Georgia:
 Demographics of Atlanta, Georgia: A Visual Analysis of the 2000 and 2010 Census Data 36-315 Final Project Rachel Cohen, Kathryn McKeough, Minnar Xie & David Zimmerman Ethnicities of Atlanta Figure 1: From
Major Characteristics and Functions of New Scheduling Software Beeliner Based on the Beeline Diagramming Method (BDM)
") Major Characteristics and Functions of New Scheduling Software Beeliner Based on the Beeline Diagramming Method (BDM) Seon-Gyoo Kim Abstract The construction environment has been changing rapidly over
Major Characteristics and Functions of New Scheduling Software Beeliner Based on the Beeline Diagramming Method (BDM) Seon-Gyoo Kim Abstract The construction environment has been changing rapidly over
Module 2: Introduction to Quantitative Data Analysis
 Module 2: Introduction to Quantitative Data Analysis Contents Antony Fielding 1 University of Birmingham & Centre for Multilevel Modelling Rebecca Pillinger Centre for Multilevel Modelling Introduction...
Interactive Exploration of Multi granularity Spatial and Temporal Datacubes: Providing Computer Assisted Geovisualization Support
 Interactive Exploration of Multi granularity Spatial and Temporal Datacubes: Providing Computer Assisted Geovisualization Support Véronique Beaulieu 1 & Yvan Bédard 2 Laval University Centre for Research
A static representation for ToonTalk programs
 A static representation for ToonTalk programs Mikael Kindborg mikki@ida.liu.se www.ida.liu.se/~mikki Department of Computer and Information Science Linköping University Sweden Abstract Animated and static
Charting Your Course: Charts and Graphs for IT Projects
 Charting Your Course: Charts and Graphs for IT Projects Dawn Li, Ph.D. and Gary McQuown Data and Analytic Solutions, Inc. Fairfax, VA ABSTRACT This paper describes the most common types of charts and graphs
MAP PROJECTIONS AND VISUALIZATION OF NAVIGATIONAL PATHS IN ELECTRONIC CHART SYSTEMS
 MAP PROJECTIONS AND VISUALIZATION OF NAVIGATIONAL PATHS IN ELECTRONIC CHART SYSTEMS Athanasios PALLIKARIS [1] and Lysandros TSOULOS [2] [1] Associate Professor. Hellenic Naval Academy, Sea Sciences and
Prentice Hall World Geography: Building a Global Perspective 2007
 Prentice Hall World Geography: Building a Global Perspective 2007 Grades 9-12 C O R R E L A T E D T O Louisiana Grade-Level Expectations for World Geography Grades 9-12 Geography The World in Spatial Terms
Example Gantt Chart. PERT charts...) (Later, but next, Source: http://www.nan.go.th/nanpoc/svg/chartdirector/doc/cdphpd oc/images/gantt.
 (Later, but next, Source: http://www.nan.go.th/nanpoc/svg/chartdirector/doc/cdphpd oc/images/gantt.") PERT and Gantt Example Gantt Chart (Later, but next, PERT charts...) Source: http://www.nan.go.th/nanpoc/svg/chartdirector/doc/cdphpd oc/images/gantt.png PERT Charts Acronym for: Program Evaluation and
PERT and Gantt Example Gantt Chart (Later, but next, PERT charts...) Source: http://www.nan.go.th/nanpoc/svg/chartdirector/doc/cdphpd oc/images/gantt.png PERT Charts Acronym for: Program Evaluation and
Exploratory data analysis (Chapter 2) Fall 2011
 Fall 2011") Exploratory data analysis (Chapter 2) Fall 2011 Data Examples Example 1: Survey Data 1 Data collected from a Stat 371 class in Fall 2005 2 They answered questions about their: gender, major, year in school,
Exploratory data analysis (Chapter 2) Fall 2011 Data Examples Example 1: Survey Data 1 Data collected from a Stat 371 class in Fall 2005 2 They answered questions about their: gender, major, year in school,
EP 2 492 881 A2 (19) (11) EP 2 492 881 A2 (12) EUROPEAN PATENT APPLICATION. (43) Date of publication: 29.08.2012 Bulletin 2012/35
 (11) EP 2 492 881 A2 (12) EUROPEAN PATENT APPLICATION. (43) Date of publication: 29.08.2012 Bulletin 2012/35") (19) (12) EUROPEAN PATENT APPLICATION (11) EP 2 492 881 A2 (43) Date of publication: 29.08.2012 Bulletin 2012/35 (51) Int Cl.: G08B 13/16 (2006.01) G08B 25/08 (2006.01) (21) Application number: 12386006.6
(19) (12) EUROPEAN PATENT APPLICATION (11) EP 2 492 881 A2 (43) Date of publication: 29.08.2012 Bulletin 2012/35 (51) Int Cl.: G08B 13/16 (2006.01) G08B 25/08 (2006.01) (21) Application number: 12386006.6
Using SPSS, Chapter 2: Descriptive Statistics
 1 Using SPSS, Chapter 2: Descriptive Statistics Chapters 2.1 & 2.2 Descriptive Statistics 2 Mean, Standard Deviation, Variance, Range, Minimum, Maximum 2 Mean, Median, Mode, Standard Deviation, Variance,
THE COLORADO RIVER BASIN WATER SUPPLY AND DEMAND STUDY: MODELING TO SUPPORT A ROBUST PLANNING FRAMEWORK
 THE COLORADO RIVER BASIN WATER SUPPLY AND DEMAND STUDY: MODELING TO SUPPORT A ROBUST PLANNING FRAMEWORK Alan Butler, Hydrologic Engineer, Bureau of Reclamation, Lower Colorado Region, rabutler@usbr.gov;
A DSL-based Approach to Software Development and Deployment on Cloud
 2010 24th IEEE International Conference on Advanced Information Networking and Applications A DSL-based Approach to Software Development and Deployment on Cloud Krzysztof Sledziewski 1, Behzad Bordbar
Exercise 1: How to Record and Present Your Data Graphically Using Excel Dr. Chris Paradise, edited by Steven J. Price
 Biology 1 Exercise 1: How to Record and Present Your Data Graphically Using Excel Dr. Chris Paradise, edited by Steven J. Price Introduction In this world of high technology and information overload scientists
ProjectTales: Reusing Change Decisions and Rationales in Project Management
 ProjectTales: Reusing Change Decisions and Rationales in Project Management Lu Xiao 1 and Taraneh Khazaei 1 1 Human-Information Interaction Lab, University of Western Ontario Abstract Changes are inevitable
Microsoft Business Intelligence Visualization Comparisons by Tool
 Microsoft Business Intelligence Visualization Comparisons by Tool Version 3: 10/29/2012 Purpose: Purpose of this document is to provide a quick reference of visualization options available in each tool.
Development of Enterprise Architecture of PPDR Organisations W. Müller, F. Reinert
 Int'l Conf. Software Eng. Research and Practice SERP'15 225 Development of Enterprise Architecture of PPDR Organisations W. Müller, F. Reinert Fraunhofer Institute of Optronics, System Technologies and
Media Watch on Climate Change. Geospatial Web Technology for Accessing Environmental Online Resources http://www.ecoresearch.
 Media Watch on Climate Change Geospatial Web Technology for Accessing Environmental Online Resources http://www.ecoresearch.net/climate IDIOM Project Scientific Partner: MODUL University Vienna Technical
Highly Scalable Dynamic Load Balancing in the Atmospheric Modeling System COSMO-SPECS+FD4
 Center for Information Services and High Performance Computing (ZIH) Highly Scalable Dynamic Load Balancing in the Atmospheric Modeling System COSMO-SPECS+FD4 PARA 2010, June 9, Reykjavík, Iceland Matthias
Traffic Prediction and Analysis using a Big Data and Visualisation Approach
 Traffic Prediction and Analysis using a Big Data and Visualisation Approach Declan McHugh 1 1 Department of Computer Science, Institute of Technology Blanchardstown March 10, 2015 Summary This abstract
Visualizing the Top 400 Universities
 Int'l Conf. e-learning, e-bus., EIS, and e-gov. EEE'15 81 Visualizing the Top 400 Universities Salwa Aljehane 1, Reem Alshahrani 1, and Maha Thafar 1 saljehan@kent.edu, ralshahr@kent.edu, mthafar@kent.edu
BPMN ANALYSIS OF PUBLIC PROCUREMENT Maria Semerdjieva, Evgeniy Krastev
 Serdica J. Computing 6 (2012), 195 206 BPMN ANALYSIS OF PUBLIC PROCUREMENT Maria Semerdjieva, Evgeniy Krastev Abstract. This paper formulates a realistic case study of a public procurement process, where
Data Mining: Exploring Data. Lecture Notes for Chapter 3. Introduction to Data Mining
 Data Mining: Exploring Data Lecture Notes for Chapter 3 Introduction to Data Mining by Tan, Steinbach, Kumar What is data exploration? A preliminary exploration of the data to better understand its characteristics.
V&V and QA throughout the M&S Life Cycle
 Introduction to Modeling and Simulation and throughout the M&S Life Cycle Osman Balci Professor Department of Computer Science Virginia Polytechnic Institute and State University (Virginia Tech) Blacksburg,
Zhenping Liu *, Yao Liang * Virginia Polytechnic Institute and State University. Xu Liang ** University of California, Berkeley
 P1.1 AN INTEGRATED DATA MANAGEMENT, RETRIEVAL AND VISUALIZATION SYSTEM FOR EARTH SCIENCE DATASETS Zhenping Liu *, Yao Liang * Virginia Polytechnic Institute and State University Xu Liang ** University
Principles of Data Visualization for Exploratory Data Analysis. Renee M. P. Teate. SYS 6023 Cognitive Systems Engineering April 28, 2015
 Principles of Data Visualization for Exploratory Data Analysis Renee M. P. Teate SYS 6023 Cognitive Systems Engineering April 28, 2015 Introduction Exploratory Data Analysis (EDA) is the phase of analysis
Sample Pages. Free E-mail Newsletter Sign up Today! Learn Through Experience
 Learn Through Experience Sample Pages Sample pages from this product are provided for evaluation purposes. The entire product is available for purchase at www.socialstudies.com or www.teachinteract.com
MIDLAND ISD ADVANCED PLACEMENT CURRICULUM STANDARDS AP ENVIRONMENTAL SCIENCE
 Science Practices Standard SP.1: Scientific Questions and Predictions Asking scientific questions that can be tested empirically and structuring these questions in the form of testable predictions SP.1.1
Climate Change Scenarios for the Prairies
 Climate Change Scenarios for the Prairies David Sauchyn and Suzan Lapp Prairie Adaptation Research Collaborative, University of Regina, 150-10 Research Drive, Regina, SK S4S 7J7; Email: sauchyn@uregina.ca
European Gravity Service for Improved Emergency Management
 European Gravity Service for Improved Emergency Management a new Horizon2020 project to serve the international community and improve the accessibility to gravity field products A. Jäggi 1, M. Weigelt
Cloud Computing Services and its Application
 Advance in Electronic and Electric Engineering. ISSN 2231-1297, Volume 4, Number 1 (2014), pp. 107-112 Research India Publications http://www.ripublication.com/aeee.htm Cloud Computing Services and its
This is the Pre-Published Version
 This is the Pre-Published Version Journal of Construction Engineering and Management, ASCE, Vol. 130, No. 4, 2004, pp. 598-606 Four-Dimensional Visualization of Construction Scheduling and Site Utilization