Using the Bloomberg terminal for data
|
|
|
- Ruby Spencer
- 8 years ago
- Views:
Transcription
1 Using the Bloomberg terminal for data Contents of Package 1.Getting information on your company Pages Getting information on comparable companies Pages Getting macro economic information Pages 40 1

2 Instructions for Getting Bloomberg Data Pick Equity Under Finding Securities, choose Ticker Symbol Look up (TK) Enter the name of your company. You will get all of the equity listings that the company has. Choose the one that you are interested in. For instance, if you look up Nestle, you will get Nestle s local listings in Switzerland (Registered and Bearer Stock) as well as all of Nestle s ADR listings around the world. You might have to work through the listings by trial and error until you get the listing that has all of the financial information that you want. (One quick test that seems to work is to try the DES page below. The right listing will have pages. All the other listings will have only 2-4 pages) Once you are in equity screen for your company, Type HDS: Print page 1 off Choose Description (DES): Print first 10 pages off; Ignore beta on first page. Chose Debt Distibution (DDIS): Print off just first page Choose Financial Analysis (FA): The full report option that was available until last year is more difficult to get to now. Instead, print off the following subreports Enterprise Value (Will give you market value of equity, total book debt and cash for the last 10 years) Income Statement Summary Assets Liabilities Cashflow If you want quarterly data, you can change your preferences in FA and print quarterly data. Choose Earnings Estimates (EE) Choose Zacks Print off first page If you do not have a beta, pick Beta Calculations (BETA) Using the tab button, you can change the period to M Using the tab button, you can change the range to a 5-year range Using the tab button, you can also change the market index. Go back to the main menu (out of equity). Pick Corp Bond. Enter the name of your company You will get a list of corporate bonds issued by your company, if any. Choose a long-term bond (preferable without special features like convertibility) from the list. Choose Description 2

3 Using Bloomberg to get information on your company To get all other information Equity Finding Securities Ticker Symbol Look Up (TK) Enter the name of your company Choose the listing for your company that you are interested in. If you have a company with multiple listings, this may take some work. Try the DES page (see below). If you get only 2 pages, you have the wrong listing. To get ratings information Corp 1. Finding Securities Ticker Symbol Look Up Enter the name of your company Choose the listing for your company that you are interested in Pick a long term bond for the company Issue/Issuer Information Description 2. Company Information /Description Fundamentals and Earnings Analysis Stockholder Information Risk and Volatilitiy 1. Description (DES) 2. Debt Detail (DDIS) 1. Financial Analysis (FA) 1. Enterprise Value 2. Income Statement 3. Assets 4. Liabilities 5. Cashflows 13. Earnings Estimates (EE) 3) Zacks Shadow: Indicates menu choices on Bloomberg Regular font: Indicates input that you have to provide or change HDS (Just Pg 1) Beta Calculation (BETA) Change defaults: Period to M Starting point: 5 yrs ago Leave ending point as is Historical Volatility (HVT) 3

4 WHERE TO FIND THE DATA This is a listing of all of the financial data that you will need to analyze your company and where exactly on the Bloomberg output you will find the data. Once you have identified what you would like to look up, use the item number and go to the specified page number on Bloomberg to look it up. Item Input In Bloomberg Page Number Used in this spreadsheet 1 Beta Equity: Beta Calculation 29 Capstr, Dividend, Valuation 2 Current EPS Equity: Description 8 Valuation 3 Payout Ratio Equity: Description 10 Valuation 4 Total Debt Equity: Description 16 Capstr, Dividend, Valuation 5 Book Value of Equity Equity: Description 16 CapStr, Valuation 6 Number of Shares Outstanding Equity: Description 8 CapStr, Valuation 7 Effective Tax Rate Equity: Description 10 CapStr, Valuation 8 Chg in Non-Cash Working Capital Equity: Description 17 Valuation 9 Capital Expenditures Equity: Description 17 CapStr, Valuation 10 Depreciation Equity: Description 17 CapStr, Valuation 11 EPS - 5 years ago Equity: FA (Income) 12 Valuation 12 Analyst Projection for Growth Equity: Earnings Estimates 27 Valuation 4

5 13 Interest Expenses Equity: Description 15 CapStr, Valuation 14 Net Sales/ Revenues Equity: Description 15 Valuation 15 Market Capitalization Equity: Description 8 Risk, CapStr, Valuation 16 EBIT (/Operating Income) Equity: Description 15 CapStr 17 Bond Rating Corp Bond: Description 31 CapStr 18 Past 10 years Net Income Equity: FA (Income) 25 Dividends 19 Past 10 years Depreciation Equity: FA (Cashflow) 25 Dividends 20 Past 10 years Chg in non-cash Work. Cap. Equity: FA (Cashflow) 26 Dividends 21 Past 10 years Dividends Equity: FA (Cashflow) 26 Dividends 22 Past 10 years Equity Buybacks Equity FA (Cashflow) 25 Dividends 23 Past 10 years Cap Ex Equity: FA (Cashflow) 26 Dividends 24 Average Debt Ratio 10 years Equity FA (Leverage) 21 Dividends 25 Past 10 years BV of Equity Equity FA (Liabilities) 24 Dividends 26 Total Return on Stock Equity: FA (Price Ratio) 18 Dividends 27 Operating Income past 10 years Equity: FA (Income) 22 DebtDesign 28 Stock Price Volatility Equity: HVT 28 Risk, Option pricing 29 Value of Firm: Last 10 years Equity: FA (Enterprise Value) 21 Dividends 5
 26 Dividends 21 Past 10 years Dividends Equity: FA (Cashflow) 26 Dividends 22 Past 10 years Equity Buybacks Equity FA (Cashflow) 25 Dividends 23 Past 10 years Cap Ex Equity: FA")
6 30 EBITDA for last 10 years Equity: FA (Income) 21 Capital Structure 31 Alpha (Intercept) Beta Calculation 29 Risk 32 R squared Beta Calculation 29 Risk 33 Standard Error of Beta Beta Calculation 29 Risk 34a Stockholders of record Equity: HDS 8 Corporate Governance 34b Percent of institutional holding Equity: DES 11 Corporate Governance 35 Debt Distribution/ Maturity Equity: DDIS 30 Debt value, WACC 36 Business Breakdown Equity: DES 13 Risk 37 Geographic Breakdown Equity: DES 14 Risk, Financing Choices 38 Non-cash Working Capital Equity: DES 16 Valuation, Dividend policy 39 Net Debt Issued Equity: DES 16 Valuation, Dividend policy As a general rule, stay away from the computational data provided by Bloomberg, where they try to estimate numbers based upon raw data. For instance, the WACC and Dividend discount model valuations that they provide are not very useful. 6

7 Item 34a: Largest stockholders in company Mutual fund holdings are shown as 13F in the US. Change in holding since last filing date.

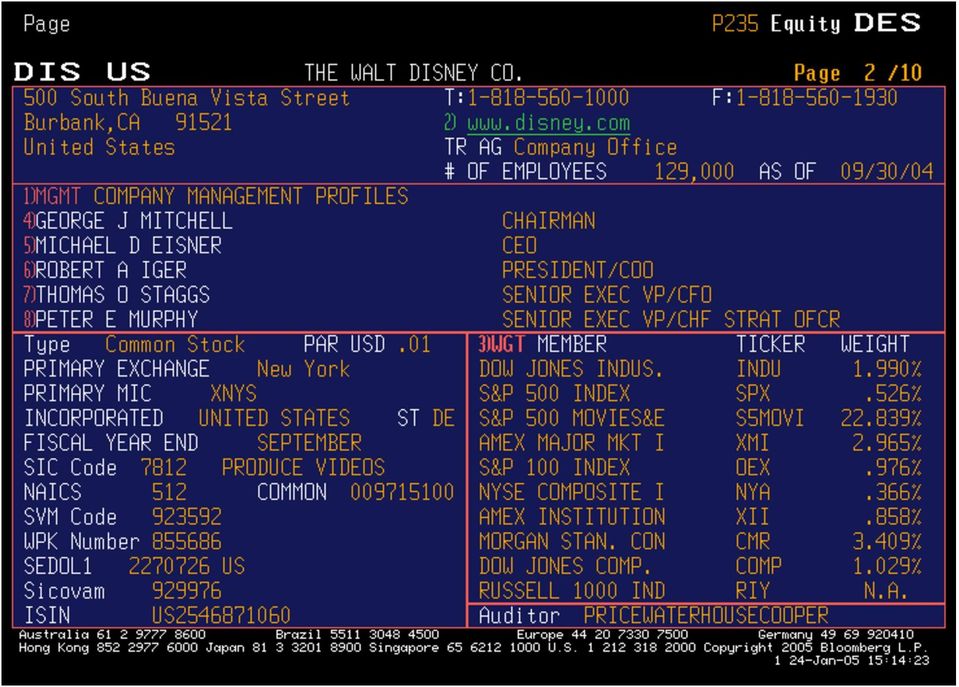
8 Item 6: No of shares outstanding Item 15: Market cap in millions. If your stock has multiple classes (voting and nonvoting), this will be the market cap of all outstanding shares. This is the Bloomberg default beta. It is a two-year weekly return adjusted beta. Item 2: EPS estimates

9
10 Dividend yield Item 3: Payout Ratio Item 7: Effective tax rate for most recent year. Note: Do not trust the return on equity and capital numbers that you see on this page. They are often incorrectly estimated. The same can be said for the multiples and interest coverage ratios. Do your own computations.

11 Item 34b: Percent of stock held by institutions and number of institutional investors.

12 Item 11: EPS from 5 years ago can be obtained by adding up four quarters of EPS. Quarterly revenue and EPS numbers for past few years.

13 Item 37: Breakdown of revenues by business and growth in each. For more detail, look at the annual report and the 10K for the company.

14 Item 38: Breakdown of revenues by geographic area. Again, there should be more detail in the annual report or 10K.

15 Item 14: Revenues: Last 4 years Item 16: Operating Income/EBIT Item 13: Interest Expenses Taxes on taxable income

16 Item 4: Total Debt = ST Borrowing + LT Borrowings Item 5: Book Value of Equity Item 38: Non-cash Working capital = Acct & Notes rec + Inventories + Other Current Assets Accounts Payable Other ST Liab

17 Item 10: Deprecn & Amortization Item 8: Change in non-cash WC Item 11: Capital expenditures Dividend s Stock buybacks = Dec Capital Stock Item 39: Net debt issued = Inc(dec) ST borrow + Increase LT borrow Decrease LT borrow Note: 1. The change in non-cash working capital computed by Bloomberg is an approximation since it includes short term interest bearing debt in ST liabilities. 2. Capital expenditures do not include acquisitions. If the acquisitions are funded with cash it may be shown as LT investments. If funded with stock, it will not show up here. 3. If disposal of fixed assets is a consistent number, you can net out against cap ex to reflect replacement of existing assets.

18 Note that I have used the old FA format. The new data is in roughly the same place but you have to print the section off separately. (There are separate print outs for price ratio analysis and stock performance, for example. Item 26 Total Return = % Change + Div Yld 18

19 19

20 20

21 Item 30: EBITDA for last 10 years Item 24: Average market debt to equity ratio for last 10 years Item 29: Value of firm = Market cap + Total debt + Preferred Equity. If you want enterprise value, subtract out cash. 21
22 Item 27: Operating income each year for last 10 years 22
23 23
24 24
25 Item 25: Book value of equity each year for last 10 years Total Debt = ST Borr + LT Borr Items 18-20: Last 10 years of net income, depresciation and changes in non-cash working capital. 25
26 Items 21-23: Last 10 years of dividends paid, stock buybacks (dec in capital stock), stock issues (inc in capital stock) and capital expenditures 26
27 These are from Zacks. You can also try I/B/E/S from the EE menu. The number est is the number of analysts making estimates and the average is a %. (14.12% annually for next 5 years) Item 12: Expected growth in EPS: Next 5 years 27
28 The default in Bloomberg is daily data. It is better to use weekly data and the 100 week estimate of standard deviation. Item 28: Std deviation in stock price 28
29 Note: Bloomberg s default beta calculation always uses two years of weekly returns and the local market index. You can (and probably should) change both. I would change weekly to monthly, two years to five years.and narrow indices to broader ones. Item 1: Regression beta Item 31: Regression Intercept Item 32 : R squared of regression Item 33: Std Error of Beta 29
30 Item 35: Maturity distributi on for debt. 30
31 Item 17: Bond Ratings from S&P, Moody s and Fitch for corporate bonds issued by firm. 31
32 DATA ON COMPARABLE COMPANIES I. Getting data on related companies Pick Equity Choose 1. Finding Securities Choose Ticker Symbol Look up (TK) Enter the name of your company Once you are in equity screen for your company, enter Relative Value (RV): You can modify the data that is printed out. In particular, you can change the display to include only those items that you want for all of your comparable firms by going into the Edit function and changing the display. Peer Value (PV): Your company s numbers will be printed out next to the average for the sector and the entire market. Bloomberg will pick the comparable companies and you will have little flexibility. If you prefer to pick your own comparables, try the alternate approach (QSRC, two pages forward). 32
33 33
34 II. Using Bloomberg to get Sector Data or to Screen Stocks Start with this screen by typing ESRC. You will begin with this screen. If you want to screen based on market cap, PE or growth, you can do it here. (For example, I have screened for stocks with market cap> 30 million) 34
35 Restrict your search to just common stocks to avoid multiple listings for the same company: 35
36 Pick the country or countries you want to screen for 36
37 And make sure that you pick the exchanges to go with those countries. Looking for French stocks on the Indonesian exchange will give you no listings.. 37
38 Pick the industry group you want to analyze or collect data from Go into the Edit function and choose the items you want displayed in your output. 38
39 Warning: This is not the friendliest interface in the world. You will often find yourself building elaborate criteria for 20 minutes and then losing them all because you hit the menu button twice instead of once. I would suggest saving the criteria under Save Set as you go along and assigning the criteria set a name. I would also suggest adding the company name to your data set - the default is only the ticker symbols, which are tough to expand, and keeping your data sets manageable. 39
40 40
41 41
Using Bloomberg to get the Data you need
 Using Bloomberg to get the Data you need 1 Contents of Package 1. Getting information on your company Pages 3-30 2. Getting information on comparable companies Pages 31-34 3. Getting macro economic information
II. Estimating Cash Flows
 II. Estimating Cash Flows DCF Valuation Aswath Damodaran 61 Steps in Cash Flow Estimation Estimate the current earnings of the firm If looking at cash flows to equity, look at earnings after interest expenses
Today s Agenda. DFR1 and Quiz 3 recap. Net Capital Expenditures. Working Capital. Dividends. Estimating Cash Flows
 Today s Agenda DFR1 and Quiz 3 recap Net Capital Expenditures Working Capital Dividends Estimating Cash Flows Net Capital expenditures Net capital expenditures = capital expenditures - depreciation Depreciation
Templates available in Excel 97 (Excel 8) and higher versions:
 and higher versions:") Excel Templates Templates available in Excel 97 (Excel 8) and higher versions: All of the Excel templates in Research Insight can be customized to fit your own particular needs. Company Fundamental Analysis
Excel Templates Templates available in Excel 97 (Excel 8) and higher versions: All of the Excel templates in Research Insight can be customized to fit your own particular needs. Company Fundamental Analysis
Equity Analysis and Capital Structure. A New Venture s Perspective
 Equity Analysis and Capital Structure A New Venture s Perspective 1 Venture s Capital Structure ASSETS Short- term Assets Cash A/R Inventories Long- term Assets Plant and Equipment Intellectual Property
Homework Solutions - Lecture 2
 Homework Solutions - Lecture 2 1. The value of the S&P 500 index is 1286.12 and the treasury rate is 3.43%. In a typical year, stock repurchases increase the average payout ratio on S&P 500 stocks to over
Corporate Finance: Final Exam
 Corporate Finance: Final Exam Answer all questions and show necessary work. Please be brief. This is an open books, open notes exam. For partial credit, when discounting, please show the discount rate
Financial Statement Analysis!
 Financial Statement Analysis! The raw data for investing Aswath Damodaran! 1! Questions we would like answered! Assets Liabilities What are the assets in place? How valuable are these assets? How risky
CFAspace. CFA Level II. Provided by APF. Academy of Professional Finance 专 业 金 融 学 院
 CFAspace Provided by APF CFA Level II Equity Investments Free Cash Flow Valuation Part I CFA Lecturer: Hillary Wang Content Free cash flow to the firm, free cash flow to equity Ownership perspective implicit
FSA Note: Summary of Financial Ratio Calculations
 FSA Note: Summary of Financial Ratio Calculations This note contains a summary of the more common financial statement ratios. A few points should be noted: Calculations vary in practice; consistency and
Net Capital Expenditures
 Net Capital Expenditures Net capital expenditures represent the difference between capital expenditures and depreciation. Depreciation is a cash inflow that pays for some or a lot (or sometimes all of)
Finance Master. Winter 2015/16. Jprof. Narly Dwarkasing University of Bonn, IFS
 Finance Master Winter 2015/16 Jprof. Narly Dwarkasing University of Bonn, IFS Chapter 2 Outline 2.1 Firms Disclosure of Financial Information 2.2 The Balance Sheet 2.3 The Income Statement 2.4 The Statement
Often stock is split to lower the price per share so it is more accessible to investors. The stock split is not taxable.
 Reading: Chapter 8 Chapter 8. Stock: Introduction 1. Rights of stockholders 2. Cash dividends 3. Stock dividends 4. The stock split 5. Stock repurchases and liquidations 6. Preferred stock 7. Analysis
Company Financial Plan
 Financial Modeling Templates http://spreadsheetml.com/finance/companyfinancialplan.shtml Copyright (c) 2009-2014, ConnectCode All Rights Reserved. ConnectCode accepts no responsibility for any adverse
Estimating Cash Flows
 Estimating Cash Flows DCF Valuation 1 Steps in Cash Flow Estimation Estimate the current earnings of the firm If looking at cash flows to equity, look at earnings after interest expenses - i.e. net income
NIKE Case Study Solutions
 NIKE Case Study Solutions Professor Corwin This case study includes several problems related to the valuation of Nike. We will work through these problems throughout the course to demonstrate some of the
Discounted Cash Flow Valuation: Basics
 Discounted Cash Flow Valuation: Basics Aswath Damodaran Aswath Damodaran 1 Discounted Cashflow Valuation: Basis for Approach Value = t=n CF t t =1(1+r) t where CF t is the cash flow in period t, r is the
Problem 1 Problem 2 Problem 3
 Problem 1 (1) Book Value Debt/Equity Ratio = 2500/2500 = 100% Market Value of Equity = 50 million * $ 80 = $4,000 Market Value of Debt =.80 * 2500 = $2,000 Debt/Equity Ratio in market value terms = 2000/4000
TIP If you do not understand something,
 Valuing common stocks Application of the DCF approach TIP If you do not understand something, ask me! The plan of the lecture Review what we have accomplished in the last lecture Some terms about stocks
TYPES OF FINANCIAL RATIOS
 TYPES OF FINANCIAL RATIOS In the previous articles we discussed how to invest in the stock market and unit trusts. When investing in the stock market an investor should have a clear understanding about
CHAPTER 11 Questions and Problems
 1 CHAPTER 11 Questions and Problems (In the problems below, you can use a risk premium of 5.5% and a tax rate of 40% if either is not specified) 1. Stock buybacks really do not return cash to stockholders,
Chapter 7. . 1. component of the convertible can be estimated as 1100-796.15 = 303.85.
 Chapter 7 7-1 Income bonds do share some characteristics with preferred stock. The primary difference is that interest paid on income bonds is tax deductible while preferred dividends are not. Income bondholders
Fair Value: Fact or Opinion
 Fair Value: Fact or Opinion Aswath Damodaran Aswath Damodaran 1 Fair value is in the eyes of the beholder Don t measure fair value by precision: As uncertainty about an asset s cash flows increase, the
ACC 255 FINAL EXAM REVIEW PACKET (NEW MATERIAL)
") Page 1 ACC 255 FINAL EXAM REVIEW PACKET (NEW MATERIAL) Complete these sample exam problems/objective questions and check your answers with the solutions at the end of the review file and identify where
Page 1 ACC 255 FINAL EXAM REVIEW PACKET (NEW MATERIAL) Complete these sample exam problems/objective questions and check your answers with the solutions at the end of the review file and identify where
How To Calculate Financial Leverage Ratio
 What Do Short-Term Liquidity Ratios Measure? What Is Working Capital? HOCK international - 2004 1 HOCK international - 2004 2 How Is the Current Ratio Calculated? How Is the Quick Ratio Calculated? HOCK
EQUITY RESEARCH. S&P Sector Information Technology Industry Software/Computer Services. (Million) (Billion) Bloomberg Yield Forward
 (Billion) Bloomberg Yield Forward") M.A. W M.A. WRIGHT FUND EQUITY RESEARCH Robert J. Schafer Siebel Systems Inc. NYSE: SEBL Buy schafrob@rice.edu March 05, 2002 MARKET DATA Price 3-05- 02 Close $32.94 52-Wk Range Low Mid- Sept. 12.24 to
M.A. W M.A. WRIGHT FUND EQUITY RESEARCH Robert J. Schafer Siebel Systems Inc. NYSE: SEBL Buy schafrob@rice.edu March 05, 2002 MARKET DATA Price 3-05- 02 Close $32.94 52-Wk Range Low Mid- Sept. 12.24 to
Cost of Capital and Project Valuation
 Cost of Capital and Project Valuation 1 Background Firm organization There are four types: sole proprietorships partnerships limited liability companies corporations Each organizational form has different
Private Company Valuation
 Private Company Valuation Aswath Damodaran Aswath Damodaran 179 Process of Valuing Private Companies Choosing the right model Valuing the Firm versus Valuing Equity Steady State, Two-Stage or Three-Stage
Advanced Corporate Finance. 2. Financial Planning, from Accounting to Free Cash Flows
 Advanced Corporate Finance 2. Financial Planning, from Accounting to Free Cash Flows Objectives of the session 1. Show how to use accounting information to compute cash flows 2. Understand and compute
LECTURE- 4. Valuing stocks Berk, De Marzo Chapter 9
 1 LECTURE- 4 Valuing stocks Berk, De Marzo Chapter 9 2 The Dividend Discount Model A One-Year Investor Potential Cash Flows Dividend Sale of Stock Timeline for One-Year Investor Since the cash flows are
HHIF Lecture Series: Discounted Cash Flow Model
 HHIF Lecture Series: Discounted Cash Flow Model Alexander Remorov University of Toronto November 19, 2010 Alexander Remorov (University of Toronto) HHIF Lecture Series: Discounted Cash Flow Model 1 / 18
Forecasting and Valuation of Enterprise Cash Flows 1. Dan Gode and James Ohlson
 Forecasting and Valuation of Enterprise Cash Flows 1 1. Overview FORECASTING AND VALUATION OF ENTERPRISE CASH FLOWS Dan Gode and James Ohlson A decision to invest in a stock proceeds in two major steps
Understanding A Firm s Financial Statements
 CHAPTER OUTLINE Spotlight: J&S Construction Company (http://www.jsconstruction.com) 1 The Lemonade Kids Financial statement (accounting statements) reports of a firm s financial performance and resources,
Key Concepts and Skills. Standardized Financial. Chapter Outline. Ratio Analysis. Categories of Financial Ratios 1-1. Chapter 3
 Key Concepts and Skills Chapter 3 Working With Financial Statements Know how to standardize financial statements for comparison purposes Know how to compute and interpret important financial ratios Know
INTERVIEWS - FINANCIAL MODELING
 420 W. 118th Street, Room 420 New York, NY 10027 P: 212-854-4613 F: 212-854-6190 www.sipa.columbia.edu/ocs INTERVIEWS - FINANCIAL MODELING Basic valuation concepts are among the most popular technical
Corporate Finance: Final Exam
 Corporate Finance: Final Exam Answer all questions and show necessary work. Please be brief. This is an open books, open notes exam. 1. DayTop Inns is a publicly traded company, with 10 million shares
Trade Date The date of the previous trading day. Recent Price is the closing price taken from this day.
 Definition of Terms Price & Volume Share Related Institutional Holding Ratios Definitions for items in the Price & Volume section Recent Price The closing price on the previous trading day. Trade Date
MBA Financial Management and Markets Exam 1 Spring 2009
 MBA Financial Management and Markets Exam 1 Spring 2009 The following questions are designed to test your knowledge of the fundamental concepts of financial management structure [chapter 1], financial
This document may not be used, reproduced or sold without the authorisation of the Groupe HEC
 Please send any questions on this case study to the author via the mail box on the web site www.vernimmen.com Pascal Quiry October 2010 This document may not be used, reproduced or sold without the authorisation
Freeze Partnerships: Establishing the Preferred Rate
 Freeze Partnerships: Establishing the Preferred Rate Aaron M. Stumpf, CPA/ABV astumpf@srr.com Brian A. Hock bhock@srr.com Overview n n n Partnership freezes involving related party transfers are generally
EMERSON AND SUBSIDIARIES CONSOLIDATED OPERATING RESULTS (AMOUNTS IN MILLIONS EXCEPT PER SHARE, UNAUDITED)
") CONSOLIDATED OPERATING RESULTS (AMOUNTS IN MILLIONS EXCEPT PER SHARE, UNAUDITED) TABLE 1 Quarter Ended March 31, Percent Change Net Sales $ 5,854 $ 5,919 1% Costs and expenses: Cost of sales 3,548 3,583
CONSOLIDATED OPERATING RESULTS (AMOUNTS IN MILLIONS EXCEPT PER SHARE, UNAUDITED) TABLE 1 Quarter Ended March 31, Percent Change Net Sales $ 5,854 $ 5,919 1% Costs and expenses: Cost of sales 3,548 3,583
If you ignore taxes in this problem and there is no debt outstanding: EPS = EBIT/shares outstanding = $14,000/2,500 = $5.60
 Problems Relating to Capital Structure and Leverage 1. EBIT and Leverage Money Inc., has no debt outstanding and a total market value of $150,000. Earnings before interest and taxes [EBIT] are projected
Chapter 11. Stocks and Bonds. How does this distribution work? An example. What form do the distributions to common shareholders take?
 Chapter 11. Stocks and Bonds Chapter Objectives To identify basic shareholder rights and the means by which corporations make distributions to shareholders To recognize the investment opportunities in
Cash Flow Analysis Venture Business Perspective
 Cash Flow Analysis Venture Business Perspective Cash Flow (CF) Analysis What is CF and how is determined? CF Free CF Managing CF Cash Conversion Cyclical CF Break-even Valuing venture businesses based
Main Menu Bar: Access to reports & report display options, such as printing, exporting
 THOMSON ONE BANKER ANALYTICS NAVIGATION GUIDE Entity Selection: specify entity for your analysis Modes: Use tabs to access application modes designed for specific tasks Library Tabs: Access different sections
Comprehensive exam Feb.11
 Comprehensive exam Feb.11 1 Objectives of the examination Apply the financial management concept to evaluate the company s performance. Relate the results of the analysis to make financial decisions or
Financial ratio analysis
 Financial ratio analysis A reading prepared by Pamela Peterson Drake O U T L I N E 1. Introduction 2. Liquidity ratios 3. Profitability ratios and activity ratios 4. Financial leverage ratios 5. Shareholder
ENTREPRENEURIAL FINANCE: Strategy Valuation and Deal Structure
 ENTREPRENEURIAL FINANCE: Strategy Valuation and Deal Structure Chapter 9 Valuation Questions and Problems 1. You are considering purchasing shares of DeltaCad Inc. for $40/share. Your analysis of the company
Fundamental Analysis Ratios
 Fundamental Analysis Ratios Fundamental analysis ratios are used to both measure the performance of a company relative to other companies in the same market sector and to value a company. There are three
CHAPTER 8. Problems and Questions
 CHAPTER 8 Problems and Questions 1. Plastico, a manufacturer of consumer plastic products, is evaluating its capital structure. The balance sheet of the company is as follows (in millions): Assets Liabilities
Chapter 3 Financial Statements, Cash Flow, and Taxes
 Chapter 3 Financial Statements, Cash Flow, and Taxes ANSWERS TO END-OF-CHAPTER QUESTIONS 3-1 a. The annual report is a report issued annually by a corporation to its stockholders. It contains basic financial
CHAPTER 14 FREE CASH FLOW TO EQUITY DISCOUNT MODELS
 1 CHAPTER 14 FREE CASH FLOW TO EQUITY DISCOUNT MODELS The dividend discount model is based upon the premise that the only cashflows received by stockholders is dividends. Even if we use the modified version
VALUING FINANCIAL SERVICE FIRMS
 1 VALUING FINANCIAL SERVICE FIRMS Banks, insurance companies and other financial service firms pose a particular challenge for an analyst attempting to value them for two reasons. The first is the nature
Morningstar Investment Research Center User s Guide
 Morningstar Investment Research Center User s Guide Welcome to the Guide to Morningstar Investment Research Center. Morningstar Investment Research Center is among today s most comprehensive financial
CH 23 STATEMENT OF CASH FLOWS SELF-STUDY QUESTIONS
 C H 2 3, P a g e 1 CH 23 STATEMENT OF CASH FLOWS SELF-STUDY QUESTIONS (note from Dr. N: I have deleted questions for you to omit, but did not renumber the remaining questions) 1. The primary purpose of
Chapters 3 and 13 Financial Statement and Cash Flow Analysis
 Chapters 3 and 13 Financial Statement and Cash Flow Analysis Balance Sheet Assets Cash Inventory Accounts Receivable Property Plant Equipment Total Assets Liabilities and Shareholder s Equity Accounts
Examiner s report F9 Financial Management June 2013
 Examiner s report F9 Financial Management June 2013 General Comments The examination consisted of four compulsory questions, each worth 25 marks. Most candidates attempted all four questions and there
Chapter 17: Financial Statement Analysis
 FIN 301 Class Notes Chapter 17: Financial Statement Analysis INTRODUCTION Financial ratio: is a relationship between different accounting items that tells something about the firm s activities. Purpose
Virtual Stock Market Game Glossary
 Virtual Stock Market Game Glossary American Stock Exchange-AMEX An open auction market similar to the NYSE where buyers and sellers compete in a centralized marketplace. The AMEX typically lists small
Chapter 14. Web Extension: Financing Feedbacks and Alternative Forecasting Techniques
 Chapter 14 Web Extension: Financing Feedbacks and Alternative Forecasting Techniques I n Chapter 14 we forecasted financial statements under the assumption that the firm s interest expense can be estimated
FINC 3630: Advanced Business Finance Additional Practice Problems
 FINC 3630: Advanced Business Finance Additional Practice Problems Accounting For Financial Management 1. Calculate free cash flow for Home Depot for the fiscal year-ended February 1, 2015 (the 2014 fiscal
Atrium Mortgage Investment Corporation (TSX: AI) Record Year / Shares at Attractive Entry Levels. Sector/Industry: Mortgage Investment Corporation
 Record Year / Shares at Attractive Entry Levels. Sector/Industry: Mortgage Investment Corporation") Siddharth Rajeev, B.Tech, MBA, CFA Analyst February 17, 2016 Atrium Mortgage Investment Corporation (TSX: AI) Record Year / Shares at Attractive Entry Levels Sector/Industry: Mortgage Investment Corporation
Siddharth Rajeev, B.Tech, MBA, CFA Analyst February 17, 2016 Atrium Mortgage Investment Corporation (TSX: AI) Record Year / Shares at Attractive Entry Levels Sector/Industry: Mortgage Investment Corporation
Evaluation of Google and Apple
 Xing Chen & Yuanyuan Pan FIN 5190---Special Topics: Financial Modeling Prof. Michael D. Boldin Final Project Evaluation of Google and Apple Overview of project and modeling objectives The objective of
FNCE 3010 (Durham). HW2 (Financial ratios)
. HW2 (Financial ratios)") FNCE 3010 (Durham). HW2 (Financial ratios) 1. What effect would the following actions have on a firms net working capital and current ratio (assume NWC is positive and current ratio is initially greater
FNCE 3010 (Durham). HW2 (Financial ratios) 1. What effect would the following actions have on a firms net working capital and current ratio (assume NWC is positive and current ratio is initially greater
Value of Equity and Per Share Value when there are options and warrants outstanding. Aswath Damodaran
 Value of Equity and Per Share Value when there are options and warrants outstanding Aswath Damodaran 1 Equity Value and Per Share Value: A Test Assume that you have done an equity valuation of Microsoft.
Basics of Discounted Cash Flow Valuation. Aswath Damodaran
 Basics of Discounted Cash Flow Valuation Aswath Damodaran 1 Discounted Cashflow Valuation: Basis for Approach t = n CF Value = t t =1(1+ r) t where, n = Life of the asset CF t = Cashflow in period t r
CHAPTER 2 FINANCIAL STATEMENTS AND CASH FLOW
 CHAPTER 2 FINANCIAL STATEMENTS AND CASH FLOW Solutions to Questions and Problems NOTE: All end-of-chapter problems were solved using a spreadsheet. Many problems require multiple steps. Due to space and
VALUATIONS I Financial Metrics, Ratios, & Comparables Analysis. Fall 2015 Comp Week 6
 VALUATIONS I Financial Metrics, Ratios, & Comparables Analysis Fall 2015 Comp Week 6 CODE: COMPS Timeline Date Topic 9/10/15 Introduction to Finance 9/17/15 Qualitative Analysis: SWOT and Porter s Five
NWC = current assets - current liabilities = 2,100
 Questions and Problems Chapters 2,3 pp45-47 1. Building a balance sheet. Penguin Pucks, Inc., has current assets of $3,000, net fixed assets $6,000, current liabilities of $900, and long-term debt of $5,000.
Financial Modeling & Corporate Valuations
 Financial Modeling & Corporate Valuations Presented by Affan Sajjad ACA Cell # 03219400788 Presenter Profile Passed CA exams in December 2004 Became Associate Member of ICAP in November 2005 Completed
User Guide for OPIC Financial Projections Model Builder Tool
 User Guide for OPIC Financial Projections Model Builder Tool 4/2/2013 Prepared by: Deborah Howard Document Control Document Information Information Document Owner Deborah Howard Issue Date 4/2/2013 Document
MBA Finance Part-Time Financial Statement Analysis and Cash Flows
 MBA Finance Part-Time Financial Statement Analysis and Cash Flows Professor Hugues Pirotte Spéder 1 1 Levers of Performance Return on Equity Return on Invested Capital Leverage Profit Margin Asset Turnover
Web Extension: Financing Feedbacks and Alternative Forecasting Techniques
 19878_09W_p001-009.qxd 3/10/06 9:56 AM Page 1 C H A P T E R 9 Web Extension: Financing Feedbacks and Alternative Forecasting Techniques IMAGE: GETTY IMAGES, INC., PHOTODISC COLLECTION In Chapter 9 we forecasted
Financial Statement and Cash Flow Analysis
 Chapter 2 Financial Statement and Cash Flow Analysis Answers to Concept Review Questions 1. What role do the FASB and SEC play with regard to GAAP? The FASB is a nongovernmental, professional standards
LOS 42.a: Define and interpret free cash flow to the firm (FCFF) and free cash flow to equity (FCFE).
 and free cash flow to equity (FCFE).") The following is a review of the Equity Investments principles designed to address the learning outcome statements set forth by CFA Institute. This topic is also covered in: Free Cash Flow Valuation This
The following is a review of the Equity Investments principles designed to address the learning outcome statements set forth by CFA Institute. This topic is also covered in: Free Cash Flow Valuation This
SAMPLE FACT EXAM (You must score 70% to successfully clear FACT)
") SAMPLE FACT EXAM (You must score 70% to successfully clear FACT) 1. What is the present value (PV) of $100,000 received five years from now, assuming the interest rate is 8% per year? a. $600,000.00 b.
SAMPLE FACT EXAM (You must score 70% to successfully clear FACT) 1. What is the present value (PV) of $100,000 received five years from now, assuming the interest rate is 8% per year? a. $600,000.00 b.
Crown Castle International Corp. Consolidating Income Statement Unaudited Consolidated Statement of Operations (in millions of dollars)
") Consolidating Income Statement Unaudited Consolidated Statement of Operations CCIC Consolidated Revenues Site Rental 406.9 409.6 437.1 447.2 1,700.8 456.2 457.1 468.9 Network Services and Other 37.5 46.5
Consolidating Income Statement Unaudited Consolidated Statement of Operations CCIC Consolidated Revenues Site Rental 406.9 409.6 437.1 447.2 1,700.8 456.2 457.1 468.9 Network Services and Other 37.5 46.5
Chapter. How Well Am I Doing? Financial Statement Analysis
 Chapter 17 How Well Am I Doing? Financial Statement Analysis 17-2 LEARNING OBJECTIVES After studying this chapter, you should be able to: 1. Explain the need for and limitations of financial statement
Return on Equity has three ratio components. The three ratios that make up Return on Equity are:
 Evaluating Financial Performance Chapter 1 Return on Equity Why Use Ratios? It has been said that you must measure what you expect to manage and accomplish. Without measurement, you have no reference to
Chapter 2 Financial Statement and Cash Flow Analysis
 Chapter 2 Financial Statement and Cash Flow Analysis MULTIPLE CHOICE 1. Which of the following items can be found on an income statement? a. Accounts receivable b. Long-term debt c. Sales d. Inventory
UNDERSTANDING FINANCE AND MEMBER EQUITY MY EXPERIENCE AGENDA
 UNDERSTANDING FINANCE AND MEMBER EQUITY A Special Presentation for the Strengthening Cooperation Workshop February 21, 2006 by Brian Henehan Senior Extension Associate Cornell Cooperative Enterprise Program
STUDENT CAN HAVE ONE LETTER SIZE FORMULA SHEET PREPARED BY STUDENT HIM/HERSELF. FINANCIAL CALCULATOR/TI-83 OR THEIR EQUIVALENCES ARE ALLOWED.
 Test III-FINN3120-090 Fall 2009 (2.5 PTS PER QUESTION. MAX 100 PTS) Type A Name ID PRINT YOUR NAME AND ID ON THE TEST, ANSWER SHEET AND FORMULA SHEET. TURN IN THE TEST, OPSCAN ANSWER SHEET AND FORMULA
Income Statement (1) First Quarter 2002
 First Quarter 2002") Income Statement (1) (in millions of EUR) 1 st Q 2002 1 st Q 2001 2002/2001 Sales 5,402.2 4,993.6 +8.2% (2) EBITDA (FIFO) 408.7 366.1 +11.6% EBITDA margin 7.6% 7.3% - Depreciation (145.5) (134.6) +8.1%
Income Statement (1) (in millions of EUR) 1 st Q 2002 1 st Q 2001 2002/2001 Sales 5,402.2 4,993.6 +8.2% (2) EBITDA (FIFO) 408.7 366.1 +11.6% EBITDA margin 7.6% 7.3% - Depreciation (145.5) (134.6) +8.1%
TOPIC LEARNING OBJECTIVE
 Topic Mapping 1 Transaction Analysis Understand the effect of various types of transactions on the accounting equation, accounting journal and accounting ledger. Concepts and Skills Accounting Equation
CHAPTER 2 ACCOUNTING STATEMENTS, TAXES, AND CASH FLOW
 CHAPTER 2 ACCOUNTING STATEMENTS, TAXES, AND CASH FLOW Answers to Concepts Review and Critical Thinking Questions 1. True. Every asset can be converted to cash at some price. However, when we are referring
] (3.3) ] (1 + r)t (3.4)
![] (3.3) ] (1 + r)t (3.4)](/thumbs/39/18539117.jpg "] (3.3) ] (1 + r)t (3.4)") Present value = future value after t periods (3.1) (1 + r) t PV of perpetuity = C = cash payment (3.2) r interest rate Present value of t-year annuity = C [ 1 1 ] (3.3) r r(1 + r) t Future value of annuity
Present value = future value after t periods (3.1) (1 + r) t PV of perpetuity = C = cash payment (3.2) r interest rate Present value of t-year annuity = C [ 1 1 ] (3.3) r r(1 + r) t Future value of annuity
Portfolio Management FMI Skema Paris campus Contrôle continu 2 2 April 2014 O. Williams
 Portfolio Management FMI Skema Paris campus Contrôle continu 2 2 April 2014 O. Williams 1. The comparisons with which ratios should be made include the following, except: a. The firm's own past performance
Understanding Financial Information for Bankruptcy Lawyers Understanding Financial Statements
 Understanding Financial Information for Bankruptcy Lawyers Understanding Financial Statements In the United States, businesses generally present financial information in the form of financial statements
Chapter 8 Financial Statement Analysis
 Chapter 8 Financial Statement Analysis rue/false Questions F 1. Balance sheet items are carried at original cost or market value at the discretion of the individual firm. F 2. A primary use of the sources
Estimating Beta. Aswath Damodaran
 Estimating Beta The standard procedure for estimating betas is to regress stock returns (R j ) against market returns (R m ) - R j = a + b R m where a is the intercept and b is the slope of the regression.
Finding the Right Financing Mix: The Capital Structure Decision
 Finding the Right Financing Mix: The Capital Structure Decision Aswath Damodaran Stern School of Business Aswath Damodaran 1 First Principles Invest in projects that yield a return greater than the minimum
Financial Formulas. 5/2000 Chapter 3 Financial Formulas i
 Financial Formulas 3 Financial Formulas i In this chapter 1 Formulas Used in Financial Calculations 1 Statements of Changes in Financial Position (Total $) 1 Cash Flow ($ millions) 1 Statements of Changes
Chapter 13, ROIC and WACC
 Chapter 13, ROIC and WACC Lakehead University Winter 2005 Role of the CFO The Chief Financial Officer (CFO) is involved in the following decisions: Management Decisions Financing Decisions Investment Decisions
FINANCIAL STATEMENTS and RATIOS. STOCKVAL and SV CONNECT
 FINANCIAL STATEMENTS and RATIOS STOCKVAL and SV CONNECT Open StockVal program and use Data menu to choose the appropriate reports. Examples are provided below. You can save these reports from File/Export/
Stock Valuation: Gordon Growth Model. Week 2
 Stock Valuation: Gordon Growth Model Week 2 Approaches to Valuation 1. Discounted Cash Flow Valuation The value of an asset is the sum of the discounted cash flows. 2. Contingent Claim Valuation A contingent
Course pack Accounting 202 Chapter 13: Cash Flow Statement
 Course pack Accounting 202 Chapter 13: Cash Flow Statement Value Chapter Included 13 Purpose of Cash Flow Understand Operating, Investing, Financing activities Prepare a Cash Flow Statement indirect only
Vertical and Horizontal Analysis. Financial Analysis. Lecturer: Dr. Constantinos Adamides
 Vertical and Horizontal Analysis Financial Analysis Lecturer: Dr. Constantinos Adamides Horizontal Analysis Comparison of financial information of a single company for two more years Examination of absolute
Review for Exam 3. Instructions: Please read carefully
 Review for Exam 3 Instructions: Please read carefully The exam will have 25 multiple choice questions and 5 work problems. You are not responsible for any topics that are not covered in the lecture note
COMPONENTS OF THE STATEMENT OF CASH FLOWS
 ILLUSTRATION 24-1 OPERATING, INVESTING, AND FINANCING ACTIVITIES COMPONENTS OF THE STATEMENT OF CASH FLOWS CASH FLOWS FROM OPERATING ACTIVITIES + Sales and Service Revenue Received Cost of Sales Paid Selling
Review for Exam 1. Instructions: Please read carefully
 Review for Exam 1 Instructions: Please read carefully The exam will have 20 multiple choice questions and 4 work problems. Questions in the multiple choice section will be either concept or calculation