Oregon historical cumulative savings from various energy efficiency measures
|
|
|
- Richard Sharp
- 8 years ago
- Views:
Transcription
1 LIST OF APPENDICES APPENDIX 1: APPENDIX 2: APPENDIX 3: APPENDIX 4: APPENDIX 5: APPENDIX 6: APPENDIX 7: APPENDIX 8: APPENDIX 9: Renewable energy and energy efficiency resource portfolio Calculation of 12 percent of energy efficiency emission reductions credited to Oregon under Track Back to EGU compliance approach in the preamble Map of Oregon electric utility service territories Oregon electric supplier background information Oregon historical cumulative savings from various energy efficiency measures Background on unique hydroelectric power sector in Oregon and the Northwest Background on NEEA and market transformation Background on Oregon and the Northwest leadership in appliance standards Appliance standards rule making activity APPENDIX 10: Background on building codes and building code adoption and compliance APPENDIX 11: Northwest accounting of building code and appliance standards savings APPENDIX 12: Background information regarding demand response measures APPENDIX 13: Background on evaluation, measurement, and verification (EM&V) 1


2 APPENDIX 1 Renewable energy and energy efficiency resource portfolio In Oregon, and the Northwest more broadly, renewable energy and energy efficiency provide two of the most significant methods for reducing greenhouse gas emissions from the power sector. This graph shows the Northwest s Sixth Power Plan supply curve through Energy efficiency is acquired first and in greater quantity than any other resource. 2

3 APPENDIX 2 Calculation of 12 percent of energy efficiency emission reductions credited to Oregon under Track Back to Electric Generating Unit (EGU) compliance approach in the preamble This appendix shows a calculation demonstrating Oregon s understanding of EPA s base proposal for crediting energy efficiency in state compliance plans. As described on page 13 of the comment letter, Oregon understands EPA s base proposal to mean that Oregon may be able to take credit for only 12 percent of its energy efficiency investment in its state plan. This is due to the requirement in the base proposal to track back energy savings from an energy efficiency measure to a specific EGU that is reducing output as a result of that measure. EPA has identified eight fossil-fueled EGUs in Oregon that are subject to the Proposal. Of those eight EGUs, five are investor-owned generators and, on average, only make up roughly 12 percent of the total generation used to serve Oregon load. The remaining three are owned by independent power producers (IPPs), and when those generators are included with the IOU units and compared against EPA s calculated total Oregon generation of 50,195,189 MWh, the EGU units subject to EPA s proposal represent on average percent - only a portion of which serves Oregon load. It is not possible to know for sure whether the output of the IPP generators is used to serve Oregon load. The remaining fossil generation used to serve Oregon load is imported from other states. If Oregon can only take credit for emission reductions occurring at in-state EGUs that result from energy efficiency measures in the state, then it follows that Oregon may only take credit for up to 22 percent of its energy efficiency investment in its state compliance plan. Because Oregon cannot be sure of whether the output from the state s IPP generators serve load, and if the EPA proposal requires that Oregon track back the abatement effects of its investment in energy efficiency to the affected in-state generators, then at worst Oregon could only to take credit for roughly 12 percent of its energy efficiency investment in a compliance plan. 3

4 APPENDIX 2 (continued) Credit for In-state EE Abatement if tracked back to EGU EE investment for 111(d) EGU abatement purposes can be more readily tracked back to units owned by the utility. The table below demonstrates that EE investments on the existing IOU, COU system would conservatively have an abatement value of 12%. If we can show that those in-state EGUs owned by Calpine and Klamath are 100% dedicated to in-state load we could take upwards of 22% credit for EE measures. However, given that EPA says that we must "track back" abatement measure to the affected EGUs, a conservative assumption, using our current understanding of the EPA rule, would allow us only a 12% credit for EE measures. If Carty were added as a 111(d) resource then these number would need to be readjusted. EPA Listed 111(d) NG Plants Ownership Type Generation MWh 2012 Percentage In-state of in-state Generation 4 Total in-state Generation Owned by IOU, COU Percentage of In-state generation, IOU, COU Total In-state Generation as calculated by EPA Total Sales 2012 Beaver PGE 25, % 25, % 50,195,189 47,200,000 Coyote Springs Avista 1,127, % 1,127, % 50,195,189 47,200,000 Coyote Springs II PGE 1,142, % 1,142, % 50,195,189 47,200,000 Hermiston Generating Plant PAC 2,285, % 2,285, % 50,195,189 47,200,000 Hermiston Power Partnership Calpine, (PAC) 2,888, % 50,195,189 47,200,000 Klamath Cogeneration Plant Iberdrola 2,224, % 50,195,189 47,200,000 Port Westward PGE 1,729, % 1,729, % 50,195,189 47,200,000 Total 11,424, % 6,310, % 50,195,189 47,200,000 EPA Listed 111(d) NG Plants Ownership Type Generation MWh EPA/EIA Data Percentage In-state of in-state Generation 2011 EPA/EIA Data Total in-state Generation Owned by IOU, COU Percentage of In-state generation, IOU, COU Total In-state Generation as calculated by EPA Total Sales 2011 Beaver PGE 46, % 46, % 59,695,164 47,171,446 Coyote Springs PGE, Avista 1.89% 1,399, % 59,695,164 47,171,446 1,399,034 Coyote Springs II PGE, Avista 1.91% % 59,695,164 47,171,446 Hermiston Generating Plant PAC 2,309, % 2,309, % 59,695,164 47,171,446 Hermiston Power Partnership Calpine 1,155, % 59,695,164 47,171,446 Klamath Cogeneration Plant Iberdrola 2,040, % 59,695,164 47,171,446 Port Westward PGE 1,392, % 1,392, % 59,695,164 47,171,446 Total 8,344, % 5,147,693 9% 59,695,164 47,171,446

5 APPENDIX 2 (continued) 1 EPA Listed 111(d) NG Plants Ownership Type Generation MWh 2010 Percentage In-state of in-state Generation 2010 EPA/EIA Data Total in-state Generation Owned by Percentage of In-state generation, IOU, COU Total In-state Generation as Total Sales 2010 Beaver PGE 156, % 156, % 55,126,999 46,025,945 Coyote Springs PGE, Avista 3,218, % 3,218, % 55,126,999 46,025,945 Coyote Springs II PGE, Avista 0.00% % 55,126,999 46,025,945 Hermiston Generating Plant PAC 3,193, % 3,193, % 55,126,999 46,025,945 Hermiston Power Partnership Calpine 3,241, % 55,126,999 46,025,945 Klamath Cogeneration Plant Iberdrola 2,969, % 55,126,999 46,025,945 Port Westward PGE 2,745, % 2,745, % 55,126,999 46,025,945 Total 15,525, % 9,313, % 55,126,999 46,025, ,2011,2010 Three Year Average EPA/EIA Data Three Year Average 11,764, % 6,923, % 55,005,784 46,799,130 1 Oregon state agency staff generated calculation spreadsheet. 5

6 6


7 APPENDIX 3 Map of Oregon electric utility service territories This map shows the Electric Utility Service Territories in Oregon and demonstrates the diversity of suppliers and the importance of the consumer-owned utilities in Oregon s electricity resource mix.

8 APPENDIX 4 Oregon electric supplier background information 1 1 OREGON PUBLIC UTILITY COMMISSION, 2013 OREGON UTILITY STATISTICS BOOK, available at

, available at http://www.bpa.gov/ee/newsevents/presentations/documents/fedstdsimpact_bpabrownbag_090414.pptx")
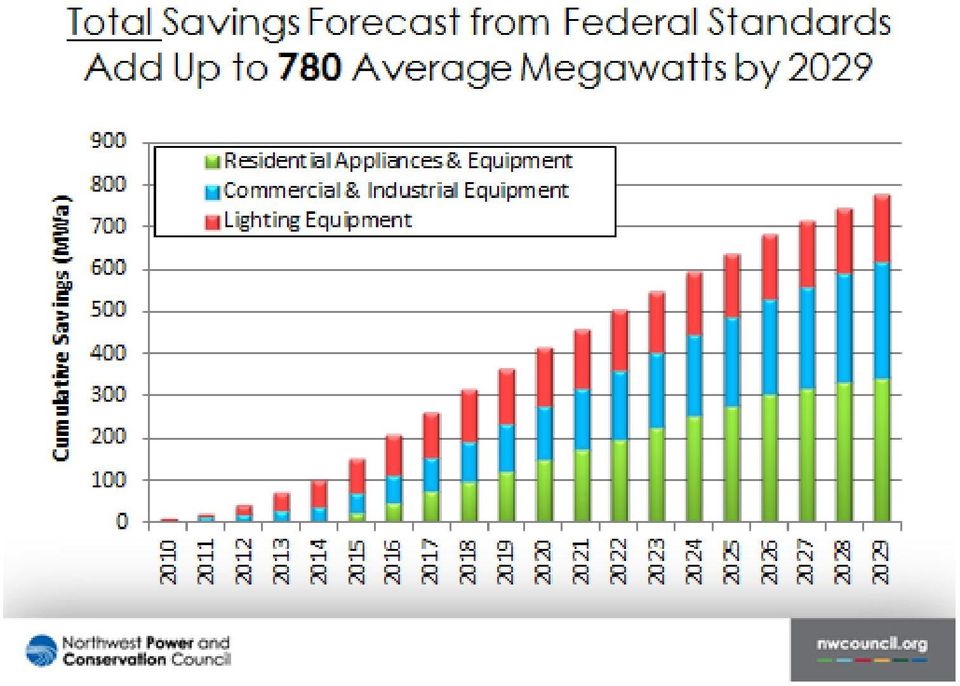
9 APPENDIX 5 Oregon historical cumulative savings from various energy efficiency measures 2 2 Tom Eckman, Northwest Power and Conservation Council, Appliance Standards and Conservation Presentation (2014), available at

10 APPENDIX 6 Background on unique hydroelectric power sector in Oregon and the Northwest About 60 percent of the region's hydroelectric generating capacity is operated on the 31 federally owned dams on the Columbia River, Snake River, and its tributaries that comprise the Federal Columbia River Power System (FCRPS). 3 The U.S. Army Corps of Engineers and the Bureau of Reclamation own and operate these dams while the Bonneville Power Administration (BPA) markets the power generated at these federal dams and from the Columbia Generating Station (the Northwest region s only nuclear reactor located in Washington) at cost to the region's consumer-owned utilities. In good water years, surplus power is sold in and outside the region. 4 The Northwest Power Planning and Conservation Council (NWPCC) is the Northwest entity charged with long term power planning. NWPCC has found that from year to year carbon dioxide production from the regional power system fluctuates. 5 This fluctuation is directly related to stream flow and power demand. In Oregon and the Northwest, carbon dioxide production from electricity generation is dominated by existing coal-fired generating plants... stabiliz[ing] carbon dioxide production levels would require substituting low carbon dioxide producing resources or additional conservation for some of these existing coal-fired power plants. 6 The NWPCC also found that under normal water conditions the Northwest would have produced about 520 pounds of carbon dioxide for each megawatt of electricity generated, compared to 900 pounds for the entire Western interconnected power system. The Northwest power system represents roughly 15 percent of the total WECC carbon dioxide production. 7 Consistent with the Northwest Power Act of 1980, the states in the Northwest were the first in the country to treat energy efficiency as a generating resource. When the NWPCC sets an energy efficiency acquisition target, BPA has a corresponding obligation under the Act to implement efficiency measures and acquire resources consistent with the NWPCC s power plan, including energy efficiency targets. 8 BPA complies with this obligation by assessing an energy efficiency adder in rates to fund and administer energy efficiency measures on the hydroelectric system. For the rest of the region, the targets are important for planning and other reasons, but without the same legal obligation. As a result of collective long term strategy, the Northwest region s average generating resource continues to be carbon free, and the portion of the Northwest and Oregon served by this shared 3 BONNEVILLE POWER ADMINISTRATION, FEDERAL COLUMBIA RIVER POWER SYSTEM (2003), available at 4 BONNEVILLE POWER ADMINISTRATION, HOW THE FEDERAL COLUMBIA RIVER POWER SYSTEM WORKS FOR YOU (2010), available at 5 NORTHWEST POWER AND CONSERVATION COUNCIL, CARBON DIOXIDE FOOTPRINT OF THE NORTHWEST POWER SYSTEM (2007), available at 6 Id. at 3. See, also, id. at 8 ( Though the aggressive acquisition of conservation and renewable resources called for in the Fifth Power Plan will hold the rate of growth in Northwest carbon dioxide production to half the growth rate experienced from 1990 through 2004, serious efforts to reduce or even stabilize carbon dioxide production beyond 2005 will likely require replacing existing coal-fired power plants with low carbon dioxide -emitting resources. ). 7 Id. at 8. 8 Northwest Power Act of 1980, 16 U.S. Code 839d(a)(1).
")
11 resource has delayed the need to invest in costly fossil fuel resources. 9 When these utilities invest in energy efficiency, the effect is long lasting and multifaceted. The life span of the shared hydro system and its capabilities for other uses is extended when Oregon ratepayers invest in energy efficiency. Each megawatt of energy efficiency allows the megawatts produced by the hydro system to balance wind generation or sell power on the margin where fossil fuel generated power might otherwise have been purchased. Investment in energy efficiency on the FCRPS frees up megawatts to be used in other areas of the country that would have otherwise purchased carbon intensive power. The energy efficiency investments made in Oregon affects the dispatch of the resources in Montana, Utah, and Wyoming that serve the Oregon load. However, because Oregon is part of larger power pools, the Western Interconnect and the Northwest Power Pool, its energy efficiency investments have broad affects. These affects cannot be directly tracked from the enduser implementing the measure, through the distribution system, into the transmission system, and back to the generator. They can, in aggregate, demonstrate impacts on energy systems locally, regionally, and more broadly. Oregon is a major investor in energy efficiency, both from utilities and the utilities ratepayers. These investments affect the Northwest and western interconnect resource dispatch and system planning. 9 See NORTHWEST POWER AND CONSERVATION COUNCIL, SIXTH PLAN MID-TERM ASSESSMENT 16 (2013), available at

12 APPENDIX 7 Background on NEEA and market transformation Oregon and the other Northwest states are heavily invested in energy efficiency measures resulting from market transformation and act in coordination through the Northwest Energy Efficiency Alliance (NEEA) to acquire those energy savings. Since its inception, NEEA has acquired over 1,000 average megawatts 10 of verified energy savings. 11 NEEA acquires verified energy savings in the marketplace through robust EM&V protocols. Created in 1997, NEEA has been acquiring savings on behalf of its 130 plus funders. 12 Although NEEA coordinates its activities with its utility funders, NEEA market transformation savings are acquired through non-traditional market based programs as opposed to traditional, end-user, utility-driven energy efficiency programs. NEEA is the only market transformation entity in the country with fully established EM&V protocols, program development protocols, and methodologies for the unique practice of market transformation. It has been able to successfully demonstrate market impact and influence through programmatic efforts to change market practices and behaviors with resulting energy efficiency savings to the region s four state public utilities commissions, the Northwest s Regional Technical Forum, 13 and the U.S. Department of Energy (U.S. DOE), among others. While market transformation may not be considered a traditional energy efficiency program methodology or practiced consistently across the nation, the Northwest has been a leader by investing and relying on market transformation energy efficiency programs for nearly 20 years. For example, in 2010, NEEA began working with television manufacturers, distributors, and retailers to build, stock, and sell televisions that were capable of performing at an efficiency level beyond EPA s EnergyStar rating. The result had national impacts, changing the purchasing practices for national brands such as Walmart, Sears, and Best Buy. Similarly, and again with national effect, NEEA has been working with manufacturers on the continued advancement and development of highly efficient heat pump water heaters. The result was not only a change in the stocking practices at big box stores but a revision to the national energy efficiency standard for commercial and, soon to follow, residential hot water heaters An average megawatt is 8,760 MWh. 11 NORTHWEST ENERGY EFFICIENCY ALLIANCE, BUSINESS PLAN (2014), available at 12 Id. 13 In 1996, Congress directed the BPA and the NWPCC to convene a regional technical forum to develop standardized protocols for verifying and evaluating energy efficiency savings and to ensure that the region continues to meet NWPCC s targets for securing cost-effective energy efficiency. In April 1999, NWPCC voted to charter the Regional Technical Forum (RTF) as an advisory committee to NWPCC. See, generally, Regional Technical Forum, 14 NORTHWEST ENERGY EFFICIENCY ALLIANCE, NORTHWEST HEAT PUMP WATER HEATER MARKET TEST ASSESSMENT (2013) available at

13 Another example involves individual retail appliances. NEEA is able to track the sale of individual retail appliances in the Northwest with build specifications that were directly influenced by NEEA s programmatic efforts. Often, NEEA is able to track the sale of each appliance to a zip code or utility service territory. Thus, NEEA is able to attribute savings to a utility service territory or state for a consumer s purchase of a new television or water heater matching NEEA's efficiency specifications. NEEA's verification methodology for total regional savings for any measures undertaken by the organization are highly scrutinized and must pass through the measure adoption process laid out by the RTF.

14 APPENDIX 7 (Continued) Example: NEEA TVs Initiative Info-Graphic Northwest Energy Efficiency Alliance,

15 APPENDIX 8 Background on Oregon and the Northwest leadership in appliance standards The Northwest has been collectively investing in programmatic and research initiatives since the 1980s that advance appliance standards in Oregon, Washington, Idaho, and Montana with national affect. BPA, NEEA, and NWPCC have been working regionally and nationally to advance the stringency and adoption rate of appliance standards. A recent study undertaken on behalf of BPA shows that in the planning period, the Northwest will save 900 average MW because of 30 new federal appliance standards adopted by the US DOE. 16 Of these 30 new appliance standards, the Northwest has been active in 22 rulemakings. 17 NEEA, BPA, and staff from the NWPCC attend U.S. DOE rulemakings on a multitude of appliance standards. Yet, in many cases Oregon, the Northwest states, and California have gone further in appliance standards adoptions then the federal agencies. Most recently, in 2013, the Oregon legislature adopted Senate Bill 692, which instituted appliance energy efficiency standards above that of the federal level for battery chargers, televisions, and high light output double-ended quartz halogen lamps. 18 Oregon, the Northwest, and California have adopted appliance standards well in advance of federal rulemaking or adoption. As a result when the U.S. DOE and EPA attempt to quantify savings from newly adopted appliance standards, they must re-adjust their saving baseline assumptions for California and the Northwest to account for this early action. 19 This will play out again as the Northwest has already adopted efficiency standards for bottle type water dispensers, commercial hot food holding cabinets, compact audio, DVD players, and recorders, while U.S. DOE has only just begun the rulemaking process. The Northwest has invested millions of dollars over the years resulting in data used by U.S. DOE in their appliance standards rulemakings. For example, the Northwest can demonstrate that its efforts to influence the development, manufacture, and retail success of the horizontal axis energy efficiency clothes washer both predate and significantly influenced the adoption of a federal standard and EPA EnergyStar labeling. Data was acquired through research and testing funded by Northwest entities to verify the effectiveness of these new units, energy, water and detergent saving, and finally consumer acceptance of these units. This data was given to U.S. DOE during its clothes washer rulemaking. For these programmatic efforts, for every unit sold prior to the adoption of the federal appliance standard, the Northwest and Oregon should be allowed under 111(d) to count these appliance standards efforts as energy efficiency savings, where verifiable through accepted EM&V practices and reporting. 16 See Tom Eckman, NORTHWEST POWER AND CONSERVATION COUNCIL, OVERVIEW OF FEDERAL APPLIANCE STANDARDS AND THEIR IMPACT ON REGIONAL LOADS PRESENTATION (2014), available at 17 See Appendix 9 for a list of active appliance standards rulemaking where Oregon and Northwest states have been involved. 18 S.B. 692, 77th Leg. Assem., Reg. Sess. (Or. 2013), available at 19 See Institute for Electric Efficiency, Integrating Codes and Standards into Electric Utility Energy Efficiency Portfolios (2001) available at

16 APPENDIX 9 Appliance standards rule making activity 20 Oregon, as represented through NWPCC staff and staff from the NEEA, has been active in a majority of the US DOE s appliance standards rulemakings. The group of stakeholders, which includes Oregon, works with U.S. DOE to conduct studies to supply data. Covered Product Standard Effective Year Northwest Role General Service Fluorescent Lamps 2012 Significant. This was a controversial rulemaking and required significant collaboration and data. Incandescent Reflector Lamps 2012 Significant. Same as GSFLs above. Commercial Clothes Washers 2013 Limited. Provided comments. Dishwashers 2013 Representative from the Northwest Power Planning and Conservation Council negotiated an agreement on the rulemaking and standards with manufacturers. Refrigerators and Freezers 2014 Representative from the Northwest Power Planning and Conservation Council negotiated an agreement on the rulemaking and standards with manufacturers. Room Air Conditioners 2014 Representative from the Northwest Power Planning and Conservation Council negotiated an agreement on the rulemaking and standards with manufacturers. Fluorescent Lamp Ballasts 2014 Significant. DOE's original proposal for test procedure and metrics was way off base. We worked with mfrs to get a better result. Water Heaters 2015 NEEA, Provided signficant input on test procedures and the construct of the final rule. NEEA provided data and study results. Small Electric Motors 2015 Participated. Provided comments. NEEA provided data and study results Central Air Conditioners and Heat Pumps 2015 Significant. DOE's original proposal for test procedure was way off, did not include standby use properly. We provided significant data and comment based on PNW field experience. Clothes Dryers 2015 Representative from the Northwest Power Planning and Conservation Council negotiated an agreement on the rulemaking and standards with manufacturers. Clothes Washers 2015 Representative from the Northwest Power Planning and Conservation Council negotiated an agreement on the rulemaking and standards with manufacturers. Microwave Ovens 2016 Limited. Rulemaking concerned standby energy use only. Provided comments. Distribution Transformers: Liquid-Immersed 2016 Significant. Part of negotiated rule. NEEA provided some of the only data in the negotiation. Distribution Transformers: Low-Voltage Dry-Type 2016 Significant. NEEA provided some of the only data in the negotiation. Distribution Transformers: Medium-Voltage Dry-Type 2016 Significant. NEEA provided some of the only data in the negotiation. External Power Supplies 2016 Electric Motors 2016 Commercial Refrigeration Equipment 2017 Walk-In Coolers & Freezers 2017 Metal Halide Lamp Fixtures 2017 Furnace Fans 2019 Participated. Ecova was the technical lead. NEEA provided strong comments and support for the advocates' technical and market comments. Significant. Strong advocacy while being able to work with manufacturers and their engineers. Significant. Negotiated with other efficiency advocates with NEMA and the manufacturers. Very significant savings here from coverging large numbers of products not yet covered by standards. Significant. Assisted with reformation of DOE's original proposal for test procedures and efficiency metrics. Worked with manufactures to develop a much more rational proposal that will be much easier to enforce. Significant. NEEA provided some of the only real technical expertise on the advocates' side. Significant. Assisted with reformation of DOE's original proposal for test procedures and metrics. Worked with manufacturers to develop a more workable proposal, based on existing test procedures, and provided field data and lots of technical comments. 20 Oregon state agency staff generated summary table.

17 APPENDIX 10 Background on building codes and building code adoption and compliance By crediting states for verifiable advanced enforcement adoption of the most recent International Energy Conservation Code (IECC), EPA would induce states to update and enforce their building code, resulting in the most cost effective energy savings of all energy efficiency measures. 21 Energy efficiency building codes are not adopted by each state at the same rate. The IECC is a building code created by the International Code Council. The IECC adoption is not federally mandated. The most recent code was created in 2012; however, not every state has adopted this most recent building code. In fact only 35 states have adopted an energy conservation building code. Still other states such as Washington, Oregon, and California have adopted energy conservation building codes that exceed the stringency of the IECC. Therefore, Oregon recommends that EPA give energy efficiency credit to those states for their enforcement of the most recent IECC standard, and that EPA allow those states that have adopted more a stringent building code to count the incremental savings as part of their energy efficiency savings in a state compliance plan. This will have the additional benefit of encouraging states to adopt the new building code and possibly encourage some states to reach further. As EPA is aware, building codes are one of the most cost effective energy efficiency measures a state can undertake. The Northwest plans and builds energy efficiency measures with the end goal of building code adoption. These energy efficiency measures are programmatic, created to influence building code reform and as such have been subject to strict EM&V standards. Northwest ENERGY STAR Homes is a voluntary program created to build the market s capacity to apply more energy efficient construction techniques. Through this program Oregon and the other Northwest states can demonstrate market readiness for an upgraded code, while addressing home builders cost concerns. Once the code is adopted, NEEA provides ongoing training and support to help ensure compliance. When the EPA launched the national ENERGY STAR Homes program, residential building codes in Oregon and Washington already exceeded the standards for national certification. While successful in other parts of the country, the national program for ENERGY STAR homes was not a good fit for the Northwest. NEEA, with support from its utility partners, led negotiations with the EPA in 2003 to establish the Northwest ENERGY STAR Homes specification, which requires ENERGY STAR homes built in the region to exceed state building codes for energy efficiency by at least 15 percent. In 2009, at the request of Governor Kulongoski, the Oregon state senate passed a bill to reduce building energy consumption by 15 percent. The Oregon Department of Energy prepared a residential code change proposal that was based directly on the successful Northwest ENERGY STAR Home specification. Oregon and the Northwest fund NEEA to conduct building code training to support compliance with commercial and residential codes. A key step in evaluating the potential savings from enhancing compliance with energy codes is the assessment of baseline compliance rates. 22 In 21 See NORTHWEST ENERGY EFFICIENCY ALLIANCE, OREGON RESIDENTIAL ENERGY CODE COMPLIANCE (2014), available at 22 SARAH STELLBERG, INSTITUTE FOR MARKET TRANSFORMATION ASSESSMENT OF ENERGY EFFICIENCY ACHIEVABLE FROM IMPROVED COMPLIANCE WITH U.S. BUILDING ENERGY CODES: , (February 2013)

18 2013, NEEA completed a residential code compliance study in Idaho with findings of 90 percent compliance (one of the highest compliance rates in the country) and conducted this same type of study in Montana and Washington. 23 NEEA also conducted an Oregon Residential Energy Code Compliance study, which describes the compliance of residential new construction in the state of Oregon with the revised state residential code: Chapter 11 of the 2011 Oregon Residential Specialty Code (ORSC). Compliance rates in Oregon were found to be 96 percent. 24 The results of these code studies help Oregon, the Northwest, and NEEA create more accurate savings forecasts for new construction and to target training and education efforts more effectively. Oregon and the Northwest invest in code adoption and compliance as an energy efficiency saving opportunity because the Northwest has found that such investments do increase compliance and thus result in greater savings. For example, when New York conducted a code compliance study in 2010 they found compliance rates 67 percent overall and the percentage of EPA ENERGY STAR homes in New York was only 23 percent. Current published studies show Illinois has an 87 percent compliance rate for residential new construction. When U.S. DOE conducted a code compliance study in 2013, it found that individual state code compliance was between 20 and 100 percent. Therefore, Oregon argues that investment in code compliance does produce incremental savings that would not have materialized through simple code adoption. available at 2.pdf 23 NORTHWEST ENERGY EFFICIENCY ALLIANCE, IDAHO RESIDENTIAL ENERGY CODE COMPLIANCE (2013), available at 24 See NORTHWEST ENERGY EFFICIENCY ALLIANCE, supra note 22.
. Compliance rates in Oregon were found to be 96 percent.")

19 APPENDIX 11 Northwest accounting of building code and appliance standards savings In the Northwest, states count Federal Appliance Standard savings in conservation supply curves. This helps the Northwest better understand what resources are needed to meet load. The purchases of efficient appliances are tracked through programmatic measures to induce market adoption. Additionally, savings from building codes are counted when planning to meet load in Oregon. Oregon, the Northwest, and California work to advance building code development, adoption, and compliance. Methodologies have been developed to quantify the savings from these measures in the Northwest. The graphs below reflect how NWPCC incorporates building code and appliance standard savings in the supply curve.

20
21 APPENDIX 12 Background information regarding demand response measures Oregon believes that demand response is a wholly separate demand side resource with unique capabilities. While demand response is traditionally dispatched during peak load hours to control market peak power costs, this resource may also be used to assist power system operators with power system reliability, stabilization, and to address power delivery from variable energy resources. The numerous potential uses for demand response affects its emissions reduction potential. Therefore, Oregon offers the following on how EPA should count the emission reductions resulting from the use of demand response. Oregon first suggests EPA leverage the work developed in other states to quantify the energy savings potential and system impacts of demand response. In particular, Oregon suggests outreach to the California Public Utility Commission, who in 2008 developed load impact and cost effectiveness methodologies for demand response. California s demand response cost effectiveness methodologies should help EPA develop a methodology that can be used by other states in determining how best to find cost effective demand side emissions reduction opportunities. This will be particularly helpful for states that do not have the benefit of a wholesale market operator. Oregon encourages EPA to work with the National Institute of Standards and Technology, (NIST), which has helped to categorize the many different types and operational characteristics of demand response. Additionally, each of the independent system operators have worked for a number of years quantifying the operational and market benefits of demand response. The Federal Energy Regulatory Commission has also worked for a number of years to support demand response inclusion in electric wholesale markets. EPA should work with these entities. Second, Oregon suggests that EPA require those states that submit plans, which include demand response as an emissions reduction measure, to submit system modeling information that quantifies the emissions reduction potential of demand response. Because demand response is dispatched based on temporal market conditions, and is, therefore, a contingent resource, the state would true-up emissions savings each year from demand response with EPA. Lastly, Oregon suggests that demand response be specifically addressed in the final Clean Power Plan and thus encouraged because of its ability to balance variable energy resources without dispatch of fast ramping fossil fuel resources. Although this type of demand response may offset resources not subject to regulation under the Proposal it does have significant system emissions reduction potential. Where the state can demonstrate that the use of demand response, as a balancing resource, did offset fossil fuel generation within the power pool serving the state, credit should be given at the appropriate marginal emission rate for the region or power pool emissions rate. Where demand response shifts but does not reduce load the difference in the marginal emissions rates should be used.
22 APPENDIX 13 Background on evaluation, measurement, and verification (EM&V) Oregon and the Northwest have a well-documented history of developing EM&V protocols and coordinating program development among the four states. This work provides an excellent example for EPA of the work that can be accomplished when EM&V and program administration is standardized and harmonized. 25 Oregon encourages EPA to open a discussion with the RTF, Oregon, Idaho, Montana, and Washington to learn more about how this system has been structured. It relies on common best practices and common program administration protocols, while allowing for enough flexibility for program administrators to meet unique service territory challenges. 26 In 1996, Congress directed BPA and NWPCC to convene a regional technical forum to develop standardized protocols for verifying and evaluating energy efficiency savings and to ensure that the region continues to meet NWPCC s targets for securing cost-effective energy efficiency. In April 1999, NWPCC voted to charter the RTF as an advisory committee to NWPCC. For states and regions, such as the Northwest, California, or the RGGI states, where energy efficiency practices are more mature, EPA should be careful not to create barriers to advanced measure development or barriers to piloting novel measure development through overly prescriptive EM&V and reporting requirements. Those states that have demonstrated EM&V maturity should initially be granted energy savings and emission reductions credit for current and proposed measures that are part of a state compliance plan. The state would demonstrate robustness of proposed and operating EM&V in its state compliance plan. Changes to energy efficiency measure type, implementation, or development done after the EPA has approved a state plan should be accounted for and allowed by EPA, again with a state demonstration of acceptable EM&V rigor and efficacy. However, for states that have not demonstrated energy efficiency EM&V maturity, EPA should create a forum offering technical assistance to those states in the development of their state compliance plans, when such plans call for investment and implementation of energy efficiency measures. 25 To review EM&V protocol development requirements, see THE REGIONAL TECHNICAL FORUM, ROADMAP FOR THE ASSESSMENT OF ENERGY EFFICIENCY MEASURES (June 2014), available at 26 For a list of the deemed savings, standards protocols, and supporting files in the Northwest see, generally, The Regional Technical Forum, RTF Unit Energy Savings (UES) Measures:
May 27, 2010 MEMORANDUM. Power Committee. Tom Eckman and Charlie Grist. Update on Federal Standards Activities
 Bruce A. Measure Chair Montana Rhonda Whiting Montana W. Bill Booth Idaho James A. Yost Idaho Dick Wallace Vice-Chair Washington Tom Karier Washington Melinda S. Eden Oregon Joan M. Dukes Oregon May 27,
Clean State Energy Actions 2011 Update. connecticut
 Energy Efficiency Appliance/Equipment Efficiency Standards Building Energy Codes Utility Demand-Side-Management Utility Rate Realignment Energy Savings Targets/Energy Efficiency Resource Standards Public
Massachusetts Saving Electricity:
 Commonwealth of Massachusetts Massachusetts Saving Electricity: A Summary of the Performance of Electric Efficiency Programs Funded by Ratepayers Between 2003 and 2005 Executive Office of Energy and Environmental
Report on 2012 Energy Efficiency Utility Program Revenues and Expenditures Pursuant to 30 V.S.A. 209
 Report on 2012 Energy Efficiency Utility Program Revenues and Expenditures Pursuant to 30 V.S.A. 209 by the Vermont Public Service Board April 14, 2014 In accordance with 30 V.S.A. 209, the Public Service
Business Plan 2015-2019 July 8,2014
 Business Plan 2015-2019 July 8,2014 Northwest Energy Efficiency Alliance neeaorg info@neeaorg 1 CONTENTS Executive Summary 3 Overview 3 Background 3 Learning From Experience, Adapting for the 3 Future
Sixth Northwest Conservation and Electric Power Plan Sixth Power Plan Action Plan
 Sixth Northwest Conservation and Electric Power Plan Action Plan Introduction... 1 Conservation... 1 Deployment... 2 Adaptive Management... 5 Development and Confirmation... 8 Generating Resources... 9
Report to the Legislative Assembly
 Electric and Natural Gas Company Rate Impacts to Meet 2020 Greenhouse Gas Emission Reduction Goals Report to the Legislative Assembly Presented to: Senate Environment and Natural Resources Committee Prepared
Testimony of Jason Eisdorfer. In front of the Committee on Science, Space, and Technology Subcommittee on Environment Friday, September 11, 2015
 Testimony of Jason Eisdorfer In front of the Committee on Science, Space, and Technology Subcommittee on Environment Friday, September 11, 2015 Good morning, I am Jason Eisdorfer, Utility Program Director
The Power of Efficiency: Pacific Northwest Energy Conservation Potential Through 2020
 The Power of Efficiency: Pacific Northwest Energy Conservation Potential Through 2020 April 2009 The NW Energy Coalition is an alliance of more than 100 environmental, civic, and human service organizations,
2012 Integrated Resource Plan. Appendix. DSM Implementation Plan
 Appendix 9A DSM Implementation Plan Table of Contents 1 Context and DSM Strategy... 1 1.1 Legal and Policy Context... 1 1.1.1 Definition of DSM... 1 1.1.2 British Columbia s Energy Objectives... 2 1.1.3
Eugene Water Electric Board. Oregon Renewable Portfolio Standard 2015 Compliance Report. June 1, 2016
 Eugene Water Electric Board Oregon Renewable Portfolio Standard 2015 Compliance Report June 1, 2016 EWEB 2015 RPS Compliance Report Page 1 Introduction In 2007 Oregon enacted Senate Bill 838, the Oregon
62-133.8. Renewable Energy and Energy Efficiency Portfolio Standard (REPS).
.") 62-133.8. Renewable Energy and Energy Efficiency Portfolio Standard (REPS). (a) Definitions. As used in this section: (1) "Combined heat and power system" means a system that uses waste heat to produce
62-133.8. Renewable Energy and Energy Efficiency Portfolio Standard (REPS). (a) Definitions. As used in this section: (1) "Combined heat and power system" means a system that uses waste heat to produce
Appendix D: Electricity Price Forecast Preliminary Draft
 Preliminary Draft Introduction... 1 Findings... 2 Approach and Assumptions... 5 Demand Growth... 5 Firm Capacity Standards... 6 Planning Reserve Margin Targets... 6 Firm Capacity Credit... 7 Existing Resources...
NEVADA S ELECTRIC POWER SYSTEM AND THE CLEAN POWER PLAN
 ADVANCED ENERGY ECONOMY the business voice of advanced energy NEVADA S ELECTRIC POWER SYSTEM AND THE CLEAN POWER PLAN The U.S. Environmental Protection Agency (EPA) will soon release the final rule for
ELECTRIC UTILITY INTEGRATED RESOURCE PLAN (IRP)
") ELECTRIC UTILITY INTEGRATED RESOURCE PLAN (IRP) Demand-Side Resources PRESENTED TO THAI ENERGY REGULATORY COMMISSION, OERC, AND UTILITIES DELEGATION Boston, Massachusetts PRESENTED BY ROMKAEW BROEHM MARIKO
ELECTRIC UTILITY INTEGRATED RESOURCE PLAN (IRP) Demand-Side Resources PRESENTED TO THAI ENERGY REGULATORY COMMISSION, OERC, AND UTILITIES DELEGATION Boston, Massachusetts PRESENTED BY ROMKAEW BROEHM MARIKO
Chapter 5 Renewable Energy
 Chapter 5 Renewable Energy Introduction In FY 2012, 12.2% of the nation's electric power was generated via renewable resources. 26 The Administration s energy strategy encourages increased conventional
February 3, 2015. SUBJECT: Proposed Standard Scenario Results Comparison Metrics
 Phil Rockefeller Chair Washington Tom Karier Washington Henry Lorenzen Oregon Bill Bradbury Oregon W. Bill Booth Vice Chair Idaho James Yost Idaho Pat Smith Montana Jennifer Anders Montana February 3,
Connecticut Department of Environmental Protection. chris.nelson@po.state.ct.us and chris.james@po.state.ct.us
 An Energy Agenda for the 21 st Century March 9, 2007 To: Regarding: Submitted Via Email: Connecticut Department of Environmental Protection BCSE Recommendations for CT RGGI Pre-Proposal chris.nelson@po.state.ct.us
Forecast of Future Electricity Costs in California. Prepared by: Strategic Resource Advisers, LLC November 12, 2014
 Forecast of Future Electricity Costs in California Prepared by: Strategic Resource Advisers, LLC November 12, 2014 Presentation Outline Historical Framework Rate Pressure Future Expectations Conclusions
FEECA Annual Report on Activities Pursuant to the Florida Energy Efficiency & Conservation Act
 F L O R I D A P U B L I C S E R V I C E C O M M I S S I O N FEECA Annual Report on Activities Pursuant to the Florida Energy Efficiency & Conservation Act As Required by Sections 366.82(10), and 377.703(2)(f),
ENERGY STAR Central Air Conditioners & Air-Source Heat Pumps
 ENERGY STAR Central Air Conditioners & Air-Source Heat Pumps Draft 1 Version 5.0 Stakeholder Meeting May 05, 2014 Abigail Daken, U.S. EPA Agenda Welcome and Introductions ENERGY STAR Program Overview Overview
Non-Programmatic Savings from Appliance Standards
 Non-Programmatic Savings from Appliance Standards August, 2014 Prepared for Bonneville Power Administration Prepared by Navigant Consulting, Inc. B O N N E V I L L E P O W E R A D M I N I S T R A T I O
Overview. PG&E and Energy Efficiency. CA Energy Efficiency Regulatory & Policy Roadmap. Financing Options for Efficiency & Demand Response
 Overcoming Financial Barriers to Energy Efficiency April 6, 2010 Overview PG&E and Energy Efficiency CA Energy Efficiency Regulatory & Policy Roadmap Financing Options for Efficiency & Demand Response
Utility Energy Efficiency Developments in the States and DC. Laura Furrey, JD, PE ACEEE March 2010
 Utility Energy Efficiency Developments in the States and DC Laura Furrey, JD, PE ACEEE March 2010 1 The American Council for an Energy Efficient Economy (ACEEE) Non-governmental organization (NGO) dedicated
Hong Kong, China. 40 th APEC Energy Working Group Meeting Statement on Notable Energy Developments. (1) Building Energy Codes
 Building Energy Codes") 40 th APEC Energy Working Group Meeting Statement on Notable Energy Developments Hong Kong, China (1) Building Energy Codes The Electrical and Mechanical Services Department of the Hong Kong Government
40 th APEC Energy Working Group Meeting Statement on Notable Energy Developments Hong Kong, China (1) Building Energy Codes The Electrical and Mechanical Services Department of the Hong Kong Government
REC QUESTIONS & ANSWERS
 REC QUESTIONS & ANSWERS Q: What is a REC? A: A Renewable Energy Certificate (REC), also known as a Green Tag, Renewable Energy Credit, or Tradable Renewable Energy Certificate (TREC), is a tradable environmental
Energy Forecast UPDATE TO THE WHOLESALE ELECTRICITY PRICE FORECAST
 Energy Forecast UPDATE TO THE WHOLESALE ELECTRICITY PRICE FORECAST February 213 Executive Summary This Wholesale Electricity Price Forecast updates the forecast developed in 21 for the Council s Sixth
California Energy Commission 2015 Accomplishments
 California Energy Commission 2015 Accomplishments Responding to California s Drought Responded to the state's historic drought and Governor Edmund G. Brown Jr. s Executive Order B-29-15 by approving new
Renewable Energy on Regional Power Grids Can Help States Meet Federal Carbon Standards
 FACT SHEET Renewable Energy on Regional Power Grids Can Help States Meet Federal Carbon Standards In June 2014, the U.S. Environmental Protection Agency (EPA) used its authority under Section 111(d) of
Electric Energy Generation in Washington State. Key Findings from the Association of Washington Business
 2014 Electric Energy Generation in Washington State Key Findings from the Association of Washington Business Washington s economy is built on abundant, reliable and affordable electric energy. Although
CHAPTER 10: APPLIANCES AND LIGHTING
 Chapter 10: Appliances and Lighting 151 CHAPTER 10: APPLIANCES AND LIGHTING According to the U.S. Environmental Protection Agency, appliances and home electronics account for 20% of energy bills in the
GUIDANCE ON STATE IMPLEMENTATION PLAN (SIP) CREDITS FOR EMISSION REDUCTIONS FROM ELECTRIC-SECTOR ENERGY EFFICIENCY AND RENEWABLE ENERGY MEASURES
 CREDITS FOR EMISSION REDUCTIONS FROM ELECTRIC-SECTOR ENERGY EFFICIENCY AND RENEWABLE ENERGY MEASURES") United States Office of Air and Radiation August 2004 Environmental Protection Agency GUIDANCE ON STATE IMPLEMENTATION PLAN (SIP) CREDITS FOR EMISSION REDUCTIONS FROM ELECTRIC-SECTOR ENERGY EFFICIENCY
United States Office of Air and Radiation August 2004 Environmental Protection Agency GUIDANCE ON STATE IMPLEMENTATION PLAN (SIP) CREDITS FOR EMISSION REDUCTIONS FROM ELECTRIC-SECTOR ENERGY EFFICIENCY
issue brief Colorado s Pathway to Cutting Carbon Pollution www.nrdc.org/policy www.facebook.com/nrdc.org www.twitter.com/nrdc
 issue brief Colorado s Pathway to Cutting Carbon Pollution The Clean Power Plan, finalized by the U.S. Environmental Protection Agency, is a game changer because it sets the first-ever limits on carbon
Demand Response in the Pacific Northwest
 Demand Response in the Pacific Northwest Presented by: Lee Hall, BPA Smart Grid and Demand Response Program Manager Carol Lindstrom, BPA Energy Efficiency Marketing Larry Bryant, Kootenai Electric Cooperative
Study of Potential for Energy Savings in Delaware
 Study of Potential for Energy Savings in Delaware September 4, 2014 Prepared for by with Optimal Energy, Inc. 10600 Route 116, Suite 3 802-482-5600 www.optenergy.com Hinesburg, VT 05461 Study of Potential
ELECTRIC ENERGY EFFICIENCY POTENTIAL FOR PENNSYLVANIA
 GDS Associates, Inc. Engineers and Consultants ELECTRIC ENERGY EFFICIENCY POTENTIAL FOR PENNSYLVANIA Final Report Prepared for: PENNSYLVANIA PUBLIC UTILITY COMMISSION May 10, 2012 Prepared by GDS Associates
Austin Energy Resource, Generation and Climate Protection Plan to 2025: An Update of the 2020 Plan
 Austin Energy Resource, Generation and Climate Protection Plan to 2025: An Update of the 2020 Plan INTRODUCTION The Austin City Council adopted the Austin Climate Protection Plan (ACPP) in 2007 to build
Implications of Carbon Cap-and-Trade for Electricity Rate Design, with Examples from Florida. Hethie Parmesano and Theodore J.
 Implications of Carbon Cap-and-Trade for Electricity Rate Design, with Examples from Florida Hethie Parmesano and Theodore J. Kury Hethie Parmesano is a Special Consultant with NERA Economic Consulting
Anticipating Compliance Strategies and Forecasts for Satisfying Clean Power Plan Requirements
 Anticipating Compliance Strategies and Forecasts for Satisfying Clean Power Plan Requirements By Maggie Shober, Matthew Tanner, and Matt Drews CONTENTS Executive Summary 2 The Clean Power Plan 4 Litigation
Clean Energy Jobs Plan
 Clean Energy Jobs Plan Introduction When I was governor, California was the world leader in renewable energy and it led the nation in efficiency standards. Our programs saved California consumers billions
Green Guide for Businesses Strategy: Energy
 Green Guide for Businesses Strategy: Energy Reduce Energy Use in New and Existing Businesses - In the United States buildings account for: o 72% of electricity consumption, o 39% of energy use, o 38% of
Building Energy Efficiency. Minimum Performance Standards and Labeling to Improve Energy Efficiency
 Building Energy Efficiency Minimum Performance Standards and Labeling to Improve Energy Efficiency Leading the region Education, labeling help lower energy demand and emissions in Brazil To improve energy
SECTOR ASSESSMENT (SUMMARY): ENERGY. 1. Sector Performance, Problems, and Opportunities
: ENERGY. 1. Sector Performance, Problems, and Opportunities") Country Operations Business Plan: Philippines, 2013 2015 SECTOR ASSESSMENT (SUMMARY): ENERGY 1. Sector Performance, Problems, and Opportunities 1. Challenges. Economic growth has been impeded in the Philippines
Country Operations Business Plan: Philippines, 2013 2015 SECTOR ASSESSMENT (SUMMARY): ENERGY 1. Sector Performance, Problems, and Opportunities 1. Challenges. Economic growth has been impeded in the Philippines
for a mid-sized commercial customer (50 KW load, 35% load factor, 12,600 kwh usage), New York s power premium is $884 month.
, New York s power premium is $884 month.") INTRODUCTION These comments are submitted on behalf of The Business Council of New York State, Inc. The Business Council is New York's largest statewide employer advocate, representing more than 3,200
INTRODUCTION These comments are submitted on behalf of The Business Council of New York State, Inc. The Business Council is New York's largest statewide employer advocate, representing more than 3,200
Appendix D: Wholesale Electricity Price Forecast
 Sixth Northwest Conservation and Electric Power Plan Appendix D: Wholesale Electricity Price Forecast Introduction... 1 Summary of Key Findings... 2 Approach and Methodology... 4 Assumptions... 6 Demand...
Scaling EnMS for Whole- Industry Adoption
 Sharing best practices for the low carbon future iipnetwork.org Scaling EnMS for Whole- Industry Adoption Pacific Northwest U.S. Field Study: Food Processing Industry The Pacific Northwest region of the
Energy Situation in Egypt
 Energy Situation in Egypt Egypt has traditionally been a net exporter of energy. Until the late 1990s, it exported oil, but oil production has declined from its peak in the early 1990s, and now roughly
APPLIANCE AND EQUIPMENT EFFICIENCY STANDARDS: A MONEY MAKER AND JOB CREATOR
 APPLIANCE AND EQUIPMENT EFFICIENCY STANDARDS: A MONEY MAKER AND JOB CREATOR Rachel Gold, Steven Nadel, John A. Skip Laitner, and Andrew delaski January 2011 Report Number ASAP-8/ACEEE-A111 American Council
DEPARTMENT OF ENERGY DIVISION 160 ESTABLISH A RENEWABLE ENERGY CERTIFICATE SYSTEM FOR THE OREGON RENEWABLE PORTFOLIO STANDARD (RPS)
") 330-160-0015 Definitions DEPARTMENT OF ENERGY DIVISION 160 ESTABLISH A RENEWABLE ENERGY CERTIFICATE SYSTEM FOR THE OREGON RENEWABLE PORTFOLIO STANDARD (RPS) For the purposes of Oregon Administrative Rules,
330-160-0015 Definitions DEPARTMENT OF ENERGY DIVISION 160 ESTABLISH A RENEWABLE ENERGY CERTIFICATE SYSTEM FOR THE OREGON RENEWABLE PORTFOLIO STANDARD (RPS) For the purposes of Oregon Administrative Rules,
EM&V: Evaluating Market Transformation Programs. Rob Russell June 10, 2010
 EM&V: Evaluating Market Transformation Programs Rob Russell June 10, 2010 Vision and Mission Vision: Energy efficiency is a cornerstone of a vibrant sustainable Northwest. Mission: Mobilize the Northwest
Final Report: Implications of EPA s Proposed Clean Power Plan
 Final Report: Implications of EPA s Proposed Clean Power Plan Analyzing consumer impacts of the draft rule Report prepared for NASUCA November 14, 2014 AUTHORS Elizabeth A. Stanton, PhD Sarah Jackson Bruce
Ontario Hydro. September 28, 1995
 Ontario Hydro Ontario Hydro 700 University Avenue Toronto, Ontario M5G 1X6 O. Allan Kupcis, President & CEO September 28, 1995 Honourable Anne McLellan Minister of Natural Resources Canada Sir William
Presentation to the Staff Subcommittee on Gas 2010 NARUC Winter Committee Meetings Washington, D.C. February 14, 2010
 Presentation to the Staff Subcommittee on Gas 2010 NARUC Winter Committee Meetings Washington, D.C. February 14, 2010 CenterPoint Energy, Inc. promotes the direct use of natural gas through energy efficiency
PG&E and Renewable Energy. Chuck Hornbrook Senior Manager Solar and Customer Generation
 PG&E and Renewable Energy Chuck Hornbrook Senior Manager Solar and Customer Generation PG&E and our Business What we do: Deliver safe, reliable, and environmentally responsible gas and electricity to approximately
Report to Legislative Assembly on Public Purpose Expenditures January 2009 June 2010
 Report to Legislative Assembly on Public Purpose Expenditures January 2009 June 2010 Final Report ECONOMICS FINANCE PLANNING December 21, 2010!!!"#$"%&'()*+,"#-.//-0"#(+-/"1233" 4&.-',560"7./8&5"9:!31"
For. The Conservation Bureau Ontario Power Authority
 Assessment of Proposed Changes to the Ontario Building Code to Increase the Energy Efficiency of New Low & High Rise Buildings: Cost/Benefit to Meet and Exceed OBC in the Affordable Housing Sector For
Energy and Consumer Impacts of EPA s Clean Power Plan. Prepared for the American Coalition for Clean Coal Electricity
 Energy and Consumer Impacts of EPA s Clean Power Plan Prepared for the American Coalition for Clean Coal Electricity Contents Executive Summary Overview of the Clean Power Plan NERA Methodology Baseline
Competitive Electricity Prices: An Update 1
 Competitive Electricity Prices: An Update by J. Alan Beamon Throughout the country, States are moving to make their electricity generation markets more competitive. Although the timing will surely vary,
Alternate Scenarios for 111(d) Implementation in North Carolina
 Implementation in North Carolina") Alternate Scenarios for 111(d) Implementation in North Carolina Prepared for the Southern Environmental Law Center November 26, 2014 AUTHORS Spencer Fields Elizabeth A. Stanton, PhD Pat Knight Bruce Biewald
Alternate Scenarios for 111(d) Implementation in North Carolina Prepared for the Southern Environmental Law Center November 26, 2014 AUTHORS Spencer Fields Elizabeth A. Stanton, PhD Pat Knight Bruce Biewald
CHP & ENVIRONMENTAL COMMODITIES: MARKET & POLICY UPDATE FOR MONETIZING RENEWABLE ENERGY CREDITS FROM CHP PROJECTS. Thomas Jacobsen October 2012
 CHP & ENVIRONMENTAL COMMODITIES: MARKET & POLICY UPDATE FOR MONETIZING RENEWABLE ENERGY CREDITS FROM CHP PROJECTS Thomas Jacobsen October 2012 ELEMENT MARKETS US Emissions House of the Year Launched in
CLEAN POWER, CLEAR SAVINGS MAINE. The EPA Clean Power Plan Will Cut Maine Electricity Bills by 11.3 to 12.5 Percent by 2030
 CLEAN POWER, CLEAR SAVINGS MAINE The EPA Clean Power Plan Will Cut Maine ity s by 11.3 to 12.5 Percent by 2030 Acknowledgments This report was written by David Arkush, managing director of Public Citizen
The Economic Case for Energy Efficiency
 The Economic Case for Energy Efficiency It s not news that the United States uses a great deal of energy (25% of the world s oil energy although we re only 5% of the world s population) and that we import
Understanding Energy Use, Taking Steps to Reduce Energy Use (Intermediate/Advanced ESOL level)
") Understanding Energy Use, Taking Steps to Reduce Energy Use (Intermediate/Advanced ESOL level) Overview of Lesson This is a three-part lesson that covers: 1. energy use and common household appliances,
Understanding Energy Use, Taking Steps to Reduce Energy Use (Intermediate/Advanced ESOL level) Overview of Lesson This is a three-part lesson that covers: 1. energy use and common household appliances,
MARKET EFFECTS AND MARKET TRANSFORMATION: THEIR ROLE IN ENERGY EFFICIENCY PROGRAM DESIGN AND EVALUATION
 MARKET EFFECTS AND MARKET TRANSFORMATION: THEIR ROLE IN ENERGY EFFICIENCY PROGRAM DESIGN AND EVALUATION Prepared by Mitchell Rosenberg KEMA, Inc. Lynn Hoefgen Nexus Market Research Prepared for CIEE Market
ANNUAL REPORT FOR ENERGY EFFICIENCY PROGRAMS CALENDAR YEAR 2013
 ANNUAL REPORT FOR ENERGY EFFICIENCY PROGRAMS CALENDAR YEAR 2013 NMPRC EFFICIENT USE OF ENERGY RULE 17.7.2 NMAC JUNE 1, 2014 EPE s PY2013 Energy Efficiency Report Table of Contents SECTION I. EXECUTIVE
Alternative RE Approach Technical Support Document
 Alternative RE Approach Technical Support Document 1.1. Introduction Renewable energy (RE) is a cost-effective approach for reducing carbon dioxide (CO 2) emissions from fossil fuel-fired electric generating
Senate Bill No. 7 Texas Electric Restructuring Act
 Senate Bill No. 7 Texas Electric Restructuring Act This summary of Texas newly enacted electric restructuring law was prepared by the Office of Public Utility Counsel for National Association of State
MEMORANDUM. Framework for developing the City s Ten-Year Energy Efficiency Targets for the period 2014 to 2023
 MEMORANDUM TO: FROM: UTILITIES ADVISORY COMMISSION UTILITIES DEPARTMENT DATE: JUNE 6, 2012 SUBJECT: Framework for developing the City s Ten-Year Energy Efficiency Targets for the period 2014 to 2023 This
Rules of Thumb Energy Efficiency in Buildings
 Energy Efficiency in Buildings Energy Savings Cost Savings Increased Productivity Economic Development Other Standard lighting retrofits: $0.90-$1.20 per square foot. High-efficiency packaged and split
1995 2005 A DECADE OF CHANGE IN HOME BUILDING WITH ENERGY STAR
 Recycled/Recyclable Printed on paper containing 30% post consumer waste. $300 Penalty for Private Use Official Business Washington, DC 20460-0001 Air and Radiation (6202J) Environmental Protection Agency
This is a draft document for review by the Oregon Greenhouse Gas Reporting Advisory Committee April 1, 2010
 This is a draft document for review by the Oregon Greenhouse Gas Reporting Advisory Committee April 1, 2010 DEPARTMENT OF ENVIRONMENTAL QUALITY Chapter 340 Proposed Rulemaking STATEMENT OF NEED AND FISCAL
BGE Smart Energy Savers Program Energy Efficiency and Demand Response Programs December 4, 2012 USEA Global Workshop On Clean Energy Development
 BGE Smart Energy Savers Program Energy Efficiency and Demand Response Programs December 4, 2012 USEA Global Workshop On Clean Energy Development Ruth C. Kiselewich, Director Demand Side Management Programs
www.nwppa.org BULLETIN/June 2014
 3 14 28 On the cover: An aerial view of Nippon Paper Industries, USA (NPIUSA), which partnered with the City of Port Angeles (Wash.) and the Bonneville Power Administration in 2012 in the first market
Realized and Prospective Impacts of U.S. Energy Efficiency Standards for Residential Appliances: 2004 Update
 LBNL-56417 Realized and Prospective Impacts of U.S. Energy Efficiency Standards for Residential Appliances: 2004 Update Stephen Meyers, James McMahon, Michael McNeil Environmental Energy Technologies Division
2014/15-2016/17 ELECTRICITY EFFICIENCY PLAN
 2014/15-2016/17 ELECTRICITY EFFICIENCY PLAN PLAN OVERVIEW Prepared for the New Brunswick Department of Energy and Mines with the assistance of Dunsky Energy Consulting July 2014 This page intentionally
Avista Utilities. Washington / Idaho 2013 Electric Demand-Side Management Business Plan
 Avista Utilities Washington / Idaho 2013 Electric Demand-Side Management Business Plan November 1, 2012 Table of Contents I. Executive Summary.... 2 II. Preface to the 2013 DSM Business Plan.. 3 Natural
Fiscal Year 2011 Resource Plan
 Salt River Project Fiscal Year 2011 Resource Plan Page 1 Last summer SRP hosted three resource planning workshops for a diverse group of stakeholders and customers to explain the planning process, discuss
Switching Energy Providers and PECO Smart Ideas. March 23, 2011
 Switching Energy Providers and PECO Smart Ideas March 23, 2011 Agenda Market Changes Taking Advantage of Competition PECO Smart Ideas for your home Questions Market Changes Utility Functions Before deregulation,
Appendix J Demand Response Pilot
 Appendix J Demand Response Pilot City Light s power resources are unusual for an electric utility serving a major urban area. About 90% of the energy served to Seattle originates from water, or hydropower.
Comments of the Business Council for Sustainable Energy Regarding the American Clean Energy and Security Act of 2009. May 6, 2009.
 Comments of the Business Council for Sustainable Energy Regarding the American Clean Energy and Security Act of 2009 Executive Summary The Business Council for Sustainable Energy commends the release of
Potential Energy Impacts of the EPA Proposed Clean Power Plan
 Potential Energy Impacts of the EPA Proposed Clean Power Plan Prepared for: American Coalition for Clean Coal Electricity American Fuel & Petrochemical Manufacturers Association of American Railroads American
FINANCIAL SUPPORT PROGRAMS
 9 FINANCIAL SUPPORT PROGRAMS 108 9 FINANCIAL SUPPORT PROGRAMS 9 FINANCIAL SUPPORT PROGRAMS There are a number of Government support mechanisms to help reduce the barriers to undertaking action on energy
California s Electricity Market. Overview
 California s Electricity Market Law Seminar s International Tribal Energy and the California Market June 23, 2008 Denny Brown California Energy Commission Overview Role of the Energy Commission Electricity
Energy Trends Report
 Energy Trends Report July 27 State Utility Forecasting Group Energy Center at Discovery Park Purdue University Introduction This report illustrates a number of trends occurring in the energy industries,
Wyoming Annual Demand- Side Management Review Report. January 1, 2014 December 31, 2014
 Wyoming Annual Demand- Side Management Review Report January 1, 2014 December 31, 2014 Issued June 16, 2015 (This page intentionally left blank) Rocky Mountain Power Wyoming Report Tables of Contents TABLE
Your energy costs. A room-by-room guide. P.O. Box 129831 San Diego, CA 92112-9831 1-800-411-7343 Connect at sdge.com
 Your energy costs A room-by-room guide P.O. Box 129831 San Diego, CA 92112-9831 1-800-411-7343 Connect at sdge.com 2014 San Diego Gas & Electric Company. E Printed on recycled paper with soy-based inks.
INDONESIA S COUNTRY REPORT ENCOURAGING CLEAN ENERGY INITIATIVE
 DEWAN PERWAKILAN RAKYAT REPUBLIK INDONESIA INDONESIA S COUNTRY REPORT ENCOURAGING CLEAN ENERGY INITIATIVE As part of the international community, Indonesia shares its concern on the environment and development
Comparing Electricity Generation Technologies
 Comparing Electricity Generation Technologies Stan Rosinski Program Manager, Renewable Generation 2011 SRP Sustainable Portfolio Review March 3, 2011 Comparing Electricity Generation Technologies Key Takeaways
Economic Analysis of Ohio s Renewable and Energy Efficiency Standards
 Economic Analysis of Ohio s Renewable and Energy Efficiency Standards Ohio State Researchers Find Ohio s Renewable and Energy Efficiency Standards Have Saved Ratepayers 1.4% Since Inception, and Weakening
Lessons on Conservation
 Lesson Plan: Energy Conservation Concepts 1. Energy conservation can be defined as the protection, preservation, management, or restoration of our energy resources. 2. Conservation is one of the ways we
State Clean Energy-Environment Technical Forum Energy Efficiency Portfolio Standards May 16, 2006 Call Summary
 State Clean Energy-Environment Technical Forum Energy Efficiency Portfolio Standards May 16, 2006 Call Summary Participants: 47 participants from 18 states and several national organizations (see the participants
Appendix C: Demand Forecast
 Sixth Northwest Conservation and Electric Power Plan Appendix C: Demand Forecast Energy Demand... 1 Background... 1 Demand Forecast Methodology... 3 New Demand Forecasting Model for the Sixth Plan... 4
Electricity Costs White Paper
 Electricity Costs White Paper ISO New England Inc. June 1, 2006 Table of Contents Executive Summary...1 Highlights of the Analysis...1 Components of Electricity Rates...2 Action Plan for Managing Electricity
CALIFORNIA ENERGY EFFICIENCY POLICIES China-US Energy Efficiency Solutions Summit
 CALIFORNIA ENERGY EFFICIENCY POLICIES China-US Energy Efficiency Solutions Summit SANDY GOLDBERG GOVERNOR S OFFICE OF PLANNING & RESEARCH 1400 Tenth St., Sacramento CA 95814 Phone: (916) 323-9164 Email:
SCHEDULE 90 ELECTRIC ENERGY EFFICIENCY PROGRAMS IDAHO
 Second Revision Sheet 90 I.P.U.C. No.28 First Revision Sheet 90 90 SCHEDULE 90 ELECTRIC ENERGY EFFICIENCY PROGRAMS IDAHO 1. Availability The services described herein are available to specified residential,
Customer Energy Solutions
 Customer Energy Solutions Program Progress Report 2013-2014 1 Customer Energy Solutions The Customer Energy Solutions team is committed to providing the best service to our customers and our community.
Energy Efficiency Accomplishments of Texas Investor-Owned Utilities Calendar Year 2013
 Energy Efficiency Accomplishments of Texas Investor-Owned Utilities Calendar Year 2013 1 Accomplishments Frontier Associates LLC In 2013, the majority of the Texas investor-owned utilities (IOUs) exceeded
Renewable Energy Credit (REC) Price Forecast (Preliminary Results)
 Price Forecast (Preliminary Results)") Renewable Energy Credit (REC) Price Forecast (Preliminary Results) OVERVIEW What is a REC price forecast and why is it needed? Interest in renewable energy has increased worldwide in response to concerns
Renewable Energy Credit (REC) Price Forecast (Preliminary Results) OVERVIEW What is a REC price forecast and why is it needed? Interest in renewable energy has increased worldwide in response to concerns
Renewable Energy Certificates
 EPA s Green Power Partnership Renewable Energy Certificates Last updated: July 2008 U.S. Environmental Protection Agency 1200 Pennsylvania Ave, NW (Mail Code 6202J) Washington, DC 20460 www.epa.gov/greenpower
MARKET BASED INSTRUMENTS: AUSTRALIA S EXPERIENCE WITH TRADING RENEWABLE ENERGY CERTIFICATES
 Workshop on Good Practices in Policies and Measures, 8-10 October 2001, Copenhagen MARKET BASED INSTRUMENTS: AUSTRALIA S EXPERIENCE WITH TRADING RENEWABLE ENERGY CERTIFICATES Gwen Andrews Australia Chief