A Survey of Linux Measurement and Diagnostic Tools
|
|
|
- Priscilla Stevens
- 8 years ago
- Views:
Transcription
1 A Survey of Linux Measurement and Diagnostic Tools When the performance of your embedded Linux device is inadequate, how do you understand what the problem is? This presentation will provide an overview of some of the available tools to measure and analyze the behavior and resource usage of the Linux kernel and userland applications. Frank Rowand, Sony Corporation of America October 16, 2009

2 Please ask questions during the presentation! If an answer will be long, I might defer it to the end of the talk. If I think I am running out of time, I might defer all questions to the end of the talk. I will be available for discussion and questions after the talk.

3 Performance Instrumentation is An Active Area of Development Most examples for today created on: Linux kernel < rc3 x86 hardware 32 bit, 64 bit Intel, AMD SMP, UP

4 Preview Some past, current and future tools to investigate: - Waiting for resources - Resource usage - Resource allocation With a bias toward more recent tools.

5 Suggestions from Google linux performance monitoring tools

6 Suggestions from Google linux performance monitoring tools Conky GKrellM Ksysguard bonnie cacti free gnome system monitor htop iostat iozone iptraf isag lsof mpstat mtr nagios netperf netstat nfsstat nmap ntop oprofile ping pmap ps sa sa2 sadc sal sar smartmontools smem spray ss strace sysstat tcdump tcpdump time top traceroute uptime vmstat w wireshark xload xosview /proc

7 Suggestions from Google linux performance monitoring tools Those tools are useful, but mostly not included in this presentation...

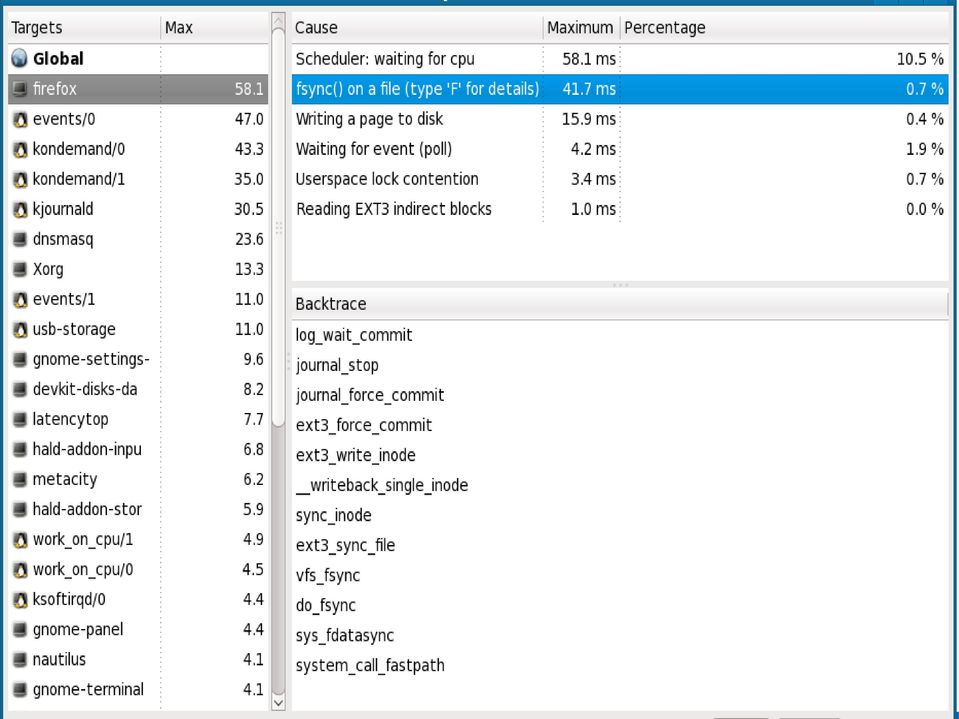
8 LatencyTop [latency] Skipping audio, slower servers, everyone knows the symptoms of latency. But to know what's going on in the system, what's causing the latency, how to fix it... that's a hard question without good answers right now. source:

9 LatencyTop [latency] LatencyTOP focuses on the cases where the applications want to run and execute useful code, but there's some resource that's not currently available (and the kernel then blocks the process). source:
. source: http://www.")
10 LatencyTop [latency] LatencyTOP focuses on the cases where the applications want to run and execute useful code, but there's some resource that's not currently available (and the kernel then blocks the process). This is done both on a system level and on a per process level, so that you can see what's happening to the system, and which process is suffering and/or causing the delays. source:

11

12

13

14
15 LatencyTop Version 0.1 announced 18 January 2008 [latency]

16 mutrace Mutex lock contention in application programs [lock]

17 mutrace [lock] Example: $ LD_PRELOAD=/home/lennart/projects/mutrace/libmutrace.so gedit mutrace: 0.1 sucessfully initialized. mutrace: 10 most contended mutexes: Mutex # Locked Changed Cont. tot.time[ms] avg.time[ms] max.time[ms] ,822 0,000 0, ,855 0,000 0, ,610 0,001 0, ,931 0,000 0, ,769 0,007 0, ,633 0,000 0, ,376 0,004 0, ,038 0,001 0, ,068 0,001 0, ,408 0,000 0, mutrace: Total runtime 9678,142 ms. Type normal normal normal normal normal normal normal normal normal normal...
![.. Cont. tot.time[ms] avg.time[ms] max.](/docs-images/42/12688084/images/page_17.jpg "time[ms] 275 120,822 0,000 0,894 21 86,855 0,000 0,494 4 98,610 0,001 0,150 2 23,931 0,000 0,092 1 0,769 0,007 0,160 1 6,633 0,000 0,019 1 4,376 0,004 0,174 0 0,038 0,001 0,004 0")
18 mutrace [lock] mutrace: 10 most contended mutexes: Mutex # Locked Changed Cont. tot.time[ms] avg.time[ms] max.time[ms] ,822 0,000 0, ,855 0,000 0, ,610 0,001 0, ,931 0,000 0, ,769 0,007 0, ,633 0,000 0, ,376 0,004 0, ,038 0,001 0, ,068 0,001 0, ,408 0,000 0, mutrace: Total runtime 9678,142 ms.
![time[ms] avg.time[ms] max.](/docs-images/42/12688084/images/page_18.jpg "time[ms] 275 120,822 0,000 0,894 21 86,855 0,000 0,494 4 98,610 0,001 0,150 2 23,931 0,000 0,092 1 0,769 0,007 0,160 1 6,633")
19 mutrace [lock] Example: Locked Changed Cont. tot.time avg.time max.time Type - count: calls to lock mutex - count: owner of the mutex changed - count: requestor waited on lock - total time lock held - average time lock held - maximum time lock held - recursive, normal, or otherwise (Cont. == contended)

20 mutrace [lock] - User space mutex only ( Adding support for rwlocks should be easy ) - cannot profile mutexes that are used internally in glibc, such as those used for synchronizing stdio and suchlike - requires recent Linux distribution

21 smem [memory] Reports memory usage RSS (Resident Set Size) typically overestimates process memory usage because shared memory is double counted for each user. PSS (Proportional Set Size) apportions shared memory across all of its users. PSS is the special smem feature.
22 ? smem -r -u User Count frowand 55 root 54 smmsp 1 gdm 1 Swap USS PSS RSS
23 ? smem -r -P vim PID User Command frowand /usr/bin/python./smem -r 7728 frowand vim outline 2603 frowand vim notes 7586 frowand vim outline_bare 7970 frowand vim resource_list 5509 frowand vim notes_articles 4748 frowand vim info_creation_tools Swap USS PSS RSS
24 ? smem -r -m -P vim Map [heap] <anonymous> /usr/bin/vim /usr/lib64/libpython2.6.so.1.0 /usr/lib64/perl5/5.10.0/x86_64-linux-thr [stack] /lib64/libc so /lib64/ld so /lib64/libpthread so /lib64/libdl so /lib64/libselinux.so.1 /lib64/libnsl so /lib64/libutil so /lib64/libm so /lib64/libresolv so /lib64/libnss_files so /lib64/libncurses.so.5.7 /lib64/libcrypt so /lib64/libtinfo.so.5.7 /lib64/libacl.so /usr/lib64/libgpm.so /lib64/libfreebl3.so /lib64/libattr.so PIDs AVGPSS PSS
25
26 ? smem -r PID User 6409 frowand 6444 frowand 2447 frowand 2530 frowand 2428 frowand 6929 frowand 2422 frowand 2511 frowand 2492 frowand 2515 frowand 2413 frowand 2462 frowand 2458 frowand 2455 frowand 2417 frowand 2513 frowand 2568 frowand 2602 frowand 2496 frowand 2300 frowand 6741 frowand 2603 frowand 2451 frowand... Command /usr/lib64/openoffice.org3/ /usr/lib64/firefox-3.5b4/fi nautilus gnome-terminal gnome-panel /usr/bin/python./smem_tbir metacity /usr/libexec/clock-applet /usr/libexec/wnck-applet -/usr/libexec/gdm-user-switc /usr/libexec/gconfd-2 nm-applet --sm-disable gnome-volume-control-applet gnome-power-manager /usr/libexec/gnome-settings /usr/libexec/gnome-brightne gnome-screensaver vim outline /usr/libexec/notification-a gnome-session vim setup_fedora_11 vim notes /usr/libexec/gdu-notificati Swap USS PSS RSS
27
28
29 smem Requires: - kernel > Python python-matplotlib if charts are desired [memory]
30 oprofile [processor] $ opcontrol --start --vmlinux=vmlinux rc3.ftr $ oprofile -l samples % image name libc so no-vmlinux vmlinux vmlinux vmlinux vmlinux vmlinux libpixman-1.so vmlinux vmlinux vmlinux Xorg vmlinux libxul.so vmlinux vmlinux ls vmlinux libglib-2.0.so vmlinux app name libc so no-vmlinux vmlinux vmlinux vmlinux vmlinux vmlinux libpixman-1.so vmlinux vmlinux vmlinux Xorg vmlinux libxul.so vmlinux vmlinux ls vmlinux libglib-2.0.so vmlinux symbol name memcpy /no-vmlinux native_read_tsc lock_acquire lock_release lock_acquire mwait_idle_with_hints /usr/lib64/libpixman-1 read_hpet native_sched_clock lock_acquired /usr/bin/xorg d_lookup /usr/lib64/xulrunner-1 lock_release_holdtime link_path_walk /bin/ls hlock_class /lib64/libglib-2.0.so. avc_has_perm_noaudit
31 oprofile [processor] $ opcontrol --start --vmlinux=vmlinux rc3.ftr $ oprofile -l samples % image name libc so no-vmlinux vmlinux vmlinux vmlinux vmlinux vmlinux libpixman-1.so app name libc so no-vmlinux vmlinux vmlinux vmlinux vmlinux vmlinux libpixman-1.so symbol name memcpy /no-vmlinux native_read_tsc lock_acquire lock_release lock_acquire mwait_idle_with_h /usr/lib64/libpix
32 oprofile [processor] $ opcontrol --start --no-vmlinux $ oprofile -l samples % image name app name symbol name no-vmlinux no-vmlinux /no-vmlinux Xorg Xorg /usr/bin/xorg libglib-2.0.so libglib-2.0.so /lib64/libglib-2.0.so. libpixman-1.so libpixman-1.so /usr/lib64/libpixman-1 libcairo.so libcairo.so /usr/lib64/libcairo.so radeon_drv.so radeon_drv.so /usr/lib64/xorg/module libexa.so libexa.so /usr/lib64/xorg/module libgobject-2.0.so libgobject-2.0.so /lib64/libgobjectlibvte.so libvte.so /usr/lib64/libvte.so.9 libpthread so libpthread so pthread_mutex_lock libxul.so libxul.so /usr/lib64/xulrunner-1 libpthread so libpthread so pthread_mutex_unlock libgdk-x so libgdk-x so /usr/lib64/libgdklibmozjs.so libmozjs.so /usr/lib64/xulrunner-1 libdbus-1.so libdbus-1.so /lib64/libdbus-1.so.3. libc so libc so _int_malloc libx11.so libx11.so /usr/lib64/libx11.so.6 libc so libc so memcpy libc so libc so _int_free libgtk-x so libgtk-x so /usr/lib64/libgtk-
33 oprofile [processor] - Time Based Sampling (possible side effects) - How often is a function executing?
34 systemtap [processor] Example from Fedora fc11 /usr/share/doc/systemtap-0.9.5/examples/process/syscalltimes.txt $./syscalltimes -n top -n vi System Call Count Total ns Avg ns Min ns Max ns access rt_sigprocmask rt_sigaction sysinfo lseek getuid getrlimit munmap getpid unlink
35 systemtap [processor] - Debugging tool, but previous example shows example of calculating system call duration
36 time [processor] Do not always need the new, powerful tools. Example usage: Compare two algorithms - elapsed time - user space time - kernel space time
37 time [processor] $ time./test_array_1_64 >/dev/null real user sys 0m1.968s 0m1.946s 0m0.022s $ time./test_array_2_64 >/dev/null real user sys 0m8.069s 0m8.038s 0m0.022s
38 Performance Events [processor] Do not always need the new, powerful tools. But sometimes the new tools give new capability.
39 Performance Events [processor] $ perf stat --repeat 10./test_array_2_64 >/dev/null Performance counter stats for './test_array_2_64' (10 runs): task-clock-msecs context-switches CPU-migrations page-faults cycles instructions cache-references cache-misses seconds time elapsed # # # # # # # # ( % ) CPUs M/sec M/sec M/sec M/sec IPC M/sec M/sec ( ( ( ( ( ( ( ( % 1.024% % 0.000% 0.402% 0.006% 0.017% 0.944% ) ) ) ) ) ) ) )
40 Performance Events [processor] test_array_1_64 vs. test_array_2_ context-switches # context-switches # M/sec M/sec cycles cycles # # M/sec M/sec instructions instructions # # IPC IPC cache-references # cache-references # M/sec M/sec cache-misses cache-misses M/sec M/sec # # seconds time elapsed seconds time elapsed
41 Performance Events /* test_array_1.c */ #define A_SIZE 1024 long array [A_SIZE][A_SIZE]; total = 0; for (j=0; j < A_SIZE; j++) for (k=0; k < A_SIZE; k++) { array[j][k] = j + k; total += array[j][k]; } for (i=0; i < 500; i++) for (j=0; j < A_SIZE; j++) for (k=0; k < A_SIZE; k++) total += array[j][k]; [processor]
42 Performance Events diff test_array_1.c test_array_2.c + array[j][k] = j + k; array[k][j] = j + k; + total += array[j][k]; total += array[k][j]; + total += array[j][k]; total += array[k][j]; [processor]
43 bootchart - After kernel boot, the init phase - The following images are from [timeline]
44
45
46
47 boot tracer [timeline] - Late kernel boot: initcall functions - Data source: dmesg, printk times: [ ] [ ] [ ] [ ] [ ] [ ] [ ] [ ] calling initcall calling initcall calling initcall calling initcall net_ns_init net_ns_init e820_mark_nvs_memory e820_mark_nvs_memory cpufreq_tsc cpufreq_tsc pci_reboot_init pci_reboot_init
48 boot tracer [timeline] # enable CONFIG_BOOT_TRACER # and build kernel # boot with the parameters: "initcall_debug" and "printk.time=1" # scripts is in the kernel source tree dmesg perl scripts/bootgraph.pl > output.svg inkscape output.svg
49
50 boot tracer Requires: -kernel >= [timeline]
51 kft Kernel Function Trace [timeline] - Early kernel boot: start_kernel() - Can also be used after boot. - Triggers and filters to reduce amount of data logged. - Post trace analysis tool does filtering, sorting, analysis and trace formatting. - Can provide function level detail.
52 kft Kernel Function Trace [timeline] - Previously known as KFI, Kernel Function Instrumentation - Patches available for
53 kft Kernel Function Trace [timeline] Tim Bird is moving this technology forward into the ftrace framework. See his presentation from yesterday: Analyzing Kernel Function Execution with ftrace
54 lttng Long history, starting with predecessor ltt. Not in mainline. Included in some distributions: - MontaVista - Wind River [timeline]
55
56
57
58
59
60
61
62
63 lttng [timeline] Text dump of logfile, reformatted for my taste: lttv -m textdump -e "state.pid=5722 state.pid=5870" -t trace3 >tmp trace_path=/mnt/fc8/frowand_me/presentation/ survey_of_linux_measurement_and_diagnostic_tools/ preparation/resources/ltt/trace3/ sed -i -e "s ${trace_path} " tmp paste <(cut -d" " -f 2 tmp) <(cut -d" " -f 1 tmp) <(cut -d" " -f 3- tmp) >td_5722_5870
64
65
66
67 sched_switch [timeline] Graphic representation of ftrace sched_switch tracer. The following graphs show the same toy benchmark as in the last two ltt graphs.
68
69
70 timechart [timeline] Graphic representation of performance events data. The following graph shows the same toy benchmark as in the last two ltt graphs and the sched_switch graphs.
71
72 ftrace ftrace is a key set of performance tools and instrumentation. Not welll covered in this talk because - it is a huge topic, deserving its own talk - information is otherwise available In mainline Rapidly evolving
73 Performance Events Also known as: Performance Counters perfcounters
74 Performance Events Performance Events is a key set of performance tools and instrumentation. Not well covered in this talk because - it is a huge topic, deserving its own talk - information is otherwise available Rapidly evolving
75 Past vs. Future lkml: Re: mailing list for trace users Ingo Molnar Wed, 23 Sep :07: Both oprofile and readprof are obsolete html Maybe we need to socialize in April the fact that Systemtap is doomed, and to socialize exploring other tracing technologies.
76 Past vs. Future Are predictions of obsolescence correct?
77 Review Some past, current and future tools to investigate: - Waiting for resources - Resource usage - Resource allocation
78 Resources latencytop mutrace smem Matt Mackall "Visualizing Process Memory" systemtap /usr/share/doc/system-tap*/examples/
79 Resources bootchart kft Analyzing Kernel Function Execution with ftrace
80 Resources ltt ng sched_switch linux-rt-users ( Analyze sched_switch ftrace data with vcd viewer Herman ten Brugge Thu, 04 Jun :58: timechart
81 Questions?
82
About Forum Howtos & FAQs Low graphics Shell Scripts RSS/Feed. nixcraft - insight into linux admin work Home > CentOS. by Vivek Gite 134 comments
 1 von 14 15.06.2010 05:12 About Forum Howtos & FAQs Low graphics Shell Scripts RSS/Feed nixcraft - insight into linux admin work Home > CentOS by Vivek Gite 134 comments Need to monitor Linux server performance?
Optimizing Linux Performance
 Optimizing Linux Performance Why is Performance Important Regular desktop user Not everyone has the latest hardware Waiting for an application to open Application not responding Memory errors Extra kernel
OS Observability Tools
 OS Observability Tools Classic tools and their limitations DTrace (Solaris) SystemTAP (Linux) Slide 1 Where we're going with this... Know about OS observation tools See some examples how to use existing
Linux Tools for Monitoring and Performance. Khalid Baheyeldin November 2009 KWLUG http://2bits.com
 Linux Tools for Monitoring and Performance Khalid Baheyeldin November 2009 KWLUG http://2bits.com Agenda Introduction Definitions Tools, with demos Focus on command line, servers, web Exclude GUI tools
Perf Tool: Performance Analysis Tool for Linux
 / Notes on Linux perf tool Intended audience: Those who would like to learn more about Linux perf performance analysis and profiling tool. Used: CPE 631 Advanced Computer Systems and Architectures CPE
<Insert Picture Here> Tracing on Linux
 Tracing on Linux Elena Zannoni (elena.zannoni@oracle.com) Linux Engineering, Oracle America November 6 2012 The Tree of Tracing SystemTap LTTng perf DTrace ftrace GDB TRACE_EVENT
Linux System Administration on Red Hat
 Linux System Administration on Red Hat Kenneth Ingham September 29, 2009 1 Course overview This class is for people who are familiar with Linux or Unix systems as a user (i.e., they know file manipulation,
<Insert Picture Here> Tracing on Linux Updates
 Tracing on Linux Updates Elena Zannoni (elena.zannoni@oracle.com) Linux Engineering, Oracle America May 30 2013 A Look at the Building Blocks Kprobes Tracepoints Uprobes 2 Kprobes:
<Insert Picture Here> Tracing on Linux: the Old, the New, and the Ugly
 Tracing on Linux: the Old, the New, and the Ugly Elena Zannoni (elena.zannoni@oracle.com) Linux Engineering, Oracle America October 27 2011 Categories of Tracing Tools Kernel Tracing
Efficient and Large-Scale Infrastructure Monitoring with Tracing
 CloudOpen Europe 2013 Efficient and Large-Scale Infrastructure Monitoring with Tracing Julien.desfossez@efcios.com 1 Content Overview of tracing and LTTng LTTng features for Cloud Providers LTTng as a
Android Systems Programming Tips and Tricks
 Android Systems Programming Tips and Tricks Tim Bird Sony Network Entertainment, Inc < tim.bird (at) am.sony.com > Overview Intro to Android Working with source Interacting with the target Trace and debug
Advanced Linux System Administration on Red Hat
 Advanced Linux System Administration on Red Hat Kenneth Ingham September 29, 2009 1 Course overview This class is for people who are familiar with basic Linux administration (i.e., they know users, packages,
20 Command Line Tools to Monitor Linux Performance
 20 Command Line Tools to Monitor Linux Performance 20 Command Line Tools to Monitor Linux Performance It s really very tough job for every System or Network administrator to monitor and debug Linux System
Frysk The Systems Monitoring and Debugging Tool. Andrew Cagney
 Frysk The Systems Monitoring and Debugging Tool Andrew Cagney Agenda Two Use Cases Motivation Comparison with Existing Free Technologies The Frysk Architecture and GUI Command Line Utilities Current Status
System Administration
 Performance Monitoring For a server, it is crucial to monitor the health of the machine You need not only real time data collection and presentation but offline statistical analysis as well Characteristics
Stop the Guessing. Performance Methodologies for Production Systems. Brendan Gregg. Lead Performance Engineer, Joyent. Wednesday, June 19, 13
 Stop the Guessing Performance Methodologies for Production Systems Brendan Gregg Lead Performance Engineer, Joyent Audience This is for developers, support, DBAs, sysadmins When perf isn t your day job,
Red Hat Enterprise Linux (RHEL 6) Courses
 Courses") Red Hat Enterprise Linux (RHEL 6) Courses Red Hat System Administration I * Core Skills (5 days) Advanced Linux Shell Scripting Shell Scripting (bash,ksh93) and awk Programming (3 days) Advanced Red Hat
Red Hat Enterprise Linux (RHEL 6) Courses Red Hat System Administration I * Core Skills (5 days) Advanced Linux Shell Scripting Shell Scripting (bash,ksh93) and awk Programming (3 days) Advanced Red Hat
Performance Counters on Linux
 Performance Counters on Linux The New Tools Linux Plumbers Conference, September, 2009 Arnaldo Carvalho de Melo acme@redhat.com How did I get involved?. I am no specialist on performance counters. pahole
SAS Application Performance Monitoring for UNIX
 Abstract SAS Application Performance Monitoring for UNIX John Hall, Hewlett Packard In many SAS application environments, a strategy for measuring and monitoring system performance is key to maintaining
Realtime Linux Kernel Features
 Realtime Linux Kernel Features Tim Burke, Red Hat, Director Emerging Technologies Special guest appearance, Ted Tso of IBM Realtime what does it mean to you? Agenda What? Terminology, Target capabilities
RED HAT DEVELOPER TOOLSET Build, Run, & Analyze Applications On Multiple Versions of Red Hat Enterprise Linux
 RED HAT DEVELOPER TOOLSET Build, Run, & Analyze Applications On Multiple Versions of Red Hat Enterprise Linux Dr. Matt Newsome Senior Engineering Manager, Tools RED HAT ENTERPRISE LINUX RED HAT DEVELOPER
VIRTUALIZATION AND CPU WAIT TIMES IN A LINUX GUEST ENVIRONMENT
 VIRTUALIZATION AND CPU WAIT TIMES IN A LINUX GUEST ENVIRONMENT James F Brady Capacity Planner for the State Of Nevada jfbrady@doit.nv.gov The virtualization environment presents the opportunity to better
Facultat d'informàtica de Barcelona Univ. Politècnica de Catalunya. Administració de Sistemes Operatius. System monitoring
 Facultat d'informàtica de Barcelona Univ. Politècnica de Catalunya Administració de Sistemes Operatius System monitoring Topics 1. Introduction to OS administration 2. Installation of the OS 3. Users management
EXPLORING LINUX KERNEL: THE EASY WAY!
 EXPLORING LINUX KERNEL: THE EASY WAY! By: Ahmed Bilal Numan 1 PROBLEM Explore linux kernel TCP/IP stack Solution Try to understand relative kernel code Available text Run kernel in virtualized environment
System Resources. To keep your system in optimum shape, you need to be CHAPTER 16. System-Monitoring Tools IN THIS CHAPTER. Console-Based Monitoring
 CHAPTER 16 IN THIS CHAPTER. System-Monitoring Tools. Reference System-Monitoring Tools To keep your system in optimum shape, you need to be able to monitor it closely. Such monitoring is imperative in
After using the system-wide performance tools to figure out which process is slowing
 4 Performance Tools: Process-Specific CPU After using the system-wide performance tools to figure out which process is slowing down the system, you must apply the process-specific performance tools to
Optimizing Application Performance with CUDA Profiling Tools
 Optimizing Application Performance with CUDA Profiling Tools Why Profile? Application Code GPU Compute-Intensive Functions Rest of Sequential CPU Code CPU 100 s of cores 10,000 s of threads Great memory
Developing applications on Yocto. Lianhao Lu Intel Corporation Feb. 29th, 2012
 Developing applications on Yocto Lianhao Lu Intel Corporation Feb. 29th, 2012 Agenda Embedded Linux Development The Yocto Project Offerings For Embedded Linux Development The Yocto Project Eclipse Plug-in
Why Computers Are Getting Slower (and what we can do about it) Rik van Riel Sr. Software Engineer, Red Hat
 Rik van Riel Sr. Software Engineer, Red Hat") Why Computers Are Getting Slower (and what we can do about it) Rik van Riel Sr. Software Engineer, Red Hat Why Computers Are Getting Slower The traditional approach better performance Why computers are
Why Computers Are Getting Slower (and what we can do about it) Rik van Riel Sr. Software Engineer, Red Hat Why Computers Are Getting Slower The traditional approach better performance Why computers are
IIS Sustainability Infrastructure and Operational Considerations. Gary Wheeler HP IIS Delivery Executive October 2013
 IIS Sustainability Infrastructure and Operational Considerations Gary Wheeler HP IIS Delivery Executive October 2013 Presentation Goals Take a look at infrastructure and understand role and risk points
MEASURING WORKLOAD PERFORMANCE IS THE INFRASTRUCTURE A PROBLEM?
 MEASURING WORKLOAD PERFORMANCE IS THE INFRASTRUCTURE A PROBLEM? Ashutosh Shinde Performance Architect ashutosh_shinde@hotmail.com Validating if the workload generated by the load generating tools is applied
Cisco Networking Academy Program Curriculum Scope & Sequence. Fundamentals of UNIX version 2.0 (July, 2002)
") Cisco Networking Academy Program Curriculum Scope & Sequence Fundamentals of UNIX version 2.0 (July, 2002) Course Description: Fundamentals of UNIX teaches you how to use the UNIX operating system and
Cisco Networking Academy Program Curriculum Scope & Sequence Fundamentals of UNIX version 2.0 (July, 2002) Course Description: Fundamentals of UNIX teaches you how to use the UNIX operating system and
KVM PERFORMANCE IMPROVEMENTS AND OPTIMIZATIONS. Mark Wagner Principal SW Engineer, Red Hat August 14, 2011
 KVM PERFORMANCE IMPROVEMENTS AND OPTIMIZATIONS Mark Wagner Principal SW Engineer, Red Hat August 14, 2011 1 Overview Discuss a range of topics about KVM performance How to improve out of the box experience
A candidate following a programme of learning leading to this unit will be able to:
 Unit 24: Linux+ Learning Outcomes A candidate following a programme of learning leading to this unit will be able to: Demonstrate knowledge of planning the implementation Show knowledge of how to install
Precision Time Protocol on Linux ~ Introduction to linuxptp
 Precision Time Protocol on Linux ~ Introduction to linuxptp Ken ICHIKAWA FUJITSU LIMITED. LinuxCon Japan 2014 Copyright 2014 FUJITSU LIMITED Agenda Background Overview of Precision Time Protocol (PTP)
LinuxCon Europe 2013. Cloud Monitoring and Distribution Bug Reporting with Live Streaming and Snapshots. mathieu.desnoyers@efficios.
 LinuxCon Europe 2013 Cloud Monitoring and Distribution Bug Reporting with Live Streaming and Snapshots mathieu.desnoyers@efficios.com 1 Presenter Mathieu Desnoyers http://www.efficios.com Author/Maintainer
Help! My system is slow!
 Help! My system is slow! Profiling tools, tips and tricks Kris Kennaway kris@freebsd.org Overview Goal: Present some tools for evaluating the workload of your FreeBSD system, and identifying the bottleneck(s)
Linux Troubleshooting. 5 Days
 QWERTYUIOP{ Linux Troubleshooting 5 Days The class is designed to give Linux administrators experience with both common and uncommon system problems. The course is based on the idea that the best way to
Where is the memory going? Memory usage in the 2.6 kernel
 Where is the memory going? Memory usage in the 2.6 kernel Sep 2006 Andi Kleen, SUSE Labs ak@suse.de Why save memory Weaker reasons "I ve got 1GB of memory. Why should I care about memory?" Old machines
Energy Performance and Accounting in Mobile Operating Systems
 Computer Laboratory Energy Performance and Accounting in Mobile Operating Systems James Snee and Andrew Rice 1 Too many features not enough energy... 2 Where is the energy spent?? 3 Power (Watts) What
These sub-systems are all highly dependent on each other. Any one of them with high utilization can easily cause problems in the other.
 Abstract: The purpose of this document is to describe how to monitor Linux operating systems for performance. This paper examines how to interpret common Linux performance tool output. After collecting
Performance Architect Remote Storage (Intern)
") Performance Architect Remote Storage (Intern) Samsung Semiconductor, Inc. is a world leader in Memory, System LSI and LCD technologies. We are currently looking for a Performance Architect (Intern) to
Performance Architect Remote Storage (Intern) Samsung Semiconductor, Inc. is a world leader in Memory, System LSI and LCD technologies. We are currently looking for a Performance Architect (Intern) to
Application-Level Debugging and Profiling: Gaps in the Tool Ecosystem. Dr Rosemary Francis, Ellexus
 Application-Level Debugging and Profiling: Gaps in the Tool Ecosystem Dr Rosemary Francis, Ellexus For years instruction-level debuggers and profilers have improved in leaps and bounds. Similarly, system-level
10.04.2008. Thomas Fahrig Senior Developer Hypervisor Team. Hypervisor Architecture Terminology Goals Basics Details
 Thomas Fahrig Senior Developer Hypervisor Team Hypervisor Architecture Terminology Goals Basics Details Scheduling Interval External Interrupt Handling Reserves, Weights and Caps Context Switch Waiting
Performance monitoring. in the GNU/Linux environment. Linux is like a wigwam - no Windows, no Gates, Apache inside!
 1 Performance monitoring in the GNU/Linux environment Linux is like a wigwam - no Windows, no Gates, Apache inside! 2 1 Post-conditions To be familiar with some performance-tuning options To be able to
PERFORMANCE TUNING ORACLE RAC ON LINUX
 PERFORMANCE TUNING ORACLE RAC ON LINUX By: Edward Whalen Performance Tuning Corporation INTRODUCTION Performance tuning is an integral part of the maintenance and administration of the Oracle database
Business Life Path - Red Hat, CFS roadmap
 The Kernel Report Vision 2007 edition Jonathan Corbet LWN.net corbet@lwn.net The Plan 1) A very brief history overview 2) The development process 3) Guesses about the future History 1 An extremely rushed
Large-scale performance monitoring framework for cloud monitoring. Live Trace Reading and Processing
 Large-scale performance monitoring framework for cloud monitoring Live Trace Reading and Processing Julien Desfossez Michel Dagenais May 2014 École Polytechnique de Montreal Live Trace Reading Read the
TELE 301 Network Management
 TELE 301 Network Management Lecture 22: Diagnostics & Ethics Haibo Zhang Computer Science, University of Otago TELE301 Lecture 22: Diagnostics & Ethics 1 Fault Management Fault management It means preventing,
Red Hat Linux Internals
 Red Hat Linux Internals Learn how the Linux kernel functions and start developing modules. Red Hat Linux internals teaches you all the fundamental requirements necessary to understand and start developing
Effective Performance Tuning Oracle Applications
 Effective Performance Tuning Oracle Applications Target Company profile Invantive Why? General hints Case Pointers and Tools Target Introduction into performance tuning Oracle Applications. Interactive
Embedded Linux Platform Developer
 Embedded Linux Platform Developer Course description Advanced training program on Embedded Linux platform development with comprehensive coverage on target board bring up, Embedded Linux porting, Linux
PERFORMANCE TUNING FOR PEOPLESOFT APPLICATIONS
 PERFORMANCE TUNING FOR PEOPLESOFT APPLICATIONS 1.Introduction: It is a widely known fact that 80% of performance problems are a direct result of the to poor performance, such as server configuration, resource
Performance Monitoring in the Linux Kernel Davidlohr Bueso
 Performance Monitoring in the Linux Kernel Davidlohr Bueso SUSE Labs Setting Expectations This is not a kernel topic per-se. Most of this can also be applied to userland. Lots to cover, not enough time
Table of Contents. Introduction. Audience. At Course Completion. Prerequisites
 Table of Contents Introduction Audience At Course Completion Prerequisites Certified Professional Exams Student Materials Course Outline Introduction This in-depth, 5-day course helps students acquire
Monitoring MySQL. Kristian Köhntopp
 Monitoring MySQL Kristian Köhntopp I am... Kristian Köhntopp Database architecture at a small travel agency in Amsterdam In previous lives: MySQL, web.de, NetUSE, MMC Kiel, PHP, PHPLIB, various FAQs and
Do it Yourself System Administration
 Do it Yourself System Administration Due to a heavy call volume, we are unable to answer your call at this time. Please remain on the line as calls will be answered in the order they were received. We
RTOS Debugger for ecos
 RTOS Debugger for ecos TRACE32 Online Help TRACE32 Directory TRACE32 Index TRACE32 Documents... RTOS Debugger... RTOS Debugger for ecos... 1 Overview... 2 Brief Overview of Documents for New Users... 3
Advanced Techniques with Newton. Gerald Ragghianti Advanced Newton workshop Sept. 22, 2011
 Advanced Techniques with Newton Gerald Ragghianti Advanced Newton workshop Sept. 22, 2011 Workshop Goals Gain independence Executing your work Finding Information Fixing Problems Optimizing Effectiveness
NVIDIA Tools For Profiling And Monitoring. David Goodwin
 NVIDIA Tools For Profiling And Monitoring David Goodwin Outline CUDA Profiling and Monitoring Libraries Tools Technologies Directions CScADS Summer 2012 Workshop on Performance Tools for Extreme Scale
GLS250 "Enterprise Linux Systems Administration"
 GLS250 "Enterprise Linux Systems Administration" Intended for students already comfortable with working in the Unix environment, this in-depth course helps students acquire the variety of skills needed
Java Troubleshooting and Performance
 Java Troubleshooting and Performance Margus Pala Java Fundamentals 08.12.2014 Agenda Debugger Thread dumps Memory dumps Crash dumps Tools/profilers Rules of (performance) optimization 1. Don't optimize
CIT 668: System Architecture. Performance Testing
 CIT 668: System Architecture Performance Testing Topics 1. What is performance testing? 2. Performance-testing activities 3. UNIX monitoring tools What is performance testing? Performance testing is a
Also on the Performance tab, you will find a button labeled Resource Monitor. You can invoke Resource Monitor for additional analysis of the system.
 1348 CHAPTER 33 Logging and Debugging Monitoring Performance The Performance tab enables you to view the CPU and physical memory usage in graphical form. This information is especially useful when you
High Performance Computing in Aachen
 High Performance Computing in Aachen Christian Iwainsky iwainsky@rz.rwth-aachen.de Center for Computing and Communication RWTH Aachen University Produktivitätstools unter Linux Sep 16, RWTH Aachen University
Red Hat Linux Administration II Installation, Configuration, Software and Troubleshooting
 Course ID RHL200 Red Hat Linux Administration II Installation, Configuration, Software and Troubleshooting Course Description Students will experience added understanding of configuration issues of disks,
Operating System and Process Monitoring Tools
 http://www.cse.wustl.edu/~jain/cse567-06/ftp/os_monitors/index.html 1 of 12 Operating System and Process Monitoring Tools Arik Brooks, awb1@wustl.edu Abstract: Monitoring the performance of operating systems
A JIT Compiler for Android s Dalvik VM. Ben Cheng, Bill Buzbee May 2010
 A JIT Compiler for Android s Dalvik VM Ben Cheng, Bill Buzbee May 2010 Overview View live session notes and ask questions on Google Wave: http://bit.ly/bizjnf Dalvik Environment Trace vs. Method Granularity
Chapter 2 System Structures
 Chapter 2 System Structures Operating-System Structures Goals: Provide a way to understand an operating systems Services Interface System Components The type of system desired is the basis for choices
Linux Security Ideas and Tips
 Linux Security Ideas and Tips Hugh Brown Sr. Systems Administrator ITS Enterprise Infrastructure University of Iowa October 8, 2014 Hugh Brown (University of Iowa) Linux Security Ideas and Tips October
Monitoring, Tracing, Debugging (Under Construction)
") Monitoring, Tracing, Debugging (Under Construction) I was already tempted to drop this topic from my lecture on operating systems when I found Stephan Siemen's article "Top Speed" in Linux World 10/2003.
Monitoring, Tracing, Debugging (Under Construction) I was already tempted to drop this topic from my lecture on operating systems when I found Stephan Siemen's article "Top Speed" in Linux World 10/2003.
Debugging Java performance problems. Ryan Matteson matty91@gmail.com http://prefetch.net
 Debugging Java performance problems Ryan Matteson matty91@gmail.com http://prefetch.net Overview Tonight I am going to discuss Java performance, and how opensource tools can be used to debug performance
Network Monitoring. Sebastian Büttrich, sebastian@less.dk NSRC / IT University of Copenhagen Last edit: February 2012, ICTP Trieste
 Network Monitoring Sebastian Büttrich, sebastian@less.dk NSRC / IT University of Copenhagen Last edit: February 2012, ICTP Trieste http://creativecommons.org/licenses/by-nc-sa/3.0/ Agenda What is network
A Brief. Introduction. of MG-SOFT s SNMP Network Management Products. Document Version 1.3, published in June, 2008
 A Brief Introduction of MG-SOFT s SNMP Network Management Products Document Version 1.3, published in June, 2008 MG-SOFT s SNMP Products Overview SNMP Management Products MIB Browser Pro. for Windows and
Example of Standard API
 16 Example of Standard API System Call Implementation Typically, a number associated with each system call System call interface maintains a table indexed according to these numbers The system call interface
GL254 - RED HAT ENTERPRISE LINUX SYSTEMS ADMINISTRATION III
 QWERTYUIOP{ GL254 - RED HAT ENTERPRISE LINUX SYSTEMS ADMINISTRATION III This GL254 course is designed to follow an identical set of topics as the Red Hat RH254, RH255 RHCE exam prep courses with the added
Overview. Open source toolchains. Buildroot features. Development process
 Overview Open source toolchains Buildroot features Development process 1 Tools in development process toolchain cross-compiler assembler & linker (filesystem) image generator boot loader / image writer
Delivering Quality in Software Performance and Scalability Testing
 Delivering Quality in Software Performance and Scalability Testing Abstract Khun Ban, Robert Scott, Kingsum Chow, and Huijun Yan Software and Services Group, Intel Corporation {khun.ban, robert.l.scott,
Oracle Linux 7: System Administration Ed 1 NEW
 Oracle University Contact Us: Local: 1800 103 4775 Intl: +91 80 40291196 Oracle Linux 7: System Administration Ed 1 NEW Duration: 5 Days What you will learn The Oracle Linux 7: System Administration training
Host Hardening. OS Vulnerability test. CERT Report on systems vulnerabilities. (March 21, 2011)
") Host Hardening (March 21, 2011) Abdou Illia Spring 2011 CERT Report on systems vulnerabilities Source: CERT Report @ http://www.kb.cert.org/vuls/bymetric 2 OS Vulnerability test Source: http://www.omninerd.com/articles/2006_operating_system_vulnerabilit
Host Hardening (March 21, 2011) Abdou Illia Spring 2011 CERT Report on systems vulnerabilities Source: CERT Report @ http://www.kb.cert.org/vuls/bymetric 2 OS Vulnerability test Source: http://www.omninerd.com/articles/2006_operating_system_vulnerabilit
4.1 Measurement Techniques. 156 Time Performance
 156 Time Performance } printf("%s %ld bytes in %.1f seconds", direction, amount, delta); printf(" [%.0f bits/sec]", (amount*8.)/delta); On the implementation front, when you consider alternatives, you
Virtualization in Linux
 Virtualization in Linux Kirill Kolyshkin September 1, 2006 Abstract Three main virtualization approaches emulation, paravirtualization, and operating system-level virtualization are covered,
Software Tracing of Embedded Linux Systems using LTTng and Tracealyzer. Dr. Johan Kraft, Percepio AB
 Software Tracing of Embedded Linux Systems using LTTng and Tracealyzer Dr. Johan Kraft, Percepio AB Debugging embedded software can be a challenging, time-consuming and unpredictable factor in development
HeapStats: Your Dependable Helper for Java Applications, from Development to Operation
 : Technologies for Promoting Use of Open Source Software that Contribute to Reducing TCO of IT Platform HeapStats: Your Dependable Helper for Java Applications, from Development to Operation Shinji Takao,
Zing Vision. Answering your toughest production Java performance questions
 Zing Vision Answering your toughest production Java performance questions Outline What is Zing Vision? Where does Zing Vision fit in your Java environment? Key features How it works Using ZVRobot Q & A
Why Nagios and Server Monitoring Are Failing Modern Apps
 An AppDynamics Business White Paper Server monitoring is an important part of any data center monitoring architecture, but too often it becomes a crutch and a deterrent to successfully building out a holistic
<Insert Picture Here> An Experimental Model to Analyze OpenMP Applications for System Utilization
 An Experimental Model to Analyze OpenMP Applications for System Utilization Mark Woodyard Principal Software Engineer 1 The following is an overview of a research project. It is intended
ntopng: Realtime Network Traffic View
 ntopng: Realtime Network Traffic View Luca Deri 3/28/14 1 ntop in 1998 In 1998, the original ntop has been created. Available for Unix and Windows under GPL. Contrary to many tools available
System-wide Performance Analysis for Virtualization
 Portland State University PDXScholar Dissertations and Theses Dissertations and Theses Spring 6-13-2014 System-wide Performance Analysis for Virtualization Deron Eugene Jensen Portland State University
Get quick control over your Linux server with server commands
 Get quick control over your Linux server with server commands by Jack Wallen Linux is a powerful environment for both the desktop and server: Both systems have matured so any action can be managed with
Proposed Scalability and Performance Roadmap. Ken Rozendal IBM Fall 2000
 Proposed Scalability and Performance Roadmap Ken Rozendal IBM Fall 2000 General Issues Performance work needs to be driven by benchmark analysis. There are three aspects of performance to be addressed:
An Oracle White Paper September 2013. Advanced Java Diagnostics and Monitoring Without Performance Overhead
 An Oracle White Paper September 2013 Advanced Java Diagnostics and Monitoring Without Performance Overhead Introduction... 1 Non-Intrusive Profiling and Diagnostics... 2 JMX Console... 2 Java Flight Recorder...
Khóa học Enterprise Linux System Administration
 Khóa học chuyên sâu vào công việc cài đặt, quản lý và bảo trì hệ thống linux bao gồm cả máy chủ và máy trạm. Nội dung chủ yếu gồm cài đăt, quản trị người dùng, quản trị file, quotas, FACLs, RAID and LVM;
Server Manager Performance Monitor. Server Manager Diagnostics Page. . Information. . Audit Success. . Audit Failure
 Server Manager Diagnostics Page 653. Information. Audit Success. Audit Failure The view shows the total number of events in the last hour, 24 hours, 7 days, and the total. Each of these nodes can be expanded
Memory Access Control in Multiprocessor for Real-time Systems with Mixed Criticality
 Memory Access Control in Multiprocessor for Real-time Systems with Mixed Criticality Heechul Yun +, Gang Yao +, Rodolfo Pellizzoni *, Marco Caccamo +, Lui Sha + University of Illinois at Urbana and Champaign
Automated Load Testing for SIP Applications
 Automated Load Testing for SIP Applications Serge Kruppa Director of Engineering Astricon 2008, Glendale AZ About LiveVox Leading provider of hosted VoIP dialing solutions, with integrated ACD and IVR,
Taming Operations in the Apache Hadoop Ecosystem. Jon Hsieh, jon@cloudera.com Kate Ting, kate@cloudera.com USENIX LISA 14 Nov 14, 2014
 Taming Operations in the Apache Hadoop Ecosystem Jon Hsieh, jon@cloudera.com Kate Ting, kate@cloudera.com USENIX LISA 14 Nov 14, 2014 $ whoami Jon Hsieh, Cloudera Software engineer HBase Tech Lead Apache
Introducing the IBM Software Development Kit for PowerLinux
 Introducing the IBM Software Development Kit for PowerLinux Wainer S. Moschetta IBM, PowerLinux SDK Team Leader wainersm@br.ibm.com 1 2009 IBM Acknowledgments The information in this presentation was created
MCTS Guide to Microsoft Windows 7. Chapter 10 Performance Tuning
 MCTS Guide to Microsoft Windows 7 Chapter 10 Performance Tuning Objectives Identify several key performance enhancements Describe performance tuning concepts Use Performance Monitor Use Task Manager Understand
CS 147: Computer Systems Performance Analysis
 CS 147: Computer Systems Performance Analysis CS 147: Computer Systems Performance Analysis 1 / 39 Overview Overview Overview What is a Workload? Instruction Workloads Synthetic Workloads Exercisers and