Public Transportation on the Move in Rural America. Dennis M. Brown Regional Economist
|
|
|
- Isaac Bruce
- 8 years ago
- Views:
Transcription
1 Public Transportation on the Move in Rural America by Dennis M. Brown Regional Economist Economic Research Service U.S. Dept. of Agriculture 1800 M St., N.W. Room S2092 Washington, DC Tel: (202) ; Fax: (202) dennisb@ers.usda.gov The views expressed in this paper are those of the author, and do not necessarily represent the position of the Department of Agriculture.

2 Introduction Public transportation offers mobility for residents of rural America, particularly people without cars, who tend to be lower-income. Overall usage of transit services in rural America is not high, with only about a half of one percent of nonmetro residents using it as their primary means of transportation to work (U.S. Bureau of the Census, 2000). However, in many smaller communities with both longer distances between built-up areas and low population densities, transit can help bridge the spatial divide between people and jobs, services, and training opportunities (fig. 1). In recent years, the importance of public transportation in rural areas has been demonstrated by the key role it has played in the implementation of welfare reform (Stommes, Brown, and Houston, 2002). Federal programs for surface transportation -- public transportation, as well as highways and highway safety -- are up for reauthorization by Congress in Last authorized in 1998 under the Transportation Equity Act for the 21st Century (TEA-21), the legislation provided $1.18 billion over for rural public transportation, with an additional $456 million available (in both rural and urban areas) for specialized transit needs such as transporting elderly residents and individuals with disabilities. Reauthorization represents an opportunity to examine issues of importance surrounding the public transportation needs of rural America. What is Rural Public Transportation?

3 Public transportation is available in approximately sixty percent of all rural counties nationwide, for a total of about 1,200 systems (Stommes, Brown, and Houston, 2002). About two-thirds of rural systems operate in single counties or are city/town in scope; only about one out of four rural transit providers operate in a multi-county area. About 60 percent of rural transit providers are public bodies, and roughly a third are nonprofit agencies; only five percent are private companies or tribal entities. Many rural transit systems are funded under Section 5311 of the Federal Transit Act, a formula grant program that authorizes both capital and operating assistance grants to public transit systems in areas with populations less than 50,000. Such 5311 transit systems are county-based and tend to be found in the more populated rural areas. Few are found in the most rural, isolated areas. These systems range in size from 1 to over 50 vehicles. According to a recent survey, from 1994 to 1999, the average fleet size in rural areas increased by 60 percent, with ridership increasing by 62 percent (Stommes and Brown, 2002). Specialized transportation services for the elderly and persons with disabilities are available under the Section 5310 program. The program provides capital assistance (not operating expenses) to States, which, in turn, distribute the funding in both rural and urban areas to nonprofit organizations or lead agencies in coordinated transportation programs. There are approximately 3, systems throughout the country.

4 Human service agencies also often provide public transportation in rural communities. The role of these entities varies, with some agencies engaging in the purchase of vehicles and hiring of drivers, and others contracting with rural transit operators. It is difficult to measure the magnitude of these services since transportation costs are often bundled with the overall cost of providing service to the client. Meeting the public transportation needs of rural residents often requires effective coordination of transit services among these different agencies and programs. Coordinating the many funding sources and reporting requirements unique to each federally funded program has given rise to the Federal Coordinating Council for Access and Mobility (CCAM), which brings together relevant Federal agencies dealing with public transportation (including the Department of Transportation and the Department of Health and Human Services). CCAM provides policy guidance on coordinating transit across different Federal programs. The Federal Government encourages development of new public transportation services and expansion of existing routes for low-income, transit dependent individuals seeking access to jobs through the Job Access and Reverse Commute (JARC) grant program (Stommes, Brown, and Houston, 2002). Created by Congress in 1998, JARC was established to move recipients of TANF to employment, training, and other support services. The program, which complements individualized transportation assistance provided by human service agencies, authorized $750 million through 2003, with 20 percent of funding originally designated for rural, non-urbanized areas.

5 Transit and Rural Areas Public transportation enhances local rural economic growth in many ways. For example, it can increase the local customer base for a range of services, including shopping malls, medical facilities, and other transportation services. Residents interested in attending community colleges or other local educational facilities may gain access to such training opportunities with transit service. And, rural locations with amenities may gain potential tourists who otherwise would not have visited such communities without transit. Especially in those communities whose residents commute to adjacent metropolitan areas, transit can reduce congestion, thereby enhancing the quality of life. Availability of public transportation may also increase the ability of human service agencies to serve individuals on public assistance and transport low-income residents to jobs, training opportunities, and other support services. Rural transit is also cost efficient. A recent study estimated average benefit/cost ratios of rural transit as approximately 3.1 to 1 -- for every additional dollar spent on transit (typically by a transit agency), rural areas derive about 3.1 dollars in benefits (Burkhardt, Hedrick, and McGavock, 1998). Rural transit systems that significantly expanded access to employment facilities were found to have among the highest benefit/cost ratios, as were systems that fostered independent living and those that provided access to critical medical services (such as dialysis treatment).

6 The major arguments in favor of providing Federal or State aid to rural transit involve improving economic efficiency and reducing inequalities. Improving Economic Efficiency In theory, Federal or State transit investments offset anticipated underinvestment by localities, human service agencies, and the private sector in local transit systems. This anticipated underinvestment partly results from a failure to consider non-local (external) benefits when making investments in public services, such as local transit systems. For example, when a transit system allows an unemployed individual to find and keep a job, this can save the Federal Government and the States significant costs by reducing payments for such programs as unemployment compensation, Food Stamps, Temporary Assistance for Needy Families (TANF), and/or Medicaid. And, when an elderly rural resident who is unable to drive uses transit to obtain health services, this promotes preventive health care for rural seniors, thereby keeping down overall health care costs. In rural places with relatively high per capita transit capital and maintenance costs, such as in sparsely populated locations with large land areas that require lengthy routes for transit vehicles, local demand for transit may be insufficient to pay for transit system costs without Federal or State subsidies. Economic efficiency is also enhanced when transit is used as a means to alleviate some of the problems associated with rapid nonmetro growth (Brown and Fazzone, 1998). First, nonmetro rapid-growth areas often suffer from labor shortages. Transit can provide

7 businesses with an expanded supply of workers by providing transportation to underemployed or unemployed individuals who lack cars. Second, many rapid-growth places have attracted large numbers of retirees in recent years. Public transportation can offer elderly residents access to vital human services, such as health care, educational opportunities, and a wide range of recreational activities. It can also help alleviate many of the problems associated with overcrowding, such as traffic congestion, sprawl, pollution, and the deterioration of area roads, and it can help preserve the rural sense of place. From , about one in six nonmetro counties had rapid population growth (growing at a rate that was at least double the national nonmetro rate of 10.3 percent during the 1990 s) (U.S. Bureau of the Census, 2000). Many of these high-growth nonmetro counties -- which are largely located in the West, the Northeast, the Upper Midwest, and parts of the South -- have important recreation functions. In 2002, approximately one-third of the 365 fastest growing nonmetro counties were classified as having significant recreation functions (using the ERS recreation county typology) (Johnson and Beale, 2002). Recreation county types include Midwest Lake Second Homes (commonly found in Michigan and Minnesota), Coastal Ocean Resorts (Delmarva Peninsula and South Carolina), Ski Resorts (Colorado, Idaho, and Utah), Reservoir Lakes (mainly found in Missouri, Oklahoma, and Texas), and Casinos (Nevada and Colorado). With high growth, some of these recreation-based nonmetro counties face labor shortages. Transit plays an important role by providing local recreation-based businesses

8 with an expanded supply of low-skilled workers from surrounding counties. In addition to assisting businesses meet their labor demands, transit also helps workers find jobs. While such jobs may be low-wage in nature, they serve as an important source of income to those who otherwise would likely face limited employment alternatives. Also, as many retirees have been drawn to these high-amenity areas, public transportation has played an important role by offering elderly residents access to human services such as health care, educational opportunities, and shopping. Although such communities often struggle with the negative side effects associated with rapid growth, a fast growing population also can help to reduce the typically higher per-capita costs associated with rural public transportation, making it more economically viable for such areas. Some of these high-growth nonmetro recreation counties are among the highest users of public transportation in rural America. For example, in Colorado, Eagle County (home of Vail) and Summit County (where Breckenridge and Copper Mountain ski resorts are located) both had high rates of population growth during the 1990 s and they rely relatively heavily on public transportation (with more than 5 percent of their workers using transit as a primary means of transportation to work). Other nonmetro counties with high growth and relatively high transit use are Dukes, Massachusetts (home of Martha s Vineyard); Worcester, Maryland (Ocean City); and Beaufort, South Carolina (Hilton Head Island).

9 The case of Eagle County, Colorado is illustrative. Located about 100 miles to the west of Denver, Eagle County is perhaps best known as the home of Vail and other popular ski resorts. Between , Eagle County s population grew 90 percent, the fifth fastest rate of growth among all nonmetro counties nationwide. In recent years, rapid growth from tourism has increased the local tax base and reduced unemployment. Median household income was more than 130 percent above the State median in 1999, the second highest ratio for any county in Colorado. While police and fire protection services and the school system are well-funded, rapid population growth has led to increased traffic congestion. Public transportation has been important in Eagle, with most demand coming from low-income workers and tourists. During the 1990 s, the county increased its sales tax, partly to obtain more funding to expand transit. The town of Vail currently provides free year-round bus service throughout the local area the largest free transportation service in the Nation. As counties such as Eagle, and other high-amenity areas like it, have faced pressures from recreation-related growth in recent years, they have turned to transit as a means to alleviate some of their problems. Although they are among the wealthiest nonmetro counties in the Nation, and can afford public transportation systems on their own, local officials have recognized that transit is an important tool for making their local recreation-based economies run more efficiently, bringing in workers, reducing congestion, and providing mobility options for residents. Reducing Inequalities

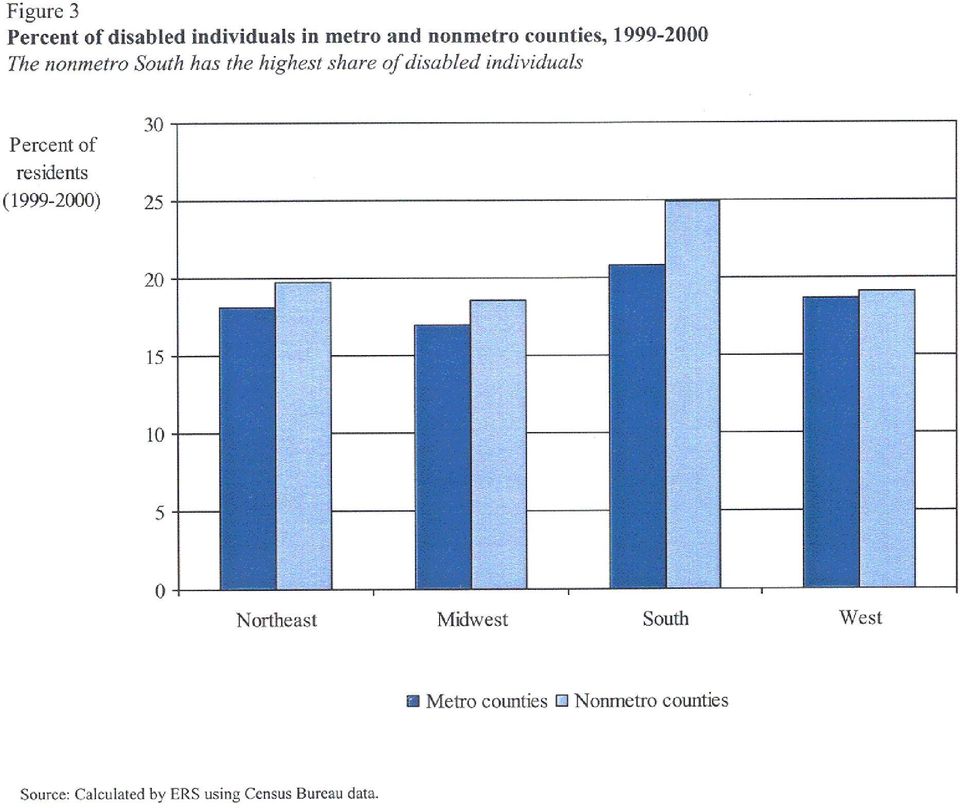
10 Another argument for providing Federal or State aid for rural public transportation is that transit can reduce social and economic inequalities by enhancing mobility for residents -- many of whom are poor, disabled, and/or elderly -- who lack access to cars. Furthermore, given the Federal commitment to welfare reform, it can be argued that the Federal Government should help the States and localities provide adequate transportation services to individuals who need assistance in finding jobs. Compared to metro areas, nonmetro counties have higher levels of poverty, and have larger shares of disabled and elderly residents (U.S. Bureau of the Census, 2000) (fig. 2). In 1999, approximately 7.9 million people in nonmetro areas lived in poverty, representing about 14.6 percent of the rural population, compared to a metro poverty rate of 11.8 percent (26 million individuals). And, 11 million individuals (excluding those under 5 years old) in nonmetro areas were classified as disabled in 2000, accounting for 21.5 percent of rural America, compared to a disability rate of 18.8 percent in metro areas (38.8 million disabled individuals). Nonmetro areas had 7.8 million elderly residents (at least 65 years of age) in 2000, accounting for 13.8 percent of the nonmetro population, compared to an elderly rate of 11 percent for metro counties (25.6 million elderly metro residents). These individuals, in particular, potentially benefit from access to public transportation. The highest concentrations of the rural poor are primarily in the South, the Southwest, the Upper Plains, and Alaska. The nonmetro disabled are clustered mainly in the South, with

11 heavy concentrations in Appalachia (fig. 3). And, the highest concentrations of elderly residents in nonmetro areas are primarily in the Plains and parts of the Midwest, with significant clusters also located on the West Coast, the Southwest, the South, and the Northeast. In areas suffering from high unemployment, vulnerable populations have a particular need for public transportation because their options for personal mobility may be severely limited. In the second quarter of 2003, the nonmetro seasonally adjusted unemployment rate was 5.9 percent, compared to 6.1 percent for metro counties. The highest rates of nonmetro unemployment are in parts of the South, the Southwest, the Pacific Northwest, the Upper Great Lakes, the Upper Plains, the Northeast, and Alaska. Census data reveal that the vehicle ownership rate is higher in rural America than in metro areas, with 92.7 percent of rural households having access to a car in 2000, compared to 88.9 percent for metro counties (U.S. Bureau of the Census, 2000). Still, more than 1.6 million rural households do not have access to a car. The proportion of rural households without access to automobiles is highest in the South, the Southwest, and parts of Alaska (fig. 4). Previous research has found that nearly 40 percent of all rural counties are not served at all by transit services, while another 28 percent have only limited service (defined as having less than 25 trips taken each year per carless household) (Stommes, Brown, and Houston, 2002). And, while the vast majority of rural households owns a car, poor rural

12 households are three times more likely than the non-poor to lack a vehicle (Brown and Stommes, 2004). For carless rural households, few good options for transportation exist, especially in more sparsely populated nonmetro areas, which typically have little transit service. Counties with smaller metropolitan populations and completely rural areas are often less likely to be served by a federally-assisted public transportation program. Hence, public transportation can help to bridge the mobility divide existing for these communities and the individuals that reside there, opening up access to employment, training, and social services. Tunica County, Mississippi is a case in point. This rural Mississippi Delta county, which has a high concentration of poverty, many disabled individuals, many carless households, and high unemployment, is home to one of the largest casinos in the country. The local casino industry s development in the mid-1990 s led to sharply increased local land prices and higher infrastructure costs, factors that raised the costs of housing there. Consequently, the casino industry found it difficult to hire sufficient numbers of workers in the local area, even though it is economically challenged. But with nearly 16 percent of the local population lacking access to a vehicle -- more than double the national nonmetro rate of non-car ownership -- the casino industry determined that transit could help to bring in workers from the local area as well as from surrounding counties up to 70 miles away. Additionally, community officials found that transit helped to reduce traffic congestion around casinos. Summary

13 This report explores the usage of public transportation services in nonmetro America. The discussion highlights that some rapid-growth nonmetro communities have been relatively heavy users of public transportation services, which tends to promote economic efficiency and growth, while mitigating the ill-effects of sprawl. Poorer nonmetro communities, and/or those with large concentrations of other transit-dependent individuals (the disabled, the elderly, carless individuals) and areas suffering from high levels of unemployment can also benefit from transit because it promotes economic wellbeing and reduces economic and social inequalities. However, most rural places do not have significant access to transit. With public transportation programs up for reauthorization this year, rural areas have an important stake in the outcome of the legislative debate. Given the role that transit can play in bringing about economic efficiency and expanding social equity in the Nation s nonmetro areas, many of which are characterized by long distances and low population densities, reauthorization represents a unique opportunity to revisit the special transportation needs of rural communities.
 and areas suffering from high levels of")
14 References Brown, Dennis M., and Jon Fazzone "How Rapid Nonmetro Growth Causes Problems in Rural Counties: The Case of Public Transportation," Small Town, Vol. 28, No. 4, pp Brown, Dennis M., and Eileen S. Stommes Rural Governments Face Public Transportation Challenges and Opportunities, Amber Waves, Vol. 2, Issue 1, February. (Web site: Burkhardt, Jon E., James L. Hedrick, and Adam T. McGavock Assessment of the Economic Impacts of Rural Public Transportation, Transit Cooperative Research Program, Report 34, Transportation Research Board, National Research Council, National Academy Press, Washington, DC. (Web site: Dewees, Sarah The Drive to Work: Transportation Issues and Welfare Reform in Rural Areas, Information Brief, A Special Series on Welfare Reform in the South, Southern Rural Development Center, No. 5, November. (Web site: Dewees, Sarah Transportation in Rural Communities: Strategies for Serving Welfare Participants and Low-Income Individuals, Rural Welfare Issue Brief, Office of Planning, Research and Evaluation, Administration for Children and Families, U.S. Department of Health and Human Services, April. (Web site: Economic Research Service. U.S. Department of Agriculture. Rural Transportation briefing room. (Web site: Johnson, Kenneth M., and Calvin L. Beale Nonmetro Recreation Counties: Their Identification and Rapid Growth, Rural America, Vol. 17, No. 4, Winter: (Web site: Stommes, Eileen S., and Dennis M. Brown Transportation in Rural America: Issues for the 21st Century, Rural America, Vol. 16, No. 4, Winter: (Web site: Stommes, Eileen S., Dennis M. Brown, and Capree M. Houston Moving Rural Residents to Work: Lessons Learned from Implementation of Eight Job Access and Reverse Commute Projects. Federal Transit Administration. December. (Web site: U.S. Bureau of the Census Census of Population.

15

16

17
18

Recreation, Tourism, and Rural Well-Being
 United States Department of Agriculture Economic Research Report Number 7 A Report from the Economic Research Service Recreation, Tourism, and Rural Well-Being www.ers.usda.gov August 2005 Richard J. Reeder
Rural America At A Glance
 United States Department of Agriculture Rural America At A Glance 2014 Edition Overview While the U.S. economy is now in its sixth year of recovery from the Great Recession of 2007-09, its performance
Community and Public Transportation: Viable Transportation Options for Older Persons
 Community and Public Transportation: Viable Transportation Options for Older Persons Jane Hardin Community Transportation Association of America 1341 G Street, N.W. 10 th Floor Washington, D.C. 20005 Email:
Characteristics of State Funding for Public Transportation
 Characteristics of State Funding for Public Transportation The following report provides a summary of state transit funding for 50 states and the District of Columbia (DC). Information includes funding
Daily Travel by Persons with Low Income
 October 26, 1997 Daily Travel by Persons with Low Income Elaine Murakami Federal Highway Administration Washington, DC Jennifer Young University of Tennessee Knoxville, TN Contents reflect the views of
Counting for Dollars: Worcester, MA
 Counting for Dollars: Worcester, MA Federal Assistance Programs that Distributed Funds in the Worcester, MA Metropolitan Area on the Basis of Census-Related Statistics, Fiscal Year 2008 This table lists
States Can Adopt or Expand Earned Income Tax Credits to Build a Stronger Future Economy By Erica Williams
 Updated January 19, 2016 States Can Adopt or Expand Earned Income Tax Credits to Build a Stronger Future Economy By Erica Williams Twenty-six states plus the District of Columbia have enacted their own
By Chuck Marr, Bryann DaSilva, and Arloc Sherman
 820 First Street NE, Suite 510 Washington, DC 20002 Tel: 202-408-1080 Fax: 202-408-1056 center@cbpp.org www.cbpp.org Updated September 11, 2015 16 Million People Will Fall Into or Deeper Into Poverty if
FEDERAL GRANTS TO STATES AND LOCALITIES CUT DEEPLY IN FISCAL YEAR 2009 FEDERAL BUDGET By Iris J. Lav and Phillip Oliff
 820 First Street NE, Suite 510 Washington, DC 20002 Tel: 202-408-1080 Fax: 202-408-1056 center@cbpp.org www.cbpp.org February 4, 2008 FEDERAL GRANTS TO STATES AND LOCALITIES CUT DEEPLY IN FISCAL YEAR 2009
Between 1986 and 2010, homeowners and renters. A comparison of 25 years of consumer expenditures by homeowners and renters.
 U.S. BUREAU OF LABOR STATISTICS OCTOBER 2012 VOLUME 1 / NUMBER 15 A comparison of 25 years of consumer expenditures by homeowners and renters Author: Adam Reichenberger, Consumer Expenditure Survey Between
Brief 1 The State of North Carolina: Jobs, Poverty and Family. Jeannine Sato, Center for Child and Family Policy
 Brief 1 The State of North Carolina: Jobs, Poverty and Family Jeannine Sato, Center for Child and Family Policy The connection among jobs, poverty and family well-being is well established. Research shows
Chapter 3: Promoting Financial Self- Sufficiency
 Chapter 3: Promoting Financial Self- Sufficiency For most people, financial self-sufficiency is achieved through a combination of employment earnings and savings. Labor markets derived from the products
Counting for Dollars: Riverside County, California
 Counting for Dollars: Riverside County, California Federal Assistance Programs that Distributed Funds in Riverside County, California on the Basis of Census-Related Statistics, Fiscal Year 2008 This table
Counting for Dollars: Miami-Dade County, Florida
 Counting for Dollars: Miami-Dade County, Florida Federal Assistance Programs that Distributed Funds in Miami-Dade County, Florida on the Basis of Census-Related Statistics, Fiscal Year 2008 This table
Changes in the Cost of Medicare Prescription Drug Plans, 2007-2008
 Issue Brief November 2007 Changes in the Cost of Medicare Prescription Drug Plans, 2007-2008 BY JOSHUA LANIER AND DEAN BAKER* The average premium for Medicare Part D prescription drug plans rose by 24.5
The Economic Impact of Local Parks
 The Economic Impact of Local Parks An Examination of the Economic Impacts of Operations and Capital Spending on the United States Economy Executive Summary National Recreation and Park Assocation 1 Table
BUSINESS DEVELOPMENT OUTCOMES
 BUSINESS DEVELOPMENT OUTCOMES Small Business Ownership Description Total number of employer firms and self-employment in the state per 100 people in the labor force, 2003. Explanation Business ownership
#1: Unemployment benefits provide an important boost to the economy.
 The Economic Program January 2014 TO: Interested Parties FROM: Alicia Mazzara, Policy Advisor RE: Renew Emergency Unemployment Compensation: 4 Facts about Unemployment Benefits On December 28, Congress
Human Service - Understanding County populations
 The Geography of Need: Identifying Human Service Needs in Rural America June 2011 Colleen Heflin Kathleen Miller This work was supported by a grant from the Kresge Foundation The Geography of Need: Identifying
How does CDOT rank among state DOTs?
 1 Colorado Department of Spring 2014 How does CDOT rank among state DOTs? State transportation departments, the federal government and third-party groups use a variety of metrics to judge the performance
Center on Children and Families Working Paper 1. High Cost or High Opportunity Cost? Transportation and Family Economic Success
 Center on Children and Families Working Paper 1 High Cost or High Opportunity Cost? Transportation and Family Economic Success Margy Waller Abstract: Research evidence suggests that having a car is a worthwhile
Percent change. Rank Most expensive states Average expenditure Rank Least expensive states Average expenditure
 Page 1 of 7 Auto Insurance AAA s 2010 Your Driving Costs study found that the average cost to own and operate a sedan rose by 4.8 percent to $8,487 per year, compared with the previous year. Rising fuel,
Two miles per day may not seem like much, but do the math.
 February 2008 Chicago sgreen Dividend Joe Cortright jcortright@impresaconsulting.com Senior Policy Advisor, CEOs for Cities Chicago has placed an increasing emphasis on pursuing green policies in recent
Economic Impact and Variation in Costs to Provide Community Pharmacy Services
 Economic Impact and Variation in Costs to Provide Community Pharmacy Services Todd Brown MHP, R.Ph. Associate Clinical Specialist and Vice Chair Department of Pharmacy Practice School of Pharmacy Northeastern
Counting for Dollars: Palm Beach County, Florida
 Counting for Dollars: Palm Beach County, Florida Federal Assistance Programs that Distributed Funds in Palm Beach County, Florida on the Basis of Census-Related Statistics, Fiscal Year 2008 This table
Counting for Dollars: Virginia Beach, VA-NC
 Counting for Dollars: Virginia Beach, VA-NC Federal Assistance Programs that Distributed Funds in the Virginia Beach-Norfolk- Newport News, VA-NC Metropolitan Area on the Basis of Census-Related Statistics,
Profile of Rural Health Insurance Coverage
 Profile of Rural Health Insurance Coverage A Chartbook R H R C Rural Health Research & Policy Centers Funded by the Federal Office of Rural Health Policy www.ruralhealthresearch.org UNIVERSITY OF SOUTHERN
The Economic Impact of Local Parks
 The Economic Impact of Local Parks An Examination of the Economic Impacts of Operations and Capital Spending on the United States Economy Executive Summary National Recreation and Park Association 1 Table
Changes in Self-Employment: 2010 to 2011
 Changes in Self-Employment: 2010 to 2011 American Community Survey Briefs By China Layne Issued January 2013 ACSBR/11-21 INTRODUCTION From December 2007 to June 2009, the United States experienced an economic
Profile of Rural Ambulance Services in Minnesota
 April 2003 Profile of Rural Ambulance Services in Minnesota Emergency services include a variety of medical services that supply essential prehospital care during crises. Much of the information presented
A Unique Approach to Improving Economic Conditions in States Experiencing Financial Hardships
 A Unique Approach to Improving Economic Conditions in States Experiencing Financial Hardships Jamye Long Delta State University Cooper Johnson Delta State University Sam Faught University of Tennessee
Demographic and Economic Profile. North Carolina. Updated June 2006
 Demographic and Economic Profile North Carolina Updated June 2006 Metro and Nonmetro Counties in North Carolina Based on the most recent listing of core based statistical areas by the Office of Management
December 1, 2010. the Ranks of the Uninsured in 2009, September 17, 2010, http://www.cbpp.org/cms/index.cfm?fa=view&id=3294.
 820 First Street NE, Suite 510 Washington, DC 20002 Tel: 202-408-1080 Fax: 202-408-1056 center@cbpp.org www.cbpp.org December 1, 2010 EMPLOYER-BASED HEALTH COVERAGE DECLINED SHARPLY OVER PAST DECADE Highlights
Medical Transportation. Transportation To and From a Medical Facility or Provider
 Medical Transportation : Today Overview of Medical Transportation Today and the Important Role played by Medicaid Rex Knowlton, CCTM Coordination Ambassador Regions 3 & 8 Executive Director Wheels of Wellness
Gas Tax Talk Leads Down the Right Road
 Advancing progressive policy change since 1997 FEBRUARY 2008 Gas Tax Talk Leads Down the Right Road By Mary E. Forsberg RESEARCH DIRECTOR In the wake of restructuring proposals made by Governor Corzine,
2009-10 STATE AND LOCAL GOVERNMENT TAX AND REVENUE RANKINGS. By Jacek Cianciara
 2009-10 STATE AND LOCAL GOVERNMENT TAX AND REVENUE RANKINGS By Jacek Cianciara Wisconsin Department of Revenue Division of Research and Policy December 12, 2012 TABLE OF CONTENTS Key Findings 3 Introduction
Strategies to Support Work and Reduce Poverty Eileen Trzcinski
 Strategies to Support Work and Reduce Poverty Eileen Trzcinski Overview of Low Income Working Families in Michigan 1998, the Michigan Budget and Tax Policy Project, an initiative of the Michigan League
Broadband Internet Service Helping Create a Rural Digital Economy
 VOLUME 7 ISSUE 3 Broadband Internet Service Helping Create a Rural Digital Economy 22 AMBER WAVES Peter Stenberg stenberg@ers.usda.gov Mitch Morehart morehart@ers.usda.gov John Cromartie jbc@ers.usda.gov
A Project of the ASU College of Public Programs Debra Friedman, Dean
 GREATER PHOENIX FORWARD Sustaining and Enhancing the Human-Services Infrastructure This section provided as an excerpt of the larger publication available at copp.asu.edu A Project of the ASU College of
NCHRP 8-84/Report 735: Long-Distance and Rural Transferable Parameters for Statewide Travel Forecasting Models
 NCHRP 8-84/Report 735: Long-Distance and Rural Transferable Parameters for Statewide Travel Forecasting Models presented to Atlanta Regional Commission Model Users Group Presented by Robert G. Schiffer,
Discussion Paper. New England migration trends by David Agrawal. New England Public Policy Center Discussion Paper 06-1 October 2006
 New England Public Policy Center Discussion Paper 06-1 October 2006 Discussion Paper New England migration trends by David Agrawal Revised October 30, 2006 federal reserve bank of boston TM New England
The Obama Administration and Community Health Centers
 The Obama Administration and Community Health Centers Community health centers are a critical source of health care for millions of Americans particularly those in underserved communities. Thanks primarily
Georgia s Ranking Among the States: Budget, Taxes, and Other Indicators
 THE CENTER FOR STATE AND LOCAL FINANCE JUNE 2015 Georgia s Ranking Among the States: Budget, Taxes, and Other Indicators IN COLLABORATION WITH ABOUT THE CENTER FOR STATE AND LOCAL FINANCE The (CSLF) mission
Counting for Dollars: Cape Coral, FL
 Counting for Dollars: Cape Coral, FL Federal Assistance Programs that Distributed Funds in the Cape Coral-Fort Myers, FL Metropolitan Area on the Basis of Census-Related Statistics, Fiscal Year 2008 This
Barnstable County, MA: Populations of The Fifteen Towns of Cape Cod
 Cape Cod Bay Barnstable County, MA (Cape Cod) Barnstable County, MA: Populations of The Fifteen Towns of Cape Cod Town Census 2000 Population 1990 Census Population Recent Growth (1990 2000) Bourne 18,721
Traffic Safety Facts. Laws. Motorcycle Helmet Use Laws. Inside This Issue. Key Facts. April 2004
 Traffic Safety Facts Laws April 2004 Motorcycle Helmet Use Laws Motorcycle helmets provide the best protection from head injury for motorcyclists involved in traffic crashes. The passage of helmet use
DRAFT. Martha's Vineyard Coordinated Human Services Transportation Plan
 DRAFT Martha s Vineyard Transit Authority (VTA) and Martha s Vineyard Commission (MVC) Martha's Vineyard Coordinated Human Services Transportation Plan January 2015 Martha s Vineyard Coordinated Human
Counting for Dollars: Denver County, Colorado
 Counting for Dollars: Denver County, Colorado Federal Assistance Programs that Distributed Funds in Denver County, Colorado on the Basis of Census-Related Statistics, Fiscal Year 2008 This table lists
OPPORTUNITY IN AMERICA 2011-2015
 OPPORTUNITY IN AMERICA 2011-2015 5 YEARS OF THE OPPORTUNITY INDEX TABLE OF CONTENTS 03 04-05 06-07 08 09 10-25 FIVE-YEAR LANDSCAPE PATHS OF OPPORTUNITY STATE RANKINGS NATIONAL TRENDS INDEX INDICATORS INDEX
Where Will Rural Baby Boomers Live in Their Later Years?
 Rural Minnesota Journal 2012 Who Lives in Rural Minnesota: A Region in Transition Center for Rural Policy and Development www.ruralmn.org/rmj/ Where Will Rural Baby Boomers Live in Their Later Years? LaRhae
An Equity Profile of the Kansas City Region. Summary. Overview. The Equity Indicators Framework. central to the region s economic success now and
 An Equity Profile of the Kansas City Region PolicyLink and PERE An Equity Profile of the Kansas City Region Summary Overview Across the country, regional planning organizations, community organizations
,2 2 2009 MAY. oß.vi.. Daniel R. Levinson ~ ~ .~~.vi...
 (?.,,,-l'''4,,"vicø -r..'..ll'..410 DEPARTMENT OF HEALTH &. HUMAN SERVICES Office of Inspector General Washington, D.C. 20201 MAY,2 2 2009 TO: James Scanlon Acting Assistant Secretary for Planning Planing
Financing Public Higher Education
 E D U C A T I O N A N D T R A I N I NG RE S E A RCH RE P O R T Financing Public Higher Education Variation across States Sandy Baum November 2015 Martha Johnson AB O U T T H E U R BA N I N S T I T U TE
Transportation Issues in Welfare Reform Background Information
 Transportation Issues in Welfare Reform Background Information Demetra Smith Nightingale This paper was prepared for the U.S. Department of Labor, Employment and Training Administration, under Contract
Pro-Growth Tax Policy: Why Small Businesses Need Individual Tax Reform
 Statement for the Record Of Dave Koenig, Vice President, Tax and Profitability, National Restaurant Association For The Hearing On Pro-Growth Tax Policy: Why Small Businesses Need Individual Tax Reform
EMBARGOED UNTIL 6:00 AM ET WEDNESDAY, NOVEMBER 30, 2011
 A State-by-State Look at the President s Payroll Tax Cuts for Middle-Class Families An Analysis by the U.S. Department of the Treasury s Office of Tax Policy The President signed into law a 2 percentage
COUNTY PROFILE lauderdale county
 COUNTY PROFILE lauderdale county population households and housing economy education and poverty transporation data sources prepared by Memphis Area Association of Governments preface The purpose of the
ONE CALL-ONE CLICK Profiles TRI COUNTY COMMUNITY ACTION PROGRAM, NH
 BACKGROUND The Tri-County Community Action Program (TCCAP), operator of North Country Transit (NCT), provides transportation one-call service as part of a coordinated public transportation program in New
STATE DATA CENTER. District of Columbia MONTHLY BRIEF
 District of Columbia STATE DATA CENTER MONTHLY BRIEF N o v e m b e r 2 0 1 2 District Residents Health Insurance Coverage 2000-2010 By Minwuyelet Azimeraw Joy Phillips, Ph.D. This report is based on data
Health Coverage for the Hispanic Population Today and Under the Affordable Care Act
 on on medicaid and and the the uninsured Health Coverage for the Population Today and Under the Affordable Care Act April 2013 Over 50 million s currently live in the United States, comprising 17 percent
Legislative Alert! Advocacy Updates from Colorado and Washington D.C.
 Legislative Alert! Advocacy Updates from Colorado and Washington D.C. NAN MOREHEAD Director of Public Policy Denver Department of Human Services MEG COSTELLO Public Policy Analyst Colorado Coalition for
Certificate Production and the Race toward Higher Degree Attainment December 2010
 State Higher Education Executive Officers Certificate Production and the Race toward Higher Degree Attainment December 2010 ----- A report from the State Higher Education Executive Officers utilizing the
In 1992, the US Congress authorized the Moving to Opportunity (MTO) housing voucher
 housing voucher") A Driving Factor in Moving to Opportunity EVELYN BLUMENBERG AND GREGORY PIERCE In 1992, the US Congress authorized the Moving to Opportunity (MTO) housing voucher program to operate in five large metropolitan
A Driving Factor in Moving to Opportunity EVELYN BLUMENBERG AND GREGORY PIERCE In 1992, the US Congress authorized the Moving to Opportunity (MTO) housing voucher program to operate in five large metropolitan
Colorado Community Health Centers. Strengthening Colorado s Health and the Economy
 Colorado Community Health Centers Strengthening Colorado s Health and the Economy Colorado Community Health Centers Employment Impact, 2011 6,025 3,621 2,404 Colorado Community Health Centers Contribute
Financial Plan & Implementation. Matrix
 Financial Plan & Implementation Matrix Revenue Projections and Financial Assumptions 1.0 Context. Background. The development of the financial plan is consistent with requirements regarding the development
Part II: Special Education Revenues and Expenditures
 State Special Education Finance Systems, 1999-2000 Part II: Special Education Revenues and Expenditures Thomas Parrish, Jenifer Harr, Jean Wolman, Jennifer Anthony, Amy Merickel, and Phil Esra March 2004
WAGE REPORTS FOR WORKERS COVERED BY FEDERAL OLD-AGE INSURANCE IN 1937
 WAGE REPORTS FOR WORKERS COVERED BY FEDERAL OLD-AGE INSURANCE IN 937 JOHN J. CORSON* 3 DURING 937 approximately 3 million men and women worked in employment covered by Federal old-age insurance. They received
Lifesavers 2015 J.T. Griffin Chief Government Affairs Officer MADD
 Lifesavers 2015 J.T. Griffin Chief Government Affairs Officer MADD Why All Offender Ignition Interlock Laws? Drunk Driving still accounts for one-third of ALL U.S. traffic fatalities (10,076 in 2013, NHTSA)
Ne w J e r s e y Tr a f f i c Co n g e s t i o n :
 Ne w J e r s e y Tr a f f i c Co n g e s t i o n : A Growing Crisis January 2008 Cover photo : Route 3, Passaic County introduction A rising tide of traffic congestion threatens to increase roadway gridlock,
Philadelphia County. Land Use and Growth Management Profile
 Philadelphia County is located in the southeastern corner of Pennsylvania and is bordered by the Pennsylvania counties of Delaware, Montgomery, and Bucks, and the New Jersey counties of Burlington, Camden,
Strategic Planning for Economic Development. Social and Demographic Profile. April-May, 2012
 Envisioning Mount Hope Strategic Planning for Economic Development Social and Demographic Profile April-May, 2012 Department of Agricultural Economics Kansas State Research and Extension www.ksu-olg.info
How to Create a Successful Vanpool Program
 Rural and Mountain Community Vanpools: A Brochure prepared for the Colorado Department of Transportation By: URBANTRANS C O N S U L T A N T S Skiing, tourism and outdoor recreational opportunities are
Status of State PACE Programs
 F A R M L A N D I N F O R M A T I O N C E N T E R Status of PACE Programs As of May 2013, 27 states have state-level purchase of agricultural conservation easement (PACE) programs. Four states Arizona,
Programs and Funding variety of grant programs listed below.
 Programs and Funding Federal, state and local government are partners in funding public transportation activities, with each contributing a portion of the costs. Relative funding proportions can vary from
REGIONAL QUARTERLY REPORT
 April 2015 1 REGIONAL QUARTERLY REPORT State Personal Income and More... In this report... Fourth-quarter 2014 state personal income statistics, page 1 Acknowledgments, page 3 Annual state personal income
14 Million Millennials Benefit From Pro-Work Tax Credits But 6 Million Will Lose Out if Congress Fails to Save Key Provisions
 820 First Street NE, Suite 510 Washington, DC 20002 Tel: 202-408-1080 Fax: 202-408-1056 center@cbpp.org www.cbpp.org June 15, 2015 14 Million Millennials Benefit From Pro-Work Tax Credits But 6 Million
Youth Employment Transportation Briefs
 Youth Employment Transportation Briefs Brief #3: Federal Funding for Youth Employment-Related Transportation December 2006 Compiled by April Kaplan on behalf of the Community Transportation Association
Janitors in 2000: An Overview of NCS Data
 Janitors in 2000: An Overview of NCS Data by Laura Pfuntner Originally Posted: November 24, 2003 New data reveal that pay for janitors is influenced by the type of work performed and whether the job is
Sources of Health Insurance Coverage in Georgia 2007-2008
 Sources of Health Insurance Coverage in Georgia 2007-2008 Tabulations of the March 2008 Annual Social and Economic Supplement to the Current Population Survey and The 2008 Georgia Population Survey William
COUNTY PROFILE fayette county
 COUNTY PROFILE fayette county population households and housing economy 5 education and poverty 6 transporation 7 data sources 8 prepared by Memphis Area Association of Governments preface The purpose
Chapter 8 Funding Considerations
 Chapter 8 Funding Considerations Expanding transit services into El Dorado Hills under any of the service alternatives has associated operating and capital costs. This chapter considers the funding sources
CAPSTONE ADVISOR: PROFESSOR MARY HANSEN
 STEVEN NWAMKPA GOVERNMENT INTERVENTION IN THE FINANCIAL MARKET: DOES AN INCREASE IN SMALL BUSINESS ADMINISTRATION GUARANTEE LOANS TO SMALL BUSINESSES INCREASE GDP PER CAPITA INCOME? CAPSTONE ADVISOR: PROFESSOR
Overview of the Travel Demand Forecasting Methodology
 Overview of the Travel Demand Forecasting Methodology Prepared by the Central Transportation Planning Staff (CTPS) Authors: Scott A. Peterson, Manager Ian Harrington, Chief Planner March 29, 2008 1 OVERVIEW
Public School Teacher Experience Distribution. Public School Teacher Experience Distribution
 Public School Teacher Experience Distribution Lower Quartile Median Upper Quartile Mode Alabama Percent of Teachers FY Public School Teacher Experience Distribution Lower Quartile Median Upper Quartile
A HAND UP How State Earned Income Tax Credits Help Working Families Escape Poverty in 2004. Summary. By Joseph Llobrera and Bob Zahradnik
 820 First Street, NE, Suite 510, Washington, DC 20002 Tel: 202-408-1080 Fax: 202-408-1056 center@cbpp.org www.cbpp.org May 14, 2004 A HAND UP How State Earned Income Tax Credits Help Working Families Escape
Mandated report: Medicare payment for ambulance services. Zach Gaumer, David Glass, and John Richardson September 6, 2012
 Mandated report: Medicare payment for ambulance services Zach Gaumer, David Glass, and John Richardson September 6, 2012 Mandated report on Medicare payment for ambulance services MedPAC directed to study:
Health Reform Across the States: Increased Insurance Coverage and Federal Spending on the Exchanges and Medicaid
 Health Reform Across the States: Increased Insurance Coverage and Federal Spending on the Exchanges and Medicaid Timely Analysis of Immediate Health Policy Issues March 2011 Matthew Buettgens, John Holahan
CRS Report for Congress
 Order Code RS22501 September 6, 2006 CRS Report for Congress Received through the CRS Web Summary Child Welfare: The Chafee Foster Care Independence Program (CFCIP) Adrienne L. Fernandes Analyst in Social
Demographic and Economic Profile. Mississippi. Updated May 2006
 Demographic and Economic Profile Mississippi Updated May 2006 Metro and Nonmetro Counties in Mississippi Based on the most recent listing of core based statistical areas by the Office of Management and
2. Market Area Background and Demographics Deliverable 1B
 2. Market Area Background and Demographics Deliverable 1B This section evaluates demographic and economic characteristics of the two principal sources of demand in the market area, the resident population
March 2015 Prepared by the Department of Finance & Performance Management. 2013 Regional Peer Review PERFORMANCE MEASURES
 March 2015 Prepared by the Department of Finance & Performance Management 2013 Regional Peer Review PERFORMANCE MEASURES CONTENTS CONTENTS... 1 EXECUTIVE SUMMARY... 2 SNAPSHOT... 4 PEER SELECTION... 5
United States General Accounting Office February 2003 GAO-03-178
 GAO United States General Accounting Office Report to Congressional Requesters February 2003 FORMULA GRANTS 2000 Census Redistributes Federal Funding Among States GAO-03-178 February 2003 FORMULA GRANTS
Real Progress in Food Code Adoption
 Real Progress in Food Code Adoption The Association of Food and Drug Officials (AFDO), under contract to the Food and Drug Administration, is gathering data on the progress of FDA Food Code adoptions by
Evergreen Line Rapid Transit Project Business Case Executive Summary. February 2008. Reviewed by
 Evergreen Line Rapid Transit Project Business Case Executive Summary February 2008 Reviewed by Recommendation and Executive Summary The business case for the Evergreen Line Rapid Transit Project (the Project)
WEAVING IT TOGETHER: A TAPESTRY OF INNOVATIVE FUNDING SOURCES FOR RURAL & INTERCITY TRANSIT
 WEAVING IT TOGETHER: A TAPESTRY OF INNOVATIVE FUNDING SOURCES FOR RURAL & INTERCITY TRANSIT Jana Lynott, AICP Senior Strategic Policy Advisor AARP Public Policy Institute @JanaLynott TRB Rural and Intercity
SUMMARY OF STATE MOTOR-VEHICLE REGISTRATION FEE SCHEDULES 1/
 BASED ON REPORTS OF STATE AUTHORITIES 2/ STATUS AS OF JANUARY 1, 1998 1. AUTOMOBILES 2. SINGLE-UNIT TRUCKS APPROXIMATE FEE FOR APPROXIMATE FEE FOR TYPICAL HEAVY STATE FEE BASIS RANGE 3/ TYPICAL FEE BASIS
Transportation Best Practices for Serving Low Income Residents National Resource Network 311 for Cities
 Transportation Best Practices for Serving Low Income Residents National Resource Network 311 for Cities In August 2015, a city submitted a request for assistance to the National Resource Network s 311
IF THEN SURVEY RESULTS
 IF THEN SURVEY RESULTS BUILDING TOWARDS A REGIONAL VISION Survey Summary April 2013 BACKGROUND In the spring of 2011, the Piedmont Triad undertook an ambitious, 3-year planning effort designed to strengthen
million 0.6 million 7.1 million
 KEY STATS Number of Americans who volunteer mainly with arts groups: 1 million volunteer secondarily with arts groups: 0.6 million provide free artistic services to non-arts groups: 7.1 million Research