How to Find Stocks to Buy (in today s market) Tuesday, July 15 th, 2014s
|
|
|
- Nathan Barrett
- 8 years ago
- Views:
Transcription

1 How to Find Stocks to Buy (in today s market) Tuesday, July 15 th, 2014s Jeff M. Roth Co-founder, SimplerStocks.com 1

2 Table of Contents Intro (1 min) Where to Find Stocks (10 mins) Do we want to buy stocks here (30 mins) Conclusion (5 mins) Q & A (15 mins)
 Conclusion (5 mins) Q & A")
3 How to Get the Most Out of This Class In a nutshell... Kick back and listen. This is a well laid out presentation. You don t have to frantically write down everything. This is being recorded and you will get a copy of all the slides and notes. Sit back and soak it in. There are hundreds of people in this class and I won t have time to answer all of your questions, but I will save time at the end. 3

4 Universe of Stocks 4
5 Where to Find Stocks Dow 30 S&P 500 Nasdaq 100 Russell

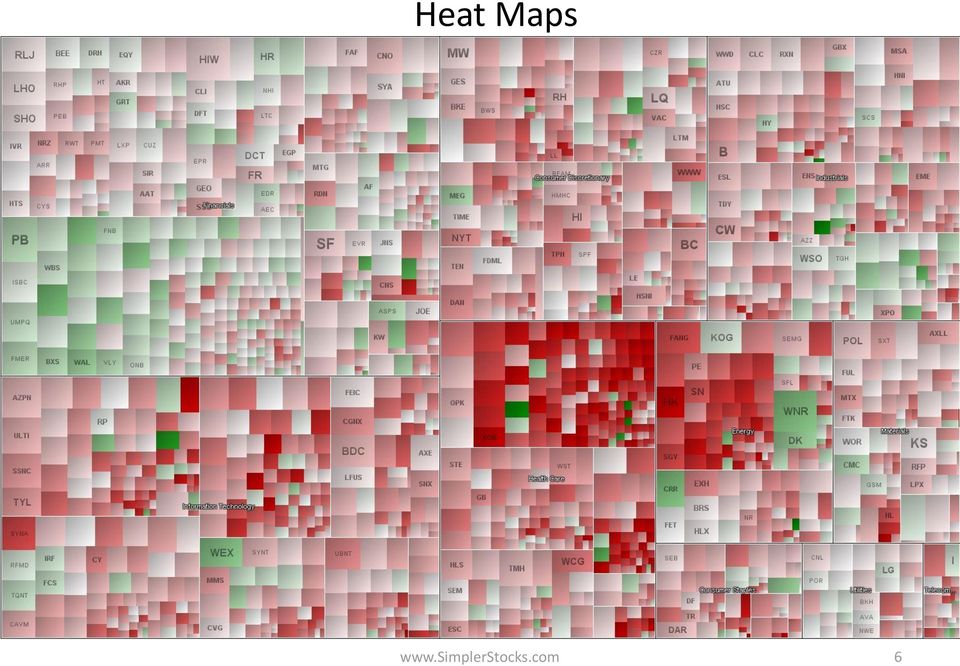
6 Heat Maps 6
7 The Myth of being first You can still capture a move without being in the move first.

8 You don t need to touch all the water 8

9 Take a Step Back The stock market doesn t go up or down forever Looking at the bigger picture tells us where we came from, and where we are in the current market cycle A bull market typically lasts 3-5 years, and a bear market lasts 9 20 months A typical correction is 10-30% with the average correction at 20%

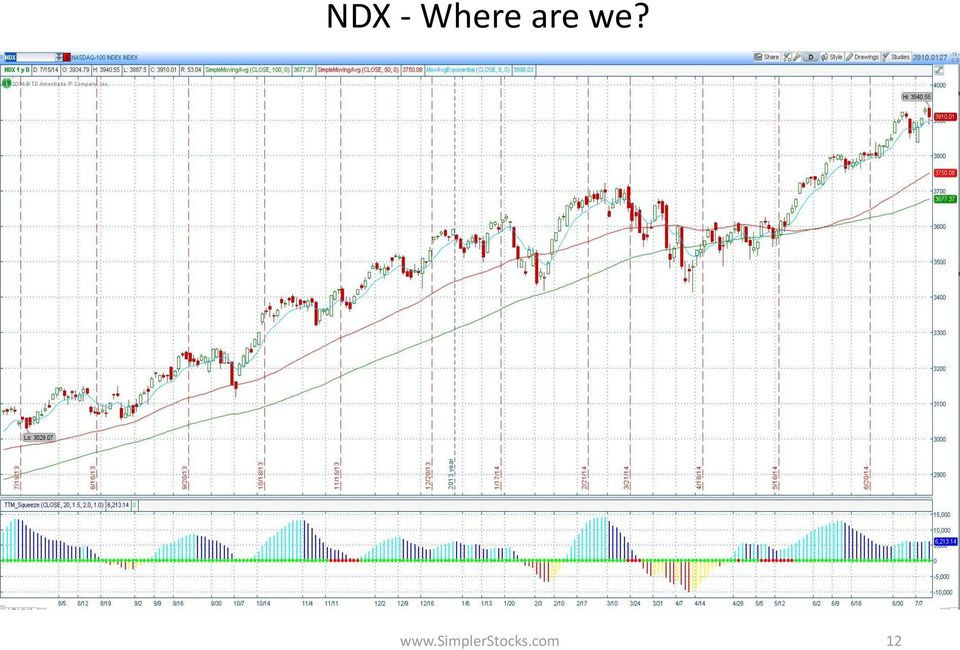
10 Do we want to buy stocks here? 3 steps of analysis 1) Index Analysis 2) Internal Analysis 3) Stock Analysis

11 RUT - Where are we? 11

12 NDX - Where are we? 12
13 Where are we? 13

14 Don t just look on the surface 14

15 The Yen Aussie/Yen is what I like to call the hedge fund index. Funds will borrow currency from one stable country with very low interest rates (Japan), convert that currency (yen) into the currency of another stable country (Australia) with the highest interest rates, and trade. When funds are borrowing more from Japan and buying more Aussie dollars funds are taking a position known as risk on, i.e., buy more speculative assets. When the carry trade unwinds, converting Aussie dollars back to Yen to pay back what they borrowed funds are taking a risk off position, i.e. selling their speculative assets. In short when the Yen is going higher; funds are paying back their Yen debt and taking off risk, i.e., selling stocks. When the Yen is going lower, funds are borrowing more Yen and take more speculative positions, i.e., buying stocks.

16 The Bond Market The 2 nd most liquid market in the world When funds don t want to put their money in the stock market they put into Bonds. Generally, when Bonds go higher that is weighing down stocks and when Bonds go lower stocks are able to go higher much more freely. This is a big picture correlation not day to day (although it can be).

17 $TICK Index The number of stocks trading on an uptick minus the number of stocks trading on a downtick. View the overall market sentiment at a given point in time. By being able to easily see the ratio of "up" stocks to "down" stocks

18 $TICK Index cont d Many believe this is an extremely short term indicators only applicable for a minute or two I do use a 1 minute chart, but I look at the entire day. Looks for extreme readings +/-1000 tick readings are program buys and sells. +/- 800 are strong directional signals and can indicate a change in trend for the day. +/- 600 is choppiness

19 Stock Analysis - picking the right stock at the right time 19

20 Near 18 month highs (Weekly Chart) Why 18 months? There is strong statistical evidence to suggest that stocks need about 18 months to reset i.e. traders that bought at higher prices have been shaken out of the stock. (Trader Psychology)

21 Uptrend & Squeeze (Daily Chart) Uptrend is visual you should be able to see this in 2 seconds John Carter s Squeeze Indicator This is what makes up a squeeze. Bollinger Bands (20 and 2), Keltner Channels (20 and 1.5) and momentum (12 period). We are looking for moments in time on the daily chart when the Bollinger Bands contract inside of the Keltner Channels. This represents a period of time just before a stock is about to explode in price. If at the time the squeeze occurs momentum is above zero, price has a very high probability of going higher, and vice versa.
22 If It was easy everyone would do it instead they do this Sleeping Yankees fan sues ESPN for $10 million 22
23 Time for Questions 23