CHALLENGES OF BIG BROKING HOUSE
|
|
|
- Marianna Dennis
- 8 years ago
- Views:
Transcription
1 CHALLENGES OF BIG BROKING HOUSE FIGHTING THE MOTHER OF ALL SURVIVAL BATTLES Jugal Mantri Anand Rathi Share & Stock Brokers Ltd August,

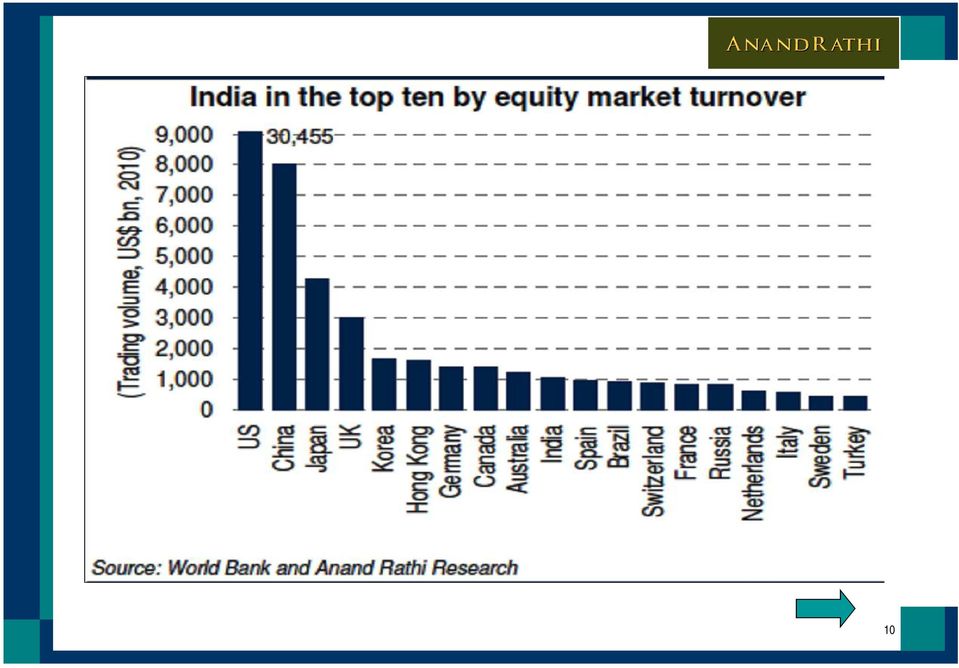
2 Structural Issues Investor Education and Participation Moderate Investor participation See Chart Mindset Issues (erroneous approach/ enter during last leg of bull run) Long-term and portfolio approach missing Missing Tax efficient capital creation opportunity Corporate Education Largest no. of listed companies in the world See Chart 30% active stocks; balance either inactive/ vanished Poor liquidity and impact cost Development of Intellectual Capital India is amongst top10 equity market by market cap See Chart Foreign brokerages are hiring talents at unrealistic levels Poor DIs participation Subdued AUM of MFs/ insurance cos. See Chart Compelled participation in disinvestments Negligible participation by Pensions Funds 2

3 Change in Revenue Mix Decline in cash market volume See Chart Rise in option volume See Chart Introduction of DMA (Direct Market Access) Rise in online trading volume Traders moving to Commodities and Currency See Chart Pressure on Profitability Lower yield See Table Competitive pressure Moderate non-broking/ distribution revenue Higher employee and operating cost Volatility of Earnings Vagaries of Capital Market Poor activity Ratio Operational Issues State-level Stamp Duty Stringent Penal provisions and rising compliance cost Seamless Fund Transfer across India Frivolous Investor Grievances and Criminal Actions Challenges broking houses 3

4 Challenges big broking houses Liquidity and capital management Decline in fresh capital mobilisation Increased borrowing levels See Chart Rising interest cost Need large war chest in volatile time Risk of refinance business Aggressive promoter funding Bigger ticket size, higher concentration risk and higher impact cost Increasing investment requirement Risk Management and Surveillance System to mitigate associated risk Program Trading Computerisation and Automation of operations, processes and compliances Scaling-up of non-broking businesses to diversify revenue stream Dominance of foreign brokerages Global Platform seamless trading Balance Sheet Strength Differential treatment in Disinvestment policy 4

5 Opportunities big broking houses Consolidation Acquisition of brokerages Acquisition of franchisees Upgrade and automate processes Cost control and Zero based budgeting Focus on client and relationship acquisition Diversify and develop as fully integrated player Push X sale Optimum utilisation of resources and Address seasonality Get Ready for bigger leap Improvise processes and invest in automation Recent regulatory changes will create level playing field Larger book, larger network and robust infrastructure will be a big driver Position as serious long term player 5

6 Anand Rathi Thank You Disclaimer In the preparation of the material contained in this document, Anand Rathi Group (ARG), has used information that is publicly available, including information developed in-house. Some of the material used in the document may have been obtained from members/persons other than the ARG and/or its affiliates and which may have been made available to ARG and/or its affiliates. Information gathered & material used in this document is believed to be from reliable sources. ARG however does not warrant the accuracy, reasonableness and/or completeness of any information. For data reference to any third party in this material no such party will assume any liability for the same. ARG and/or any affiliate of ARG does not in any way through this material solicit any offer for purchase, sale or any financial transaction/commodities/products of any financial instrument dealt in this material. All recipients of this material should before dealing and or transacting in any of the products referred to in this material make their own investigation, seek appropriate professional advice. ARG (including its affiliates) and any of its officers directors, personnel and employees, shall not liable for any loss, damage of any nature, including but not limited to direct, indirect, punitive, special, exemplary, consequential, as also any loss of profit in any way arising from the use of this material in any manner. The recipient alone shall be fully responsible/ are liable for any decision taken on the basis of this material. All recipients of this material should before dealing and/or transacting in any of the products referred to in this material make their own investigation, seek appropriate professional advice. The investments discussed in this material may not be suitable for all investors as certain services and investment products are subject to legal restrictions and cannot be offered worldwide on an unrestricted basis. Any person subscribing to or investigating in any product/financial instruments should do so on the basis of and after verifying the terms attached to such product/financial instrument. Financial products and instruments are subject to market risks and yields may fluctuate depending on various factors affecting capital/debt/commodity/real estate markets. Please note that past performance of the financial products and instruments does not necessarily indicate the future prospects and performance thereof. Such past performance mayor may not be sustained in future.

7 Growth % in Demat A/c on Y-o-Y basis Anand Rathi 37% 8% 13% 11% FY 08 FY 09 FY 10 FY 11 Growth % of Demat A/c on Y-o-Y basis (In lacs) Financial Year CDSL NSDL Total Growth % (YOY) % % % % Source CDSL & NSDL

8 8

9 Anand Rathi 9

10 10
11 Anand Rathi Industry Mutual Fund AUM ( Rs in Bn) 795 1,396 1,496 2,319 3,264 5,052 4,188 6,145 5,970 Mar-03 Mar-04 Mar-05 Mar-06 Mar-07 Mar-08 Mar-09 Mar-10 Mar-11 Source AMFI 11

12 Anand Rathi Break-up of Average Daily Market Volume (Billion INR) , Q1 FY10 Q2 FY10 Q3 FY10 Q4 FY10 Q1 FY11 Q2 FY11 Q3 FY11 Q4 FY11 Q1 FY12 Futures Options Cash Intraday Cash Delivery Total Turnover Source BSE & NSE 12

13 Anand Rathi Change of Market Mix as % Market Share 6% 6% 5% 6% 4% 5% 4% 3% 3% 9% 11% 10% 7% 7% 22% 20% 16% 15% 29% 35% 40% 44% 53% 53% 57% 65% 67% 44% 39% 39% 36% 35% 31% 29% 24% 23% Q1 FY10 Q2 FY10 Q3 FY10 Q4 FY10 Q1 FY11 Q2 FY11 Q3 FY11 Q4 FY11 Q1 FY12 Futures % Options% Cash Intraday% Cash Delivery% Source BSE & NSE 13

14 Anand Rathi Avg. Daily Volume - Commodity & Currency (Rs. in Crore) FY FY FY Commodity Currency Source NCDEX, MCX,MCX-SX, NSE-CD 14

15 Increased Market Turnover has not resulted into any revenue increase Anand Rathi Exchange Volume (Rs. In billion) Cash Delivery Cash Intra-day Future Options Total FY 2010 (Cum) 13,236 41,931 91,296 85, ,804 FY 2011 (Cum) 12,831 31,226 98, , ,539 % Growth (y-o-y) -3% -26% 8% 127% 45% FY 2010 Avg Daily FY 2011 Avg Daily ,325 Brokerage Yield (Rs. In crores) Cash Delivery Cash Intra-day Future Options FY 2010 (0.15%) (0.03%) (0.01%) Rs.20 per lot FY 2011 (0.10%) (0.02%) (0.007%) Rs.12 per lot Total FY 2010 (Cum) 1,985 1, ,867 FY 2011 (Cum) 1, ,417 % Growth (y-o-y) -35% -50% -24% 15% -30% Source NSE, BSE and AR Research 15
 Cash Delivery Cash Intra-day Future Options FY 2010 (0.15%) (0.03%) (0.01%) Rs.20 per lot FY 2011 (0.10%) (0.02%) (0.007%) Rs.")
16 Gearing levels increased Anand Rathi
