T-103 John Hatley Laker Marine Business Case for LNG Fuel
|
|
|
- Brandon Hawkins
- 8 years ago
- Views:
Transcription
1 T-103 John Hatley Laker Marine Business Case for LNG Fuel

2 2 Wärtsilä Laker Marine Business Case for LNG Fuel MARITEC Hilton 8 May 2014 Niagara Falls, Ontario John Hatley PE LNG Initiatives ( MBA, MSE ) Americas VP Ship Power Wartsila North America, Inc. Cell john.hatley@wartsila.com

3 Agenda What? Why? How? Application Conclusions Competitive Forces Emission Areas Expansion Owner Choices? 5 Drivers Set Investment Clock Gas Technical Viability Integrated Gas Solutions Risk Mitigation Business Case Jones Act Great Laker Cargo, Owner, Banker Views Recent Market Signals The Future Decade for Gas Appendix Data

4 Agenda What? Why? How? Application Conclusions Competitive Forces Emission Areas Expansion Owner Choices? 5 Drivers Set Investment Clock Gas Technical Viability Integrated Gas Solutions Risk Mitigation Business Case Jones Act Great Laker Cargo, Owner, Banker Views Recent Market Signals The Future Decade for Gas Appendix Data


5 Competition Model Forces SHALE GALE Porter s 5 Forces + 1 Government Legislation exercises market influence emissions Government Legislation: Political power exercising market influence: Trade Behavior, Emissions

6 Major Global Shale Basins Source: 6 Wärtsilä

7 Global Gas Production USA is world s #1 gas producer US Shale gas production, by itself, exceeds all nations except Russia Source: LNG for Marine Transportation USA, Houston TX, June 12, 2013; David Sweet President Natural Gas Roundtable 7 Wärtsilä


8 Emission Control Areas More Emission Control Areas ECA likely soon 8 Wärtsilä

9 ECA Vessel Owner Choices 1. Consume compliant Ultra Low Sulfur Distillate expensive champagne fuel 2. Switch to alternative fuel: safe, clean, abundant, affordable, & available natural gas as LNG 3. Alternative Compliance install new technology scrubber CAPEX, OPEX, space, weight, complexity, & operational tradeoffs 4. Abort the Port ECA and SECA mandates force timely choices options 1,4 invoke business reset LNG OPEX Savings 9 Wärtsilä

10 Agenda What? Why? How? Application Conclusions Competitive Forces Emission Areas Expansion Owner Choices? 5 Drivers Set Investment Clock Gas Technical Viability Integrated Gas Solutions Risk Mitigation Business Case Jones Act Great Laker Cargo, Owner, Banker Views Recent Market Signals The Future Decade for Gas Appendix Data

11 Americas Gas Drivers 2 Shale Gas Phenomena: Availability + Affordability 3 US EPA Mandates: Fuel Sulfur content reductions + Geographic bubble Emissions Control Area + Stringent Engine emissions Tier 2,3,4

12 Shale Gas Plays Shale. huge reserves natural gas; nearly century supply

13 Abundant Gas Supply 13 Wärtsilä Paradigm shift to shale gas; now 25% of supply... half


14 Annual Shale Gas Production Other US Bakken ND Eagle Ford TX Marcellus PA Haynesville LA 24% CAGR Woodford OK Fayetteville AR Barnett TX Antrim MI, IN 41% CAGR 17% CAGR Shale production surge 2006 frantic 2010 strong


15 Key: Fuel Prices on Energy Basis $ / mmbtu cst HFO 1% MGO 0.1% diesel LNG Japan LNG Europe LNG USA Fuel price dominates vessel OPEX gas is competitive priced & cleanest in Americas 15 Wärtsilä

16 Emission Control Area ECA US & Canada Puerto Rico US Virgin Islands 2014 ECA bubble encapsulates any flag ships nautical miles low sulfur fuel (equivalence) enforceable August May 2014 Source: US EPA, Designation of North American Emission Control Area to Reduce Emissions from Ships

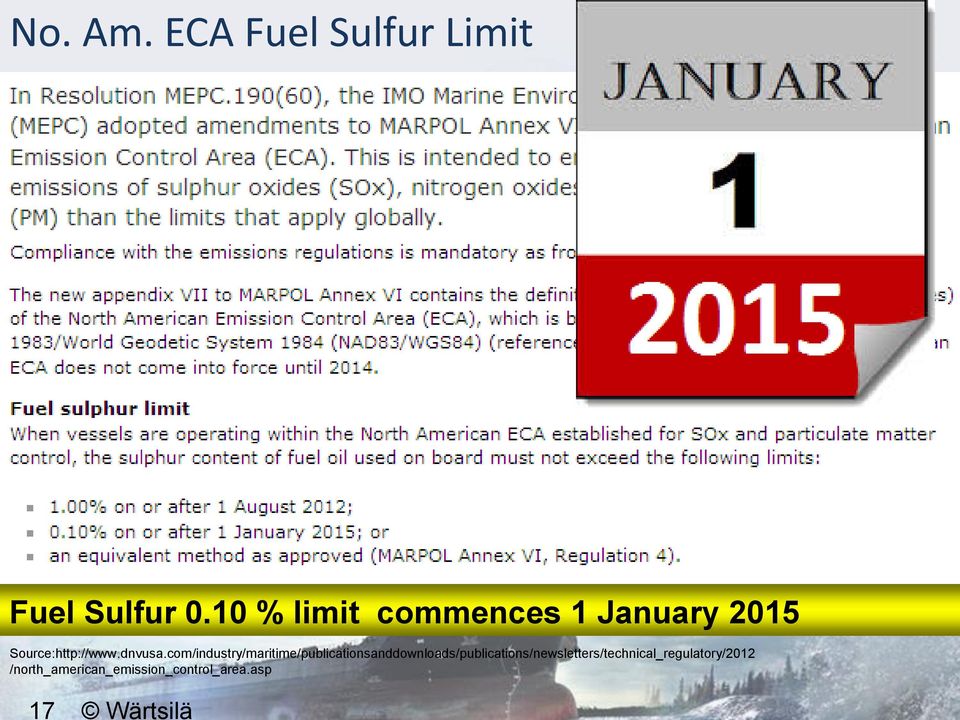
17 No. Am. ECA Fuel Sulfur Limit 17 Wärtsilä Fuel Sulfur 0.10 % limit commences 1 January 2015 Source: /north_american_emission_control_area.asp

18 5 US Game Changers EPA Engine Emissions US centuries shale gas supply Emissions Control Area 2012 Natural Gas bargain EPA Fuel Standards 5 gas drivers shale supply + bargain prices + 3 EPA mandates = set Investment Clock Source: EIA March 2010 Shale Gas Plays Lower 48 States

19 Agenda What? Why? How? Application Conclusions Competitive Forces Emission Areas Expansion Owner Choices? 5 Drivers Set Investment Clock Gas Technical Viability Integrated Gas Solutions Risk Mitigation Business Case Jones Act Great Laker Cargo, Owner, Banker Views Recent Market Signals The Future Decade for Gas Appendix Data

20 Packaged Gas Solution 1. Fueling Station 2. Gas Storage 1 3. Evaporators 4 4. Gas valve unit enclosure Dual-Fuel Main engine 6. Dual-Fuel Aux engines 5 3 Wartsila proven complete LNG system minimizes installation & operational risk = assured performance reduces risk for yard, owner, & banker extends value proposition to end customer 20 Wärtsilä 10 May 2014

21 Harvey Gulf 6 US Flag LNG Vessels Source: STX US Marine Design Source: STX US Marine Design World s first LNG boats for US GOM based on European proven decade of experience Wartsila LNGpac kit reduces risk 10/05/2014
22 Dual-Fuel Natural Gas Engines 20DF 6L20DF 1.0 MW 8L20DF 9L20DF 34DF 6L34DF 50DF 9L34DF 12V34DF 16V34DF 20V34DF 6L50DF 8L50DF 9L50DF 12V50DF 16V50DF Gas engine power range target emissions sensitive ECA coast and port area vessels 18V50DF MW
23 4 Key Risks 23 Wärtsilä Gas Engine Technology does it work? proven leading edge not bleeding edge LNG Supply Security.. must have fuel! operational certainty LNG Price Volatility. justifiable investment? enduring savings benefits Shipyard Construction... cost over-runs? LNG learning curve Seeking Competitive Advantage with Gas fuel
24 25 Years Experience Wärtsilä gas engines GD = Gas Diesel engine SG = Spark Ignited Gas engine W20V34SG W34DF W20DF DF = Dual Fuel engine W50DF W180SG W220SG W32DF W28SG W34SG W46GD W25SG W32GD Gas engines time tested, real, & here now
25 Risk LNG Supply Security Backstop 25 Wärtsilä Early stages LNG supply Many first movers Local Distribution Companies Oil & Gas Majors 18 March 2014 ABS Guide Provides guidance toward LNG Supply Sources Vessel owner assurance some suppliers guarantee LNG delivery or they will provide EPA compliant low sulfur diesel during transition at agreed LNG pricing no $ loss to owner!
26 Risk LNG Price Volatility Energy Information Agency EIA forecasts prices receding = gas bargain
27 27 Wärtsilä Risk Shipyard Construction transfer how to knowledge Reduced technical risk Total solution from 1 provider Peace of mind & fast track Wartsila on site PM
28 Agenda What? Why? How? Application Conclusions Competitive Forces Emission Areas Expansion Owner Choices? 5 Drivers Set Investment Clock Gas Technical Viability Integrated Gas Solutions Risk Mitigation Business Case Jones Act Great Laker Cargo, Owner, Banker Views Recent Market Signals The Future Decade for Gas Appendix Data
29 29 Wärtsilä Candidate: Great Lakes Self Unloader 304m LOA Ship appraisal value $50 Million USD for protected Jones Act US Trades
30 Vessel Characteristics Units 30 Wärtsilä Item Abbreviation EU US Length Overall LOA m 1000 ft Beam B 32.0 m 105 ft Depth D 17.1 m 56 ft Design Draft T 8.4 m 27.5 ft Service Speed S 14 kts 14 kts Cargo Capacity 80,900 tonnes 80, Propulsion Power 10,738 kw 14,400 HP Number Shafts twin twin twin Prop diameter 5.3 m 17.5 ft Prop speed rpm 120 Prop type FPP FPP FPP Bow Thruster 1,200 kw 1,609 HP Stern Thruster 1,200 kw 1,609 HP Hold Loop Belt Drive 1,500 kw 2,012 HP Boom belt drive 860 kw 1,153 HP Ballast pumps 480 kw 644 HP Ships service power 470 kw 630 HP Vessel worthy of midlife upgrade owner seeking OPEX savings and emissions compliance.
31 Great Lakes Cargo Trades 31 Wärtsilä
32 Great Lakes Cargo Summary Iron ore, coal, limestone, cement = 98% of Lake traffic. Coal is used by both steel industry and utilities. Industries Served Cargo Contract Term Limestone is used by steel and construction industries. 80% of annual cargo volume moves under Long Term Contracts > 3 years. Long term cargo contracts bring stability, imposes barriers to new entries, and encourages firm consolidation. Sources: Lake Carriers Association, US Flag Dry Bulk Cargo Carriage on Great Lakes: December USDOT Maritime Administration, Industry Survey Series: Great Lakes Operators 2005, page 3,5. 32 Wärtsilä 10 May 2014 GREAT LAKES & CANADA / John
33 Voyage Cycle Profile Taconite Trade assume average duty cycle load 7,055 kw 250 days / year ( 6,000 hr / year ) 44 Round Trips fuel 9,011 metric tons/ year average ~ 36 tons/day consumption Wärtsilä May 2014
34 4 Stakeholders At fair return capturing risks SHIP OWNER Ultimate Environment Safety PUBLIC CARGO OWNER Transport safely at optimal cost 34 Wärtsilä BANKER Are risks understood & I m repaid!
35 Banker you will pay me back timely! Bankers expect the least return and demand the most restrictive terms: security + reporting Equity expects the most return and demands the least terms. AP Giannini Founder Bank of America. Source: 35 Wärtsilä
36 Recall? 36 Wärtsilä
37 Cargo Owner Transport safely at optimal cost 37 Wärtsilä Strong cargo unit savings for vessels running on LNG fuel
38 Cargo Owner Transport safely at optimal cost 38 Wärtsilä LNG fuel choice brings millions transport savings $2.6 to $5.1 million over five years per vessel times num ships?
39 ROCE Investment Criteria Return on Capital Employed (Return on Invested Capital, ROIC ) reflects the company fundamental earning power as it removes the distorting effects of leverage inherent with Return on Equity (ROE). ROCE: reflects the company fundamental earning power. Shipping companies often target ~ 11% ROCE Source: Robert Higgens, Analysis for Financial Management, 10 th Edition, pg Wärtsilä
40 Ship Owner A fair return capturing risks Competitive Advantage LNG adjusted hurdle rate is appealing & yet preserves cargo owner savings. 40 Wärtsilä

41 Ship Owner A fair return capturing risks Millions $25 $20 EBITDA $15 LNG Fuel $10 $5 $0 LNG fuel has strongest EBITDA + $3.3 Million over HFO+ Scrubber and + $4.7 Million atop MDO. 41 Wärtsilä HFO + Scrubber MDO Fuel Years

42 Stress Test BASELINE LNG Revenue $21.03 M CAPEX $68.6 M Bank Interest 5.65% LNG Price 650 $/mt ROE 19.50% Sensitivity Rank Revenue CAPEX LNG Price Bank Interest Rate ROE Stress test provides key perspectives on relative impacts to investment returns. 42 Wärtsilä Deviation
43 43 Wärtsilä Banker Metrics EBIT EBITDA Times Burden Covered Times Interest Covered Breakeven Competitiveness Character, Capacity, Capital, Economic Conditions, Collateral Photo: AP Giannini Founder Bank of America. Source:
44 Banker Are risks understood & I m repaid! 44 Wärtsilä Loan cover is strongest on LNG choice over all other alternative fuels.
45 Warren Buffett Great Investor 45 Wärtsilä EBITDA as equivalent to earnings for a company is tantamount to the Egyptian Pyramids: forever state of the art with never a need to be replaced, improved or refurbished
 Years LNG fuel has strongest EBIT")
46 46 Wärtsilä Banker Are risks understood & I m repaid! Millions $20 $15 $10 $5 HFO + Scrubber EBIT LNG Fuel $0 MDO Fuel ( $5 ) Years LNG fuel has strongest EBIT Depreciation 10 Year MACRS ½ Year Convention Dry-dockings years 5,10,15,20
47 Agenda What? Why? How? Application Conclusions Competitive Forces Emission Areas Expansion Owner Choices? 5 Drivers Set Investment Clock Gas Technical Viability Integrated Gas Solutions Risk Mitigation Business Case Jones Act Great Laker Cargo, Owner, Banker Views Recent Market Signals The Future Decade for Gas Appendix Data
48 7 January 2014 LNG Fuel SCORECARD 17 Ferries 12 Tankers & Bulkers 6 Offshore Vessels 6 Container Ships 1 Articulated Tug Barge North America s marine LNG fuel launch eclipses Europe! Source: 48 Wärtsilä

49 18 February Vessels total 94mW = North America s largest LNG conversion undertaken! 49 Wärtsilä Source:

50 24 February Wärtsilä MARAD Title 11 Mortgage Loan Guarantee program expands economic criteria to include environmental technology LNG fuel! Title 11: US Government Loan Guarantee term 25 years, 12.5% equity provides Ship Owners US Treasury Borrowing Rates + premium
51 Drivers = Decade Shift to Gas 10 May 2014 Mandated Emissions & Fuel Restrictions Geographic emissions bubble encapsulates US/Canada Tight sulfur limits stress supply After treatment burdens diesels Source: US EPA web sites, Hatley capture various sources Paradigm shift to gas 1 st on economics 2 nd on emissions Early adopters moving ahead soon early followers! 2015 Fuel Sulfur 1/10% = Stress Mid decade market tipping point
52 2 nd Blind Mouse Any new Americas ECA project Consider at least gas ready option if not LNG fuel now! With Gas Ready, then in minimal time & minimal cost; convert to gas fuel to capture a future business opportunity Remember the value of a business option
53 53 Wärtsilä APPENDIX Business Case Details
54 Financials 54 Wärtsilä
55 Key Values 55 Wärtsilä / mm BTU / mt / mm BTU / mt / mm BTU / mt

56 1 April 2014 Fuel Prices 56 Wärtsilä Source: Recent Prices: LS380 1% 699 $/mt LSMGO 0.1% 990 $/mt
57 Key Values 57 Wärtsilä
58 EBIT 58 Wärtsilä

59 EBITDA 59 Wärtsilä
60 The Pyramids 60 Wärtsilä EBITDA may overstate available cash flow when used carefully and fully understood it may indicate what is available to pay bank debt and shareholders. Often viewed as one of many economic indicators of company performance by financiers/investors/bankers.
61 61 Wärtsilä Fuel Attributes When fuels vary significantly, the historic dollars per ton or gallon is challenging to use because different fuels host widely varying different energy content, density, value...
62 62 Wärtsilä WHY? WHY IS RAIL GOING GAS?
63 6 Sept 2013 AAR Bob Fronczak, huge environmental & economic benefits associated with going to LNG estimated 25K Locomotives each captures annual savings $200,000 = $5 Billion Potential 63 Wärtsilä
64 CN Natural Gas Locomotives 64 Wärtsilä Billions in potential annual fuel savings drives rail progress on LNG tender development for loco power units parallel technology may migrate into Marine ATB! Source:
65 Agenda What? Why? How? Application Conclusions Competitive Forces Emission Areas Expansion Owner Choices? 5 Drivers Set Investment Clock Gas Technical Viability Integrated Gas Solutions Risk Mitigation Business Case Jones Act Great Laker Cargo, Owner, Banker Views Recent Market Signals The Future Decade for Gas Appendix Data